

Abstract
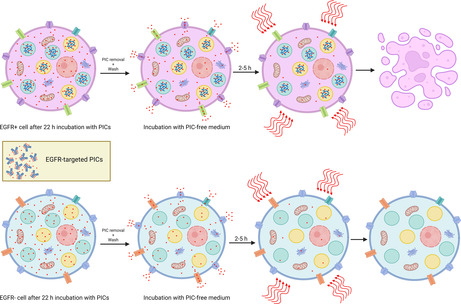
Tumor‐targeted, activatable photoimmunotherapy (taPIT) has been shown to selectively destroy tumor in a metastatic mouse model. However, the photoimmunoconjugate (PIC) used for taPIT includes a small fraction of non‐covalently associated (free) benzoporphyrin derivative (BPD), which leads to non‐specific killing in vitro. Here, we report a new treatment protocol for patient‐derived primary tumor cell cultures ultrasensitive to BPD photodynamic therapy (BPD‐PDT). Based on free BPD efflux dynamics, the updated in vitro taPIT protocol precludes non‐specific BPD‐PDT by silencing the effect of free BPD. Following incubation with PIC, incubating cells with PIC‐free medium allows time for expulsion of free BPD whereas BPD covalently bound to PIC fragments is retained. Administration of the light dose after the intracellular free BPD drops below the threshold for inducing cell death helps to mitigate non‐specific damage. In this study, we tested two primary ovarian tumor cell lines that are intrinsically chemoresistant, yet ultrasensitive to BPD‐PDT such that small amounts of free BPD (a few percent of the total BPD dose) lead to potent induction of cell death upon irradiation. The modifications in the protocol suggested here improve in vitro taPIT experiments that lack in vivo mechanisms of free BPD clearance (i.e., lymph and blood flow).
Using patient‐derived primary cancer cell models and conventional cell lines with varying levels of epidermal growth factor receptor (EGFR) expression, the protocol for performing tumor‐targeted, activatable photoimmunotherapy (taPIT) has been refined to avoid non‐specific cell death in vitro. This protocol exploits the slow uptake and long retention of proteolyzed photoimmunoconjugate (PIC) fragments versus the relatively fast free photosensitizer efflux dynamics in cells.
Abbreviations
- ABCG2
ATP‐binding cassette super‐family G member 2
- AF
alexa fluor™
- ALA
aminolevulinic acid
- APC
allophycocyanin
- ATCC
American Type Culture Collection
- ATP
adenosine triphosphate
- BCA
bicinchoninic acid
- BPD
benzoporphyrin derivative monoacid ring A
- Ce6
chlorin e6
- c‐MET
cellular‐mesenchymal‐epithelial transition factor
- CSV
comma‐separated values
- CXCR4
CXC chemokine receptor type 4
- DMEM
Dulbecco's Modified Eagle Medium
- DMSO
dimethyl sulfoxide
- DPBS
Dulbecco's Phosphate‐Buffered Saline
- EGFR
epidermal growth factor receptor
- EpCAM
epithelial cell adhesion molecule
- FOLR1
folate receptor 1 or Folate receptor alpha
- HGFR
hepatocyte growth factor receptor
- HGSOC
high‐grade serous ovarian cancer
- HPIX
hematoporphyrin IX
- HPPH
2‐(1‐Hexyloxyethyl)‐2‐devinyl pyropheophorbide‐a
- IC50
half‐maximal inhibitory concentration
- LED
light‐emitting diode
- MPPa
pyropheophorbide‐a methyl ester
- MRP1/2
multidrug resistance‐associated protein 1/2
- m‐THPC
meso‐tetra‐hydroxyphenyl‐chlorin
- m‐THPP
meso‐tetra‐hydroxyphenyl‐porphyrin
- MW
molecular weight
- MWCO
molecular weight cut‐off
- NCI
National Cancer Institute
- NHS
N‐Hydroxysuccinimide
- NMWL
nominal molecular weight limit
- PBS
phosphate‐buffered saline
- PDMR
patient‐derived models repository
- PDT
photodynamic therapy
- PE
R‐phycoerythrin
- PEG
polyethylene glycol
- P‐gp
P‐glycoprotein
- PIC
photoimmunoconjugate
- PIT
photoimmunotherapy
- PMT
photomultiplier tube
- PPIX
protoporphyrin IX
- PS
photosensitizer
- RETM
Renaissance Essential Tumor Medium
- RPMI
Roswell Park Memorial Institute
- taPIT
tumor‐targeted, activatable photoimmunotherapy
- UV‐Vis
ultraviolet‐visible
INTRODUCTION
Immortalized cell lines continue to be oft‐used in cancer research due to the ease of culturing these cells, their low cost, and commercial availability. However, it is now well‐appreciated that patient‐derived primary cell cultures better preserve the heterogeneity and pathophysiology of original cancers, while immortalized cell lines do not always predict the behavior of real cancers. 1 , 2 , 3 Tumor‐targeted, activatable photoimmunotherapy (taPIT) is a highly selective type of photoimmunotherapy (PIT) that uses molecular‐targeted, cell‐activatable antibody‐quenched photosensitizer (PS) conjugates where the PS becomes dequenched upon cancer cell binding, internalization, and lysosomal proteolysis. 4 In this design, the PS is not cleavable and remains covalently attached to antibody fragments after lysosomal proteolysis and dequenching. The photoimmunoconjugate (PIC) that has been used for taPIT so far consists of an FDA‐approved anti‐EGFR therapeutic agent (cetuximab) and an FDA‐approved photodynamic therapy agent (verteporfin; benzoporphyrin derivative monoacid ring A, BPD). The major advantage of this treatment approach is its ability to significantly reduce off‐target toxicity, especially bowel toxicity. 4 However, due to the presence of a small fraction of non‐covalently associated (free) BPD in PIC, 5 we still observe non‐specific killing in taPIT experiments in vitro without intricate washing steps and sufficient time for free BPD cellular efflux. Moreover, the basic taPIT protocol optimized for immortalized cell lines does not always work effectively for patient‐derived primary cell lines, especially when the cells are highly sensitive to free BPD.
Here, we present a modified protocol that allows the performance of taPIT experiments that avoid non‐specific cell death in vitro. This protocol exploits the slow uptake and long retention of proteolyzed PIC fragments versus the relatively fast free BPD efflux dynamics in cells. After the removal of PIC from the dish and before administering the light dose, we can incubate cells with PIC‐free medium until the intracellular free BPD concentration drops below the threshold for inducing cell death. By performing taPIT experiments using conventional and modified protocols, we show that the time delay between PIC removal and light administration is important to ensure that the free BPD is not killing the cells non‐specifically. We find that 2 h of incubation after PIC removal is often enough to avoid non‐specific effects, but when the cells are extremely sensitive to free BPD (e.g., the primary cell lines used in this study), the incubation time should be extended, and the concentration of PIC should be lowered as well.
Primary cell lines as tumor models have important advantages such as preservation of the characteristic crosstalk between healthy and cancerous cells, as well as the influence of cytokines and other cell signaling molecules. 1 , 6 Moreover, primary cell lines preserve the stem‐like phenotype of tumor cells, which is useful for exploring drug resistance mechanisms. 6 However, the use of primary cultures in research is inconvenient due to the finite lifespan and limited growth potential of primary cells. 6 There have been several attempts to overcome this limitation; for example, Cellaria Inc. developed new methods for primary cancer cell cultures derived from patient tumors that maintain the original, patient‐specific genotype 7 through numerous passages. Based on extracellular matrix reconstitution and tissue‐specific primary cell media, Janik et al. 8 have proposed a protocol that allows epithelial primary cancer cells to grow for up to eight passages. The National Cancer Institute (NCI) has established a repository of patient‐derived primary models. It has been mentioned that the tumor culture cells available in the NCI repository (NCI PDMR) grow for at least 20 passages beyond the distribution passage when cultured on Matrigel‐coated surface in the recommended media.
Here, we investigated taPIT, a form of photodynamic therapy (PDT) in primary cultures of high‐grade serous ovarian cancer (HGSOC) cells from patients. PDT is a treatment modality that utilizes light of a specific wavelength to activate photosensitizers (PSs) and imparts cytotoxicity by generating reactive molecular species. 9 , 10 PIT is a targeted variant of PDT that uses antibody–PS conjugates for tumor‐targeted delivery of PSs. 5 , 11 , 12 , 13 , 14 , 15 , 16 , 17 , 18 , 19 PIT is in clinical trials for cancer treatment; for instance, PIT using cetuximab (an anti‐EGFR antibody) conjugated with IR700 is in a phase III clinical trial for treating head and neck cancer (NCT03769506). Photodynamic agents have shown potential to synergize with traditional therapies, such as radiotherapy, 20 , 21 chemotherapy, 22 , 23 , 24 and immunotherapy. 25 , 26 Conjugating antibodies with the desired number of BPD and obtaining an adequate level of purity is not straightforward due to the hydrophobicity and lipophilicity of BPD. 5 Most hydrophobic molecules have a tendency to self‐aggregate and bind non‐specifically and non‐covalently to hydrophobic pockets of antibody proteins as a result of van der Waal‐type interactions. 27 , 28 We use an optimized method for producing stable high‐purity PICs (>95% purity). 5 This level of purity may be acceptable for in vivo and clinical use, as shown by in vivo efficacy and safety testing. 4 However, due to the significantly higher potency of free BPD as compared with PIC, 18 even a small fraction of non‐covalently associated BPD can have noticeable non‐specific effects in vitro if the experimental protocol is not designed carefully. When attempting to expand taPIT to target patient‐derived chemoresistant and heterogenous cancer cell lines, the free BPD turns out to be one of the main challenges. The updated taPIT protocol presented here addresses this challenge.
This protocol not only avoids non‐specific killing of antigen‐negative cells but also precludes the chances of reporting an overestimated potency of taPIT for antigen‐positive cells in vitro. In addition to presenting how the small fraction of free BPD content in PIC can have undesired effects on taPIT experiments in vitro and suggesting ways to avoid those effects, we show that PDT can kill the patient‐derived primary HGSOC cells effectively irrespective of their intrinsic chemoresistance. Furthermore, we examine how the cell membrane protein expression profiles of primary HGSOC cell lines differ from those of an immortalized HGSOC cell line, including relative EGFR expression (the target for taPIT), based on flow cytometry results.
MATERIALS AND METHODS
Cell lines
Human primary HGSOC cell lines, Powder and Cage, were obtained from Cellaria Inc. (Wakefield, MA). Human epithelial ovarian cancer cell line NIH:OVCAR‐3 (OVCAR3), mouse embryo fibroblast cell line NIH/3T3, a subclone from Chinese hamster ovary cell line CHO‐K1, and human epithelial epidermoid carcinoma cell line A‐431 were purchased from American Type Culture Collection (ATCC; HTB‐161™, CRL‐1658™, CCL‐61™, and CRL‐1555™, respectively). Human NIH:OVCAR5 cell line was purchased from Fox Chase Cancer Center (Philadelphia, PA). Powder and Cage cell lines were cultured in Renaissance Essential Tumor Medium (RETM; RETM Basal Medium + RETM Supplement; Cellaria, CM‐0001) supplemented with 6.3% heat‐inactivated premium grade FBS (R&D Systems, S11150H), 25 ng/mL cholera toxin (Millipore Sigma, 227036‐1MG), and 1% penicillin/streptomycin (Gibco™, 15‐140‐122) in an incubator chamber (STEMCELL Technologies, 27310) filled with hypoxic gas (5% O2 and 5% CO2; Airgas, X03NI90C2001053) at 37°C as recommended by Cellaria. The OVCAR3 cell line was maintained in RPMI 1640 Medium (Gibco™, 61‐870‐127) supplemented with 20% premium grade FBS (R&D Systems, S11150), 1% penicillin/streptomycin (Gibco™, 15‐140‐122) and 0.01 mg/mL bovine insulin (Sigma‐Aldrich, I0516). A‐431 and 3T3 cell lines were maintained in DMEM, high glucose (Gibco™, 11‐965‐092) supplemented with 10% premium grade FBS (R&D Systems, S11150), 1% penicillin/streptomycin (Gibco™, 15‐140‐122) and 1 mM sodium pyruvate (Gibco™, 11‐360‐070). The OVCAR5 cell line was maintained in RPMI 1640 Medium (Gibco™, 61‐870‐127) supplemented with 10% premium grade FBS (R&D Systems, S11150), and 1% penicillin/streptomycin (Gibco™, 15‐140‐122). The CHO‐K1 cell line was maintained in F‐12 K Medium (ATCC, 30–2004) supplemented with 10% premium grade FBS (R&D Systems, S11150), and 1% penicillin/streptomycin (Gibco™, 15‐140‐122). All immortalized cell lines were cultured in a humidified incubator at 5% CO2 and 37°C.
Antibodies and antibody–fluorophore conjugates
Cetuximab (Erbitux®) was purchased from Eli Lilly and Co., Indianapolis, IN, USA. Anti‐EpCAM antibody was purchased from Bio X Cell (BE0386). Research grade cetuximab biosimilar conjugated with AF488 (anti‐EGFR–AF488), anti‐folate receptor alpha antibody conjugated with PE (anti‐FOLR1–PE), anti‐CXCR4 antibody conjugated with AF647 (anti‐CXCR4–AF647), and anti‐HGFR/c‐MET antibody conjugated with AF700 (anti‐c‐MET–AF700) were purchased from R&D Systems (FAB9577G‐100, FAB5646P, FAB172R‐100UG, and FAB3582N, respectively). Anti‐CD133 antibody conjugated with PE‐Vio® 770 (anti‐CD133–PE‐Vio770), and anti‐EpCAM antibody conjugated with APC‐Vio® 770 (anti‐EpCAM–APC‐Vio770) were purchased from Miltenyi Biotec Inc. (130‐113‐749, and 130‐111‐119, respectively). Cet–AF647 and anti‐EpCAM–AF647 were prepared by conjugating cetuximab (cet) and anti‐EpCAM antibodies with AF647 NHS Ester using Alexa Fluor™ 647 Antibody Labeling Kit (Invitrogen™, A20186) according to the manufacturer's protocol. Briefly, the antibody solution was diluted to have 100 μg antibody in 90 μL buffer (PBS). 10 μL of 1 M sodium bicarbonate buffer was added to the antibody solution so that the final concentration of sodium bicarbonate and antibody became 0.1 M and 1 mg/mL, respectively. 100 μL (100 μg) of antibody solution with a slightly basic pH was transferred to the vial containing reactive dye, and the dye was fully dissolved by gently pipetting up and down. The antibody‐dye solution was incubated for 60 min at room temperature in the dark; the reactants were mixed every 10 min by gently pipetting up and down during the incubation period. Unbound dye from the dye‐conjugated antibody was removed using the spin column and purification resin provided with the antibody labeling kit. The concentration of antibody in the purified antibody‐dye solution was calculated using the absorbance measurements at 280 nm and 650 nm; NanoDrop™ 2000 spectrophotometer (Thermo Scientific™, ND‐2000) was used for measuring the absorbance.
PIC synthesis
EGFR‐targeted photoimmunoconjugates (PICs) were synthesized using a previously established procedure 4 , 5 with the anti‐EGFR antibody cetuximab (Erbitux®, Eli Lilly and Co., Indianapolis, IN, USA). Briefly, 2 mL of the antibody was reacted with 0.2 mL of 4 mg/mL Methoxy PEG Succinimidyl Carbonate (MW 10000) (JenKem Technology, Plano, TX, USA), dissolved in DMSO, overnight under continuous stirring. NHS derivative of BPD, dissolved in DMSO, was then added (at 9 times molar excess) to the PEGylated antibody and the reaction mix was stirred for 4 h at room temperature under continuous stirring. The DMSO content in the reaction mix was maintained at 40% and all DMSO additions were performed dropwise to minimize protein denaturation. Following the 4 h incubation, the reaction mix was centrifuged at 15,000 × g and the soluble antibody‐containing supernatant was passed through a Zeba™ Spin Desalting Column (7 K MWCO, 10 mL) (ThermoFisher Scientific, Waltham, MA, USA) pre‐equilibrated with 30% DMSO. The eluent was then subjected to buffer exchange using a 30 kDa NMWL Amicon® Ultra‐15 Centrifugal Filter Unit (MilliporeSigma, Burlington, MA, USA) to reduce the DMSO content to 5%. The final product was concentrated and stored at 4°C till further use. The protein and dye concentrations were estimated using a Pierce™ BCA Protein Assay Kit (ThermoFisher Scientific, Waltham, MA, USA) and UV–Vis spectrophotometry, respectively.
Flow cytometry
To examine cell surface EGFR, FOLR1, CD133, CXCR4, c‐MET, and EpCAM expressions in Powder, Cage, and OVCAR3 cell lines, live cells were stained with anti‐EGFR–AF488, anti‐FOLR1–PE, anti‐CD133–PE‐Vio770, anti‐CXCR4–AF647, anti‐c‐MET–AF700, and anti‐EpCAM–APC‐Vio770 in 1.5 mL microcentrifuge tubes, and the fluorescence was measured using a flow cytometer. Cells were incubated with each antibody–fluorophore conjugate separately as well as all six antibody–fluorophore conjugates together at dilutions recommended by manufacturers. Following 15 min of incubation at 37°C, cells were pelleted by centrifugation (500 RCF), the supernatant containing unbound antibody–fluorophore conjugates was removed, and the cell pellet was resuspended in PBS to wash away antibody–fluorophore conjugates adsorbing non‐specifically on the cell surface. Cells were washed one more time and analyzed using Attune™ NxT Flow Cytometer with the default filter configuration. Staining was performed in triplicate, and at least 10,000 events were collected per sample. FCS files were exported to FlowJo 10 to analyze the results. Stained cells were compared with unstained cells to identify the presence or absence of biomarkers. Although flow cytometry on three cell lines was not performed at the same time, the same batches of antibody–fluorophore conjugates were used, and the same experimental protocol was followed in all three experiments. Importantly, the acquisition settings of the flow cytometer (PMT gains) were kept constant. Hence, it is fair to use the results from those separate experiments to compare the biomarker expression levels of different cell lines. For comparing EGFR expression levels of 3T3, CHO‐K1, OVCAR3, OVCAR5, and A‐431 cell lines, cells were incubated with anti‐EGFR–AF488 (R&D) for 15 min at 37°C and the similar centrifugation and washing steps as mentioned above were performed before analyzing the cells with the flow cytometer (Attune™). To confirm that cetuximab was functional, and was not binding non‐specifically to cell surface proteins, CHO‐K1 (EGFR−) and OVCAR5 (EGFR+) cells were incubated with Cet–AF647 (conjugated by us as described in the previous section) for 15 min at 37°C and the cells were analyzed using Attune™ flow cytometer after two rounds of washing. To show the antibody saturation, OVCAR3 and OVCAR5 cells were incubated with various concentrations of Cet–AF647 and anti‐EpCAM–AF647 (16–80 nM; antibody concentration) for 15 min in 1.5 mL tubes at 37°C. Cells were vortexed and incubated for another 15 min at 37°C to maximize staining. Following two rounds of washing, cells were analyzed using Beckman Coulter CytoFLEX Flow Cytometer with the default filter configuration.
To measure the efflux of BPD, CHO‐K1 cells were plated in a 96‐well plate (3000 cells in 100 μL growth medium per well), and 23.4 nM free BPD or 1 μM BPD equivalent PIC was added on the next day. Following 22 h of incubation, the medium containing BPD or PIC was removed by inverting the plate, and cells were washed with DPBS. Cells from some wells were harvested immediately, and the complete growth medium was added to the remaining wells. Cells from the remaining wells were harvested at different time points—15, 30, 45, and 90 min after washing. Three samples (biological replicates) were prepared for each time point; a multi‐channel pipette was used whenever applicable to expedite sample preparation. Harvested cells were collected in microcentrifuge tubes and centrifuged at 500 RCF. The cell pellets were resuspended in DPBS, and the BPD fluorescence was measured immediately using Beckman Coulter CytoFLEX Flow Cytometer with a custom filter configuration (405 nm laser was used to excite BPD and the fluorescence was collected using 690/50 nm filter). To estimate the percentage of free BPD in PIC, 3T3 cells were incubated with either 1 μM BPD equivalent PIC or 10, 30, 50, 70, 90, 110, and 150 nM free BPD for 1.5 h in a 96‐well plate. PIC or free BPD was removed, and cells were washed three times with DPBS and analyzed by Beckman flow cytometer with the custom filter configuration mentioned above. At least 10,000 events per sample were collected in all flow cytometry experiments. Results were exported as FCS files and analyzed using FlowJo 10. GraphPad Prism 9 was used for subsequent analyses.
Chemotherapy
Cisplatin and paclitaxel were purchased from Selleckchem (S1166 and S1150, respectively). Cells were plated in black‐walled optically clear bottom 96‐well plates (PerkinElmer, 6055300; 2000–5000 cells per well depending on the cell type) and incubated for 2 days. Ten different concentrations of cisplatin and paclitaxel in growth medium were added to each cell type on day 2, and the viability was measured on day 5. The concentrations of cisplatin administered to OVCAR3 cells were 0.7, 1, 3, 7, 10, 30, 70, 100, 300, and 700 μM and the concentrations administered to Powder and Cage cells were 1, 2.2, 4.6, 10, 21.5, 46.4, 100, 215.4, 464.2, and 1000 μM. The concentrations of paclitaxel administered to all three cell types were 0.001, 0.00316, 0.01, 0.032, 0.1, 0.316, 1, 3.16, 10, and 31.62 μM. Eight replicates were used for each group (including no treatment control and no cells or media‐only control) in all chemotherapy experiments.
PDT and taPIT
Powder, Cage, and OVCAR3 cells were plated in black‐walled transparent bottom 96‐well plates (Powder: 4000 cells/well; Cage: 3000 cells/well; OVCAR3: 6000 cells/well) and incubated for 2 days. 50 nM BPD (Sigma‐Aldrich, SML0534) in the growth medium was added to each cell type on day 2, and the plates were incubated for 1.5 h. After incubating cells with BPD, six different light doses (1.24, 3.10, 5.58, 8.68, 12.40, and 16.73 J/cm2) were administered to six separate groups of each cell type using a 690 nm laser (Modulight, ML6500 Series), and the viability was measured in 24 h after light dosing.
For all taPIT experiments, cells were plated in the same plate type mentioned above (on day 0), PIC was administered on day 1, light dose was administered on day 2, and viability was measured on day 3. Seeding densities were adjusted based on the growth rates of different cell types—from 2000 cells/well to 6000 cells/well—to make sure that untreated groups would reach adequate confluency on day 3. After incubating cells with 125, 250, 300 or 500 nM BPD equivalent PIC for 22 h, PIC was removed, and the cells were washed with DPBS (200 μL/well). In conventional taPIT dose–response experiments, 5, 10, 20, 30, 40, 50, and 60 J/cm2 light doses were administered immediately after washing in decreasing order (60 J/cm2 first and 5 J/cm2 last). For the free BPD PDT experiment on the CHO‐K1 cell line (Figure S6II), cells were incubated with 6 nM free BPD (instead of PIC) for 22 h, and all other procedures were similar to the procedure of conventional taPIT experiments. To show time‐dependent cytotoxicity due to efflux of free BPD, 60 J/cm2 light dose was administered to separate groups at multiple time points after washing. For taPIT dose–response experiments with the updated protocol, cells were incubated for 2 h after washing, and the light doses were administered afterward.
Light was administered by irradiating the transparent bottom of the plate using the platform designed for comparing laser with LED array as described earlier. 29 Plates were covered with a completely opaque 3D‐printed cover to avoid the reflection of light from the lid. 3D‐printed rectangular/square spatial light filters with aluminum foil glued underneath [as presented earlier 29 ] were used to prevent overheating (due to light absorption of the well plate material at the spacing between the wells) of sample by reflecting stray light away from the sample. Either 4 (2 × 2 wells), 6 (3 × 2 or 2 × 3 wells), 8 (2 × 2 wells twice), or 9 (3 × 3 wells) replicates were used for PDT/taPIT experiments. The same 690 nm laser mentioned above was used for administering light dose in all PDT/taPIT experiments. The irradiance was nearly 150 mW/cm2.
Viability measurements
While the clonogenic assay is a valuable and rigorous method for assessing long‐term effects on the survival and proliferative capacity of cells, the patient‐derived primary cell lines used in this study gradually lose their colony forming potential with each passage. Moreover, the primary cell lines at low passage frequently cannot form colonies when seeded at low densities, which is necessary for obtaining distinguishable colonies. Therefore, we chose to use an adenosine triphosphate (ATP) bioluminescence assay. The ATP‐based assay is a reliable method for evaluating acute cell viability or cytotoxic effects of various agents, as the ATP level is significantly correlated to the number of viable cells. 30 , 31 , 32 This assay offers the benefits of high sensitivity and a rapid protocol. 30 , 31 In all cytotoxicity experiments, viability was measured using the CellTiter‐Glo® Luminescent Cell Viability Assay (Promega, G7570) by following the manufacturer's protocol. Briefly, the plate and its contents were equilibrated at room temperature for 30 min. CellTiter‐Glo reagent was reconstituted by mixing CellTiter‐Glo® Buffer and CellTiter‐Glo® Substrate equilibrated at room temperature. The reconstituted reagent was added to each well on top of the media at a 1:1 ratio (by volume), and the contents were mixed on an orbital shaker (DragonLab, SK‐O180‐E) for 2 min. The plate was then incubated at room temperature for 10 min, and unfiltered luminescence was recorded by using a plate reader (BioTek, Synergy LX Multi‐Mode Reader) at 1 s integration time. Results were exported as CSV files and further analyzed using GraphPad Prism 9. The untreated control group was used to define 100% viability and the “no cells” or “media only” group was used to define 0% viability. IC50 values were determined using a nonlinear fit on GraphPad Prism 9.
RESULTS AND DISCUSSION
Powder and cage patient‐derived HGSOC cells are chemoresistant
Two different types of chemotherapy drugs, cisplatin and paclitaxel, were tested on the patient‐derived primary HGSOC cell lines, Powder and Cage, and an immortalized HGSOC cell line—OVCAR3. Figure 1A,B show that the patient‐derived cell lines are highly cisplatin and paclitaxel‐resistant in the average peak clinical dose ranges as compared with the immortalized cell line. IC50s of cisplatin treatments were 51.47, 33.26, and 5.46 μM for Powder, Cage, and OVCAR3 cell lines, respectively. Hence, the patient‐derived cell lines were at least six times more resistant to cisplatin than the immortalized cell line. IC50 of paclitaxel treatment was 0.0013 μM for OVCAR3. IC50s of paclitaxel treatments for Powder and Cage could not be calculated precisely since there was not much response in the tested concentration range; however, we can clearly infer from the graph that the IC50 values for Powder and Cage would be at least several orders of magnitude greater than the IC50 for OVCAR3.
FIGURE 1.

Cage and Powder patient‐derived primary HGSOC cell lines are intrinsically resistant to chemotherapy. (A) Cisplatin responses, and (B) paclitaxel responses of the patient‐derived cell lines Powder and Cage and an immortalized cell line OVCAR3. Powder and Cage cells were appreciably more resistant to both chemotherapy drugs than OVCAR3. Cells were incubated with 10 different concentrations of cisplatin or paclitaxel for 72 h, and the viability was measured using Cell Titer Glo Luminescence Assay (Promega). Results are mean ± standard deviation of eight replicates.
Powder and cage patient‐derived HGSOC cells are sensitive to PDT
The strongly chemoresistant patient‐derived cell lines are more sensitive to PDT than the OVCAR3 cell line (Figure 2); 50 nM BPD and varying light doses were used for all three PDT experiments. Based on the IC50 values, the patient‐derived cell lines were greater than five times more sensitive to PDT than the immortalized cell line – IC50 values were 2.09, 2.11 and 10.75 J/cm2 for Powder, Cage and OVCAR3, respectively. Remarkably, a very low photodynamic dose (150 nM*J/cm2; product of BPD dose and light dose) depleted most of the Powder and Cage cells, while the same dose only depleted less than 20% of OVCAR3 cells.
FIGURE 2.

Patient‐derived primary HGSOC cell lines are more sensitive to PDT than a common immortalized cell line. PDT responses of the patient‐derived cell lines Powder and Cage, and an immortalized cell line OVCAR3. Chemoresistant Powder and Cage cell lines were strikingly more sensitive to PDT than the OVCAR3 cell line—IC50 PDT doses were 104.5, 105.5, and 537.5 nM*J/cm2 for Powder, Cage and OVCAR3, respectively. Cells were incubated with 50 nM BPD for 1.5 h, and then the light doses were administered using a 690 nm laser. The viability was measured in 24 h post‐treatment. Six replicates were used for Powder and four replicates were used for Cage and OVCAR3. Results are mean ± standard deviation.
These results agree with previous findings that PDT sensitivity tends to be agnostic, or weakly correlated, to chemoresistance. PDT provides a unique mechanism of inducing apoptosis that can bypass many regulatory checkpoints that account for radio‐ and chemoresistance and increase the susceptibility of cancer cells to death. 33 , 34 Celli et al. 35 showed that PDT can eradicate subpopulations of pancreatic cancers that are non‐responsive to gemcitabine. Yang et al. 36 found that PDT treatment significantly inhibits the growth of gemcitabine‐resistant cholangiocarcinoma cells in vitro and in vivo. In addition to providing direct damage to chemoresistant cells, PDT has the potential to re‐sensitize the chemoresistant tumor cells to chemotherapy to synergistically enhance the efficacy of combination treatment. 33
Powder and Cage patient‐derived HGSOC cells contain heterogeneous subpopulations with variable cell membrane protein expression
Multicolor flow cytometry experiments were performed on patient‐derived primary and OVCAR3 cell lines to test plasma membrane protein expressions and examine heterogeneity. Six putative ovarian cancer cell membrane biomarkers based on literature—EGFR, 37 , 38 FOLR1, 39 , 40 CD133, 41 , 42 CXCR4, 43 c‐MET, 44 and EpCAM 45 —were chosen, and the antibody–fluorophore conjugates directed against those biomarkers were used for staining live cells for flow cytometry. Figure 3A shows the percent positive cells for cell membrane markers. All biomarkers except CXCR4 were expressed by OVCAR3 cell line, while only EGFR and c‐MET were expressed by the patient‐derived cell lines. Interestingly, none of the biomarkers were expressed by more than ~50% of Powder and Cage cells, unlike OVCAR3 cells—about 95% of OVCAR3 cells expressed EGFR and 100% of OVCAR3 cells expressed EpCAM. Only about 20% of Powder cells expressed EGFR and nearly 30% of Powder cells expressed c‐MET, while both of those biomarkers were expressed by nearly half of the Cage cells.
FIGURE 3.
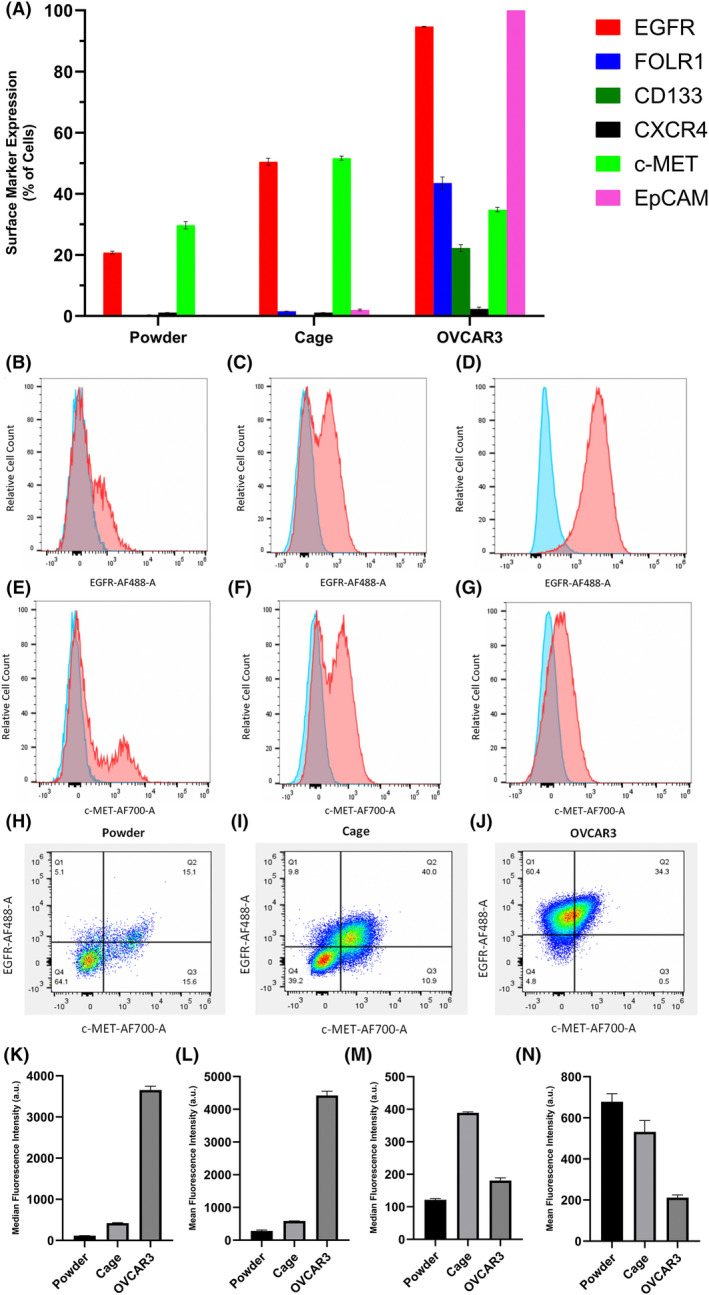
Flow cytometry showed intriguing distinctions between cell surface biomarker expressions of the patient‐derived primary HGSOC cell lines and the immortalized HGSOC cell line. (A) Percent positive cells for the cell membrane biomarkers. Representative fluorescence histograms showing EGFR, (B)–(D), and c‐MET, (E)–(G), expressions of Powder (left; (B) and (E)), Cage (middle; (C) and (F)), and OVCAR3 (right; (D) and (G)), cell lines. Blue and red histograms represent the fluorescence of unstained and stained cells, respectively. (H)–(J) Dot plots of EGFR–AF488 and c‐MET–AF700 fluorescence to assess the heterogeneity of cells. Cells in Q1 and Q3 are singly positive for EGFR and c‐MET, respectively. Cells in Q2 and Q4 are positive and negative for both markers, respectively. Relative EGFR ((K), median and (L), mean) and c‐MET (M), median and (N), mean) expression levels of Powder, Cage, and OVCAR3 cell lines. The fluorescence of unstained cells was subtracted from the fluorescence of stained cells before making comparisons. Staining was performed in triplicate. Results are mean ± standard deviation.
In addition to the difference in the fractions of cells expressing multiple biomarkers, there was a major difference between OVCAR3 and the patient‐derived cell lines' fluorescence intensity distributions as shown by the representative histograms (Figure 3B–G). Most of the EGFR and c‐MET fluorescence histograms of stained Powder and Cage cells were clearly bimodal (Figure 3C,E,F)—the only one that was not clearly bimodal was the EGFR histogram of Powder cells (Figure 3B). Conversely, none of the OVCAR3 histograms were bimodal (Figure 3D,G, and S1). Bimodal distributions signify the presence of distinct subpopulations in the patient‐derived cancer cell lines. EGFR fluorescence was plotted against c‐MET fluorescence and a quadrant gate was used to assess heterogeneity (Figure 3H–J). About half of the c‐MET‐positive Powder cells were only positive for c‐MET and the other half of the cells were also positive for EGFR (Figure 3H). Three‐fourths of EGFR‐expressing Powder cells also expressed c‐MET and the remaining one‐fourth only expressed EGFR (Figure 3H). However, the level of heterogeneity was significantly different on the Cage cell line—the majority of EGFR‐expressing cells co‐expressed c‐MET, and only the one‐fifth of the antigen‐positive cells were singly positive for either EGFR or c‐MET (Figure 3I). On the other hand, there were virtually no OVCAR3 cells singly positive for c‐MET; all c‐MET‐expressing cells also expressed EGFR, and vice versa (Figure 3J). Note that both median and mean fluorescence intensities are presented. The median value is less sensitive to outliers while the mean is more sensitive to capturing rare subpopulations.
Although the flow cytometry results are by no means comprehensive, we observed some compelling differences in cell surface biomarker expressions of immortalized and patient‐derived primary cell lines. Since Powder and Cage cells were derived from two different patients, it is not surprising to observe some differences in cell surface antigen expressions between them.
Time‐dependent efflux of free BPD avoids non‐specific taPIT cytotoxicity in EGFR− and EGFR+ cell lines
After incubating cells with PIC and before giving the light dose, we remove the PIC, wash cells with DPBS/media, and give fresh media to represent a closer approximation to the in vivo conditions with flow from blood and lymphatic fluids. 46 Washing generally is useful in vitro for reducing non‐specific damage caused by the PICs adsorbing on the cell surface. 46 However, EGFR‐targeted taPIT still induces CHO‐K1 cell death (an EGFR‐negative cell line) even when the wash step was included in the protocol. Strikingly, the cytotoxicity was time‐dependent—taPIT destroyed the majority of cells when the light dose (60 J/cm2) was given immediately after washing, but the cytotoxicity gradually decreased when the same light dose was given at the latter time points, and the viability reached 100% at the 2‐h time point (Figure 4A). From flow cytometry, we confirmed that cetuximab does not bind non‐specifically to any other proteins/receptors on the CHO‐K1 cells (see Supporting Information S3). This suggests that the non‐specific killing observed here is due to the non‐specific uptake of free BPD that is present in PIC. Free BPD mostly localizes to highly photosensitive parts of the cells (e.g., the outer membrane of mitochondria), while PIC mostly localizes to less photosensitive parts of the cells (e.g., protein fragments within lysosomes); hence, free BPD is significantly more potent than PIC in terms of inducing rapid apoptosis. 18 , 46 This could explain why even a very small fraction of free BPD in PIC causes significant damage to the cells. We hypothesize that the time‐dependent cytotoxicity is due to the free BPD efflux.
FIGURE 4.
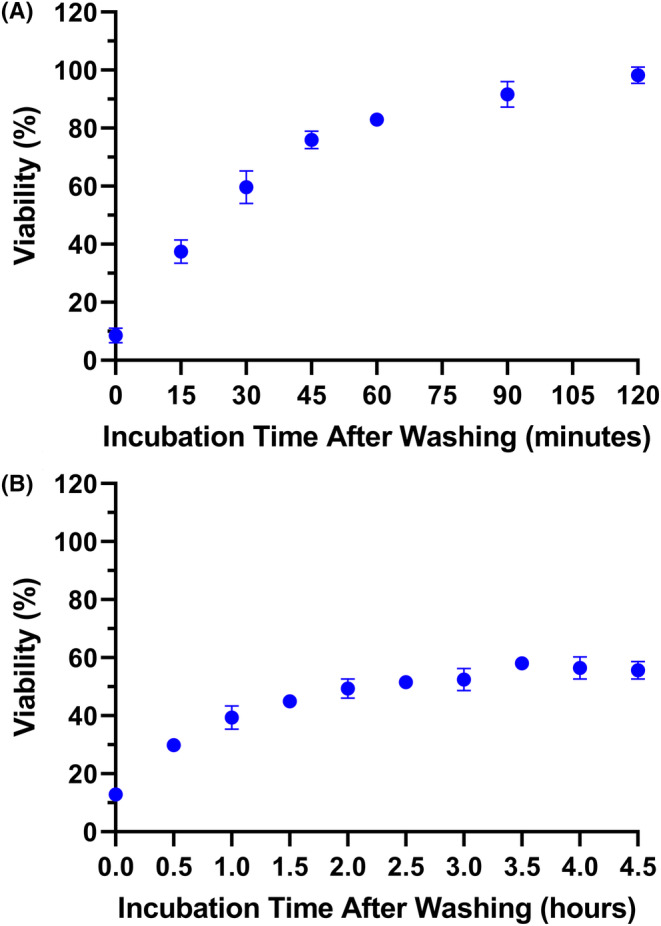
Time‐dependent cytotoxicity of taPIT suggested the efflux of free BPD. Following 22‐h incubation with 250 nM BPD equivalent PIC and washing, 60 J/cm2 light dose was administered at multiple time points. The cytotoxicity of taPIT decreased as the post‐wash incubation time increased. taPIT did not kill the EGFR‐negative cell line CHO‐K1 when the light dose was administered after 2 h of post‐wash incubation (A), while it killed the EGFR‐positive cell line OVCAR5 even when the light dose was administered after 4.5 h of post‐wash incubation (B). Treatments were performed in quadruplicate. Results are mean ± standard deviation.
We performed a similar experiment on an EGFR‐positive cell line (OVCAR5) and noticed the time‐dependent cytotoxicity again; however, OVCAR5 cell viability did not increase notably after the 2‐h time point and did not reach 100% even after 4 h (Figure 4B). This supports our hypothesis—initially, the cytotoxicity is caused by both free BPD and PIC, but as the free BPD gradually comes out of the cells, the cytotoxicity is dominated by the PIC. Interestingly, PIC does not seem to be expelled out of the cells within these timeframes (~24 h). PICs enter the cell through receptor‐mediated endocytosis and get broken down into fragments in lysosomes. Even after lysosomal proteolysis of PICs, it is possible that most of the BPD molecules remain attached to amino acids; hence, the PIC fragments could be too large to escape the lysosomes. Using confocal microscopy, Savellano and Hasan 18 noticed that PICs predominantly localize to endosomes and/or lysosomes and do not redistribute to other subcellular sites over time.
Verification and time dependence of cellular efflux of free BPD
The BPD fluorescence of the CHO‐K1 cell line at multiple time points after washing was directly measured using flow cytometry. Following 24‐h incubation with 1 μM BPD equivalent PIC or 23.4 nM BPD, cells were washed with DPBS and analyzed by flow cytometry at multiple time points. As expected, the BPD fluorescence decreased with an increase in post‐wash incubation time in both cases (Figure 5A,B). Since the CHO‐K1 cell line is an EGFR‐negative cell line, uptake of PIC should be minimal. All the fluorescence detected when the cells were incubated with PIC should be solely due to the uptake of free BPD content in PIC.
FIGURE 5.

Flow cytometry verified the efflux of free BPD. Following 22‐h incubation of the EGFR‐negative cell line CHO‐K1 with 1 μM BPD equivalent PIC or 23.4 nM free BPD, cells were washed, and the BPD fluorescence was measured at various time points. The BPD fluorescence decreased strikingly as the post‐wash incubation time increased. (A) Fluorescence of cells incubated with PIC. (B) Fluorescence of cells incubated with free BPD. Results are mean ± standard deviation of the median fluorescence intensities of three replicates.
It is important to note that analyzing cells immediately after removing the PIC/BPD was impossible because the flow cytometer requires cells in suspension. It took about 15 min to wash, lift, centrifuge, and resuspend cells in the buffer. A significant amount of BPD must have been expelled during sample preparation. Hence, the BPD fluorescence at time zero does not represent the true maximum, which may be significantly greater. Even without accounting for the BPD efflux during the first 15 min, we still observed an obvious reduction in BPD fluorescence as the post‐wash incubation time was increased. The highest reduction in free BPD fluorescence was between the first two measurements. These results and the previous viability measurements suggest that most of the efflux happens within the first ~30 min. BPD fluorescence was not measured beyond 90 min of post‐wash incubation. Note that BPD fluorescence does not go to zero and is likely asymptotic with a long tail after an initial phase of rapid clearance. Based on the cytotoxicity experiments on CHO‐K1 and OVCAR5 cell lines, the amount of BPD in the cells drops below the threshold for killing after 2 h of post‐wash incubation. The cytotoxicity experiments also suggested that the photosensitizers in suspension do not kill the cells as long as the concentration is low.
In a seminal report developing taPIT, Abu‐Yousif et al. 46 presumed that the non‐specific killing of EGFR‐negative cells could be due to the non‐specific adsorption of PIC on the cell surface. However, we believe that the non‐specific uptake of free BPD should be the dominant factor based on the new data presented here and also on the fact that PIC‐associated BPD is strongly quenched until receptor‐mediated endocytosis and lysosomal degradation. While preparing samples for these flow cytometry experiments, we washed the cells with DPBS when the cells were adhering to the bottom of the wells. We then incubated them with a lifting agent (TrypLE Express; ThermoFisher Scientific, 12,604,021) and diluted the lifting agent by adding an ample amount of complete growth medium; this step can be considered another wash step. Following centrifugation, the cell pellets were washed by vigorously resuspending them in DPBS, and the cells were vigorously vortexed before introducing them into the flow cytometer. We believe that the PIC adsorbed on the cell surface (if any) would have been washed away after those steps. Moreover, the high degree of similarity between the fluorescence patterns of cells incubated with PIC and BPD suggests that the underlying mechanisms in both cases should be similar.
The efflux of anticancer drugs is a well‐known phenomenon. Enhanced drug efflux mediated by various transporters (such as P‐gp, MRP1, MRP2, etc.) is one of the mechanisms that contribute to the development of resistance to anticancer drugs. 47 , 48 Although it is not as prevalent as for chemotherapy and other drugs, resistance to PDT due to increased PS efflux has been reported in some cases. 33 , 49 , 50 , 51 The data presented by Robey et al. 49 shows ABCG2‐mediated PS efflux and resistance to PDT with photosensitizers that are ABCG2 substrates. The photosensitizers Ce6, MPPa, and PpIX (generated by intracellular conversion of ALA) were readily transported by ABCG2 making PDT less effective, while the photosensitizers that are not substrates of ABCG2 (HpIX, m‐THPP and m‐THPC) were not affected. 49 Liu et al. 50 also showed the efflux of photosensitizers HPPH, PpIX, and BPD‐MA mediated by ABCG2.
An updated taPIT protocol to mitigate non‐specific phototoxicity mediated by free BPD
PS efflux, in general, is not desirable as it can render PDT less effective or ineffective. However, we can exploit this phenomenon to improve the taPIT experiments in vitro. Based on the observations that cells can gradually expel the free BPD, but the PIC fragments are too large to be expelled, we can slightly modify the protocol to avoid non‐specific killing due to the free BPD content. Since light is mandatory for photodynamic action, we have control over when to impart cytotoxicity after PIC administration. Two hours of post‐wash incubation seemed sufficient time for cells to lower the free BPD content below the threshold for cytotoxicity based on the previous taPIT experiments (Figure 4A,B). Hence, the light doses were administered after 2 h of post‐wash incubation instead of administering immediately after washing the cells. When the light doses were administered immediately after washing (the order of light dosing was maximum to minimum), taPIT non‐specifically killed EGFR‐negative cell lines 3T3 and CHO‐K1 in a dose‐dependent manner (Figure 6A,C). However, no noticeable cytotoxicity was observed when the light doses were administered after 2 h of post‐wash incubation even when a higher concentration of PIC was used (Figure 6B,D). It seems that the CHO‐K1 cells are more sensitive to free BPD than 3T3 (Figure 6A,C); however, this might also be due to the time delay between washing and light dosing for the 3T3 experiment, as that experiment was performed when we were unaware of the free BPD efflux; no efforts were made to minimize the time delay.
FIGURE 6.
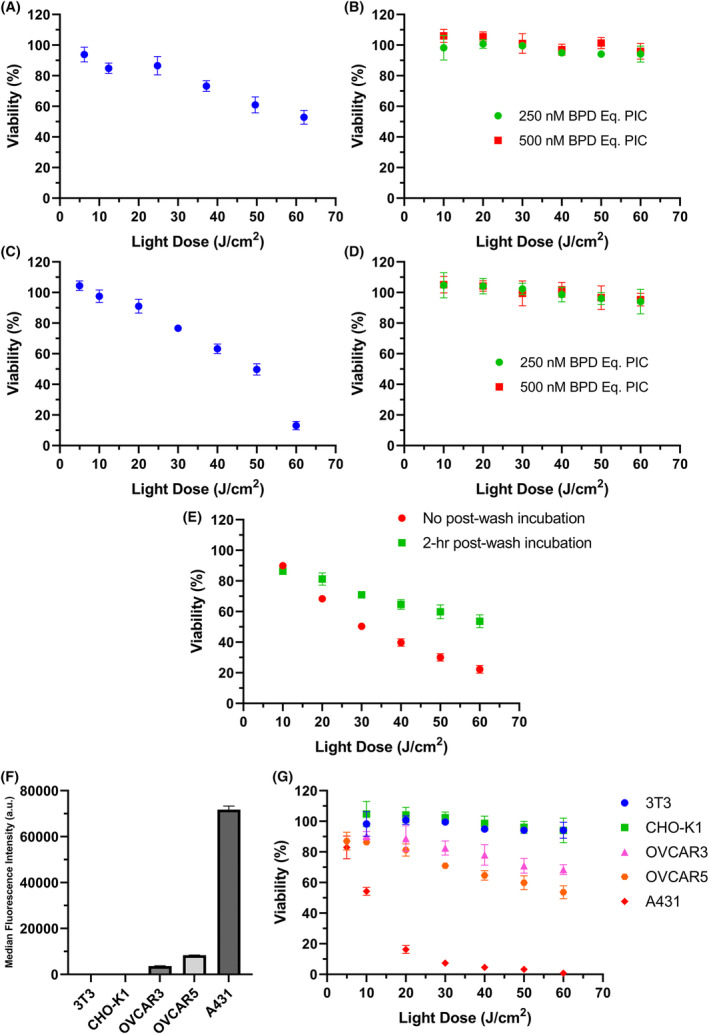
The updated taPIT protocol selectively kills EGFR‐positive cells and avoids non‐specific killing of EGFR‐negative cells. In conventional taPIT experiments, the light dose was administered immediately after PIC removal and washing. In updated taPIT experiments, the light dose was administered following 2 h of post‐wash incubation. (A) Conventional taPIT dose–response, and (B) updated taPIT dose–response of an EGFR‐negative cell line 3T3. A PIC dose of 300 nM BPD equivalent was used for the conventional taPIT experiment (~50 nM cetuximab). (C) Conventional taPIT dose–response, and (D) updated taPIT dose–response of another EGFR‐negative cell line CHO‐K1. 250 nM BPD equivalent PIC was used for the conventional taPIT experiment. (E) Conventional and updated taPIT dose–response of an EGFR‐positive cell line OVCAR5. 250 nM BPD equivalent PIC was used for both experiments. (F) Relative EGFR expression levels of 3T3, CHO‐K1, OVCAR3, OVCAR5, and A431 cell lines determined by flow cytometry. (G) Updated taPIT dose–responses of 3T3, CHO‐K1, OVCAR3, OVCAR5, and A431 cell lines. Conventional taPIT protocol killed EGFR‐negative cell lines as well, but the updated taPIT protocol only killed EGFR‐positive cell lines. The cytotoxicities were in agreement with the EGFR expression levels when the updated taPIT protocol was followed. Three replicates were used for flow cytometry, and four to nine replicates were used for taPIT experiments. Results are mean ± standard deviation.
On the other hand, taPIT killed the EGFR+ cell line (OVCAR5) even when the light doses were administered after 2 h of post‐wash incubation (Figure 6E). The efficacy was lower as compared with the taPIT experiment where the light doses were given immediately after washing, but the selectivity of PIC was highly pronounced with the updated protocol. It is understandable that the reduced efficacy was due to the efflux of free BPD; the cytotoxicity caused by the EGFR‐mediated uptake of BPD was still present.
taPIT with the updated protocol was performed on two more immortalized cell lines (OVCAR3 and A431) with varying levels of EGFR expression to examine if the cytotoxicity caused by PIC correlates with the EGFR expression levels. Out of five cell lines tested, 3T3 and CHO‐K1 cell lines were negative for EGFR (very low expression, negligible signal), and the other three cell lines had varying levels of EGFR as shown in Figure 6F. Although the sensitivity of different cell lines to taPIT might be different, we still observed the correlation between EGFR expressions and taPIT responses (Figure 6G)—more EGFR means more uptake of BPD through receptor‐mediated endocytosis and more killing of cells, and vice versa.
Hence, by incorporating the 2‐h post‐wash incubation step in the taPIT protocol, we can avoid the undesired killing of antigen‐negative cell lines and avoid the chances of overestimating the potency of taPIT for antigen‐positive cell lines. The protocol should be further modified in some cases, as discussed broadly in the next section. To increase the efficacy of taPIT, we can target a different antigen that is highly overexpressed. For instance, EpCAM is a highly promising target for OVCAR3 and OVCAR5 cell lines as these cells have significantly higher expression of EpCAM than EGFR; finding the best antibody directed against EpCAM and preparing EpCAM targeting antibody‐BPD conjugates is ongoing research in our group. Alternatively, when a single antigen is not highly overexpressed, we can potentially target multiple moderately overexpressed antigens to increase the efficacy of taPIT.
Protocol refinement using patient‐derived cancer cell lines with exceptional sensitivity to free PS PDT
Since the patient‐derived HGSOC cell lines were extremely sensitive to free BPD, EGFR‐targeted taPIT non‐specifically killed the cells even when the light dose was administered after 2 h of post‐wash incubation. The taPIT experiment with a constant light dose at multiple time points was performed on both patient‐derived primary cancer cell lines. The patient‐derived cells responded to free BPD‐PDT even when the light dose was given after more than 4 h of post‐wash incubation (Figure 7A,B). These cells were not completely EGFR‐negative as 3T3 and CHO‐K1 cell lines, but only about 50% of Cage cells and 20% of Powder cells were EGFR‐positive, and the expression level (EGFR density on the cells) was very low in both cell lines. Hence, it is unlikely for PIC to cause as significant damage to cells as we observed here; the main cause of cytotoxicity is likely to be the free BPD. More cells survived when the light dose was given at the latter time points than at the earlier time points, this implies the efflux of free BPD, however, the free BPD content in the cells did not drop below the threshold for killing even after 4 h of post‐wash incubation since the thresholds for these cells were very low. There is also a chance that these cells did not expel free BPD as fast and effectively as the immortalized cell lines. The viability of Cage cells only minimally increased when the light doses were given after 2 h of post‐wash incubation (Figure 7A); to check if the cytotoxicity after 2‐h was solely caused by PIC, we performed a taPIT dose‐response experiment using two different concentrations of PIC on Cage cell lines where the light doses were given after 2 h of post‐wash incubation. When 500 nM BPD equivalent PIC (~80 nM antibody) was used, the potency of taPIT was significantly higher than the potency at 250 nM BPD equivalent PIC (Figure 7C). The increase in cytotoxicity due to the increase in antibody concentration from 40 to 80 nM should be minimal as 40 nM antibody is a saturating concentration of antibody even when the antigen densities are high (see Supporting Information S4 and S5). This suggests that the free BPD was still playing a significant role—higher PIC concentration means higher free BPD concentration and increased cytotoxicity. EGFR expressions and updated taPIT responses of all seven cell lines used in this study are shown altogether in the Supporting Information (S7).
FIGURE 7.

Patient‐derived primary HGSOC cell lines require further modifications to the taPIT protocol. Multiple‐time‐point taPIT dose responses of Cage cell line (A), and Powder cell line (B). Following 22‐h incubation with 250 nM BPD equivalent PIC and washing, 60 J/cm2 light dose was administered at various time points. The cytotoxicity of taPIT decreased as the post‐wash incubation time increased. The time‐dependent cytotoxicity indicates the efflux of free BPD. (C) Updated taPIT dose–response of Cage cell line. The striking increase in efficacy of taPIT when the concentration of PIC was doubled suggests that the remaining free BPD was still causing cytotoxicity even when the updated taPIT protocol was followed since both concentrations of PIC were saturating concentrations. (D) Multiple‐time‐point free BPD PDT response of Powder cell line. Following 22‐hour incubation with 3.33 nM free BPD and washing, 60 J/cm2 light dose was administered at various time points. This result shows that the free BPD does not kill the cells when the concentration is low, and the post‐wash incubation time is prolonged. Results are mean ± standard deviation of four replicates.
These experiments clearly show that performing taPIT on the patient‐derived primary cell lines in vitro is not straightforward. Based on the taPIT responses of cell lines derived from two patients, it is not reasonable to assume that all patient‐derived primary cell lines behave the same way; however, these results highlight that taPIT experiments require careful characterization in vitro. There are some ways to avoid non‐specific killing when the cells are supersensitive to free BPD. Using flow cytometry, we estimated that 250 nM BPD equivalent PIC contained about 6 nM free BPD (see Supporting Information, S6). We performed a PDT experiment with a constant light dose at multiple time points using 3.33 nM free BPD on Powder cell line and noticed that the viability crossed 90% after 3 h of post‐wash incubation and reached ~100% after 5 h of post‐wash incubation (Figure 7D). This shows that when the concentration of free BPD is low, the cells can lower the free BPD content below the threshold for killing if the post‐wash incubation time is increased. Since 20 nM antibody is also a fairly saturating concentration of antibody (see Supporting Information, S4 and S5), the concentration of PIC can be reduced by half without sacrificing the efficacy of taPIT considerably, so that the free BPD concentration drops to ~3 nM, which turned out to be a manageable concentration of free BPD. Since Powder and Cage cell lines are significantly more sensitive to photodynamic action than other conventional cell lines, there is a high chance that these cells can be depleted more effectively even when a moderately overexpressed cell membrane antigen is targeted. In addition to using a lower concentration of PIC and increasing the post‐wash incubation time, future work could explore other modifications in the protocol that could potentially help avoid non‐specific photodamage. For example, using a larger media volume after washing, performing another wash after ~2 h of post‐wash incubation, and so forth.
CONCLUSION
The present study provides more evidence that PDT is agnostic to chemoresistance using patient‐derived primary HGSOC cell lines and an immortalized HGSOC cell line. Examination of putative cell surface biomarkers of chemoresistant HGSOC also revealed interesting differences between the immortalized and the patient‐derived cell lines. Patient‐derived cell lines did not overexpress several of the markers moderately or highly overexpressed by the immortalized cell line. Heterogeneity was more obvious in the patient‐derived primary cell lines as suggested by the bimodal distributions of fluorescence histograms. Although the small fraction of non‐covalently associated BPD in PIC does not affect in vivo experiments noticeably, as shown by the high specificity of PIC‐PDT in vivo, 4 we have shown that it can affect cells non‐specifically in vitro. By performing multiple PDT/taPIT experiments, we have shown that cells can expel free BPD and this property can be exploited to improve taPIT experiments in vitro. To avoid non‐specific killing, we have suggested a simple modification to the taPIT protocol—2–5 h of post‐wash incubation depending on the sensitivity of the cell line to free PS PDT. The short time is sufficient for all of the immortalized cell lines tested whereas longer periods were needed for the highly chemoresistant, yet highly PDT sensitive, patient‐derived lines used in this study. Collectively, these results suggest lowering the concentration of PIC (to not exceed the receptor saturating dose, also avoiding the Hook effect) and extending the post‐wash incubation time to avoid non‐specific killing when the cells are extremely sensitive to free BPD. These updated protocols will help researchers using antibody–PS conjugates with hydrophobic and lipophilic PSs optimize their treatment protocols to preclude the chances of incorrectly attributing cytotoxicity to targeted therapy when the cytotoxicity is caused, in part, by non‐covalently associated PSs. Moreover, this study signifies the importance of using more biologically relevant cancer cell models than immortalized cell lines for testing drugs—the treatment protocol designed for immortalized cell lines does not always work the same way for primary cell lines.
CONFLICT OF INTEREST STATEMENT
B. Spring is a scientific founder of NIRA Biosciences and shareholder of Alys Pharmaceuticals. No potential conflicts of interest were disclosed by the other authors.
Supporting information
Appendix S1. Supporting Information.
ACKNOWLEDGMENTS
This work was supported by the U.S. National Institutes of Health, Grant R01 CA226855 (to B.Q.S. and T.H.). We are grateful to Dr. Kai Zhang for his assistance in the preparation of the light illumination setup. We thank Yuchen Cheng for assistance in sample preparation for the flow cytometry to verify the cellular efflux of free BPD. We thank the Institute for Chemical Imaging of Living Systems (RRID:SCR_022681) at Northeastern University for providing Beckman Coulter CytoFLEX Flow Cytometer and necessary training. We thank Professor Mark Niedre (Department of Bioengineering at Northeastern University) for facilitating the use of Attune™ NxT Flow Cytometer. We thank Yao Li (The Zhang Group at Northeastern University) for facilitating the use of NanoDrop™ 2000 spectrophotometer. We also thank Ji Tae Park, Rebecca Harman, and Dr. Eric Kercher for insightful discussions.
Timilsina S, Saad MA, Lang RT, Hasan T, Spring BQ. Methods for assessing and removing non‐specific photoimmunotherapy damage in patient‐derived tumor cell culture models. Photochem Photobiol. 2025;101:4‐20. doi: 10.1111/php.13957
This article is part of a Special Issue dedicated to the memory of Dr. Chuck Gomer.
REFERENCES
- 1. Idrisova KF, Simon HU, Gomzikova MO. Role of patient‐derived models of cancer in translational oncology. Cancers (Basel). 2023;15:139. doi: 10.3390/cancers15010139 [DOI] [PMC free article] [PubMed] [Google Scholar]
- 2. Miserocchi G, Mercatali L, Liverani C, et al. Management and potentialities of primary cancer cultures in preclinical and translational studies. Journal of Translational Medicine. 2017;15:229. doi: 10.1186/s12967-017-1328-z [DOI] [PMC free article] [PubMed] [Google Scholar]
- 3. Gillet JP, Varma S, Gottesman MM. The clinical relevance of cancer cell lines. Journal of the National Cancer Institute. 2013;105:452‐458. doi: 10.1093/jnci/djt007 [DOI] [PMC free article] [PubMed] [Google Scholar]
- 4. Spring BQ, Abu‐Yousif AO, Palanisami A, et al. Selective treatment and monitoring of disseminated cancer micrometastases in vivo using dual‐function, activatable immunoconjugates. Proceedings of the National Academy of Sciences of the United States of America. 2014;111:E933‐E942. doi: 10.1073/pnas.1319493111 [DOI] [PMC free article] [PubMed] [Google Scholar]
- 5. Savellano MD, Hasan T. Targeting cells that overexpress the epidermal growth factor receptor with polyethylene Glycolated BPD verteporfin photosensitizer immunoconjugates. Photochemistry and Photobiology. 2007;77:431‐439. doi: 10.1562/0031-8655(2003)0770431tctote2.0.co2 [DOI] [PubMed] [Google Scholar]
- 6. Richter M, Piwocka O, Musielak M, Piotrowski I, Suchorska WM, Trzeciak T. From donor to the lab: A fascinating journey of primary cell lines. Frontiers in Cell and Development Biology. 2021;9:711381. doi: 10.3389/fcell.2021.711381 [DOI] [PMC free article] [PubMed] [Google Scholar]
- 7. Ince TA, Sousa AD, Jones MA, et al. Characterization of twenty‐five ovarian tumour cell lines that phenocopy primary tumours. Nature Communications. 2015;6:7419. doi: 10.1038/ncomms8419 [DOI] [PMC free article] [PubMed] [Google Scholar]
- 8. Janik K, Popeda M, Peciak J, et al. Efficient and simple approach to in vitro culture of primary epithelial cancer cells. Bioscience Reports. 2016;36:e00423. doi: 10.1042/BSR20160208 [DOI] [PMC free article] [PubMed] [Google Scholar]
- 9. Dougherty TJ, Gomer CJ, Henderson BW, et al. Photodynamic therapy. Journal of the National Cancer Institute. 1998;90:889‐905. [DOI] [PMC free article] [PubMed] [Google Scholar]
- 10. Celli JP, Spring BQ, Rizvi I, et al. Imaging and photodynamic therapy: mechanisms, monitoring, and optimization. Chemical Reviews. 2010;110:2795‐2838. doi: 10.1021/cr900300p [DOI] [PMC free article] [PubMed] [Google Scholar]
- 11. Mew D, Wat CK, Towers GH, Levy JG. Photoimmunotherapy: treatment of animal tumors with tumor‐specific monoclonal antibody‐hematoporphyrin conjugates. Journal of Immunology. 1983;130:1473‐1477. [PubMed] [Google Scholar]
- 12. Goff BA, Bamberg M, Hasan T. Photoimmunotherapy of human ovarian carcinoma cells ex vivo. Cancer Research. 1991;51:4762‐4767. [PubMed] [Google Scholar]
- 13. van Dongen GAMS, Visser GWM, Vrouenraets MB. Photosensitizer‐antibody conjugates for detection and therapy of cancer. Advanced Drug Delivery Reviews. 2004;56:31‐52. [DOI] [PubMed] [Google Scholar]
- 14. Hudson R, Carcenac M, Smith K, et al. The development and characterisation of porphyrin isothiocyanate‐monoclonal antibody conjugates for photoimmunotherapy. British Journal of Cancer. 2005;92:1442‐1449. doi: 10.1038/sj.bjc.6602517 [DOI] [PMC free article] [PubMed] [Google Scholar]
- 15. Mitsunaga M, Ogawa M, Kosaka N, Rosenblum LT, Choyke PL, Kobayashi H. Cancer cell‐selective in vivo near infrared photoimmunotherapy targeting specific membrane molecules. Nature Medicine. 2011;17:1685‐1691. doi: 10.1038/nm.2554 [DOI] [PMC free article] [PubMed] [Google Scholar]
- 16. Soukos NS, Hamblin MR, Keel S, Fabian RL, Deutsch TF, Hasan T. Epidermal growth factor receptor‐targeted Immunophotodiagnosis and photoimmunotherapy of Oral precancer in vivo 1. Cancer Research. 2001;61:4490‐4506. [PMC free article] [PubMed] [Google Scholar]
- 17. Molpus KL, Hamblin MR, Rizvi I, Hasan T. Intraperitoneal photoimmunotherapy of ovarian carcinoma xenografts in nude mice using charged photoimmunoconjugates. Gynecologic Oncology. 2000;76:397‐404. doi: 10.1006/gyno.1999.5705 [DOI] [PubMed] [Google Scholar]
- 18. Savellano MD, Hasan T. Photochemical targeting of epidermal growth factor receptor: A mechanistic study. Clinical Cancer Research. 2005;11:1658‐1668. [DOI] [PubMed] [Google Scholar]
- 19. Railkar R, Krane LS, Li QQ, et al. Epidermal growth factor receptor (EGFR)‐targeted photoimmunotherapy (PIT) for the treatment of EGFR‐expressing bladder cancer. Molecular Cancer Therapeutics. 2017;16:2201‐2214. doi: 10.1158/1535-7163.MCT-16-0924 [DOI] [PMC free article] [PubMed] [Google Scholar]
- 20. Bulin A‐L, Broekgaarden M, Simeone D, Hasan T. Low dose photodynamic therapy harmonizes with radiation therapy to induce beneficial effects on pancreatic heterocellular spheroids. Oncotarget. 2019;10:2625‐2643. [DOI] [PMC free article] [PubMed] [Google Scholar]
- 21. Pogue BW, O'hara JA, Demidenko E, et al. Photodynamic therapy with verteporfin in the radiation‐induced fibrosarcoma‐1 tumor causes enhanced radiation sensitivity‐pub… photodynamic therapy with verteporfin in the radiation‐induced fibrosarcoma‐1 tumor causes enhanced radiation sensitivity. Cancer Research. 2003;63:1025‐1058. [PubMed] [Google Scholar]
- 22. Duska LR, Hamblin MR, Miller JL, Hasan T. Combination photoimmunotherapy and cisplatin: effects on human ovarian cancer ex vivo. Journal of the National Cancer Institute. 1999;91:1557‐1563. [DOI] [PubMed] [Google Scholar]
- 23. Rizvi I, Celli JP, Evans CL, et al. Synergistic enhancement of carboplatin efficacy with photodynamic therapy in a three‐dimensional model for micrometastatic ovarian cancer. Cancer Research. 2010;70:9319‐9328. doi: 10.1158/0008-5472.CAN-10-1783 [DOI] [PMC free article] [PubMed] [Google Scholar]
- 24. Hadi LM, Yaghini E, Macrobert AJ, Loizidou M. Synergy between photodynamic therapy and dactinomycin chemotherapy in 2D and 3D ovarian cancer cell cultures. International Journal of Molecular Sciences. 2020;21:3203. doi: 10.3390/ijms21093203 [DOI] [PMC free article] [PubMed] [Google Scholar]
- 25. del Carmen MG, Rizvi I, Chang Y, et al. Synergism of epidermal growth factor receptor‐targeted immunotherapy with photodynamic treatment of ovarian cancer in vivo. Journal of the National Cancer Institute. 2005;97:1516‐1524. doi: 10.1093/jnci/dji314 [DOI] [PubMed] [Google Scholar]
- 26. Yuan Z, Fan G, Wu H, et al. Photodynamic therapy synergizes with PD‐L1 checkpoint blockade for immunotherapy of CRC by multifunctional nanoparticles. Molecular Therapy. 2021;29:2931‐2948. doi: 10.1016/j.ymthe.2021.05.017 [DOI] [PMC free article] [PubMed] [Google Scholar]
- 27. Sternberg ED, Dolphin D, Brlickner C. Porphyrin‐based photosensitizers for use in photodynamic therapy. Pergamon Tetrahedron. 1998;54:4151‐4202. [Google Scholar]
- 28. Aveline BM, Hasan T, Redmond RW. The effects of aggregation, protein binding and cellular incorporation on the photophysical properties of benzoporphyrin derivative monoacid ring A (BPDMA). J Photochem Photobiol B. 1995;30:161‐169. [DOI] [PubMed] [Google Scholar]
- 29. Zhang K, Timilsina S, Waguespack M, Kercher EM, Spring BQ. An open‐source LED array illumination system for automated multiwell plate cell culture photodynamic therapy experiments. Scientific Reports. 2022;12:19341. doi: 10.1038/s41598-022-22020-7 [DOI] [PMC free article] [PubMed] [Google Scholar]
- 30. Adan A, Kiraz Y, Baran Y. Cell proliferation and cytotoxicity assays. Current Pharmaceutical Biotechnology. 2016;17:1213‐1221. doi: 10.2174/13892010176661608081605 [DOI] [PubMed] [Google Scholar]
- 31. Crouch SPM, Kozlowski R, Slater KJ, Fletcher J. The use of ATP bioluminescence as a measure of cell proliferation and cytotoxicity. Journal of Immunological Methods. 1993;160:81‐88. [DOI] [PubMed] [Google Scholar]
- 32. Kangas L, Grönroos M, Nieminen A. Bioluminescence of cellular ATP: a new method for evaluating cytotoxic agents in vitro. Medical Biology. 1984;62:338‐343. [PubMed] [Google Scholar]
- 33. Spring BQ, Rizvi I, Xu N, Hasan T. The role of photodynamic therapy in overcoming cancer drug resistance. Photochemical and Photobiological Sciences. 2015;14:1476‐1491. doi: 10.1039/c4pp00495g [DOI] [PMC free article] [PubMed] [Google Scholar]
- 34. Aniogo EC, Plackal Adimuriyil George B, Abrahamse H. The role of photodynamic therapy on multidrug resistant breast cancer. Cancer Cell International. 2019;19:91. doi: 10.1186/s12935-019-0815-0 [DOI] [PMC free article] [PubMed] [Google Scholar]
- 35. Celli JP, Solban N, Liang A, Pereira SP, Hasan T. Verteporfin‐based photodynamic therapy overcomes gemcitabine insensitivity in a panel of pancreatic cancer cell lines. Lasers in Surgery and Medicine. 2011;43:565‐574. doi: 10.1002/lsm.21093 [DOI] [PMC free article] [PubMed] [Google Scholar]
- 36. Yang Y, Li J, Yao L, Wu L. Effect of photodynamic therapy on gemcitabine‐resistant cholangiocarcinoma in vitro and in vivo through KLF10 and EGFR. Frontiers in Cell and Development Biology. 2021;9:710721. doi: 10.3389/fcell.2021.710721 [DOI] [PMC free article] [PubMed] [Google Scholar]
- 37. Wheeler DL, Dunn EF, Harari PM. Understanding resistance to EGFR inhibitors‐impact on future treatment strategies. Nature Reviews. Clinical Oncology. 2010;7:493‐507. doi: 10.1038/nrclinonc.2010.97 [DOI] [PMC free article] [PubMed] [Google Scholar]
- 38. Yap TA, Carden CP, Kaye SB. Beyond chemotherapy: targeted therapies in ovarian cancer. Nature Reviews. Cancer. 2009;9:167‐181. doi: 10.1038/nrc2583 [DOI] [PubMed] [Google Scholar]
- 39. Van Dam GM, Themelis G, Crane LMA, et al. Intraoperative tumor‐specific fluorescence imaging in ovarian cancer by folate receptor‐α targeting: first in‐human results. Nature Medicine. 2011;17:1315‐1319. doi: 10.1038/nm.2472 [DOI] [PubMed] [Google Scholar]
- 40. Kelemen LE. The role of folate receptor α in cancer development, progression and treatment: cause, consequence or innocent bystander? International Journal of Cancer. 2006;119:243‐250. doi: 10.1002/ijc.21712 [DOI] [PubMed] [Google Scholar]
- 41. Skubitz APN, Taras EP, Boylan KLM, et al. Targeting CD133 in an in vivo ovarian cancer model reduces ovarian cancer progression. Gynecologic Oncology. 2013;130:579‐587. doi: 10.1016/j.ygyno.2013.05.027 [DOI] [PMC free article] [PubMed] [Google Scholar]
- 42. Zhang J, Guo X, Chang DY, Rosen DG, Mercado‐Uribe I, Liu J. CD133 expression associated with poor prognosis in ovarian cancer. Modern Pathology. 2012;25:456‐464. doi: 10.1038/modpathol.2011.170 [DOI] [PMC free article] [PubMed] [Google Scholar]
- 43. Liu C‐F, Liu S‐Y, Min X‐Y, et al. The prognostic value of CXCR4 in ovarian cancer: A meta‐analysis. PLoS One. 2014;9:92629. doi: 10.1371/journal.pone.0092629.g001 [DOI] [PMC free article] [PubMed] [Google Scholar]
- 44. Sawada K, Radjabi AR, Shinomiya N, et al. c‐met overexpression is a prognostic factor in ovarian cancer and an effective target for inhibition of peritoneal dissemination and invasion. Cancer Research. 2007;67:1670‐1679. doi: 10.1158/0008-5472.CAN-06-1147 [DOI] [PubMed] [Google Scholar]
- 45. Richter CE, Cocco E, Bellone S, et al. High‐grade, chemotherapy‐resistant ovarian carcinomas overexpress epithelial cell adhesion molecule (EpCAM) and are highly sensitive to immunotherapy with MT201, a fully human monoclonal anti‐EpCAM antibody. American Journal of Obstetrics and Gynecology. 2010;203:582.e1‐582.e7. doi: 10.1016/j.ajog.2010.07.041 [DOI] [PMC free article] [PubMed] [Google Scholar]
- 46. Abu‐Yousif AO, Moor ACE, Zheng X, et al. Epidermal growth factor receptor‐targeted photosensitizer selectively inhibits EGFR signaling and induces targeted phototoxicity in ovarian cancer cells. Cancer Letters. 2012;321:120‐127. doi: 10.1016/j.canlet.2012.01.014 [DOI] [PMC free article] [PubMed] [Google Scholar]
- 47. Xue X, Liang XJ. Overcoming drug efflux‐based multidrug resistance in cancer with nanotechnology. Chinese Journal of Cancer. 2012;31:100‐109. doi: 10.5732/cjc.011.10326 [DOI] [PMC free article] [PubMed] [Google Scholar]
- 48. Emran TB, Shahriar A, Mahmud AR, et al. Multidrug resistance in cancer: understanding molecular mechanisms, Immunoprevention and therapeutic approaches. Frontiers in Oncology. 2022;12:891652. doi: 10.3389/fonc.2022.891652 [DOI] [PMC free article] [PubMed] [Google Scholar]
- 49. Robey RW, Steadman K, Polgar O, Bates SE. ABCG2‐mediated transport of photosensitizers: potential impact on photodynamic therapy. Cancer Biology & Therapy. 2005;4:187‐194. [PubMed] [Google Scholar]
- 50. Liu W, Baer MR, Bowman MJ, et al. The tyrosine kinase inhibitor imatinib mesylate enhances the efficacy of photodynamic therapy by inhibiting ABCG2. Clinical Cancer Research. 2007;13:2463‐2470. doi: 10.1158/1078-0432.CCR-06-1599 [DOI] [PubMed] [Google Scholar]
- 51. Casas A, Di Venosa G, Hasan T, Batlle A. Mechanisms of resistance to photodynamic therapy. Current Medicinal Chemistry. 2011;18:2486‐2515. [DOI] [PMC free article] [PubMed] [Google Scholar]
Associated Data
This section collects any data citations, data availability statements, or supplementary materials included in this article.
Supplementary Materials
Appendix S1. Supporting Information.