

Abstract
Mango, often regarded as the “king of fruits,” holds a significant position in Bangladesh’s agricultural landscape due to its popularity among the general population. However, identifying different types of mangoes, especially from mango leaves, poses a challenge for most people. While some studies have focused on mango type identification using fruit images, limited work has been done on classifying mango types based on leaf images. Early identification of mango types through leaf analysis is crucial for taking proactive steps in the cultivation process. This research introduces a novel multi-layer perceptron model called WaveVisionNet, designed to address this challenge using mango leaf datasets collected from five regions in Bangladesh. The MangoFolioBD dataset, comprising 16,646 annotated high-resolution images of mango leaves, has been curated and augmented to enhance robustness in real-world conditions. To validate the model, WaveVisionNet is evaluated on both the publicly available dataset and the MangoFolioBD dataset, achieving accuracy rates of 96.11% and 95.21%, respectively, outperforming state-of-the-art models such as Vision Transformer and transfer learning models. The model effectively combines the strengths of lightweight Convolutional Neural Networks and noise-resistant techniques, allowing for accurate analysis of mango leaf images while minimizing the impact of noise and environmental factors. The application of the WaveVisionNet model for automated mango leaf identification offers significant benefits to farmers, agricultural experts, agri-tech companies, government agencies, and consumers by enabling precise diagnosis of plant health, enhancing agricultural practices, and ultimately improving crop yields and quality.
Keywords: Mango leaf identification, Multi-layer perceptron (MLP), WaveVisionNet, Agricultural AI, MangoFolioBD dataset, Noise-resistant image analysis
Subject terms: Computer science, Mathematics and computing, Scientific data
Introduction
Global food scarcity is evident because of the growing population and the consequences of climate change worldwide. The population is expected to grow by  over the next five years, and the pressing need for food will influence the environmental, political, and economic system. According to the annual report of the International Food and Agriculture Organization (FAO), 193 million people have already suffered due to acute food shortages in 2021. Grains and fruits play a significant role in food nutrition1. Mango, famed for its exquisite taste, enjoys unprecedented popularity around the world, and Bangladesh is no exception. Surprisingly, Bangladesh has established itself as the world’s seventh-largest mango producer2. Because of its remarkable flavor and aromatic properties, Bangladeshi mangoes have gained fame in both domestic and international markets. Over the last three decades, this increase in mango farming has fostered the formation of a considerable number of mango-based industries across the country3.
Traditional agricultural approaches, in contrast, rely on homogeneity in parameters across crop areas. This assumption ignores the temporal and spatial variation that might occur within the field, where various areas may have different features or need particular management actions4. Farmers often treat the entire mango orchard as if it has equal conditions, forgetting the geographical and temporal diversity within the field. This assumption might result in inadequate resource allocation and a failure to tackle particular problems impacting different regions of the orchard. Furthermore, identifying the ideal time for harvesting mangoes is a hard issue for conventional agriculture due to the inherent heterogeneity in tree age and fruit ripening5. Without adequate data such as image data on the health and maturity of mango trees, cultivators may pick fruit too early or too late, leading to diminished quality and market value6. Furthermore, Consumers may have preferences for specific mango kinds based on features such as taste, texture, scent, and appearance7. Another important aspect of analyzing the understanding of the genetic diversity across different mango types is vital for breeding projects aimed at generating new cultivars with desirable features such as disease resistance, higher yield, or enhanced flavor8. Therefore, classifying mango leaves by variety improves genetic studies and breeding efforts by providing an indicator to precisely identify and characterize diverse genetic lineages. Manual classification of mango varieties is troublesome because of its subjective character, labor-intensive method, and susceptibility to human mistakes, which impedes efficient orchard management and reduces production quality. Furthermore, its limited scalability renders it unsuitable for large-scale mango farming operations, highlighting the necessity for automated classification methods.A lack of awareness about diverse mango leaf kinds can result in inadequate production practices, disease mismanagement, and variances in produce quality. Furthermore, incorrect labeling may lead to biodiversity loss, research constraints, and business issues in the mango industry9.
Deep Learning (DL), and Vision Transformers (ViT) models have shown substantial promise in upgrading many aspects of the agricultural sector. It is an approach that involves the use of a computer to make decisions based on many data inputs as images in the majority of instances. Pacal et al. in10 proposed an enhanced vision transformer model, adapted from the Multi-axis vision transformer (MaxViT), designed for accurate and speedy diagnosis of illnesses in maize leaves. The proposed model obtains a remarkable accuracy rate and surpasses all existing DL models, proving its effectiveness for practical applications in agriculture. Thai et al. in11 proposed a transformer-based model for prompt and precise detection of leaf illnesses, addressing the rising occurrence of such diseases driven by climate change and pollutants. The recommended Least Important Attention Pruning (LeIAP) algorithm and sparse matrix-matrix multiplication (SPMM) optimization methods significantly improve model performance by reducing size, speeding up assessment speed, and decreasing complexity, ultimately outperforming state-of-the-art models on the Cassava Leaf Disease Dataset. Fu et al. in12 developed an enhanced Vision Transformer (ViT) approach for automatic crop pest image recognition. By merging block partitioning and the self-attention mechanism, the methodology achieves high accuracy in categorizing crop diseases and pests, offering an efficient and objective alternative to manual and instrument-based methods.
Managing pest infestations in mango orchards is an extensive clinical task, especially when it comes to creating accurate methods for detecting infestations on mango leaves. Accurate identification would facilitate focused pest management measures, diminishing the need for wide-ranging pesticide usage and promoting ecologically friendly and economically viable farming methods. Furthermore, it is crucial to enhance precision agriculture methods by incorporating mango leaf detecting systems with drone and remote sensing technology. Integrating such systems would enable the effective surveillance of large orchards, enabling prompt and strategic decision-making to improve overall agricultural efficiency. To address these issues, our study introduces MangoFolioBD, a thoroughly curated dataset including 26 different mango types. Collected from four different mango farms in Bangladesh, this dataset contains a varied variety of mango leaf variants, permitting extensive research in classification. By covering real-world data, it sheds light on the practical issues in agriculture, emphasizing the need for labor-intensive preparation procedures. In response to the manual identification difficulty, we present our WaveVisionNet model. This lightweight model employs an proposed architecture incorporating Multi-Layer Perceptron (MLP) and convolution operations. It also combines a reinforced self-attention mechanism and a Residual Attention Block with Downsampling (RAD) for better performance capturing global and local context . The purpose of the RAD block is to enhance feature extraction by prioritizing important features and decreasing dimensionality by downsampling. By employing this method, WaveVisionNet is able to preserve a significant amount of intricate information and context, both on a global and local scale for identifying accurate lesions of mango leaf with different variants. Eventually, our efficient low-parameterized WaveVisionNet model considerably boosts the precision and efficiency of mango leaf classification methods in agricultural sectors, particularly advantageous for the large mango plantations in Bangladesh. Therefore our main contribution to our work:
To present our primary MangoFolioBD dataset, a large collection of 16, 646 high-resolution mango leaf pictures collected from several regions across Bangladesh. For our research, we collected mango leaves from 26 different types across several sites in Bangladesh and recorded high-resolution photos under controlled conditions to ensure data quality.
To propose an efficient MLP-based architecture, that incorporates attention mechanism and optimizes hyperparameters for accurate mango leaf classification. This self-attention mechanism helps the model weigh the relevance of various parts of the image, enabling it to capture intricate details and relationships that are crucial for accurate classification.Therefore, the WaveVisionNet outperforms other SOTA models in accuracy, precision, recall, and F1-Score.
Furthermore, our validation approach in this study involves two unique datasets. The freely accessible dataset is used for pretraining, which improves model generalization by learning it to a variety of characteristics. Then our primary dataset, the MangoFolioBD dataset is used for final training, adapting our WaveVisionNet model, particularly for mango leaf recognition in real-world field conditions adding layers of noise to the dataset for robustness, ensuring a complete and applicable validation method.
Materials and methods
Related work
The classification of mango leaf types holds significant importance within the agricultural industry, particularly in addressing the health and disease control of mango plants, which are among the most significant tropical fruits. Mango (Mangifera indica L.) leaves play a critical role in the overall health of the plant. Researchers have explored various approaches, both destructive and non-destructive, to identify mango and other leaf or disease varieties, focusing on variables such as disease detection, morphological traits, variety identification, and genetic analysis. Destructive techniques entail physically changing or destroying the sample to gather data. While this approach is effective for in-depth research, it can be resource-intensive and impracticable for large-scale or in-field assessments. Conversely, non-destructive techniques give the advantage of maintaining the sample, permitting continuing monitoring and large-scale application without harming the plant. Non-destructive testing (NDT) procedures, widely employed in science and innovation, analyze material, component, or system properties without inflicting internal damage13. When applied correctly, non-destructive techniques offer excellent results while protecting the material’s integrity, boosting product reliability, preventing accidents, and saving costs compared to destructive testing. Various non-destructive approaches have been applied in mango leaf categorization studies, including NIR spectroscopy, scanning laser vibrometry (SLV), X-ray CT, computer vision systems (CVS), image processing, electronic nose, RGB fiberoptic color sensor, and ultrasonic techniques. The section largely focuses on non-destructive techniques, offering descriptions of significant work and highlighting their contributions.
A review14 focuses on non-destructive procedures for the quality evaluation of mango, including mango leaves. Technologies such as near-infrared spectroscopy, and electronic noses have been investigated for analyzing quality criteria and without hurting the leaves. These approaches provide speedy, precise results and are particularly advantageous for postharvest quality monitoring and disease identification in a non-invasive way. The paper15 highlighted the relevance of soil analysis, highlighting improvements in proximal sensor technologies including pXRF and Vis-NIR spectroscopy. It covered stakeholder requirements for software solutions and proposed interactive visualizations for soil profile analysis utilizing pXRF data. Additionally, the study studied machine learning and DL methodologies for predicting soil attributes, introducing a state-of-the-art DL model dubbed RDNet. Overall, the project intended to improve soil health evaluation using efficient data analysis and prediction methods.
In paper16, the author’s primary objective aimed to design an effective solution for detecting tea leaf diseases by employing artificial intelligence, specifically the YOLOv7 model. To achieve this, they acquired a dataset of 4000 digital images of five types of leaf diseases from four known tea gardens in Bangladesh, which were subsequently manually annotated and supplemented. Through this strategy, the study intended to overcome the limitation of insufficient sample sizes by incorporating data augmentation approaches. Subsequently, the performance of the YOLOv7 model was thoroughly examined using statistical measures such as detection accuracy, precision, recall, mAP value, and F1-score, confirming its superiority over existing detection networks. Besides, the paper17 presents a novel approach employing a concatenated neural network incorporating information from VGG16 and AlexNet for pepper illness classification. By exploiting fully linked layers, the model attempts to boost the accuracy of disease identification from digital photographs of pepper plants. Through thorough validation, the proposed concatenated CNN model exhibits promising classification accuracy, showing its potential efficiency in diagnosing both leaf and fruit illnesses in pepper crops.
The research18 introduced a lightweight DL solution employing Vision Transformer (ViT) for real-time automated plant disease categorization. It incorporated ViT with standard Convolutional Neural Network (CNN) approaches and a hybrid CNN-ViT approach on numerous datasets. While ViT boosted accuracy, it slowed down forecasts. The study proposed combining attention blocks with CNN to balance accuracy and speed, providing useful insights for practical application in agriculture. In this study19, researchers studied the manufacture of biodiesel from non-edible Rumex crispus leaf oil using a nanocatalyst produced from mango seed shells. They examined the produced calcium oxide nanocatalyst using XRD, FTIR, and UV-Vis spectra to determine its structural patterns and functional groups. By applying Response Surface Methodology (RSM), they improved transesterification parameters such as methanol to oil molar ratio, catalyst loading, reaction temperature, and time, finding that catalyst loading was the most relevant parameter, resulting in a high biodiesel yield of 93.72%. The biodiesel produced fulfilled European Standard (EN) EN14214 criteria and showed promise as an alternative energy source, potentially lowering dependency on fossil fuels and encouraging sustainable energy consumption.
Besides, the study20 explored the integration of explainable artificial intelligence (AI) and hyperspectral imaging to evaluate sweet potato quality attributes like dry matter content, soluble solid sweet potato content, and firmness. Using a portable VNIR-HSI camera, the study achieved high predictive accuracy through advanced modeling techniques, including multivariate regression and SHapley Additive exPlanations (SHAP) values. By visualizing spatial distribution, this approach enhanced post-harvest assessment, promising improved product quality for consumers. However, in study21, the researchers employed a DL methodology, especially a ResNet-34-based Faster R-CNN, to classify diseases affecting tomato plant leaves. Their approach consists of three primary stages: producing annotations for suspected photos, utilizing ResNet-34 with a Convolutional Block Attention Module (CBAM) as a feature extractor, and training the Faster R-CNN model to identify and classify abnormalities in tomato plant leaves. The approach was assessed using the PlantVillage Kaggle dataset, and it achieved a high mean Average Precision (mAP) of 0.981 and an accuracy of 99.97% with a test time of 0.23 seconds. The results indicate that the system can perform well under different picture transformations and capturing situations, suggesting that it has the potential to replace manual systems in illness identification.
The paper22 presented the development of a DL system to address the problem of recognizing tomato plant diseases through the analysis of tomato leaf photos. The proposed technology provided a pragmatic answer for farmers by allowing disease categorization through straightforward image capture, eliminating the requirement for costly expert analysis. The approach utilized a Conditional Generative Adversarial Network (C-GAN) to generate artificial images. These synthetic images were then combined with actual tomato leaf images to train a DenseNet model.
The research23 offered an enhanced SE-YOLOv5 network model for identifying tomato virus infections, attempting to address the limitations of conventional approaches. It contained a squeeze-and-excitation (SE) module to increase feature extraction inspired by human visual attention mechanisms. Evaluation against existing models revealed improved performance in accuracy and mean average precision. The SE-YOLOv5 model had the potential to enhance disease detection and management in agricultural environments. An application was developed to accurately detect Grape and Mango Leaves. Besides, scholars have used AlexNET [pretrained CNN architecture] for feature extraction and detection. Using Matlab, the system was developed and provided an accuracy of  for Mango and
  for Grape Leaves24. On the other hand, the paper25 employed an automated technique built on DL to recognize leaf diseases in various mango plant species. Five different leaf diseases-anthracnose, alternaria leaf spots, leaf gall, leaf webber, and mango leaf burn-had been identified from 1200 images of both healthy and diseased mango leaves. With an accuracy of
  , the proposed CNN model accurately diagnoses leaf diseases in mango plants, suggesting that real-time model applications were possible. However, these studies did not imply any advanced deep-learning models for the spatial information of any images.
The proposed FrCNnet with the real dataset provided by Multan, Pakistan’s Mango Research Institute. The scholars compared the segmentation performance of the proposed model with the state-of-the-art models (Vgg16, Vgg-19, and Unet) that are currently on the market26. Furthermore, with a false negative rate (FNR) of  and segmentation accuracy of
  , the recommended model performs better than the other models. Their results suggested that the adoption of a FrCNnet could help the input image learn more focused and distinct characteristics, which would improve segmentation performance and aid in illness identification. However, to make the model robust in more real-life implementations, they did not focus on any noise addition process.
Several studies have focused on leveraging DL models for agricultural tasks, particularly in the classification of diseases affecting mango leaves. The study27 proposed a deep-learning hybrid model to classify mango leaf diseases, combining SVM and SGD. The method, based on the Basic Harumanis Mango Leaves 2021 Dataset, achieves a high accuracy rate which is crucial for agricultural productivity. Besides, the research28 developed a non-destructive, quick, and accurate approach for detecting rotting in mango seeds using digital and X-ray imaging. They examined 98 mature green mango fruits from Kintampo, Ghana, and trained a VGG16 Deep Convolutional Neural Network model. The model produced a large accuracy rate area, improving the quality of mango products in the postharvest supply chain. In study29, they developed a lightweight, accurate DL model using convolutions neural networks for identifying sick leaves in banana, guava, and mango fruit crops. The model achieved a fair accuracy rate of  , surpassing pre-trained models in accuracy and complexity. The study30 uses artificial neural networks (ANNs) to detect early disease on plant leaves using tiny disease blobs found in higher-resolution images. The technique uses a wrapper-based feature selection technique and a hybrid metaheuristic. Furthermore, in study31, the authors developed the Coyote Grey Wolf Optimization (CO-GWO) algorithm for automating disease identification and categorization in mango leaves. The model uses segmented images and a Neural Network classifier to enhance accuracy.
While the research community has made significant advancements in the automated recognition and categorization of crop leaves in a non-destructive way, there remains a pressing need for performance enhancement. This necessity occurs as a result of numerous circumstances. Firstly, present approaches generally lack robustness when dealing with distorted samples, which can significantly impair their accuracy. Secondly, they may struggle to adequately handle noisy pictures, decreasing their trustworthiness in actual applications. Additionally, further performance enhancements are necessary to ensure the method’s usefulness, particularly in circumstances involving considerable brightness changes in suspected samples. Moreover, extensive evaluation across a broad and diverse dataset is needed to assess the method’s performance across multiple scenarios appropriately. Table 1 has been generated to offer an overview of the tactics that have been deployed.
Table 1.
Overview of the existing related studies.
| Research | Study areas | Dataset | Data preprocessing used | Model used |
|---|---|---|---|---|
| 15 | Soil property classification | Primary soil profile dataset |

|
RDNet |
| 16 | Tea leaf disease detection | Primary dataset collected from tea gardens |

|
YOLOv7 |
| 17 | Pepper disease classification | Publicly available dataset |

|
CPD-CCNN |
| 18 | Plant disease classification | Public plant village dataset | × | Hybrid CNN vision transformer model |
| 20 | Sweetpotato quality assessment | Publicly available dataset |

|
Machine learning regression models |
| 21 | Tomato Plant leaf disease localization and classification | Public plant village dataset | × | Faster-RCNN |
| 22 | Tomato plant leaf disease detection | Publicly available dataset | × | DenseNet121 |
| 23 | Tomato Virus Disease Detection | Publicly available dataset |

|
YOLOv5 |
| 24 | Grapes and mango leaf disease detection | Publicly available dataset |

|
AlexNet |
| 25 | Mango leaf diseases identification | Self built mango dataset | × | CNN model |
| 26 | Mango leaf disease identification | Self built mango dataset |

|
FrCNnet |
| 27 | Mango leaf disease identification | Publicly available dataset |

|
Ensemble classifier-based model |
| 28 | Mango leaf disease identification | Self built mango dataset | × | VGG16 Deep Convolutional Neural Network |
| Proposed | Mango leaf classification | Primary collected mangoFolioBD dataset |

|
Improved WaveMLP+HDC+SA |
Material
In the presented framework, we have developed the classification process thoroughly validated using two independent datasets. The first dataset used is the freely available Indian Medicinal Leaf Dataset32, and the second is a privately maintained collection known as MangoFolioBD. The Medicinal Leaf Dataset is used to pre-train the proposed network weights. MangoFolioBD, on the other hand, is made up of several leaves of mango and is used for the final model training that is specifically modified for mango leaf identification in field situations.
Indian medicinal leaf dataset
This public dataset includes thirty different kinds of healthful medicinal plants, including Santalum album (Sandalwood), Muntingia calabura (Jamaica cherry), Plectranthus amboinicus/Coleus amboinicus (Indian Mint, Mexican mint), and Brassica juncea (Oriental mustard). The dataset, which has 1500 photos, includes forty species, each with 60–100 high-quality images. Ethical considerations were central to the gathering procedure, with rigorous attempts made to avoid harm to the plant’s natural state. Leaves were carefully picked from diverse plants of the same species in nearby gardens, with an emphasis on selecting healthy and mature leaves. Data was collected using a mobile camera (Model: Samsung S9+) and a printer (Model: Canon Inkjet Printer). Notably, the photos in the collection were intentionally rotated and tilted.
Due to the low size of the initial public dataset, we solve this constraint by adopting data augmentation approaches to increase dataset variability. Simultaneously, we divide the dataset into discrete training, testing, and validation folders. This organized technique ensures that enriched data is included in the training set, supporting the creation of a more robust machine-learning model. The segmentation into training, testing, and validation subsets gives a structure for evaluating the model’s performance on unseen data, contributing to the overall dependability and effectiveness of the learning process as shown in Table 2. The sample images are shown in Fig. 1.
Table 2.
Number of images in each class for train, test, and validation set of public medicinal leaf dataset applying augmentation.
| Class | Before | After | ||||
|---|---|---|---|---|---|---|
| Augmentation | Augmentation | |||||
| Train | Test | Val | Train | Test | Val | |
| Alpinia galanga | 40 | 5 | 5 | 130 | 56 | 28 |
| Amaranthus viridis | 97 | 13 | 12 | 335 | 153 | 105 |
| Artocarpus heterophyllus | 44 | 7 | 5 | 165 | 84 | 34 |
| Azadirachta indica | 48 | 6 | 6 | 164 | 72 | 58 |
| Basella alba | 82 | 11 | 10 | 286 | 124 | 100 |
| Brassica juncea | 27 | 4 | 3 | 89 | 47 | 20 |
| Carissa carandas | 59 | 4 | 7 | 99 | 214 | 99 |
| Citrus limon | 45 | 7 | 5 | 135 | 84 | 35 |
| Ficus auriculata | 40 | 5 | 5 | 150 | 66 | 41 |
| Ficus religiosa | 50 | 7 | 6 | 184 | 84 | 66 |
| Hibiscus rosa-sinensis | 34 | 5 | 4 | 124 | 78 | 23 |
| Jasminum | 56 | 8 | 7 | 192 | 75 | 61 |
| Mangifera indica | 49 | 7 | 6 | 185 | 85 | 48 |
| Mentha | 77 | 11 | 9 | 253 | 126 | 81 |
| Moringa oleifera | 61 | 9 | 7 | 214 | 92 | 68 |
| Muntingia calabura | 44 | 7 | 5 | 127 | 89 | 33 |
| Murraya koenigii | 48 | 6 | 6 | 177 | 82 | 59 |
| Nerium oleander | 49 | 7 | 6 | 162 | 66 | 56 |
| Nyctanthes arbor-tristis | 32 | 4 | 4 | 112 | 41 | 37 |
| Ocimum tenuiflorum | 41 | 6 | 5 | 151 | 78 | 43 |
| Piper betle | 38 | 6 | 8 | 115 | 79 | 46 |
| Plectranthus amboinicus | 38 | 6 | 8 | 120 | 71 | 37 |
| Pongamia pinnata | 48 | 8 | 7 | 166 | 77 | 64 |
| Psidium guajava | 52 | 7 | 6 | 152 | 89 | 61 |
| Punica Granatum | 63 | 9 | 7 | 204 | 94 | 68 |
| Santalum album | 31 | 7 | 8 | 186 | 90 | 46 |
| Syzygium cumini | 31 | 7 | 8 | 109 | 57 | 13 |
| Syzygium jambos | 44 | 7 | 5 | 152 | 87 | 50 |
| Tabernaemontana divaricata | 44 | 7 | 5 | 144 | 105 | 32 |
| Trigonella foenum-graecum | 28 | 5 | 4 | 103 | 70 | 22 |
| Total | 11194 | |||||
Fig.1.

Medicinal leaf dataset sample images (collected online).
MangoFolioBD dataset
For our research experiment, we collected Mango leaves from various varieties, specifically: African jumbo, Amrapali, Baaper Bari, Bari 4, Bari 7, Bari 8, Bari 9, Bari 11, Bari 13, Fazlee, Gopalvog, Harivanga, Himsagar, King Brunei, Lengra, Madhurani, Moriyam, Qzai, Red Palmer, Thai Banana Mango, Indian totapuri, Kacha Mitha, Philippine Honey Dew, Thai Moriyam, Sabira, and Tawani Red33. The photographs in our possession were obtained from several sources in Bangladesh, including SOAS Agro in Feni, Bangladesh Agricultural Research Institute in Rangpur, Brac Nursery in Demra, as well as several unidentified gardens in Rajshahi and Munshiganj. The photographs were obtained using several high-resolution cell phone cameras and were positioned on a pristine white surface. The dataset acquired included at least 300–700 images of each type of mango. The primary goal of this data-gathering expedition was to focus on the renowned mango trees. There are 16,646 raw leaves in all. A stand was used to maintain a uniform height of 1.5 feet above the leaves, ensuring that the entire image capture method was controlled. The images were taken during a time of clear weather during the midday hours, specifically between 11:30 a.m. and 3:00 p.m. The collection place and process are shown in Figs. 2 and 3.
Fig. 2.

Locations of mango orchards; (a) SOAS agro, (Feni) (b) Bangladesh Agricultural Research Institute (Rangpur), (c) Brac nursery (Demra), (d) Rajshahi division, (e) Munshiganj in Bangladesh selected for data collection.
Fig. 3.

Geographic locations of mango orchards in Bangladesh selected for data collection. The map was adapted from the disaster and climate risk information platform (DRIP), developed by the Center for Environmental and Geographic Information Services (CEGIS) under the Government of the People’s Republic of Bangladesh. Reproduced with permission. ©Government of the People’s Republic of Bangladesh. All Rights Reserved http://drip.plancomm.gov.bd/BasicMap/MapViewer.
During the data collection of these leaves, a rigorous and thorough procedure was followed to guarantee the accuracy and cleanliness of the raw leaf samples before they were included in the dataset. The method started with a thorough visual examination to identify any obvious contaminants, such as dust particles or debris, on the leaves. After the initial evaluation, a methodical dusting operation was used, employing delicate brushing techniques and controlled air blowing to carefully eliminate surface pollutants from the leaves. Afterward, the leaves were subjected to a thorough washing process to remove any remaining dirt or dust, carried out with great caution to maintain the samples’ structural integrity. After being washed, the leaves underwent controlled drying techniques, such as natural air drying and gentle rubbing with absorbent materials, to eliminate any remaining moisture. During the data collection process, precise quality control procedures were followed to ensure that the leaves fulfilled the predetermined standards of cleanliness and purity necessary for further analysis shown in Fig. 4.
Fig. 4.

Data collection process ensuring leaf sample accuracy and cleanliness. Visual examination, dusting, washing, and controlled drying techniques were employed.
With the raw leaves now properly prepared, a series of detailed photographs were captured, following a thorough drying process. These photographs were an essential foundation for the subsequent stages of the research, aiding in the training and optimization of the sophisticated deep-learning models Additionally, a few of the shots were captured under the illumination of linear light bulbs. The sample leaf images containing 26 classes are shown in Fig. 5. Our detailed data collection process and source are described in Table 3 and the dataset splitting into training, testing, and validation process are shown in Table 4.
Fig. 5.

Sample Images of our MangoFolioBD dataset (primary data).
Table 3.
MangoFolioBD data collection process.
| Specific subject area | Mango leaf variety classification |
| Type of data | Digital images having RGB color in PNG format |
| How the data were acquired | We examine a total of 26 distinct varieties of mango leaves that have a significant impact on mango trees. To gather data from several mango gardens throughout different regions of the country, four mango gardens in Bangladesh were chosen based on their dimensions and the diversity of tree species present. The leaf photographs were captured several days before the commencement of the summer season in 2023. The variety of the trees was repeatedly validated by agricultural experts. Following the collection of the leaves, individual photographs of each leaf were obtained using a cell phone camera on a white background. Approximately 16, 000 plus pictures were captured in all. We further reshaped the images into  pixels pixels |
| Description of data collection | Throughout the data collection process, utmost care and consideration were exercised to ensure the preservation of the mango trees and their blossoms. Therefore, the ideal time for leaf collecting was meticulously determined to be during the initial weeks of February and March. These months were deemed optimal to avoid any detrimental effects on the trees or their precious mango blooms. Raw leaves were thoroughly cleaned and dried to improve the accuracy and precision of the model training. The resulting detailed photographs served as a foundation for training and optimizing the sophisticated model. |
| Data source location and Geographical location | The following four mango orchards in Bangladesh are used for data collection: 1.SOAS Agro (Feni) 2. Bangladesh Agricultural Research Institute (Rangpur) 3. Brac Nursery (Demra) 4. Rajshahi Division 5. Munshiganj shown in Figs. 2 and 3. |
Table 4.
Number of images in each class for train, test, and validation sets of Our MangoFolioBD dataset.
| Class | Num. of images | Train | Test | Validation |
|---|---|---|---|---|
| African Jambo | 602 | 481 | 61 | 60 |
| Aprupali | 600 | 480 | 60 | 60 |
| Baper Bari | 600 | 480 | 60 | 60 |
| Bari 11 | 615 | 492 | 62 | 61 |
| Bari 13 | 522 | 417 | 53 | 52 |
| Bari 4 | 617 | 493 | 63 | 61 |
| Bari 7 | 608 | 486 | 62 | 60 |
| Bari 8 | 500 | 400 | 50 | 50 |
| Bari 9 | 611 | 488 | 62 | 61 |
| Fazlee | 608 | 486 | 62 | 60 |
| Gopal Vog | 987 | 789 | 100 | 98 |
| Haribhanga | 600 | 480 | 60 | 60 |
| Him Sagor | 438 | 350 | 45 | 43 |
| Indian Totapori | 727 | 581 | 74 | 72 |
| Kacha Mitha | 846 | 676 | 86 | 84 |
| King Breunei | 612 | 489 | 62 | 61 |
| Lengra | 366 | 292 | 38 | 36 |
| Maryam | 1182 | 945 | 119 | 118 |
| Modhurani | 600 | 480 | 60 | 60 |
| Phillipine Honey Dew | 708 | 566 | 72 | 70 |
| Qzai | 810 | 648 | 81 | 81 |
| Red Palmar | 414 | 331 | 42 | 41 |
| Sabira | 624 | 499 | 63 | 62 |
| Taiwani Red | 354 | 283 | 36 | 35 |
| Thai Banana Mango | 613 | 490 | 62 | 61 |
| Thai Moryam | 882 | 705 | 89 | 88 |
| Total | 16,646 | 13122 | 1675 | 1691 |
Image preprocessing
Effective data preprocessing is critical in the context of training DL models, especially when dealing with self-collected image data with varying orientations. This critical step includes numerous vital operations, such as resolution standardization and the use of augmentation techniques like rotation and flipping. Furthermore, noise and blur are introduced to improve the implementation of SOTA and proposed models. To assess the robustness of our proposed model, we use a variety of data augmentation and picture enhancement methods for the private MangoFolioBD dataset.
We have incorporated multiple augmentation approaches into our MangoFolioBD dataset using a single function, with the goal of improving the resilience of the model. In this function, we fulfill total coverage by implementing picture rotation with a probability of 100%. In addition, the technique of horizontal flipping is used to enhance the diversity of training data by mirroring images. To increase the variety of the dataset, random modifications to the brightness and contrast are implemented, which contribute to the augmentation process.
Noise addition process
To evaluate the resilience of our system in identifying mango leaves in the field, we include six levels of noise into the testing set to imitate common image fluctuation in the natural environment. Gaussian Noise, Laplacian noise, Poisson Noise, Pepper noise, Salt and Pepper Noise, and Speckle noise are used to utilize six types of noise. The goal of this study is to create a lightweight network capable of detecting mango leaves in a complicated environment with various types of noise such as sunshine, dust, dirt, and so on. Figure 6 illustrates our data augmentation and noise addition process to our primary data for increasing the robustness of our model.
Fig. 6.

Data augmentation and noise addition pipeline for our MangoFolioBD dataset.
Gaussian noise
Gaussian noise is a statistical noise that is widely inserted into picture functions for various applications. It is defined by a probability density function that follows the normal distribution. The noise is created by adding a random Gaussian function into the image, which results in a bell-shaped probability distribution function with a mean of 0 and a standard deviation (sigma) of 134. Adding Gaussian noise simulates real-world settings in which natural changes and sensor noise influence image quality. It allows testing the efficacy of image augmentation and denoising algorithms to ensure they can properly manage normal variations.
Laplace noise
Later those images go through the Laplace-distributed noise with a particular scale parameter. The generated noise is added to the original image, and the resulting noisy image is trimmed to ensure pixel values stay within the valid range of 0–25535. Laplace noise, which has longer tails than Gaussian noise, is excellent for assessing algorithms’ robustness to outliers and abrupt changes in intensity. It aids in assessing the resilience of image processing systems in situations where such variations are widespread, such as edge identification and picture segmentation tasks.
Possion noise
In this approximation, both the mean and variance of the Gaussian distribution are set equal to the mean of the Poisson random variable, represented as  . The aforementioned approximation enables the creation of Poisson noise by sampling from a normal distribution
  . To accomplish this, it is possible to adjust the standard deviation of the normal distribution by taking the square root of
  and subsequently introducing the resulting noise into the image36. Here,
  is the average value of the Poisson distribution. This method utilizes the Gaussian approximation to replicate Poisson noise in cases where the average is significantly high. Here poisson noise testing is critical for algorithms meant to function in low-signal situations, as it ensures that they can sustain performance as the signal-to-noise ratio drops.
Pepper noise
The inclusion of random dark pixels (with a pixel value of 0) throughout an image is what defines Pepper Noise. This sort of noise can occur during image acquisition or transmission, resulting in undesired artifacts. Understanding the causes and consequences of pepper Noise is critical for developing appropriate preprocessing solutions to reduce its negative impact on image quality25.Pepper noise primarily examines the algorithm’s capacity to recover information from images distorted by such discrete and stark aberrations, which can significantly impact the image’s quality and usefulness.
Salt and pepper noise
The presence of both random bright pixels (with a pixel value of 255) and random dark pixels (with a pixel value of 0) in an image is combined in Salt and Pepper Noise. This noise type presents a dual problem since it contains both high-intensity outliers and low-intensity disruptions to the image25.Salt and Pepper Noise is primarily used to assess the resilience of filtering and denoising algorithms in handling both extremes of pixel intensity variations, which is critical for preserving image integrity in noisy situations.
Speckle noise
Speckle Noise is a granular disturbance that frequently afflicts optical and digital holography. It is created by multiplying random pixel values with distinct pixels in an image, posing a unique noise reduction problem37. Simulating speckle noise in tests allows us to evaluate the effectiveness of algorithms in enhancing image quality under settings that are similar to real-world imaging systems influenced by coherent light scattering.
Methodology
Our research aims to construct an appropriate model for distinguishing leaf differences in real-world farming conditions. To do this, we focus on training our proposed model along with other SOTA models in one public dataset for the pretraining phase and implementing it on our primary MangoFolioBD Dataset. We introduce our proposed WaveVisionNet model defines as a precise and efficient model that combines many techniques to accurately categorize mango leaves. The model incorporates attention processes, multi-layer perceptrons (MLPs), and convolutional neural networks (CNNs), and is built upon an enhanced WaveMLP architecture. For the performance evaluation, we assess our model using various metrics, including accuracy, recall, precision, AUC, and Cohen’s Kappa. In addition before training, We apply necessary data augmentation techniques in both datasets as increasing the number of images in the public dataset and add different variations, and rotations in our MangoFolioBD Dataset.The overall process pipeline is shown in Fig. 7.
Fig. 7.

The overall technical path of this study and WaveVisionNet architecture.
The existing DL models for leaf disease recognition
Our research aims to create an accurate model for identifying different types of leaves in real agricultural settings. We have extensively studied advanced models that have been recognized for their reliable performance on various datasets. The focus of our analysis is mostly on assessing the performance of ConvNeXtLarge, ConvNeXtBase, InceptionResNetV2, VGG16, Improved SwinV2, Coatnet, and MaxViT, in comparison to our proposed WaveVisionNet model as referenced in38–43. The stated models span both CNNs and Vision Transformer (ViT) architectures. Notably, ConvNeXtLarge, ConvNeXtBase, InceptionResNetV2, and VGG16 have been established under DL models, while Improved SwinV2, Coatnet, and MaxViT, fall under the ViT models. Our focus is to assess the robustness and compatibility of our proposed WaveVisionNet with SOTA models.
WaveVisionNet
In this study, we present WaveVisionNet, a novel lightweight hybrid model that combines attention mechanisms, MLP, and CNN for accurate mango leaf categorization. WaveVisionNet’s core architecture is derived from WaveMLP, more precisely from the WaveMLP variation44. This architectural decision is essential to giving the model the ability to extract hierarchical features. Here the WaveMLP architecture is refined and processed through four stage blocks given an input tensor  , where
  ,
,  , and
, and  denote height, width, and channels, respectively. In our architecture, the proposed block is abbreviated as “RAD Block” (Residual Attention Block with Downsampling) for handling the self-attention operations, and residual connections along with reshaping our input tensors by applying Hybrid Dilated Convolution (HDC) operations.
Here self-attention methods for latent feature extraction are incorporated in the first three blocks, which concentrate on each pixel of data while taking into account all possible edge cases. We apply an HDC to improve the receptive field after the input tensor is passed through the fourth stage residual block. To successfully capture multiscale characteristics.Here, the HDC consists of consecutive convolutional layers with variable dilation rates. The custom head, which is made up of flattened and dense layers, a self-attention module, and 2D positional encoding is added to the base model. The feature interactions are improved by the self-attention mechanism, and spatial information is introduced by positional encoding.
Wave-MLP
In this section, we explore over the base model Wave-MLP model in depth. The core components of this model are channel-mixing MLP and the phase-aware token mixing module (PATM), which represents each token as a wave and aggregates them by simultaneously considering amplitude and phase. The full model is formed by stacking phase-aware token-mixing blocks, channel-mixing MLPs, and normalization layers.
Channel-mixing MLP
An MLP-like model is distinguished by its neural architecture, which consists primarily of fully connected layers and non-linear activation functions. In the case of the vision MLP, the initial step includes partitioning an image into multiple patches or tokens. The following feature extraction procedure primarily defines two critical components: token-FC and channel-FC. Here denoting the intermediate feature as  , where mainly each tokens,
  , is a vector of dimension
  . The channel-FC is mathematically expressed as:
 |
1 |
where  mainly depicts the weight matrix containing trainable parameters. It’s worth noting that the channel-FC functions independently on each token, allowing for the extraction of distinguishing characteristics.
Phase-aware token mixing
Furthermore, in our core the Wave-MLP model, a token generally takes the form of a wave, denoted as  , embodying both amplitude and phase:
 |
2 |
where,  points as the imaginary unit (
 ),
),  depicts the absolute value and
  focuses element-wise multiplication operation. The amplitude referred to
  as a real-valued feature encapsulating the importance of each token while
  illustrates a periodic function with elements operation consistently in a normalized unit magnitude. The variable
  defines the phase denoting the present position of the token within a wave period. This integration of amplitude and phase attributes each token
  within the complex-value domain. When combining different forms of tokens, the phase term
  influences the superposition modes. Assuming
  as the aggregated result of wave-like tokens
  defining its amplitude
  and phase
  that can be calculated and mathematically expressed as:
 |
3 |
 |
4 |
RAD block
In our WaveVisionNet architecture, “RAD Block” (Residual Attention Block with Downsampling) is the proposed block’s abbreviation. This block is designed to process incoming data, apply self-attention if provided, perform HDC operations with batch normalization and ReLU activation, and finally integrate a residual connection. The block concludes with max-pooling downsampling.
Attention mechanism
The self attention layer45, here regarded as an essential component of WaveVisionNet, is mathematically defined as follows. Here considering an input tensor  , three learnable weight matrices
  are proposed. Here,C indicates the quantity of channels contained in the input tensor X. The queries (
 ), keys (
 ), and values (
 ) are computed as linear projections applying cosine similarity :
 |
5 |
 |
6 |
 |
7 |
where,  and
and  depict the spatial dimensions, and
  display the channel dimension of the image matrix for our classification task.This self-attention process is used iteratively across several phases in the RAD block to enhance the feature representation in our WaveVisionNet model.
Positional encoding
To augment the model’s understanding of spatial information, positional encoding is introduced. The positional encoding tensor ( ) is dynamically assigned and incorporated into the input tensor (
 ) element-wise, producing the output tensor. The dynamic nature of the positional encoding enables the model to adapt its spatial awareness during training.
Residual blocks
The usage of Residual Blocks is advantageous for local context modeling46. Each residual block is made up of two convolution layers connected by a skip link. Notably, the number of filters in these convolution layers is determined dynamically based on the geometry of the input. This dynamic decision allows for greater adaptability of the model to changing input dimensions. The convolutional layer formula reflects this adaptability, where the number of filters is denoted by the parameter  . The formula is expressed as follows:
 |
8 |
where,  displays the output at position
  ,
,  and
and  defining the
  -th filter and input channel respectively. Here
  defines the bias term. This formulation allows for a flexible and responsive method of modeling the local context, which is essential for handling different input types in a residual block architecture.
HDC
Using a small convolutional kernel size in conjunction with a small receptive field invariably results in the partial deletion of broader global information, reducing the efficacy of identifying larger lesions in leaf disease recognition. Yu et. el47 used multiple dilated convolutions (DC) with exponential growth dilation rates (e.g., 2, 4, 8, etc.) to augment the receptive field, achieving state-of-the-art (SOTA) performance in semantic segmentation. However, the utilization of DC produces a negative gridding effect, which is especially problematic for pixel-level applications such as leaf image identification, where certain small lesions present issues. We propose our Hybrid Dialted Convoluton (HDC) module to mitigate the adverse effects of gridding48, as presented by Wang et al defining the dilation rates of 2 and 3 strategically positioned at the network’s lower layers. This unique technique attempts to reduce the gridding effect while keeping the benefits of dilated convolutions for improved leaf image identification. The first convolutional layer has a kernel size of (3, 3) and a dilation rate of (2, 2), and the second has a kernel size of (3, 3) and a dilation rate of (3, 3). These dilated convolutions allow the network to broaden its receptive field, allowing it to recognize patterns at various spatial scales. The activations are normalized using batch normalization, and the rectified linear unit (ReLU) activation function improves nonlinearity. This HDC technique is included in a bigger operation, especially each stage blocks function, and is applied repeatedly across numerous blocks to incrementally strengthen the feature representation while allowing for downsampling using max-pooling. We apply max pooling to successfully minimize the spatial dimensions of the feature map, therefore enabling down sampling. The difference between the DC and HDC and their working process are shown in Fig. 8a,b.
Fig. 8.
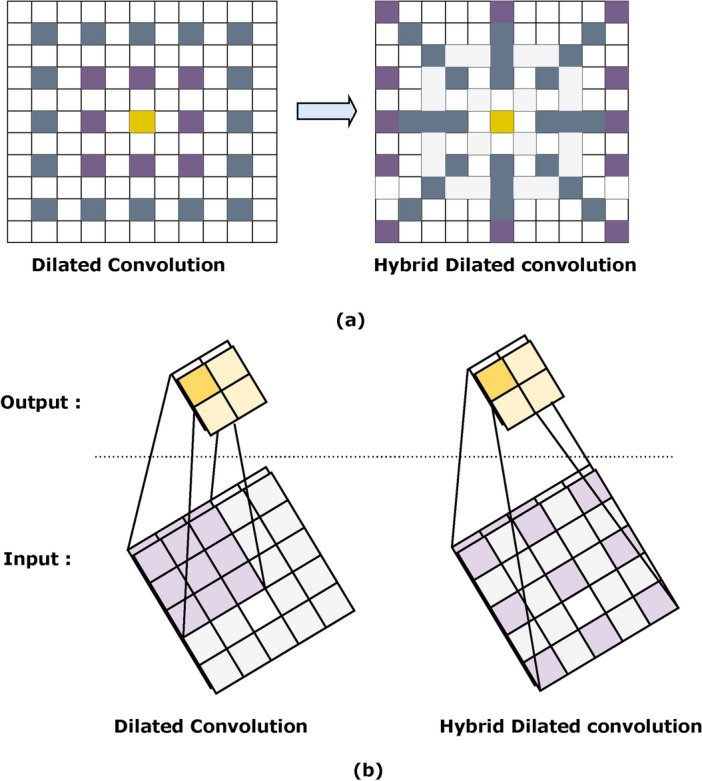
The working mechanism and receptive field of (a), ( b) dialated convolution (DC) and HDC with dilation rates of (3,3) and (2,2).
 |
9 |
where the output of the dilation convolution at a given position (u, v) that is denoted by Y(u, v). This output here is mainly derived from the input signal X(u, v) that mainly defines the signal at the corresponding position. The convolution kernel which is denoted by K(m, n) operates at spatial coordinates (m, n). Here its dimensions are represented by M and N. The convolution operation which is mainly defined by “*,” covers the mathematical process. The dilation rate, denoted as d is a parameter influencing the convolution.
(9) simplifies to conventional convolution. This full set of elements characterizes the dilation convolution process’s dynamics, demonstrating its components and their functions in feature extraction.
 |
10 |
 |
11 |
where  and
and  mainly display output at different dilation coefficients where
  represents the ReLU function;
  and
and  referred as are convolutional kernel weights. In this alternative representation, M and N both serve as the dimensions of the convolutional kernel. And it offers a clearer understanding of the feature extraction process in terms of the convolution operation and dilation coefficients.
Custom head for classification
WaveVisionNet’s custom head provides significant to image classification by refining and improving the hierarchical feature representation gained from previous layers. The introduction of a self-attention mechanism in the first three phases enables the model to focus on critical regions while still capturing global and local contextual information. This process allows the network to focus on specific elements, boosting its capacity to comprehend complex visual patterns. In the last stage, the use of residual blocks with skip connections refines the feature representation further, boosting information flow and minimizing vanishing gradient concerns. By intelligently integrating self-attention and residual blocks, the custom head improves the model’s ability to extract selective features, resulting in increased performance for our leaf classification tasks.
Flatten and dense layers
To prepare the feature maps for downstream processing, the tensor  undergoes flattening followed by a series of custom dense layers. This stage, expressed as
  and
and  which enables the extraction of higher-level abstract features. The dense layers introduce non-linear changes, which improve the model’s ability to recognize complex visual patterns.
2D positional encoding
To improve spatial information, 2D positional encoding is used. The tensor  is enriched with positional information which is designated as
  that is obtained by adding positional encoding to
  . This dynamic positional encoding provides the model with a learned spatial context. This component also allows it to adjust its awareness throughout the training process.
Final dense layer
In the last stage, a dense layer is used to transform the model’s output from the refined and enhanced feature representation . Specifically,
  which is created by applying the dense operation on
  This dense layer generates the final output. That feature is typically followed by an activation function modified to the task by applying softmax for our leaves classification task to add nonlinearity. Our proposed WaveVisionNet architecture is shown in Fig. 9.
Fig. 9.

Schematic overview of WaveVisionNet architecture for mango leaf categorization. The model enhances classification tasks by incorporating hierarchical feature extraction, attention mechanisms, and positional encoding, with self-attention applied initially and hybrid dilated convolution for enhanced receptive field.
Performance evaluation
The efficacy of each model has been scrutinized with a variety of performance evaluation metrics. To ensure that the models’ proficiency is meticulously examined, evaluation metrics include accuracy curves, confusion matrices, classification reports, and Area under the ROC Curve(AUC) scores, Cohen Kappa, and inference times of all models. The accuracy curve shows the model’s best attainable accuracy, and its linearity indicates its capability as a classification model. If the line is seamless, the classifier is more appropriate. By comparing the actual labels with the anticipated class identifiers, the confusion matrix makes it easy to monitor the models’ accuracy and mistakes.
The precision (P) is here defined as the proportion of accurately predicted outcomes compared to the number of positive instances. In other words, it measures forecast accuracy and can be expressed mathematically as follows.
 |
12 |
The recall (R) measure is calculated by dividing the number of desired results by the number of initial class evaluations.
 |
13 |
The F1-score is an individual metric computed by averaging precision and recall.
 |
14 |
where  =is the true positive,
  is the false positive,
  is the false negative, and
  is the true negative.
The Cohen Kappa result can be explained as follows: values 0 denote no agreement, 0.01–0.20 indicate no to little agreement, 0.21–0.40 indicate reasonable agreement, 0.41–0.60 indicate moderate agreement, 0.61–0.80 indicate substantial agreement while 0.81–1.00 denote almost perfect agreement.
 |
15 |
where the observed agreement, or  , is the percentage of instances in which both raters concur and the expected agreement, or
  , is the percentage of occurrences in which both raters would be anticipated to agree purely by chance.
The AUC score indicates the area under the Receiver Operating Characteristic (ROC) curve, which is a graphical representation of the model’s performance as the discrimination threshold is modified. It assesses the model’s overall ability to discriminate between the two classes (positive and negative) across different threshold levels. AUC of 0.5 implies random performance, whereas AUC of 1.0 represents perfect discrimination.
In the above set of equations,  is True Positive,
  is False Positive,
  is False Negative, and
  is True Negative.
Experimental setup
Our experimental setup is designed to maximize the efficiency and performance of our model training and evaluation procedure. Below is a brief summary of the essential components:
Hardware configuration
We performed our tests on a Windows 11 PC with an NVIDIA GeForce RTX 3080 Ti GPU and 16 GB of memory. This high-performance GPU speeds up deep learning activities by processing massive datasets and complex models efficiently. The system incorporates an AMD Ryzen
 9 5900X CPU with 12 cores and 24 threads to allow quick data processing and complement the GPU during model training.
Software environment
TensorFlow 2.11.0, a deep learning framework that supports neural network training and is tuned for contemporary hardware, ensures effective resource utilization.
Regularization and optimization techniques
To reduce overfitting, a 0.5 dropout rate is used during training. We also utilize L1 and L2 kernel regularization to manage model complexity, encouraging sparsity and reducing overfitting by penalizing excessive weights.
Learning rate and activation function
The Rectified Linear Unit (ReLU) activation function is employed for its ability to reduce the vanishing gradient problem and promote faster convergence. A learning rate of 0.000031 is specified to balance convergence speed and training stability, ensuring the model learns successfully without overshooting the optimal solution. All component names that are used are shown in Table 5. Each component is carefully designed to increase model adaptability and reduce overfitting, offering a balanced environment for constructing strong models.
Table 5.
Summary of experimental setup.
| Experimental setup | |
|---|---|
| Operating system | Windows 11 |
| GPU accelerators | NVIDIA® GeForce RTX 3080 Ti |
| CPU | AMD Ryzen™ 9 5900X |
| DL framework | TensorFlow 2.11.0 |
| Dropout rate | 0.5 |
| Regularization techniques | L1 and L2 kernel regularization |
| Optimizer | Rectified linear unit (ReLU) |
| Learning rate | 0.000031 |
Result analysis
Medicinal dataset
For examining the results in the public dataset of all SOTA models and our WaveVisionNet model, the presented Tables 6 and 7 offer a comparative examination of different models’ performance, including ConvNeXtLarge, ConvNeXtBase, InceptionResnetV2, VGG16, Improved SwinV2, Coatnet, MaxViT, and our WaveVisionNet model, on Medicinal Dataset under two conditions defined as without noise and with noise. In the “Without Noise” scenario, the WaveVisionNet model displays superior performance across multiple measures, earning the better accuracy (98.90%), precision (97.81%), recall (97.24%), F-1 score (95.01%), the area under the curve (AUC) (97.76%), and Cohen’s kappa (CK) (96.61%). Notably, the WaveVisionNet model beats all other models in this scenario. In the “With Noise” scenario, the WaveVisionNet model again displays great performance, delivering the highest accuracy (96.11%), precision (94.25%), recall (94.13%), F-1 score (91.23%), AUC (94.61%), and CK (93.42%) among the evaluated models. These results reveal that the proposed WaveVisionNet model retains strong performance even in the presence of noise, showing its effectiveness and reliability for our public dataset classification applications.
Table 6.
Performance analysis of all models with our proposed wavevisionnet model on medicinal dataset (public data).
| Without noise | ||||||
|---|---|---|---|---|---|---|
| Model | Acc (%) | Precision | Recall | F-1 | AUC | CK |
| ConvNeXtLarge | 0.8227 | 0.8811 | 0.7560 | 0.8134 | 0.9947 | 0.8153 |
| ConvNeXtBase | 0.8152 | 0.8153 | 0.7408 | 0.8137 | 0.9952 | 0.8131 |
| InceptionResnetV2 | 0.6727 | 0.9693 | 0.5793 | 0.6155 | 0.9654 | 0.6212 |
| VGG16 | 0.8527 | 0.8720 | 0.7501 | 0.8221 | 0.9610 | 0.8275 |
| Improved SwinV2 | 0.9478 | 0.9614 | 0.9656 | 0.9460 | 0.9541 | 0.9456 |
| Coatnet | 0.9414 | 0.9305 | 0.9615 | 0.9126 | 0.9725 | 0.9402 |
| MaxViT | 0.9413 | 0.9572 | 0.9313 | 0.9434 | 0.9456 | 0.9555 |
| WaveVisionNet | 0.9890 | 0.9781 | 0.9724 | 0.9501 | 0.9776 | 0.9661 |
Table 7.
Performance analysis of all models with our proposed WaveVisionNet model on medicinal dataset (public data).
| With noise | ||||||
|---|---|---|---|---|---|---|
| Model | Acc (%) | Precision | Recall | F-1 | AUC | CK |
| ConvNeXtLarge | 0.8023 | 0.8520 | 0.7231 | 0.8135 | 0.9351 | 0.8153 |
| ConvNeXtBase | 0.7132 | 0.7822 | 0.7216 | 0.7927 | 0.9731 | 0.7610 |
| InceptionResnetV2 | 0.6410 | 0.9432 | 0.5571 | 0.5813 | 0.9410 | 0.6023 |
| VGG16 | 0.8132 | 0.8831 | 0.7522 | 0.8121 | 0.9613 | 0.8013 |
| Improved SwinV2 | 0.9214 | 0.9101 | 0.9114 | 0.8951 | 0.9132 | 0.9023 |
| Coatnet | 0.9208 | 0.9123 | 0.9023 | 0.9054 | 0.9012 | 0.9113 |
| MaxViT | 0.9012 | 0.9231 | 0.9051 | 0.9023 | 0.9332 | 0.9223 |
| WaveVisionNet | 0.9611 | 0.9425 | 0.9413 | 0.9123 | 0.9461 | 0.9342 |
MangoFolioBD result
Now in terms of assessing performance in our primary dataset, Fig. 10a displays the AUC scores of the top three models, with special emphasis on our WaveVisionNet, which demonstrates better performance by consistently earning high scores AUC of 0.99. The reported AUC scores demonstrate the model’s precise abilities, demonstrating its ability to reliably differentiate between the various classes. The confusion matrix shown in Fig. 10b here allows for an in-depth examination of how effectively the model distinguishes between various leaf categories for numerous mango leaf classes in our primary dataset. The matrix’s diagonal elements reflect successful predictions, highlighting occasions where the model correctly identifies a leaf class.
Fig. 10.

(a) ROC curves illustrating the performance of the top three models. (b) Confusion matrix depicting the assessment of our WaveVisionNet model across training iterations on the MangoFolioBD dataset.
Furthermore, our experiments are assessed to offer a comparative comparison of different models’ performance, including ConvNeXtLarge, ConvNeXtBase, InceptionResnetV2, VGG16, Improved SwinV2, Coatnet, MaxViT, along with our WaveVisionNet model, on the MangoFolioBD dataset under two conditions: without noise and with noise showed in Tables 8 and 9. In the “Without Noise” scenario, the WaveVisionNet model exhibits excellent performance across numerous measures, earning the fair accuracy (97.23%), precision (97.10%), recall (96.15%), F-1 score (95.44%), area under the curve (AUC) (98.31%), and Cohen’s kappa (CK) (96.12%). Notably, the WaveVisionNet model beats all other models in this scenario. In the “With Noise” scenario, the WaveVisionNet model retains great performance, delivering the highest accuracy (95.21%), precision (92.25%), recall (94.02%), F-1 score (91.12%), AUC (94.60%), and CK (91.31%) among the compared models. These results demonstrate the robustness and effectiveness of our proposed WaveVisionNet model in our primary collected MangoFolioBD dataset, even in the presence of noise, indicating its potential for practical applications in real-world scenarios.
Table 8.
Performance analysis of all models with our proposed WaveVisionNet model on MangoFolioBD dataset (primary collected data).
| Without noise | ||||||
|---|---|---|---|---|---|---|
| Model | Acc (%) | Precision | Recall | F-1 | AUC | CK |
| ConvNeXtLarge | 0.6163 | 0.8686 | 0.4073 | 0.5825 | 0.9504 | 0.5989 |
| ConvNeXtBase | 0.3227 | 0.9195 | 0.0407 | 0.2551 | 0.8506 | 0.2903 |
| InceptionResnetV2 | 0.2704 | 0.4000 | 0.0060 | 0.2902 | 0.6028 | 0.1497 |
| VGG16 | 0.6125 | 0.9151 | 0.3231 | 0.5513 | 0.9213 | 0.5646 |
| Improved SwinV2 | 0.1297 | 0.2397 | 0.1297 | 0.2162 | 0.1484 | 0.1383 |
| Coatnet | 0.9525 | 0.9405 | 0.9515 | 0.9411 | 0.9786 | 0.9503 |
| MaxViT | 0.9572 | 0.9484 | 0.9472 | 0.9527 | 0.9789 | 0.9454 |
| WaveVisionNet | 0.9723 | 0.9710 | 0.9615 | 0.9544 | 0.9831 | 0.9612 |
Table 9.
Performance analysis of all models with our proposed WaveVisionNet model on MangoFolioBD dataset (primary collected data).
| With noise | ||||||
|---|---|---|---|---|---|---|
| Model | Acc (%) | Precision | Recall | F-1 | AUC | CK |
| ConvNeXtLarge | 0.5910 | 0.8471 | 0.3851 | 0.5610 | 0.9321 | 0.5721 |
| ConvNeXtBase | 0.3014 | 0.9023 | 0.0213 | 0.2232 | 0.8213 | 0.2711 |
| InceptionResnetV2 | 0.2512 | 0.3622 | 0.0050 | 0.2613 | 0.5514 | 0.1252 |
| VGG16 | 0.6013 | 0.9032 | 0.3121 | 0.5312 | 0.9004 | 0.5322 |
| Improved SwinV2 | 0.1061 | 0.2041 | 0.1052 | 0.1951 | 0.1554 | 0.1261 |
| Coatnet | 0.9113 | 0.9211 | 0.9421 | 0.9021 | 0.9341 | 0.9103 |
| MaxViT | 0.9241 | 0.9202 | 0.9151 | 0.9013 | 0.9051 | 0.9021 |
| WaveVisionNet | 0.9521 | 0.9225 | 0.9402 | 0.9112 | 0.9460 | 0.9131 |
Fig. 11a,b depicts all model performance through validation accuracy where our WaveVisionNet model shows better performance than other SOTA models. Besides, Fig. 12a,b demonstrates our WaveVisionNet model’s superior performance in all evaluation metrics.
Fig. 11.

(a) Validation accuracy curves showcasing the performance of all models utilizing the WaveVisionNet model architecture on the public dataset. (b) Validation accuracy curves illustrating the performance of all models utilizing the WaveVisionNet model architecture on the MangoFolioBD dataset.
Fig. 12.

Overall performance metrics evaluation on medicinal leaves dataset (a) (public) and MangoFolioBD dataset (b) (private).
Robustness comparison and analysis
The fundamental purpose of this study is to construct a lightweight model with the capability to accurately recognize mango leaf images within a complicated environmental environment. The issue arises in the presence of numerous sources of noise, such as sunlight, dust, and dirt, which can severely impair the quality of plant leaf pictures. In anticipation of Industry 5.0 and beyond, the developed model must display versatility for on-field applications, extending its recognition skills to diverse leaf kinds beyond mango leaves. Consequently, this study focuses on analyzing the resilience of the model scenarios from the real world. To imitate the subtle interaction of the natural world, we make our own MangoFolioBD dataset as the testing ground. This dataset provides a typical sampling of the issues addressed in practical circumstances. To introduce a realistic level of noise, numerous sorts of environmental disruptions are superimposed through noise into the test set in the form of noise. These disturbances imitate situations such as sunshine changes, dust particles, and other environmental elements that may alter the quality of leaf photographs.
The findings, displayed in Fig. 13, underscore the durability of our novel WaveVisionNet Model when subjected to both noise addition and scenarios free of the five levels of noise in the image. The outcomes demonstrate a slight loss in model performance as noise levels grow. This illustrates the durability and adaptability of our model in delicate situations where elements like dirt and filth may cause issues.
Fig. 13.

Robustness measurement of different metrics of our proposed WaveVisionNet model in with noise and without noise condition.
Ablation experiment and output probabilities of WaveVisionNet
We conduct four types of ablation experiments using both our primary MangoFolioBD dataset and the publicly available Indian Medicinal Leaves Dataset to assess the distinct contributions of each key modification implemented in the WaveVisionNet model which include the integration of the self-attention mechanism and other components of the proposed WaveVisionNet architecture, such as the HDC module with a specified dilation rate, 2D Convolution, and the staging ratio. We eliminate the HDC module and the first stage from the initial ablation. The removal is extended to both the first and second phases with the second ablation. The third ablation involves freezing the first, second, and third stages while simultaneously removing the HDC block from the network. Following that, the fourth ablation involved removing the first three stages while keeping the connection between the WaveMLP block and the residual block. The results are shown in Tables 10 and 11.
Table 10.
Ablation experiments on medicinal dataset with our WaveVisionNet model.
| Model | Acc (%) | Prec (%) | Rec (%) | F-1 (%) | AUC (%) | Kappa (%) | Params (M) |
|---|---|---|---|---|---|---|---|
| (WaveVisionNet) HDC freeze + 1st stage frozen | 98.10 | 98.24 | 98.12 | 97.89 | 99.60 | 96.01 | 30 |
| 98.12 | 98.21 | 98.12 | 97.89 | 99.51 | 96.05 | 29.5 | |
| 97.02 | 97.13 | 97.31 | 97.58 | 97.42 | 98.13 | 29 | |
| (WaveVisionNet) HDC freeze + 1st & 2nd stage frozen | 97.01 | 97.13 | 98.23 | 97.85 | 99.72 | 97.13 | 34 |
| 98.11 | 98.12 | 97.01 | 97.72 | 98.81 | 96.36 | 33.5 | |
| 98.01 | 98.13 | 97.01 | 95.49 | 98.50 | 98.34 | 33 | |
| (WaveVisionNet) (1, 3, 4) stage | 97.01 | 97.12 | 96.23 | 97.85 | 99.72 | 97.09 | 26 |
| 98.01 | 98.12 | 97.01 | 97.72 | 98.81 | 96.36 | 25.5 | |
| 98.11 | 98.13 | 97.25 | 95.49 | 98.50 | 98.34 | 25 | |
| (WaveVisionNet) (1, 2, 3 stage frozen) | 98.20 | 99.04 | 97.96 | 97.79 | 99.75 | 97.93 | 17.5 |
| 98.12 | 98.22 | 96.91 | 97.62 | 98.60 | 97.82 | 17 | |
| 98.02 | 98.10 | 97.22 | 97.78 | 98.82 | 97.12 | 16.5 |
Bold values represent the highest performance with the best results achieved when stages 1, 2 and 3 are frozen of the WaveVisionNet model.
Table 11.
Ablation experiments on MangoFolioBD dataset with our WaveVisionNet model.
| Model | Acc. (%) | Prec. (%) | Rec (%) | F-1(%) | AUC (%) | Kappa (%) | Params (M) |
|---|---|---|---|---|---|---|---|
| (WaveVisionNet) HDC freeze 1st stage frozen | 97.26 | 97.21 | 97.15 | 96.69 | 94.93 | 97.03 | 30 |
| 97.14 | 97.30 | 95.21 | 93.31 | 95.83 | 96.12 | 29.5 | |
| 95.24 | 97.10 | 94.30 | 91.32 | 94.73 | 95.23 | 29 | |
| (WaveVisionNet) HDC freeze + 1st & 2nd stage frozen | 97.22 | 97.10 | 97.24 | 97.54 | 94.70 | 96.13 | 34 |
| 97.23 | 97.11 | 95.32 | 92.12 | 95.31 | 95.34 | 33.5 | |
| 95.13 | 96.21 | 94.22 | 92.13 | 94.62 | 95.14 | 33 | |
| (WaveVisionNet) (1, 3, 4) stage | 97.15 | 97.21 | 97.15 | 96.69 | 95.93 | 97.03 | 26 |
| 97.02 | 97.30 | 95.21 | 93.31 | 95.83 | 96.12 | 25.5 | |
| 95.24 | 97.10 | 94.30 | 91.32 | 94.73 | 94.23 | 25 | |
| (WaveVisionNet) (1, 2, 3 stage frozen) | 97.18 | 97.20 | 97.23 | 97.78 | 95.84 | 97.03 | 17.5 |
| 97.34 | 97.31 | 97.42 | 97.80 | 96.17 | 97.10 | 17 | |
| 97.24 | 97.45 | 95.31 | 92.32 | 94.73 | 95.23 | 16.5 |
Bold values represent the highest performance with the best results achieved when stages 1, 2 and 3 are frozen of the WaveVisionNet model.
Table 10 includes ablation experiments on the Medicinal Dataset using the WaveVisionNet model. When HDC and the first stage are frozen, consistent accuracy and precision are maintained, but recall reduces with fewer parameters, indicating potential difficulties in identifying real positives. Besides, freezing HDC along with both the first and second stages leads to a loss in accuracy and precision, highlighting the significance of keeping information from both early and intermediate stages for optimal performance. Freezing certain phases (1,3,4) gives a comparable pattern, underlining the importance of these frozen stages. The best overall performance is attained when stages 1, 2, and 3 are frozen, resulting in the maximum accuracy of 98.20% along with other performance metrics with the fewest frozen with HDC enabled parameters (17.5M).
Table 11 displays the results of ablation experiments conducted on the MangoFolioBD Dataset using the WaveVisionNet model with different configurations. During the initial set of studies, when HDC is frozen together with the first stage, we consistently see a decline in performance metrics as the number reduces from 30 million to 29 million parameters. In the second set of experiments, when both the first and second phases are frozen along with HDC, the model’s performance shows improvement compared to the first set. Freezing certain phases (1, 3, 4) in addition to HDC in the third set of studies yields a performance that is comparable to that of the first set. However, there is a substantial drop in metrics as the number of parameters falls (26–25M), underscoring the value of the frozen stages. The third set of trials, where stages 1, 2, and 3 are frozen applying residual and HDC module, displays the highest overall performance, earning the highest accuracy 97.34% along with other metrics with the fewest parameters (17M). This underlines the significance of keeping information from early phases while allowing for fine-tuning in subsequent stages to attain optimal performance in our WaveVisionNet model. That includes that in the fourth stage containing residual connection in our RAD Block, we get better results in our WaveVisionNet model.
Figure 14 depicts the output probabilities for the public dataset as well as our primary dataset. Notably, WaveVisionNet performs better in terms of correct leaf class prediction.
Fig. 14.

(a–c) Output probabilities displayed by our WaveVisionNet model during the pretraining phase on the public dataset. (d–f) Output probabilities depicted by our WaveVisionNet model for accurate performance on the MangoFolio dataset, utilizing validation data directory.
Sensivity analysis
In our sensitivity study, depicted in Table 12, we evaluate the efficacy of our WaveVisionNet model by altering the freezing phases and including residual blocks and HDC. Significantly, it emphasizes that the desired level of precision described earlier is achieved by using a (2, 2) HDC configuration with 15 frozen layers in the ablation trials.
Table 12.
Sensitivity experiments on MangoFolioBD dataset with our WaveVisionNet model tuning the last layer freeze and HDC dialated rate (DR).
| Model | Last Layer Freeze | HDC DR | Accuracy |
|---|---|---|---|
| (WaveVisionNet) | 10 | (2, 2) | 0.9810 |
| 15 | (2, 2) | 0.9803 | |
| 20 | (2, 2) | 0.9820 | |
| (WaveVisionNet) | 10 | (3, 3) | 0.9802 |
| 15 | (3, 3) | 0.9814 | |
| 20 | (3, 3) | 0.9801 |
t-SNE visualization
We have employed the t-SNE visualization of our MangoFolio dataset with 26 unique classes showing intriguing insights about the model’s learned representation of high-dimensional data shown in Fig. 15a,b,c with different learning rates (0.5, 0.6, 0.7). The observed clustering of classes within the t-SNE plot shows an inbuilt structure in the data, where instances belonging to the same class are grouped closely together. This behavior implies that our WaveVisionNet model has effectively captured and encoded relevant patterns specific to each class during the training process.
Fig. 15.

t-SNE visualizations of the MangoFolio dataset with 26 unique classes, highlighting insights into the model’s learned representation of high-dimensional data across different learning rates (0.5, 0.6, 0.7).
Gradcam visualization
In this study, we apply the Grad-CAM technique to illustrate the decision-making process of our WaveVisionNet model. Our experimentation involves producing heatmaps selecting for two convolutional layers: the start and final layers. The results suggest a hierarchical feature learning process, with the initial layer capturing low-level features and the last layer combining higher-level features. Overlaying these heatmaps over the original photos facilitated the interpretation of the model’s attentional focus, boosting our grasp of its decision rationale. As we can see, our model smartly predicts the focused regions properly with pixelated regions which provides a better grasp of the correct decision-making process in the accurate classification task which is displayed in Fig. 16.
Fig. 16.

Heatmaps generated using Grad-CAM technique from our proposed WaveVisionNet model. Heatmap corresponding to the first convolutional layer and final convolutional layer. These heatmaps highlight the regions in the input image that significantly influence the model’s predictions, providing insights into the model’s decision-making process.
Discussion
Our proposed method focuses on optimizing artificial intelligence applications in the agriculture industry, specifically for crop monitoring and disease mitigation. Implementing these solutions on resource-constrained IoT devices, such as drones or smartphones, involves the adoption of lightweight models. However, decreasing computational complexity by minimizing the number of model parameters often impairs the model’s capacity to effectively identify between diverse leaf varieties of mango. Due to the minor similarities in leaf patterns, even a trained human eye may struggle to discern between them, emphasizing the problems lightweight models confront in achieving precise predictions. Despite these challenges, ongoing research strives to design models with architectures that balance both efficiency and low resource utilization. Our modified model, with a relatively lower number of parameters, proves advantageous for such applications, efficiently operating across numerous harvests and accommodating the significant heterogeneity in mango leaf varieties.Our approach’s identification performance was further examined by experimenting with and comparing it with previous studies utilizing essential metrics as accuracy shown in Table 13. The Proposed CNN model by Arivazhagan et al. attained an accuracy of 94.67%, while the Cubic SVM by Saleem et al. reached 95.21%. Other models like ANN (Pham et al.) and NN (Seetha et al.) demonstrated lesser accuracies of 88.32% and 95.12%, respectively. The Hybrid Ensemble model by Jain et al. and DCNN model by Ansah et al. displayed somewhat superior performance with accuracies of 96.23% and 96.14%. However, our proposed WaveVisionNet model greatly surpasses these current models, obtaining the best accuracy of 98.90% without noise addition and 97.23% with noise addition. This illustrates the resilience and improved performance of WaveVisionNet, particularly in cases containing noisy input, thanks to the integration of MLP-HDC with Spatial Attention (SA) processes.The superior performance of WaveVisionNet is largely owed to its novel architecture, which is built on the concepts of WaveMLP. This design provides hierarchical feature extraction, where self-attention mechanisms boost pixel-level processing, and high-dimensional convolution (HDC) optimizes the capture of multiscale characteristics. Additionally, the distinctive head of WaveVisionNet incorporates spatial information to enhance feature interactions, while the RAD Block further refines feature representation and flexibility. Together, these components contribute to the model’s higher accuracy in classifying leaves. Notably, WaveVisionNet efficiently handles issues associated with image changes, such as differences in lighting, color, size, and leaf placement, considerably enhancing the accuracy of both healthy and diseased leaf classification. Nevertheless, the effectiveness of our model can be influenced by hyperparameters and data quality, necessitating meticulous adjustment and the use of varied datasets to ensure its applicability to different scenarios.
Table 13.
Comparison of models with WaveVisionNet.

Conclusion and future works
The MangoFolioBD dataset comprises 16,646 high-resolution images of mango leaves collected from various locations in Bangladesh. This dataset is valuable for agricultural research, advancements in machine learning, and crop management strategies. It specifically supports studies in leaf morphology, disease detection, and pest control. The study further introduced the WaveVisionNet model, which is an MLP-based architecture with low parameterization that is deployable in resource-constrained devices in terms of extensive large dataset. This model showed superior results in classifying mango leaves, achieving higher accuracy, precision, recall, and F1-Score than other models. Automated classification of mango leaf variations allows farmers to identify specific cultivars, improving precision agriculture practices and resource efficiency. This technique aids biodiversity conservation, customizes interventions, and enhances crop monitoring and production prediction. The economic benefits include increased tree health and efficiency, benefiting both farmers and the agricultural economy. A crucial element of our future-oriented strategy involved implementing the model on Internet of Things (IoT) edge devices. The strategic integration not only guaranteed the ability to handle increased demands and operate effectively but also established the technology for practical use in the agricultural industry. Our model’s integration of powerful machine learning at the edge has the potential to empower farmers by enabling on-site decision-making. This contributes to resource optimization, precision agriculture, and overall economic benefits in the growing paradigm of smart and sustainable agriculture.
Acknowledgements
This work was supported by Korea Institute of Planning and Evaluation for Technology in Food, Agriculture, Forestry and Fisheries(IPET) through Digital Breeding Transformation Technology Development Program, funded by Ministry of Agriculture, Food and Rural Affairs(MAFRA)(322063-03-1-SB010).
Author contributions
M.F.U.L. contributed to the conceptualization, model training and testing, programming, manuscript writing, and reviewing processes. A.C. worked on data gathering and finalization of the work and R.R. contributed a crucial role in writing and reviewing. In addition, H.M. and M.J.P. made substantial contributions to the finalization of the writing by conducting thorough reviews and insightful advice and funding. Every author has diligently examined and actively contributed to the creation of the manuscript. As a group, we promise to maintain the reliability of all aspects of our work.
Data availability
The public dataset is available for benchmark testing which can be found https://data.mendeley.com/datasets/748f8jkphb/3 and our primary dataset used and analyzed during the current study is available from the corresponding authors upon request. It should be mentioned that the dataset collection process for this study was in accordance with relevant institutional, national, and international guidelines and legislation.
Footnotes
Publisher’s note
Springer Nature remains neutral with regard to jurisdictional claims in published maps and institutional affiliations.
Contributor Information
Amitabha Chakrabarty, Email: amitabha@bracu.ac.bd.
Md. Jalil Piran, Email: piran@sejong.ac.kr.
References
- 1.Nkoko, N., Cronje, N. & Swanepoel, J. W. Factors associated with food security among small-holder farming households in Lesotho. Agric. Food Secur.13, 1–10. 10.1186/s40066-023-00454-0 (2024). [Google Scholar]
- 2.Vuppalapati, C. Specialty Crop Mangoes. In Specialty Crops for Climate Change Adaptation: Strategies for Enhanced Food Security by Using Machine Learning and Artificial Intelligence 419–514 (Springer Nature Switzerland, Cham, 2023). 10.1007/978-3-031-38399-1_5. [Google Scholar]
- 3.Rizvee, R. A. et al. LeafNet: A proficient convolutional neural network for detecting seven prominent mango leaf diseases. J. Agric. Food Res.14, 1–13 (2023). [Google Scholar]
- 4.Aggarwal, K. et al. Studies on energy efficient techniques for agricultural monitoring by wireless sensor networks. Comput. Electr. Eng.113, 109052 (2024). [Google Scholar]
- 5.Zhong, X., Zhang, M., Tang, T., Adhikari, B. & Ma, Y. Advances in intelligent detection, monitoring, and control for preserving the quality of fresh fruits and vegetables in the supply chain. Food Biosci.56, 103350 (2023). [Google Scholar]
- 6.Chabalala, Y., Adam, E. & Kganyago, M. Mapping fruit tree dynamics using phenological metrics from optimal Sentinel-2 data and deep neural network. CABI Agric. Biosci.4, 1–20 (2023). [Google Scholar]
- 7.Sulistyawati, I., Dekker, M., Verkerk, R. & Steenbekkers, B. Consumer preference for dried mango attributes: A conjoint study among Dutch, Chinese, and Indonesian consumers. J. Food Sci.85(10), 3527–3535 (2020). [DOI] [PMC free article] [PubMed] [Google Scholar]
- 8.Zahid, G., Aka Kaçar, Y., Shimira, F., Iftikhar, S. & Nadeem, M. A. Recent progress in omics and biotechnological approaches for improved mango cultivars in Pakistan. Genet. Resour. Crop Evol.69(6), 2047–2065 (2022). [Google Scholar]
- 9.Rukonuzzaman, M. et al. Effects of a quantity-based discount frame in inventory planning under time-dependent demand: A case study of mango businesses in Bangladesh. J. King Saud Univ.-Sci.35, 1–12 (2023). [Google Scholar]
- 10.Pacal, I. Enhancing crop productivity and sustainability through disease identification in maize leaves: Exploiting a large dataset with an advanced vision transformer model. Expert Syst. Appl.238, 122099 (2024). [Google Scholar]
- 11.Thai, H. T., Le, K. H. & Nguyen, N. L. T. FormerLeaf: An efficient vision transformer for Cassava Leaf Disease detection. Comput. Electron. Agric.204, 107518 (2023). [Google Scholar]
- 12.Fu, X. et al. Crop pest image recognition based on the improved ViT method. Inf. Process. Agric.11(2), 249–259. 10.1016/j.inpa.2023.02.007 (2024). [Google Scholar]
- 13.Sanchez, P. D. C., Hashim, N., Shamsudin, R. & Nor, M. Z. M. Applications of imaging and spectroscopy techniques for non-destructive quality evaluation of potatoes and sweet potatoes: A review. Trends Food Sci. Technol.96, 208–221 (2020). [Google Scholar]
- 14.Srivastava, S. & Sadistap, S. Data processing approaches and strategies for non-destructive fruits quality inspection and authentication: A review. J. Food Meas. Charact.12(4), 2758–2794 (2018). [Google Scholar]
- 15.Pham, V., Weindorf, D. C. & Dang, T. Soil profile analysis using interactive visualizations, machine learning, and deep learning. Comput. Electron. Agric.191, 106539 (2021). [Google Scholar]
- 16.Soeb, M. J. A. et al. Tea leaf disease detection and identification based on YOLOv7 (YOLO-T). Sci. Rep.13(1), 6078 (2023). [DOI] [PMC free article] [PubMed] [Google Scholar]
- 17.Bezabih, Y. A., Salau, A. O., Abuhayi, B. M., Mussa, A. A. & Ayalew, A. M. CPD-CCNN: Classification of pepper disease using a concatenation of convolutional neural network models. Sci. Rep.13(1), 15581 (2023). [DOI] [PMC free article] [PubMed] [Google Scholar]
- 18.Borhani, Y., Khoramdel, J. & Najafi, E. A deep learning based approach for automated plant disease classification using vision transformer. Sci. Rep.12(1), 11554 (2022). [DOI] [PMC free article] [PubMed] [Google Scholar]
- 19.Bullo, T. A., Bayisa, Y. M., Jiru, E. B. & Ancha, V. R. Optimization and clean synthesis of biodiesel from Rumex crispus leaves using calcium oxide derived from mango seed shell as a nanocatalyst. React. Kinet. Mech. Catal.136(6), 2955–2975 (2023). [Google Scholar]
- 20.Ahmed, T. et al. Advancing sweetpotato quality assessment with hyperspectral imaging and explainable artificial intelligence. Comput. Electron. Agric.220, 108855 (2024). [Google Scholar]
- 21.Nawaz, M. et al. A robust deep learning approach for tomato plant leaf disease localization and classification. Sci. Rep.12(1), 18568 (2022). [DOI] [PMC free article] [PubMed] [Google Scholar]
- 22.Abbas, A., Jain, S., Gour, M. & Vankudothu, S. Tomato plant disease detection using transfer learning with C-GAN synthetic images. Comput. Electron. Agric.187, 106279 (2021). [Google Scholar]
- 23.Qi, J. et al. An improved YOLOv5 model based on visual attention mechanism: Application to recognition of tomato virus disease. Comput. Electron. Agric.194, 106780 (2022). [Google Scholar]
- 24.Rao, U. S. et al. Deep learning precision farming: Grapes and mango leaf disease detection by transfer learning. Glob. Trans. Proc.2, 535–544 (2021). [Google Scholar]
- 25.Arivazhagan, S. & Ligi, S. V. Mango leaf diseases identification using convolutional neural network. Int. J. Pure Appl. Math.120, 11067–11079 (2018). [Google Scholar]
- 26.Saleem, R., Hussain Shah, J., Sharif, M. & Jillani Ansari, G. Mango leaf disease identification using fully resolution convolutional network. Comput. Mater. Contin.69(3), 3581–3601. 10.32604/cmc.2021.017700 (2021). [Google Scholar]
- 27.Jain, S. & Jaidka, P. Mango leaf disease classification using deep learning hybrid model. In International Conference on Power, Instrumentation, Energy and Control (PIECON) 1–6 (Aligarh, India, 2023).
- 28.Ansah, F. A., Amo-Boateng, M., Siabi, E. K. & Bordoh, P. K. Location of seed spoilage in mango fruit using X-ray imaging and convolutional neural networks. Sci. Afr.20, 1–13 (2023). [Google Scholar]
- 29.Hari, P. & Singh, M. P. A lightweight convolutional neural network for disease detection of fruit leaves. Neural Comput. Appl.35, 1–12 (2023). [Google Scholar]
- 30.Pham, T. N., Van Tran, L. & Dao, S. V. T. Early disease classification of mango leaves using feed-forward neural network and hybrid metaheuristic feature selection. IEEE Access8, 1–14 (2020). [Google Scholar]
- 31.Seetha, J. et al. Mango leaf disease classification using hybrid Coyote-Grey Wolf optimization tuned neural network model. Multimed. Tools Appl.83(6), 17699–17725. 10.1007/s11042-023-16964-9 (2023). [Google Scholar]
- 32.Pushpa, B. R. & Rani, S. Indian medicinal leaves image datasets. Mendeley Data. 10.17632/748f8jkphb.3 (2023). [Google Scholar]
- 33.Labiba, Z., Heram, A. A., Hossain, M. M., Alam, S., & Shakal, B. K. Evaluating CNN and Vision Transformer Models for Mango Leaf Variety Identification (Brac University, September, 2023).
- 34.Barbu, T. Variational image denoising approach with diffusion porous media flow. Abstr. Appl. Anal.2013, 1–9 (2013). [Google Scholar]
- 35.Geng, Q. & Viswanath, P. The optimal noise-adding mechanism in differential privacy. IEEE Trans. Inf. Theory62, 925–951 (2016). [Google Scholar]
- 36.Hasinoff, S. W. Photon, Poisson noise. In Computer Vision, A Reference Guide 1–4 (Springer, Cham, 2021). [Google Scholar]
- 37.Maity, A., Pattanaik, A., Sagnika, S. & Pani, S. A comparative study on approaches to speckle noise reduction in images. In International Conference on Computational Intelligence and Networks (CINE) 148–155 (Odisha, India, 2015).
- 38.Liu, Z., Mao, H., Wu, C. Y., Feichtenhofer, C., Darrell, T. & Xie, S. A convnet for the 2020s. In Proceedings of the IEEE/CVF Conference on Computer Vision and Pattern Recognition 11976–11986 (New Orleans, Louisiana, 2022).
- 39.Szegedy, C., Ioffe, S., Vanhoucke, V. & Alemi A. Inception-v4, inception-resnet and the impact of residual connections on learning. In Proceedings of the AAAI Conference on Artificial Intelligence 1–7 (Palo Alto, California USA, 2017).
- 40.Simonyan, K. & Zisserman, A. Very deep convolutional networks for large-scale image recognition. arXiv:1409.1556. ICLR (2015).
- 41.Liu, Z., Hu, H., Lin, Y., Yao, Z., Xie, Z., Wei, Y. & Guo, B. Swin transformer v2: Scaling up capacity and resolution. In Proceedings of the IEEE/CVF Conference on Computer Vision and Pattern Recognition 12009–12019 (New Orleans, Louisiana, 2022).
- 42.Dai, Z., Liu, H., Le, Q. V. & Tan, M. Coatnet: Marrying convolution and attention for all data sizes. Adv. Neural. Inf. Process. Syst.34, 1–12 (2021). [Google Scholar]
- 43.Tu, Z., Talebi, H., Zhang, H., Yang, F., Milanfar, P., Bovik, A., & Li, Y. Maxvit: Multi-axis vision transformer. In European Conference on Computer Vision 459–479 (Tel Aviv, Israel, 2022).
- 44.Tang, Y., Han, K., Guo, J., Xu, C., Li, Y., Xu, C. & Wang, Y. An image patch is a wave: Phase-aware vision mlp. In Proceedings of the IEEE/CVF Conference on Computer Vision and Pattern Recognition 10935–10944 (New Orleans, Louisiana, 2022).
- 45.Vaswani, A., Shazeer, N., Parmar, N., Uszkoreit, J., Jones, L., Gomez, A. N. & Polosukhin I. Attention is all you need. In 31st Conference on Neural Information Processing Systems 1–11 (Long Beach, CA, USA, 2017).
- 46.He, K., Zhang, X., Ren, S. & Sun, J. Deep residual learning for image recognition. In Proceedings of the IEEE Conference on Computer Vision and Pattern Recognition 1–9 (Las Vegas, USA, 2016).
- 47.Yu, F. & Koltun, V. Multi-scale context aggregation by dilated convolutions. arXiv preprint arXiv:1511.07122 (2015).
- 48.Guo, W., Xu, G. & Wang, Y. Brain visual image signal classification via hybrid dilation residual shrinkage network with spatio-temporal feature fusion. SIViP17, 743–751 (2022). [Google Scholar]
Associated Data
This section collects any data citations, data availability statements, or supplementary materials included in this article.
Data Availability Statement
The public dataset is available for benchmark testing which can be found https://data.mendeley.com/datasets/748f8jkphb/3 and our primary dataset used and analyzed during the current study is available from the corresponding authors upon request. It should be mentioned that the dataset collection process for this study was in accordance with relevant institutional, national, and international guidelines and legislation.