

Keywords: activity-dependent, correlations, neuromodulation, neuronal output, stomatogastric
Abstract
Recently, activity has been proposed as a primary feedback mechanism used by continuously bursting neurons to coordinate ion channel mRNA relationships that underlie stable output. However, some neuron types only have intermittent periods of activity and so may require alternative mechanisms that induce and constrain the appropriate ion channel profile in different states of activity. To address this, we used the pyloric dilator (PD; constitutively active) and the lateral gastric (LG; periodically active) neurons of the stomatogastric ganglion (STG) of the crustacean Cancer borealis. We experimentally stimulated descending inputs to the STG to cause release of neuromodulators known to elicit the active state of LG neurons and quantified the mRNA abundances and pairwise relationships of 11 voltage-gated ion channels in active and silent LG neurons. The same stimulus does not significantly alter PD activity. Activation of LG upregulated ion channel mRNAs and lead to a greater number of positively correlated pairwise channel mRNA relationships. Conversely, this stimulus did not induce major changes in ion channel mRNA abundances and relationships of PD cells, suggesting their ongoing activity is sufficient to maintain channel mRNA relationships even under changing modulatory conditions. In addition, we found that ion channel mRNA correlations induced by the active state of LG are influenced by a combination of activity- and neuromodulator-dependent feedback mechanisms. Interestingly, some of these same correlations are maintained by distinct mechanisms in PD, suggesting that these motor networks use distinct feedback mechanisms to coordinate the same mRNA relationships across neuron types.
NEW & NOTEWORTHY Neurons use various feedback mechanisms to adjust and maintain their output. Here, we demonstrate that different neurons within the same network can use distinct signaling mechanisms to regulate the same ion channel mRNA relationships.
INTRODUCTION
Central pattern generators (CPGs) drive rhythmic behaviors in many organisms (1, 2). Despite microenvironment perturbations (3) or channel turnover (4), mechanisms must exist that ensure the stability and fidelity of CPG electrophysiological outputs. Ultimately, these outputs are defined by the precise coordination of different ionic currents. In turn, ionic currents and the ion channel mRNAs that encode them are coregulated (5–9), which suggests that neurons actively coordinate both to ensure reliable outputs (10). Multiple feedback signal modalities have been proposed by which neurons can homeostatically coordinate their channel mRNA relationships, including both activity- and neuromodulator-dependent mechanisms (5, 8, 9, 11). Most recently, activity (defined as membrane voltage) was found to be the predominant signal constraining the coregulation of most ion channel mRNAs in a continuously bursting motor neuron of the stomatogastric ganglion (STG), the pyloric dilator (PD) neuron; constitutively active PD neurons lose the majority of their channel mRNA relationships when activity is suppressed, but artificially induced activity patterns were able to spare most channel mRNA relationships (11). However, most neurons undergo periods of quiescence during which little activity is present to preserve such relationships, including neurons of the gastric mill circuit in the STG (12, 13). Therefore, we hypothesize that additional mechanisms of feedback regulation may be necessary for periodically active neurons.
To investigate this, we used the isolated stomatogastric nervous system (STNS) of the Jonah crab Cancer borealis, which contains two networks that generate the gastric mill and pyloric rhythms responsible for chewing and filtering of food in the crab stomach, respectively (14, 15). Both networks rely on descending neuromodulatory inputs for their rhythmic activity (16). The gastric and pyloric circuits interact to allow for coordination of the timing of chewing and filtering thus enabling proper progression of food into the midgut (13, 17). Furthermore, a small number of STG cells are active in both rhythms, switching their firing patterns and timing based on the modulatory conditions present in the circuit (18–20). However, a key distinction exists between the activity patterns of these two circuits that suggests distinct mechanisms of regulation may be needed to organize underlying channel mRNAs. Most notably, the pyloric rhythm is constitutively active both in vivo and in the isolated nervous system, and thus, its constituent neurons receive constant activity-dependent feedback (21). Conversely, the gastric mill is activated periodically based on food intake (22), and its constituent neurons can be silent for days or even weeks based on the feeding state of the animal (23). When a meal is taken, the gastric mill can then become activated for several hours while the animal processes and grinds up the swallowed food (24, 25). Therefore, the gastric mill represents the opportunity to study periodically active CPG neurons while the pyloric neurons are a model for constitutively active CPG cells. To address whether neurons from each network type use distinct feedback solutions to coordinate their ion channel mRNAs, we focused on two neurons of the STG: the lateral gastric neurons of the gastric mill network (LG; periodically active) and pyloric dilator neurons of the pyloric network (PD; continuously active). We chose these neurons because of their distinct activity profiles, as representative neurons of two distinct circuits within the STG, and because they are not known to directly interact through either chemical or electrical synaptic connections (26, 27).
Because the regulation of channel mRNA relationships in PD neurons has already been characterized and found to be largely activity-dependent (11), we framed our questions based on LG neurons. We asked the following questions: 1) When LG neurons switch from inactive to active states, do they experience feedback that changes their ion channel mRNA profile? 2) Do naturally inactive LG neurons receive baseline feedback that influences their channel mRNA profile when the gastric mill rhythm is off? 3) When ion channel mRNA relationships change in active LG neurons, what modality of information (activity vs. neuromodulation) conveys these changes to influence these mRNA relationships? 4) For a given mRNA correlation, is the same modality of feedback always used across STG neuron types? To answer the first question, we determined whether turning on the gastric mill rhythm and thus inducing LG’s activity would change its ion channel mRNA profile. To do so, we activated bursting of LG neurons in vitro for the physiologically relevant time of 8 h (24, 25) by stimulating descending neuromodulatory projections and then collecting LG neurons from those preparations. To assess whether any changes in LG’s ion channel mRNA profile were cell-type specific, we also collected PD neurons from those preparations. As PD neurons use activity-dependent feedback to constrain their ion channel mRNA relationships (11), and the activity of PD neurons is not substantially altered during gastric stimulation (23, 28), we predicted that PD should not experience major changes to its ion channel mRNA profile when the gastric mill rhythm turns on. We then used quantitative RT-PCR (qPCR) to measure the abundances and relationships of 11 voltage-gated ion channel mRNAs important to neuronal output stability and excitability (Table 1) (29–33) in both LG and PD neurons. We chose these channels as a relatively comprehensive set of channel genes known to encode the major ion channel subtypes that have been characterized physiologically in STG cells (7, 34, 35). To answer the second question, we applied tetrodotoxin (TTX) and removed all inputs to LG neurons in preparations with the gastric mill off to determine whether inactive LG neurons in intact preparations receive any feedback that regulates their ion channel mRNAs. To answer the third question, we decoupled LG’s own activity from the influence of descending neuromodulatory inputs (36) to determine the extent to which each signal (activity vs. modulation) contributed to inducing and constraining LG’s channel mRNA relationships. Finally, to answer the fourth question, we compared the ion channel mRNA relationships formed during LG’s active state to those found in previous work in PD neurons (11) to ascertain whether the same mRNAs were constrained by the same or different feedback signals across neuron types.
Table 1.
List of voltage-gated ion channel genes names and types
| Gene Name | Current/Channel Type |
|---|---|
| SHAKER | Voltage-gated A-type potassium (IA or Kv1) |
| SHAB | Voltage-gated delayed rectifier (IKd or Kv2) |
| SHAW1 | Voltage-gated delayed rectifier (IKd or Kv3) |
| SHAL | Voltage-gated A-type potassium (IA or Kv4) |
| BKKCA | Large conductance (BK) voltage/Ca2+-activated potassium |
| SKKCA | Small conductance (SK) Ca2+-activated potassium |
| CbCAV1 | L-type high-voltage-activated (HVA) calcium |
| CbCAV2 | P/Q-N high-voltage-activated (HVA) calcium |
| NALCN | Nonselective sodium leak |
| CBNAV | Cancer borealis voltage-gated fast sodium para type |
| HCN/IH | Hyperpolarization-activated cyclic nucleotide-gated |
METHODS
Stomatogastric Ganglion Preparations
Adult male Jonah crabs (C. borealis) were purchased from the Fresh Lobster company (Gloucester, MA) and kept in artificial seawater chilled to 12°C. To ensure a relatively similar feeding history across animals, we did not feed our crabs for at least 4 days before performing experiments. Experimental animals were anesthetized on ice for 30 min, the foregut removed, and then the stomatogastric nervous system (STNS) was dissected. Each STNS preparation was dissected out with both commissural ganglia (CoG), the esophageal ganglion (OG), and stomatogastric ganglion (STG). All STGs were desheathed using a steel pin. STNS preparations were bathed in chilled physiological saline (12°C) with the following concentrations: 440 mM NaCl, 11 mM KCl, 13 mM CaCl2, 26 mM MgCl2, and 10 mM HEPES buffer, pH 7.45.
Electrophysiological Recordings and Manipulations
Pyloric and gastric activity for each STNS preparation was recorded by placing stainless steel electrodes in petroleum jelly wells built around the lvn and dgn nerves (Fig. 1). We amplified extracellular signals with an A-M Systems Model 1700 extracellular amplifier (A-M Systems, Carlsborg, WA). LG and PD neurons were identified by comparing their intracellular traces with extracellular recordings and by using standard cell identification procedures (19, 37). All intracellular recordings were made with 10–20 MΩ microelectrodes filled with 600 mM K2SO4 and 20 mM KCl and amplified using an Axoclamp 2 A intracellular amplifier (Molecular Devices, San Jose, CA). Data were acquired using a Digidata 1322 A digitizer (Molecular Devices, San Jose, CA).
Figure 1.
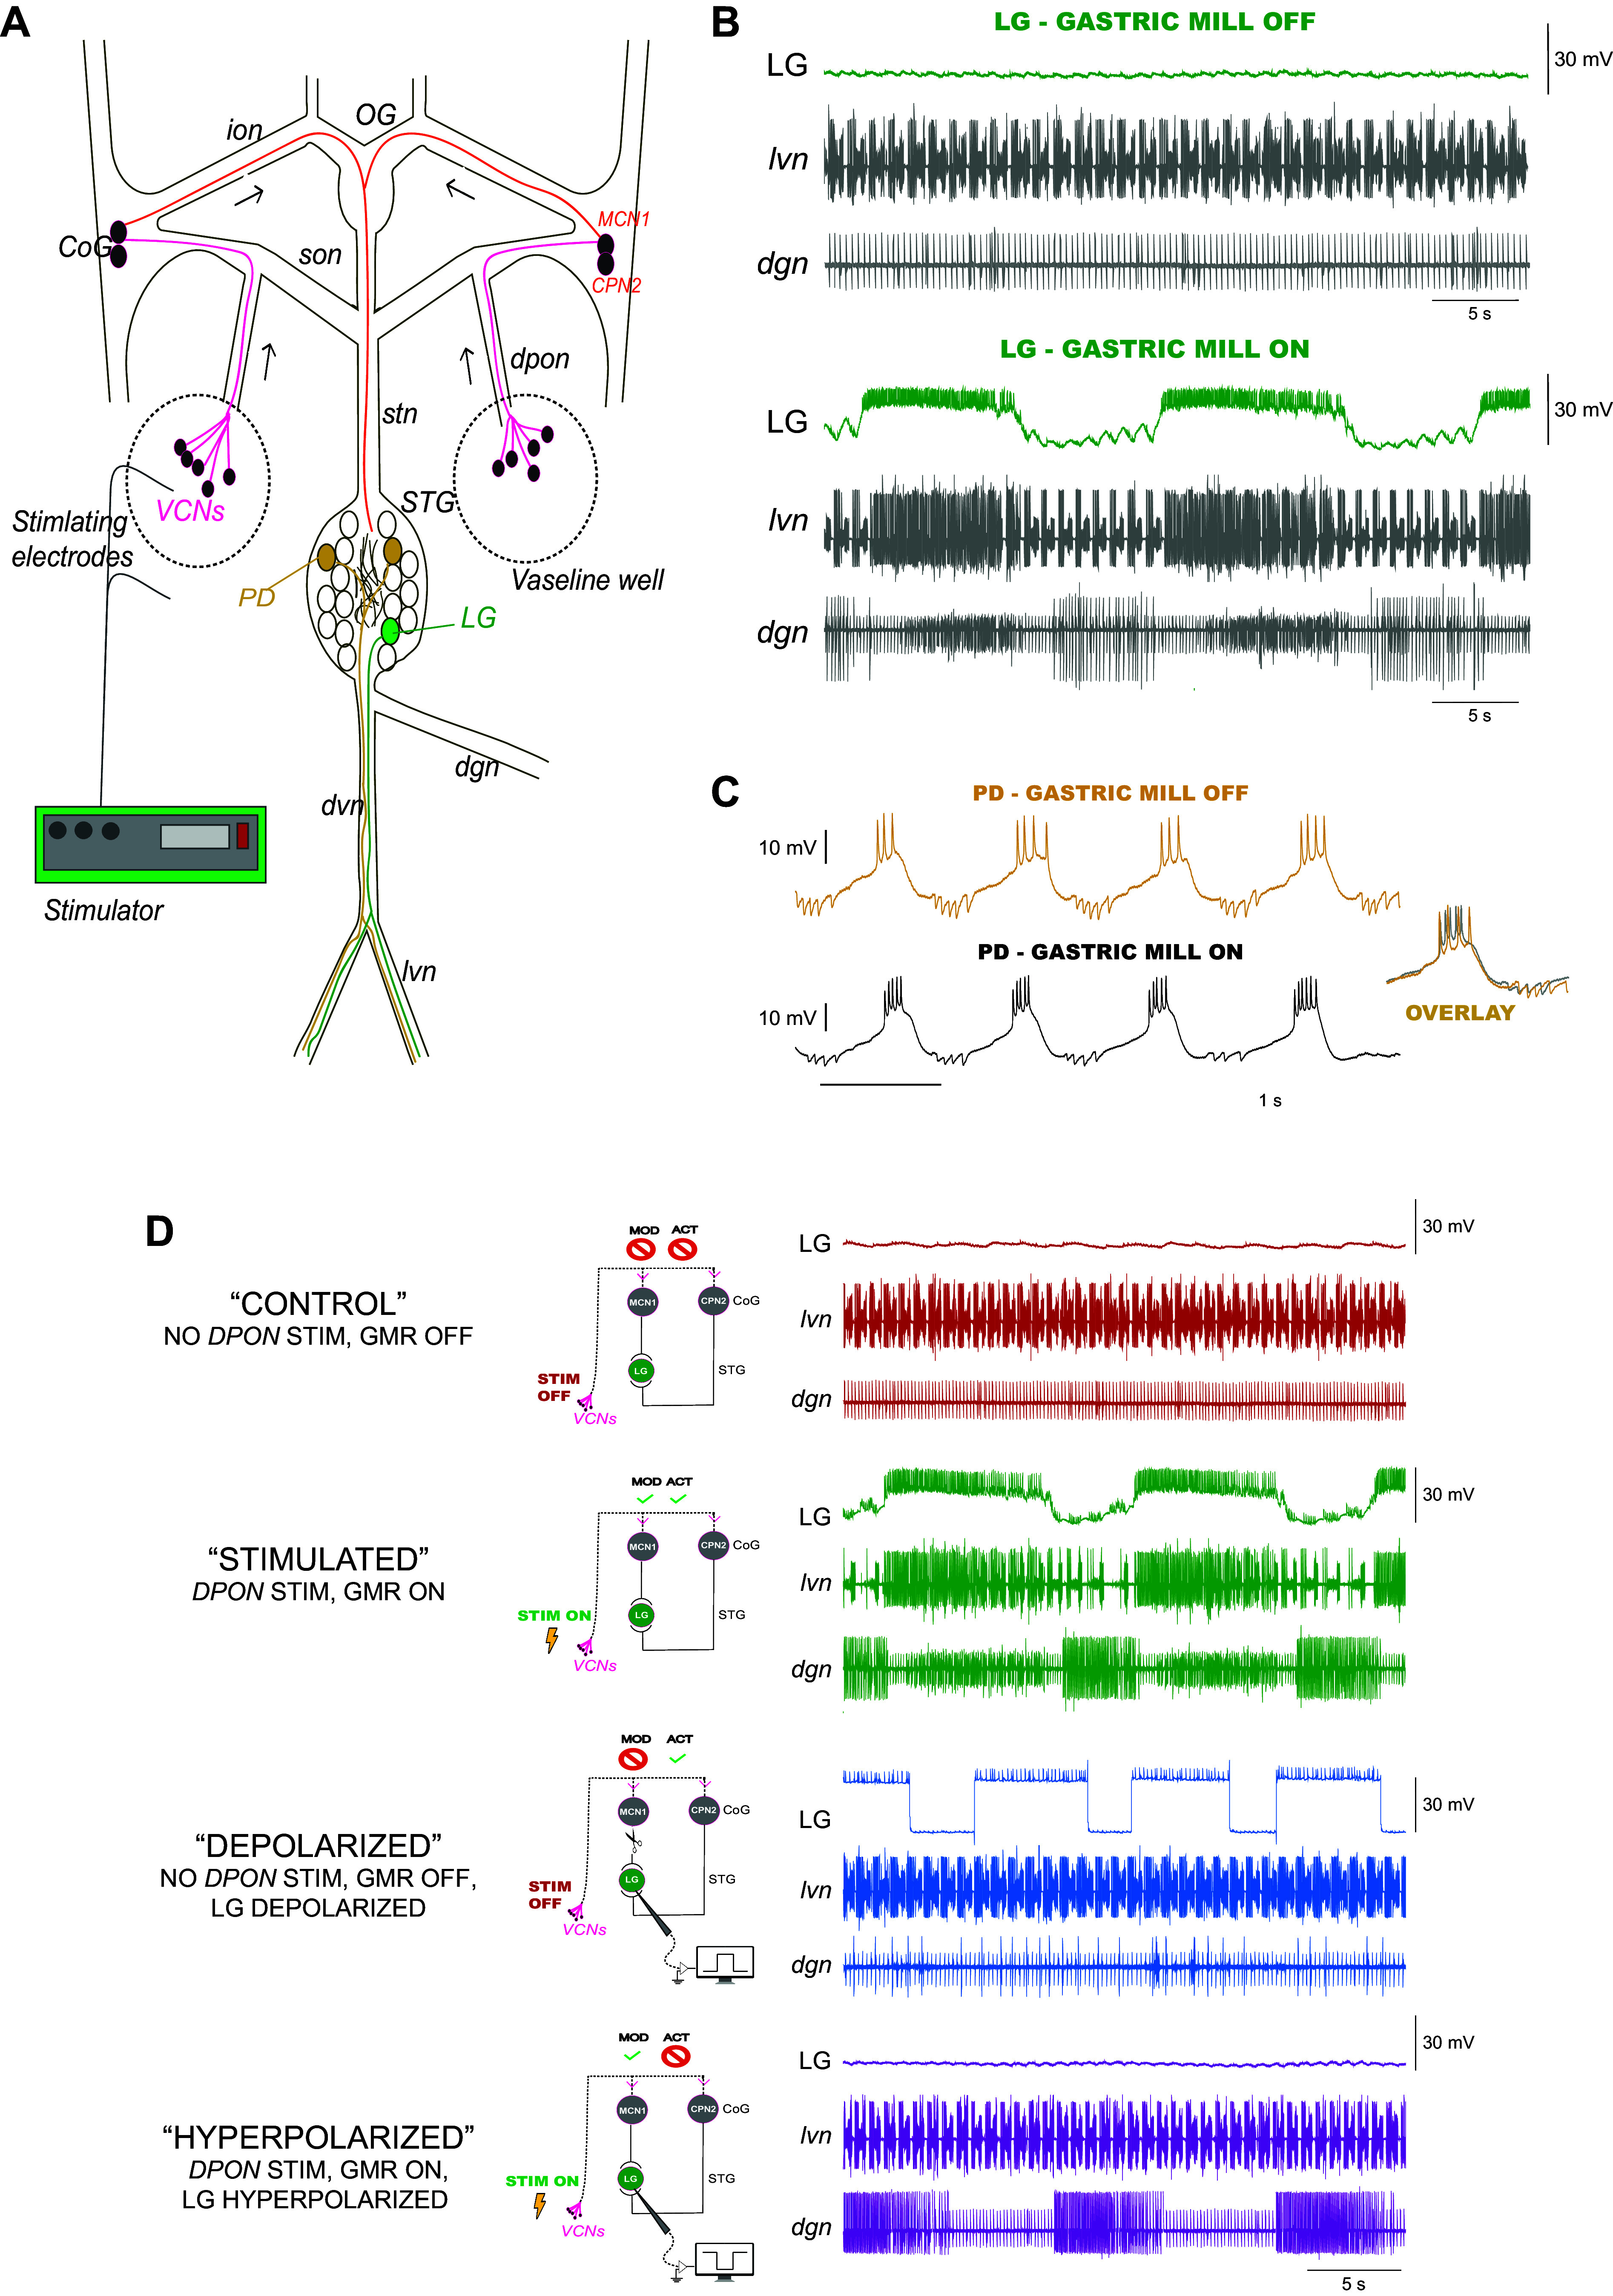
Experimental design to investigate the activity and neuromodulatory feedback signals constraining ion channel mRNA relationships in lateral gastric (LG) neurons. A: schematic of the stomatogastric nervous system from the crab C. borealis. The esophageal ganglion (OG) and the paired commissural ganglia (CoG) provide descending modulatory inputs to the STG via the stomatogastric nerve (stn). The lateral gastric (LG) and pyloric dilator (PD) neurons used in these experiments are highlighted in the STG. A stimulator (AM Systems) provided the necessary voltage (10–15 V) to experimentally activate the gastric mill rhythm. This was accomplished by surrounding the dorsal posterior esophageal nerves (dpon) with a petroleum jelly well and inserting the stimulating electrodes to bilaterally activate the dpon nerves. Stimulation activates the ventral cardiac neurons (VCNs), which in turn excite MCN1 and CPN2 neurons in the CoGs. MCN1 releases C. borealis tachykinin-related peptide Ia (CabTRP-Ia), which modulates LG to initiate the gastric mill rhythm while CPN2 adds fast excitation. B: representative traces of LG neuron recordings in preparations where the gastric mill is off or on. LG recordings are made from the same cell before and after stimulation of the dpon nerves leading to gastric mill activation. Extracellular recordings were made from the lateral ventricular nerve (lvn) and dorsal gastric nerve (dgn), which contain the axons of motor neurons that allow for the visualization of the pyloric and gastric mill rhythms. LG axons project through the lvn and their action potentials can be seen simultaneously in intracellular (top traces) and extracellular recordings to confirm identification and to follow the activity of these neurons. Scale bars represent 30 mV and 5 s as shown. C: representative traces of PD neuron recordings in preparations where the gastric mill is off or on. PD recordings are made from a different preparation than that of LG, but the same PD cell is shown before and after stimulation that activates the gastric mill rhythm. When superimposed, PD’s waveform before and after gastric mill activation does not change overall. Scale bars represent 10 mV and 1 s as shown. D: to determine the feedback signals eliciting and maintaining the ion channel mRNA relationships that we observed in LG neurons from stimulated preparations, we generated four different experimental groups: 1) Control preparations (n = 12 individuals) were maintained for 8 h with all inputs intact, but no gastric mill activity was initiated. These LG neurons are inactive (red top trace, no activity) and are not receiving the full complement of neuromodulators to initiate gastric activity (no modulation). Therefore, we characterize these as activity negative (−) and modulation negative (−). 2) Stimulated preparations (n = 13 individuals) had all inputs intact and the gastric mill rhythm was experimentally activated for 8 h via stimulation of the dpon nerves containing the VCN neurons. These LG neurons are actively bursting (green top trace) and are receiving the full complement of neuromodulators to generate a gastric mill rhythm. Therefore, we characterize these as activity positive (+) and modulation positive (+). 3) Depolarized preparations (n = 11 individuals) were maintained for 8 h with no gastric mill activity and with the inferior esophageal nerves (ions) cut. The LG neurons then were current-clamped to a depolarized waveform (5–10 nA pulses for 6 s with a 2 s interburst interval) for a duration of 8 h. LG neurons are active and spiking during these current pulses (blue top trace) and receive feedback in the form of membrane voltage changes but not modulatory input from MCN1. We characterize these as activity positive (+), modulation negative (−). 4) Hyperpolarized preparations (n = 11 individuals) were maintained with intact inputs and dpons were electrically stimulated for 8 h to initiate gastric activity. During gastric activation, we current-clamped LG to a hyperpolarized potential (purple top trace) using −5 nA to −10 nA of DC current. Despite an inactive LG, we confirmed modulator release from the CoGs as evidenced by the DG neuron bursts visible on the dgn (bottom trace). At this point, LG neurons are receiving only modulatory inputs but no feedback in the form of membrane voltage changes, and we therefore characterize them as activity negative (−), modulation positive (+). STG, stomatogastric ganglion; VCN, ventral cardiac neuron.
We initiated gastric activity by placing stainless steel electrodes in petroleum jelly wells built around both dorsal posterior esophageal nerves (dpon; Fig. 1A) and simultaneously applying 10–15 V rhythmic stimulus trains [10 × 6 s burst delivered at 0.06 Hz; 15 Hz intraburst stimulation rate (37)]. Each stimulation event lasted ∼1 min and 30 s using an A-M Systems isolated pulse stimulator Model 1200 (A-M Systems, Carlsborg, WA). At this point, preparations generated robust gastric and pyloric activity (Fig. 1B). After a given stimulation cycle, gastric activity lasted between 30–45 min. We reinduced gastric activity as needed only when the rhythm ceased (approximately every 30–45 min) for a period of 8 h. Because stomach emptying after feeding can last for more than 6 h (24) and since gastric activity can last for more than 8 h (25), we chose an 8-h stimulation period as a physiologically relevant duration to stimulate the gastric mill rhythm. For all groups, impaled LG neurons were regularly monitored for changes to input resistance. Any LG neuron with an input resistance less than 3 MΩ was discarded.
Experimental Groups
We ultimately collected LG neurons from five different experimental groups (Fig. 1 and Table 2) to address our four distinct questions: 1) Control (LG n = 12; PD n = 13): these isolated STNS preparations had intact ganglia and neuromodulatory inputs (ion nerves were intact) and were maintained in chilled physiological saline for a period of 8 h. Only pyloric activity was present, and we did not initiate any gastric activity. 2) Stimulated (LG n = 13; PD n = 13): these STNS preparations had intact ganglia and neuromodulatory inputs and experienced 8 h of ongoing gastric mill activity elicited by stimulation as described earlier. 3) TTX (LG n = 11): we identified LG neurons using the procedures already stated. We then incubated these STNS preparations in physiological saline with a bath applied 10−7 M tetrodotoxin (TTX; Sigma-Aldrich, St. Louis, MO). Immediately after application of TTX and upon confirmation that network activity had ceased, the stomatogastric nerve (stn) was cut to remove all descending neuromodulation to the STG from the CoGs and OG. These preparations were maintained in this state for 8 h before LG neurons were collected. 4) Depolarized (LG n = 11): these preparations had intact ganglia, but ion nerves were cut to minimize transmission of the neuropeptides necessary for gastric mill induction. Only pyloric activity was present, and we purposefully did not initiate any gastric activity. We identified LG neurons and current clamped these cells for a period of 8 h with a protocol that approximated the bursting activity of LG in an active gastric network. This protocol consisted of stimulation at a frequency of 0.125 Hz, with a depolarizing step for 6 s of 5–10 nA, and a hyperpolarizing step of −0.5 to −1.0 nA for 2 s (duty cycle of 0.75). The amplitude of current injection was adjusted for each LG neuron based on the input resistance to achieve a similar bursting output across preparations. 5) Hyperpolarized (LG n = 11): these preparations had intact ganglia and neuromodulatory inputs. After identifying LG neurons as described for group 1, we initiated gastric activity with dpon stimulation as described for group 2 (Stimulated), whereas we silenced LG activity during the ongoing gastric activity by current clamping it to a hyperpolarized potential for 8 h (−5 nA to −10 nA of continuous DC current).
Table 2.
State of activity and neuromodulation for LG and PD neurons across the 5 experimental groups
| Group | Cell Types Included | Pyloric Modulation | Gastric Modulation | Activity |
|---|---|---|---|---|
| TTX | LG | − | − | − |
| Control | LG/PD | +/+ | −/− | −/+ |
| Stimulated | LG/PD | +/+ | +/+ | +/+ |
| Depolarized | LG | + | − | + |
| Hyperpolarized | LG | + | + | − |
LG, lateral gastric; PD, pyloric dilator.
Harvesting of Identified Neurons
Cell harvesting was performed as previously described (7, 38). Briefly, after experiments were completed a petroleum jelly well was built around the STG. We applied 2.5 mg/mL protease (Sigma – P6911, St. Louis, MO) directly to the petroleum jelly well filled with physiological saline. The protease aided in digesting and loosening connective tissues around the neurons of the STG. The saline and protease in the well were then replaced with fresh physiological saline to stop the digestion. We then performed a gradual ice-cold ethylene glycol (EG) substitution (70% EG and 30% physiological crab saline) of the saline in the petroleum well over a period of 15 min. STG preparations were then placed in a −20°C freezer for 1 h. After an hour, we collected LG and PD neurons using fine handheld forceps and placed each neuron into 400 μL of RNA lysis buffer (Zymo Research, Irvine, CA) and stored at −80°C until RNA extraction.
cDNA Synthesis and Preamplification of cDNA Targets
RNA isolation and cDNA synthesis were performed as previously described (39). Briefly, total RNA was purified and isolated from individually identified neurons using the Quick-RNA MicroPrep kit (Zymo Research, Irvine, CA) per the manufacturer’s instructions. The entirety of the total RNA was then reverse transcribed using a mixture of oligo-dT and random hexamer primers (qScript cDNA Supermix; QuantaBio, Beverly, MA) in a reaction volume of 20 μL. We preamplified 8 μL of this cDNA using PerfeCTa PreAmp Supermix (QuantaBio, Beverly, MA) according to the manufacturer’s instructions (24 μL reaction volume). The preamplification protocol uses a 14-cycle PCR reaction primed with a pool of our target-specific primers (39) to enrich subsequent qPCR reactions. We then added 76 μL of nuclease-free water to dilute each preamplified sample to 100 μL total volume.
Quantitative Reverse Transcription Polymerase Chain Reaction
We previously designed and validated 11 probes and 11 primer sets for the following voltage-gated ion channel genes (Table 1): Na+ leak channel (NALCN), hyperpolarization-activated current (IH), small conductance Ca2+-activated K+ channel (SKKCA), delayed-rectifying K+ channel (SHAW1), voltage-gated Na+ channel (CBNAV), A-type K+ channel (SHAKER), delayed- rectifying K+ channel (SHAB), L-type Ca2+ channel (CbCAV1), P/Q-type Ca2+ channel (CbCAV2), A-type K+ channel (SHAL), and large conductance Ca2+ -activated K+ channel (BKKCA). In addition to using standard cell identification procedures for LG and PD neurons, we assayed these cell types for the presence of vesicular acetylcholine transporter (vAChT), choline acetyltransferase (ChAT), and vesicular glutamate transporter (vGluT). As LG (glutamatergic) and PD (cholinergic) neurons use vGluT and ChAT, respectively, as part of their neurotransmission profile (15, 36), presence of these targets grants us another measure of quality control to ensure we have collected the correct neuron type. An identified neuron that did not match these transmitter profile expression patterns was discarded from the analysis.
Primer and probe sequences, as well as working concentrations, are available in study by Northcutt et al. (39). Preamplified template (5 μL) was used to make a 32-μL reaction supermix, which included the following: 1) 6.4 μL of iQ multiplex powermix (BioRad Laboratories. Inc.), 2) 1.6 μL of 50 μmol primer mix (IDT Integrated DNA Technologies, Coralville, IA), and 3) 1 μL of 10 μmol dual-labeled BHQ probe (Biosearch Technologies, Petaluma, CA). This supermix was then subdivided into 3 × 10 μL triplicates. Thus, each individual qPCR reaction had a volume of 10 μL and was loaded into a single well on a 96-well plate. The final primer concentration of each multiplex qPCR reaction was 2.5 μM and 0.3125 μM for each probe. We used a CFX96 Touch Real-Time PCR Detection System (Bio-Rad), which had the following cycling conditions for qPCR reactions: 95°C for 3 min, 40 cycles of 95°C for 15 s, and 58°C for 1 min. We took fluorescence measurements at the end of each cycle.
Absolute quantification of mRNA abundances was achieved using standard curves that were developed for each qPCR multiplex assay. To do so we used custom gBlock gene fragments (Integrated DNA Technologies). We generated standard curves using a serial dilution of gBlock gene fragments from 1 × 10⁶ to 1 × 101 copies for each reaction assay to ascertain the limits of transcript detection. Each standard curve was found to be linear and reproducible. Absolute abundances for target mRNA transcripts were calculated by using the efficiency and slope generated from the standard curves while also accounting for the 14-cycle preamplification and dilution of cDNA templates described in the cDNA Synthesis and Preamplification of cDNA Targets section.
Statistical Analysis
All statistical analyses were performed using R version 3.5.3 (2019-07-05) “Action of the toes.” For all ion channel mRNA abundances, we ran a Shapiro–Wilk test for normality to determine whether residuals for each distribution were normally distributed (P > 0.05). We then compared the abundances across experimental groups using a Welch’s two sample independent t test. If any distribution being compared was not normally distributed (Shapiro–Wilk P value < 0.05), we used the Wilcoxon rank-sum test. We tested pairwise correlation relationships between any two channel mRNAs using Pearson or Spearman R values, depending on whether that distribution was normally distributed or not (Shapiro–Wilk test for normality). Comparisons of slopes between two regressions were made using analysis of covariance. All R value comparisons between conditions were done by using a Fisher transformation and Fisher’s Z statistic (8). To reduce errors in abundance and correlation analyses, we applied a Grubbs test for outliers on all distributions to remove outliers. To track the effects of experimental treatments on mRNA relationships, we carried over a system from previously published work (7) whereby we classified a correlation as “strong” if the Pearson or Spearman value was greater than 0.6 with a P value < 0.05. We tracked the effects of experimental manipulations on correlated mRNAs by then tallying the number of these strong correlations in any given condition. We compared mean R values between control and stimulated preparations in LG and PD cells with a Student’s t test.
RESULTS
Gastric Mill Rhythm Activation Changes the mRNA Profile of LG Neurons, but Not PD
We first determined whether ion channel mRNA abundances and pairwise relationships of silent LG neurons changed after becoming active for 8 h as a result of dpon stimulation that turned on the gastric mill rhythm (Fig. 1B). We performed the same measurements in a sample of continuously bursting PD neurons from these same preparations as well. PD has been shown to use its own activity to constrain its mRNA relationships (11), and this activity remains largely unchanged during gastric stimulation (Fig. 1C) (23). Thus, we predicted that PD would experience relatively little change to its mRNA profile, as its activity remains stable, whereas LG should undergo substantial changes relevant to the activation of bursting in these cells.
Active LG neurons exhibited a significantly higher level of ion channel mRNAs when compared with silent LG neurons for 7 of the 11 transcripts we quantified (Fig. 2A and Table 3, Control vs. Stimulated). Specifically, CBNAV, BKKCA, NALCN, SHAB, SHAKER, SHAW1, and SKKCA were all significantly higher in active LGs relative to controls (Welch’s independent two sample t test or Wilcoxon rank-sum test, P < 0.05). Conversely, PD neurons collected from preparations where the gastric network was active for 8 h showed no significant differences in abundances when compared with control PD neurons for any of the 11 channel mRNAs we quantified (Fig. 2B and Table 4).
Figure 2.
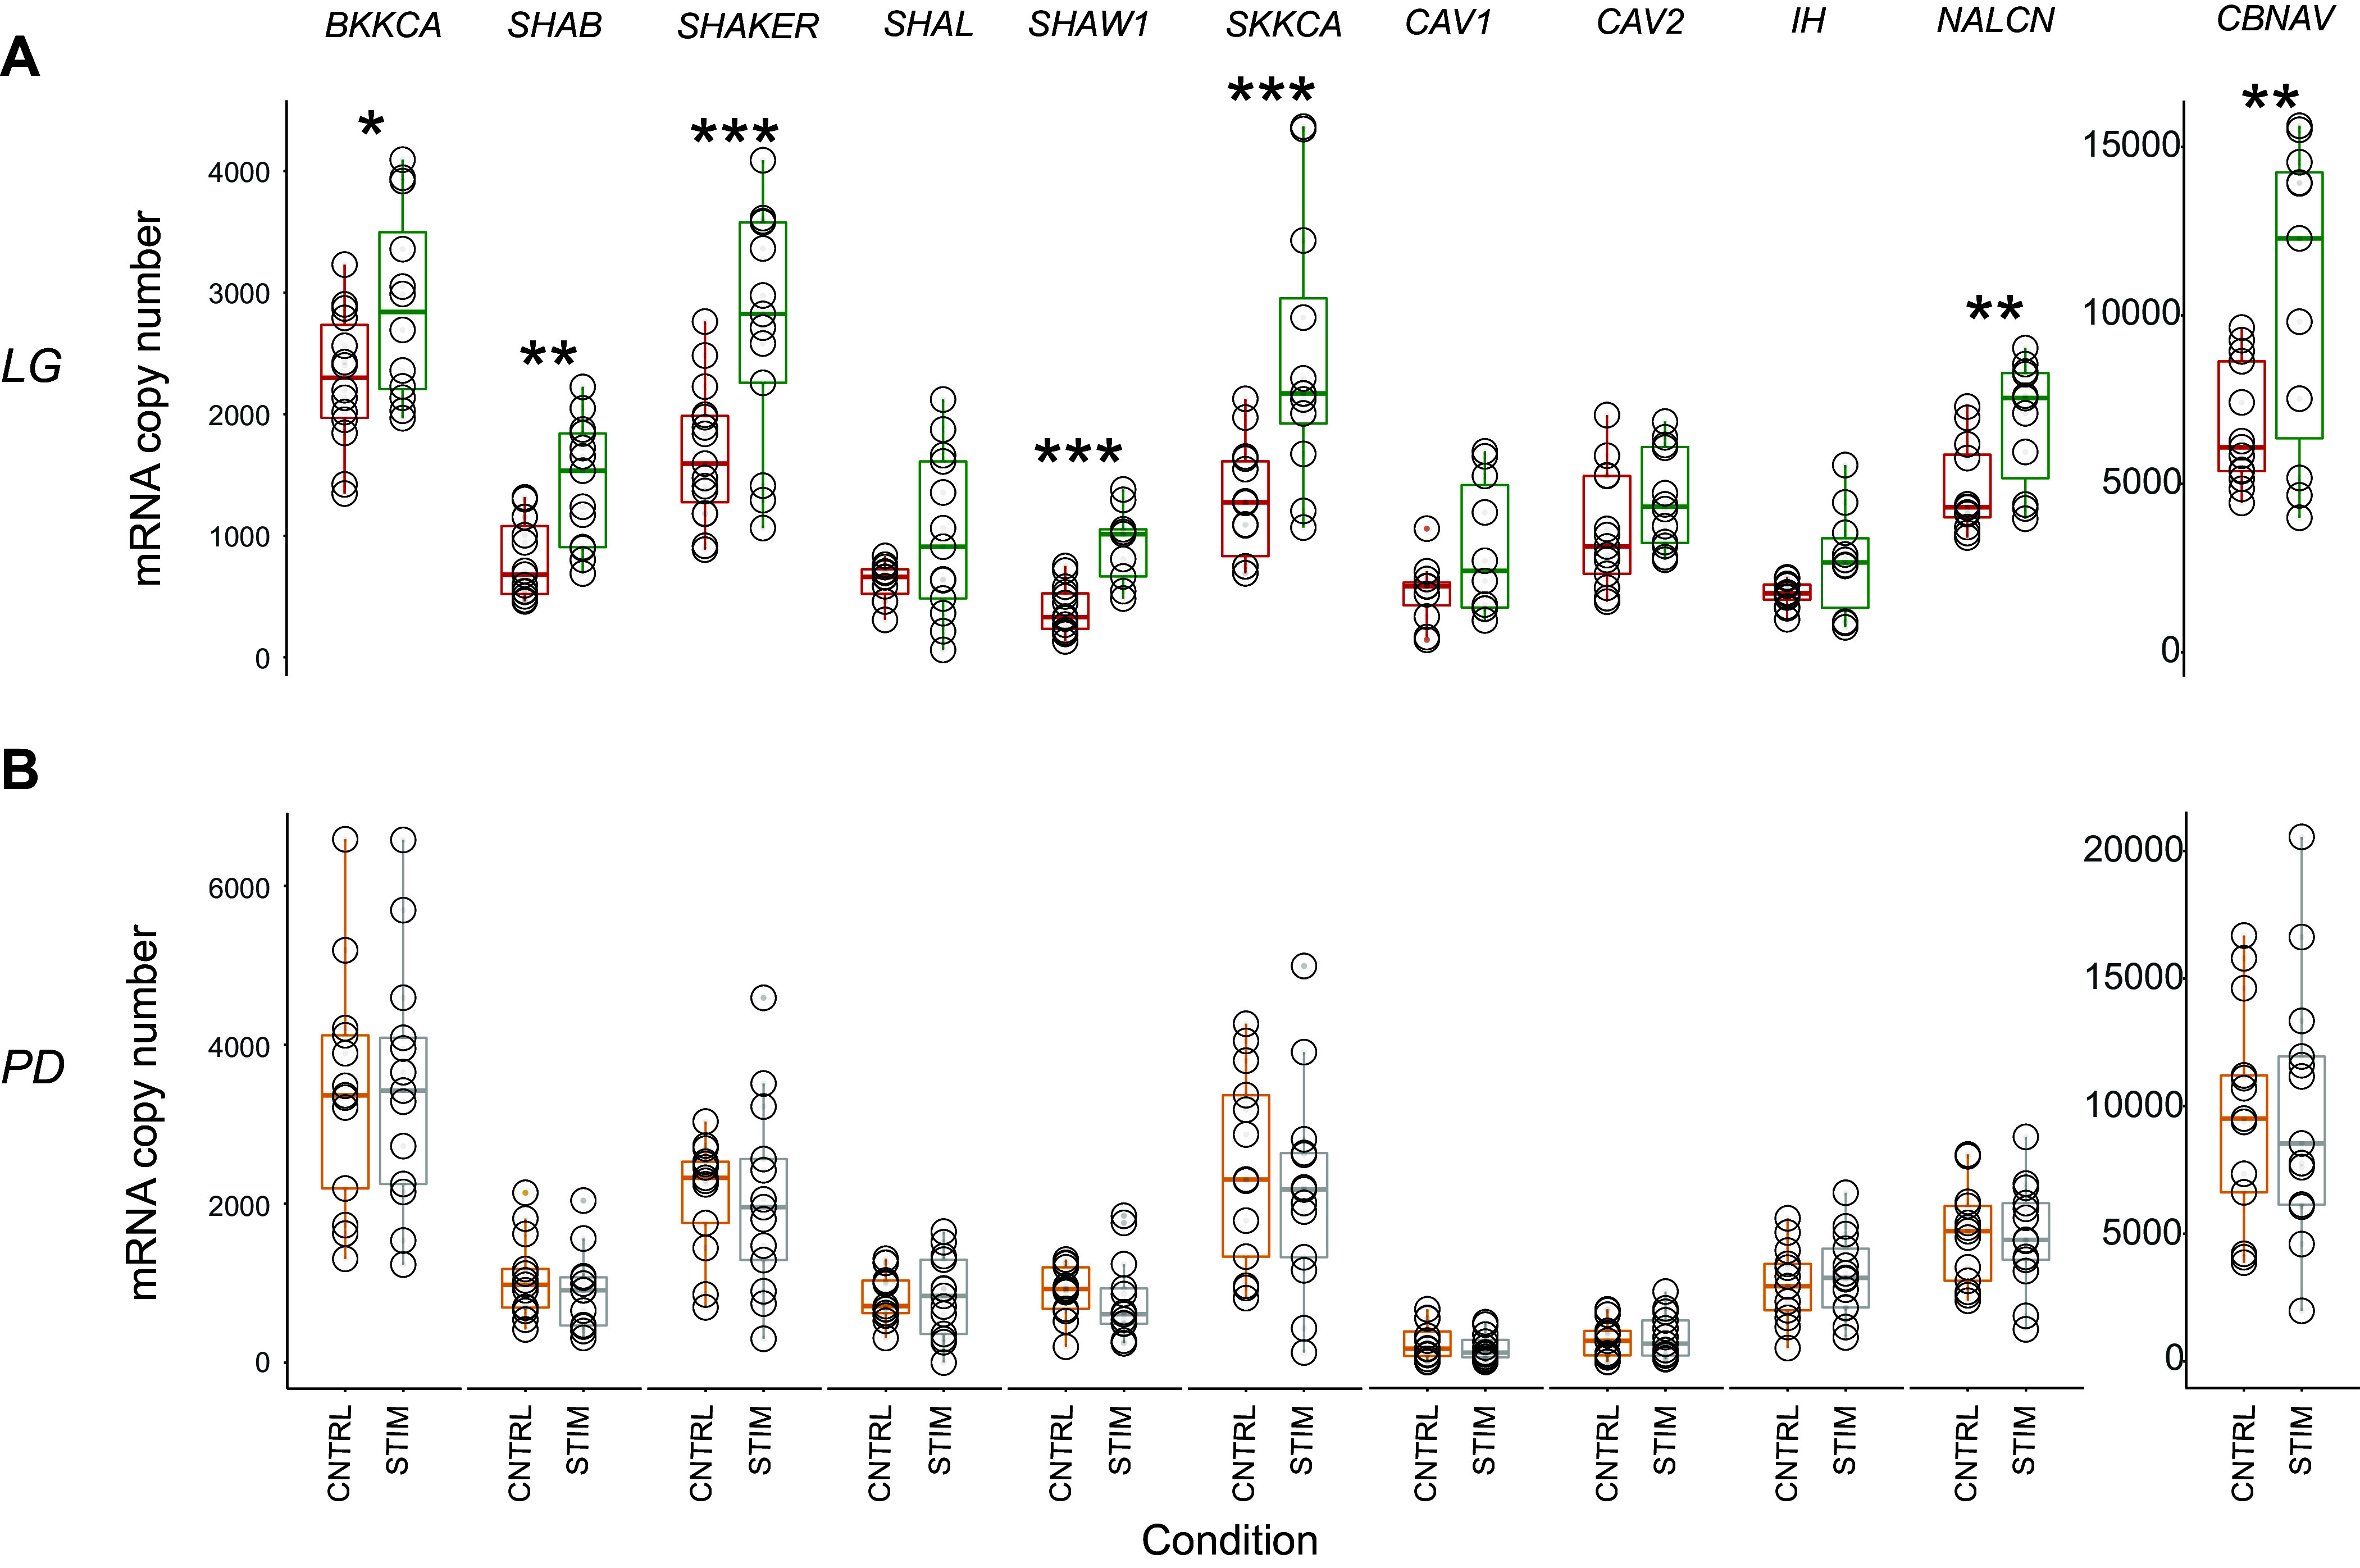
Gastric mill network activity induces changes in ion channel mRNA transcript abundances in LG but not in PD neurons. A: boxplots displaying the mRNA abundances in LG neurons for each of the 11 ion channel genes we quantified. Each circle represents one LG neuron from one of two different conditions: Control (CNTRL, red; n = 12 neurons) where the gastric mill was not active for 8 h and Stimulated condition (STIM, green; n = 13 neurons) where the gastric mill rhythm was active for 8 h. Eight hours of gastric activity (green) induces significant changes in mRNA abundances in LG neurons for 7/11 ion channel mRNA targets (Welch’s independent two-sample t test and Wilcoxon rank-sum test, P < 0.05) when compared with the control condition. *P < 0.05, **P < 0.001, ***P < 0.0001. B: boxplots for PD neurons that were collected from preparations where the gastric mill network was not active for 8 h (CNTRL, gold; n = 13 neurons) and where gastric mill was active for 8 h (STIM, gray; n = 13 neurons). No significant changes were found between the ion channel mRNA abundances in these two conditions (Welch’s independent two-sample t test, P > 0.05). LG, lateral gastric; PD, pyloric dilator.
Table 3.
P values for LG ion channel mRNA abundance comparisons (Welch’s independent two-sample t test or Wilcoxon rank-sum test)
| Gene | Control vs. Stimulated | Control vs. Depolarized | Control vs. Hyperpolarized | Control vs. TTX | Stimulated vs. Hyperpolarized | Stimulated vs. TTX | Stimulated vs. Depolarized | Depolarized vs. TTX | Depolarized vs. Hyperpolarized | Hyperpolarized vs. TTX |
|---|---|---|---|---|---|---|---|---|---|---|
| NALCN | 0.013 | 0.020 | 0.020 | 0.130 | 0.900 | 0.340 | 0.550 | 0.560 | 0.870 | 0.500 |
| SKKCA | <0.001 | 0.017 | 0.130 | 0.223 | 0.300 | 0.170 | 0.060 | 0.120 | 0.640 | 0.30 |
| CBNAV | 0.010 | 0.022 | 0.001 | <0.0001 | 0.840 | 0.510 | 0.240 | 0.730 | 0.730 | 0.410 |
| SHAB | 0.004 | <0.0001 | 0.0006 | 0.0002 | 0.140 | 0.330 | 0.010 | 0.170 | 0.660 | 0.890 |
| SHAKER | <0.001 | 0.007 | 0.0001 | 0.0001 | 0.720 | 0.760 | 0.300 | 0.320 | 0.530 | 0.860 |
| SHAW1 | <0.001 | 0.020 | 0.252 | 0.100 | 0.170 | 0.360 | 0.560 | 0.060 | 0.180 | 0.880 |
| SHAL | 0.180 | 0.144 | 0.020 | 0.0001 | 0.210 | 0.070 | 0.600 | 0.070 | 0.350 | 0.090 |
| BKKCA | 0.048 | 0.050 | 0.020 | 0.020 | 0.440 | 0.370 | 0.500 | 0.210 | 0.340 | 0.710 |
| CbCAV1 | 0.080 | 0.170 | 0.005 | 0.003 | 0.900 | 0.020 | 0.560 | 0.020 | 0.600 | <0.0001 |
| CbCAV2 | 0.150 | 0.070 | 0.274 | 0.310 | 0.330 | 0.060 | 0.460 | 0.030 | 0.200 | 0.060 |
| IH | 0.090 | 0.001 | 0.0002 | <0.0001 | 0.070 | 0.440 | 0.170 | 0.250 | 0.840 | 0.470 |
Table 4.
PD ion channel mRNA abundance comparisons between control and stimulated groups
| Gene | Control vs. Stimulated |
|---|---|
| NALCN | 0.080 |
| SKKCA | 0.560 |
| CBNAV | 0.110 |
| SHAB | 0.760 |
| SHAKER | 0.140 |
| SHAW1 | 0.660 |
| SHAL | 0.110 |
| BKKCA | 0.110 |
| CbCAV1 | 0.720 |
| CbCAV2 | 0.380 |
| IH | 0.590 |
P values (Welch’s independent two-sample t test or Wilcoxon rank-sum test) as related to data found in Fig. 2. PD, pyloric dilator.
We then analyzed the 55 possible pairwise ion channel mRNA relationships for LG (Tables 5, 6 and 7) and PD (Table 8) neurons after 8 h of gastric activity. In inactive LG neurons, only 2/55 possible correlations could be classified as “strong” (i.e., Pearson or Spearman value > 0.6, P value < 0.05; Fig. 3, LG 8 h control). However, 27/55 relationships among these mRNAs could be characterized as strong following 8 h of gastric mill activation and LG activity (Fig. 3, LG 8 h stimulated), showing a significant increase in the mean R value of these relationships associated with gastric mill activity (Fig. 3; P < 0.001; t test). Conversely, in PD neurons, there were 35/55 strong correlations in control preparations (Fig. 3, PD 8 h control) and 37/55 in PD neurons from preparations with gastric activity (Fig. 3, PD 8 h stimulated). This net increase in two strong correlations includes five relationships that became more positively correlated in the stimulated group and three relationships that decreased from control to stimulated. There was no significant difference in mean R value of these relationships in PD cells from control and stimulated preparations (Fig. 3; P = 0.127; t test).
Table 5.
LG pairwise Pearson/Spearman R or Rho values for ion channel mRNA relationships that are activity- or modulator-dependent
| Control |
Stimulated |
Depolarized |
Hyperpolarized |
TTX |
||||||
|---|---|---|---|---|---|---|---|---|---|---|
| R Value | P Value | R Value | P Value | R Value | P Value | R Value | P Value | R Value | P Value | |
| Activity-dependent correlations (correlated in Stimulated and Depolarized) | ||||||||||
| CBNAV vs. SHAB | 0.042 | 0.805 | 0.900 | 0.004 | 0.810 | 0.001 | 0.530 | 0.420 | 0.500 | 0.100 |
| CBNAV vs. SHAKER | 0.370 | 0.063 | 0.860 | 0.007 | 0.900 | <0.05 | 0.310 | 0.120 | 0.530 | 0.129 |
| CBNAV vs. BKKCA | 0.422 | 0.138 | 0.850 | 0.003 | 0.830 | 0.002 | −0.150 | 0.360 | 0.390 | 0.240 |
| SHAB vs. SHAL | −0.260 | 0.370 | 0.820 | 0.049 | 0.660 | 0.019 | 0.240 | 0.650 | 0.390 | 0.190 |
| SHAB vs. BKKCA | 0.400 | 0.335 | 0.630 | 0.016 | 0.710 | 0.014 | 0.310 | 0.756 | 0.310 | 0.330 |
| SHAB vs. IH | −0.230 | 0.079 | 0.730 | 0.050 | 0.680 | 0.028 | 0.300 | 0.060 | 0.540 | 0.060 |
| SHAKER vs. SHAL | 0.340 | 0.233 | 0.690 | 0.005 | 0.800 | 0.017 | 0.310 | 0.970 | 0.360 | 0.240 |
| SHAKER vs. BKKCA | 0.240 | 0.411 | 0.710 | 0.012 | 0.800 | 0.007 | 0.220 | 0.480 | 0.038 | 0.910 |
| SHAL vs. BKKCA | 0.170 | 0.587 | 0.900 | 0.040 | 0.750 | 0.008 | 0.240 | 0.340 | 0.180 | 0.640 |
| SHAL vs. IH | 0.340 | 0.080 | 0.870 | 0.012 | 0.940 | <0.05 | 0.240 | 0.730 | 0.260 | 0.400 |
| Modulator-dependent correlations (correlated in Stimulated and Hyperpolarized) | ||||||||||
| NALCN vs. SKKCA | 0.220 | 0.441 | 0.770 | 0.024 | 0.360 | 0.095 | 0.760 | <0.05 | 0.160 | 0.620 |
| NALCN vs. CBNAV | 0.220 | 0.443 | 0.780 | 0.032 | 0.540 | 0.068 | 0.760 | <0.05 | 0.500 | 0.11 |
| NALCN vs. SHAKER | 0.290 | 0.304 | 0.730 | 0.003 | 0.560 | 0.068 | 0.760 | <0.05 | 0.400 | 0.180 |
| SHAB vs. SHAKER | 0.240 | 0.400 | 0.880 | 0.008 | 0.580 | 0.065 | 0.900 | <0.05 | 0.530 | 0.061 |
| SKKCA vs. SHAW1 | 0.001 | 0.9974 | 0.840 | 0.012 | 0.150 | 0.420 | 0.950 | <0.05 | −0.290 | 0.360 |
| SHAB vs. CbCAV2 | 0.120 | 0.694 | 0.760 | 0.019 | 0.330 | 0.300 | 0.730 | <0.05 | 0.320 | 0.290 |
| BKKCA vs. IH | 0.230 | 0.844 | 0.810 | 0.013 | 0.480 | 0.078 | 0.750 | <0.05 | 0.430 | 0.230 |
Pairwise relationships that are considered strong correlations (R value > 0.6, P value < 0.05; Pearson or Spearman correlation) are shown in bold. LG, lateral gastric.
Table 6.
LG pairwise Pearson/Spearman values for ion channel mRNA relationships that were neither activity- nor modulator-dependent
| Control |
Stimulated |
Depolarized |
Hyperpolarized |
TTX |
||||||
|---|---|---|---|---|---|---|---|---|---|---|
| R Value | P Value | R Value | P Value | R Value | P Value | R Value | P Value | R Value | P Value | |
| Correlated in STIM and DEPOLARIZED and HYPERPOLARIZED and TTX | ||||||||||
| NALCN vs. SHAB | 0.280 | 0.311 | 0.630 | 0.020 | 0.640 | 0.035 | 0.890 | <0.05 | 0.66 | 0.015 |
| Correlated in STIM and DEPOLARIZED and HYPERPOLARIZED | ||||||||||
| SKKCA vs. CBNAV | 0.551 | 0.296 | 0.671 | 0.010 | 0.760 | 0.006 | 0.630 | 0.042 | 0.130 | 0.710 |
| SKKCA vs. SHAB | 0.378 | 0.183 | 0.611 | 0.370 | 0.690 | 0.002 | 0.850 | <0.05 | 0.370 | 0.240 |
| CBNAV vs. SHAL | 0.541 | 0.160 | 0.670 | 0.120 | 0.870 | <0.05 | 0.700 | 0.011 | 0.340 | 0.280 |
| CBNAV vs. IH | 0.188 | 0.442 | 0.642 | 0.175 | 0.880 | <0.05 | 0.830 | <0.05 | 0.540 | 0.07 |
| Correlated in STIM and TTX | ||||||||||
| NALCN vs. IH | 0.111 | 0.349 | 0.601 | 0.030 | 0.500 | 0.120 | 0.330 | 0.290 | 0.610 | 0.027 |
| Correlated in STIM | ||||||||||
| CBNAV vs. SHAW1 | 0.023 | 0.921 | 0.612 | 0.045 | 0.390 | 0.210 | 0.150 | 0.650 | 0.400 | 0.22 |
| CBNAV vs. CbCAV2 | 0.167 | 0.280 | 0.640 | 0.018 | 0.210 | 0.520 | 0.250 | 0.430 | 0.380 | 0.230 |
| SHAL vs. CbCAV2 | 0.47 | 0.101 | 0.65 | 0.016 | −0.084 | 0.800 | −0.150 | 0.630 | 0.440 | 0.130 |
| BKKCA vs. CbCAV2 | 0.136 | 0.665 | 0.600 | 0.027 | 0.320 | 0.910 | 0.440 | 0.410 | −0.003 | 0.990 |
| Correlated in DEPOLARIZED and HYPERPOLARIZED | ||||||||||
| SHAB vs. SHAW1 | −0.300 | 0.313 | 0.400 | 0.200 | 0.720 | 0.008 | 0.790 | 0.002 | 0.380 | 0.220 |
| Correlated in CONTROL and HYPERPOLARIZED | ||||||||||
| NALCN vs. CbCAV2 | 0.611 | 0.029 | 0.381 | 0.198 | 0.200 | 0.550 | 0.620 | 0.041 | 0.500 | 0.091 |
| Correlated in CONTROL and TTX | ||||||||||
| SKKCA vs. SHAKER | 0.611 | 0.020 | 0.474 | 0.102 | 0.510 | 0.140 | 0.520 | 0.120 | 0.610 | 0.027 |
| Correlated in DEPOLARIZED | ||||||||||
| NALCN vs. BKKCA | 0.301 | 0.295 | 0.440 | 0.081 | 0.790 | 0.004 | 0.600 | 0.060 | 0.480 | 0.110 |
| SHAKER vs. CbCAV2 | 0.225 | 0.377 | 0.520 | 0.068 | 0.740 | 0.008 | 0.530 | 0.090 | 0.430 | 0.140 |
| CAV1 vs. CbCAV2 | −0.071 | 0.815 | −0.028 | 0.930 | 0.770 | <0.05 | 0.320 | 0.310 | −0.380 | 0.127 |
| Correlated in HYPERPOLARIZED | ||||||||||
| NALCN vs. SHAL | 0.412 | 0.143 | 0.531 | 0.061 | 0.510 | 0.074 | 0.700 | 0.017 | 0.400 | 0.170 |
| SHAB vs. CbCAV1 | 0.186 | 0.524 | 0.448 | 0.143 | 0.110 | 0.770 | 0.620 | 0.032 | −0.270 | 0.410 |
| SHAW1 vs. CbCAV1 | −0.062 | 0.831 | −0.061 | 0.852 | 0.600 | 0.073 | 0.850 | <0.05 | −0.074 | 0.840 |
| SHAW1 vs. CbCAV2 | 0.296 | 0.325 | 0.044 | 0.900 | 0.540 | 0.070 | 0.830 | <0.05 | −0.160 | 0.630 |
Any bold corresponds to R values that were greater than 0.6 and P value <0.05. LG, lateral gastric.
Table 7.
LG pairwise Pearson/Spearman values for ion channel mRNA relationships that were not correlated in any conditions
| Pairwise Relationship | Control |
Stimulated |
Depolarized |
Hyperpolarized |
TTX |
|||||
|---|---|---|---|---|---|---|---|---|---|---|
| R Value | P Value | R Value | P Value | R Value | P Value | R Value | P Value | R Value | P Value | |
| NALCN vs. SHAW1 | 0.200 | 0.500 | 0.388 | 0.212 | 0.470 | 0.150 | 0.360 | 0.280 | 0.440 | 0.150 |
| NALCN vs. CbCAV1 | −0.441 | 0.114 | 0.400 | 0.203 | −0.018 | 0.960 | 0.200 | 0.560 | −0.026 | 0.440 |
| SKKCA vs. SHAL | 0.480 | 0.091 | 0.225 | 0.460 | −0.082 | 0.820 | 0.500 | 0.140 | 0.200 | 0.560 |
| SKKCA vs. BKKCA | 0.310 | 0.282 | 0.363 | 0.133 | 0.015 | 0.970 | 0.510 | 0.130 | 0.380 | 0.220 |
| SKKCA vs. CbCAV1 | −0.120 | 0.682 | 0.090 | 0.778 | −0.210 | 0.960 | 0.180 | 0.620 | 0.210 | 0.560 |
| SKKCA vs. CbCAV2 | 0.167 | 0.205 | 0.263 | 0.386 | 0.007 | 0.980 | 0.370 | 0.290 | 0.520 | 0.084 |
| SKKCA vs. IH | 0.188 | 0.188 | 0.500 | 0.083 | −0.16 | 0.660 | 0.400 | 0.260 | −0.120 | 0.700 |
| CBNAV vs. CbCAV1 | −0.361 | 0.204 | −0.200 | 0.532 | 0.130 | 0.720 | −0.200 | 0.580 | −0.400 | 0.250 |
| SHAKER vs. SHAW1 | −0.333 | 0.243 | 0.354 | 0.260 | 0.500 | 0.130 | 0.410 | 0.210 | 0.050 | 0.880 |
| SHAKER vs. CbCAV1 | −0.350 | 0.219 | 0.100 | 0.760 | 0.340 | 0.340 | 0.370 | 0.260 | −0.510 | 0.110 |
| SHAKER vs. IH | 0.057 | 0.184 | 0.367 | 0.217 | 0.210 | 0.540 | 0.410 | 0.210 | 0.340 | 0.260 |
| SHAW1 vs. SHAL | 0.436 | 0.146 | 0.010 | 0.976 | 0.300 | 0.360 | −0.160 | 0.620 | −0.220 | 0.500 |
| SHAW1 vs. BKKCA | −0.041 | 0.877 | 0.100 | 0.404 | 0.370 | 0.240 | 0.140 | 0.660 | −0.066 | 0.840 |
| SHAW1 vs. IH | 0.160 | 0.226 | 0.026 | 0.934 | 0.001 | 0.980 | 0.170 | 0.600 | 0.370 | 0.240 |
| SHAL vs. CbCAV1 | −0.067 | 0.096 | −0.116 | 0.719 | −0.200 | 0.600 | −0.180 | 0.580 | −0.510 | 0.110 |
| BKKCA vs. CbCAV1 | −0.02 | 0.927 | −0.256 | 0.254 | −0.100 | 0.800 | −0.095 | 0.770 | 0.340 | 0.330 |
| CbCAV1 vs. IH | −0.367 | 0.755 | 0.135 | 0.674 | −0.340 | 0.340 | −0.061 | 0.850 | −0.280 | 0.41 |
| CbCAV2 vs. IH | 0.500 | 0.882 | 0.415 | 0.158 | −0.180 | 0.600 | 0.340 | 0.280 | 0.025 | 0.94 |
All R values are less than 0.6 (P value > 0.05). LG, lateral gastric.
Table 8.
PD pairwise Pearson R and P values for ion channel mRNA relationships that became strong after gastric mill activation
| Pairwise Relationship | Control |
Stimulated |
||
|---|---|---|---|---|
| R Value | P Value | R Value | P Value | |
| NALCN vs. CbCAV2 | −0.028 | 0.930 | 0.610 | 0.046 |
| SKKCA vs. CbCAV2 | −0.059 | 0.850 | 0.710 | 0.041 |
| CBNAV vs. SHAW1 | 0.460 | 0.120 | 0.620 | 0.023 |
| SHAW1 vs. BKKCA | 0.390 | 0.190 | 0.600 | 0.034 |
| CbCAV1 vs. CbCAV2 | −0.014 | 0.960 | 0.830 | <0.05 |
These PD pairwise relationships became more correlated after stimulation of gastric activity. Control refers to PD neurons collected from intact preparations where the gastric mill rhythm was not on, but the pyloric rhythm was fully active. Stimulated state refers to PD neurons collected from preparations where the gastric mill rhythm was activated for 8 h. PD, pyloric dilator. Bold corresponds to R values that were greater than 0.6 and P value < 0.05.
Figure 3.
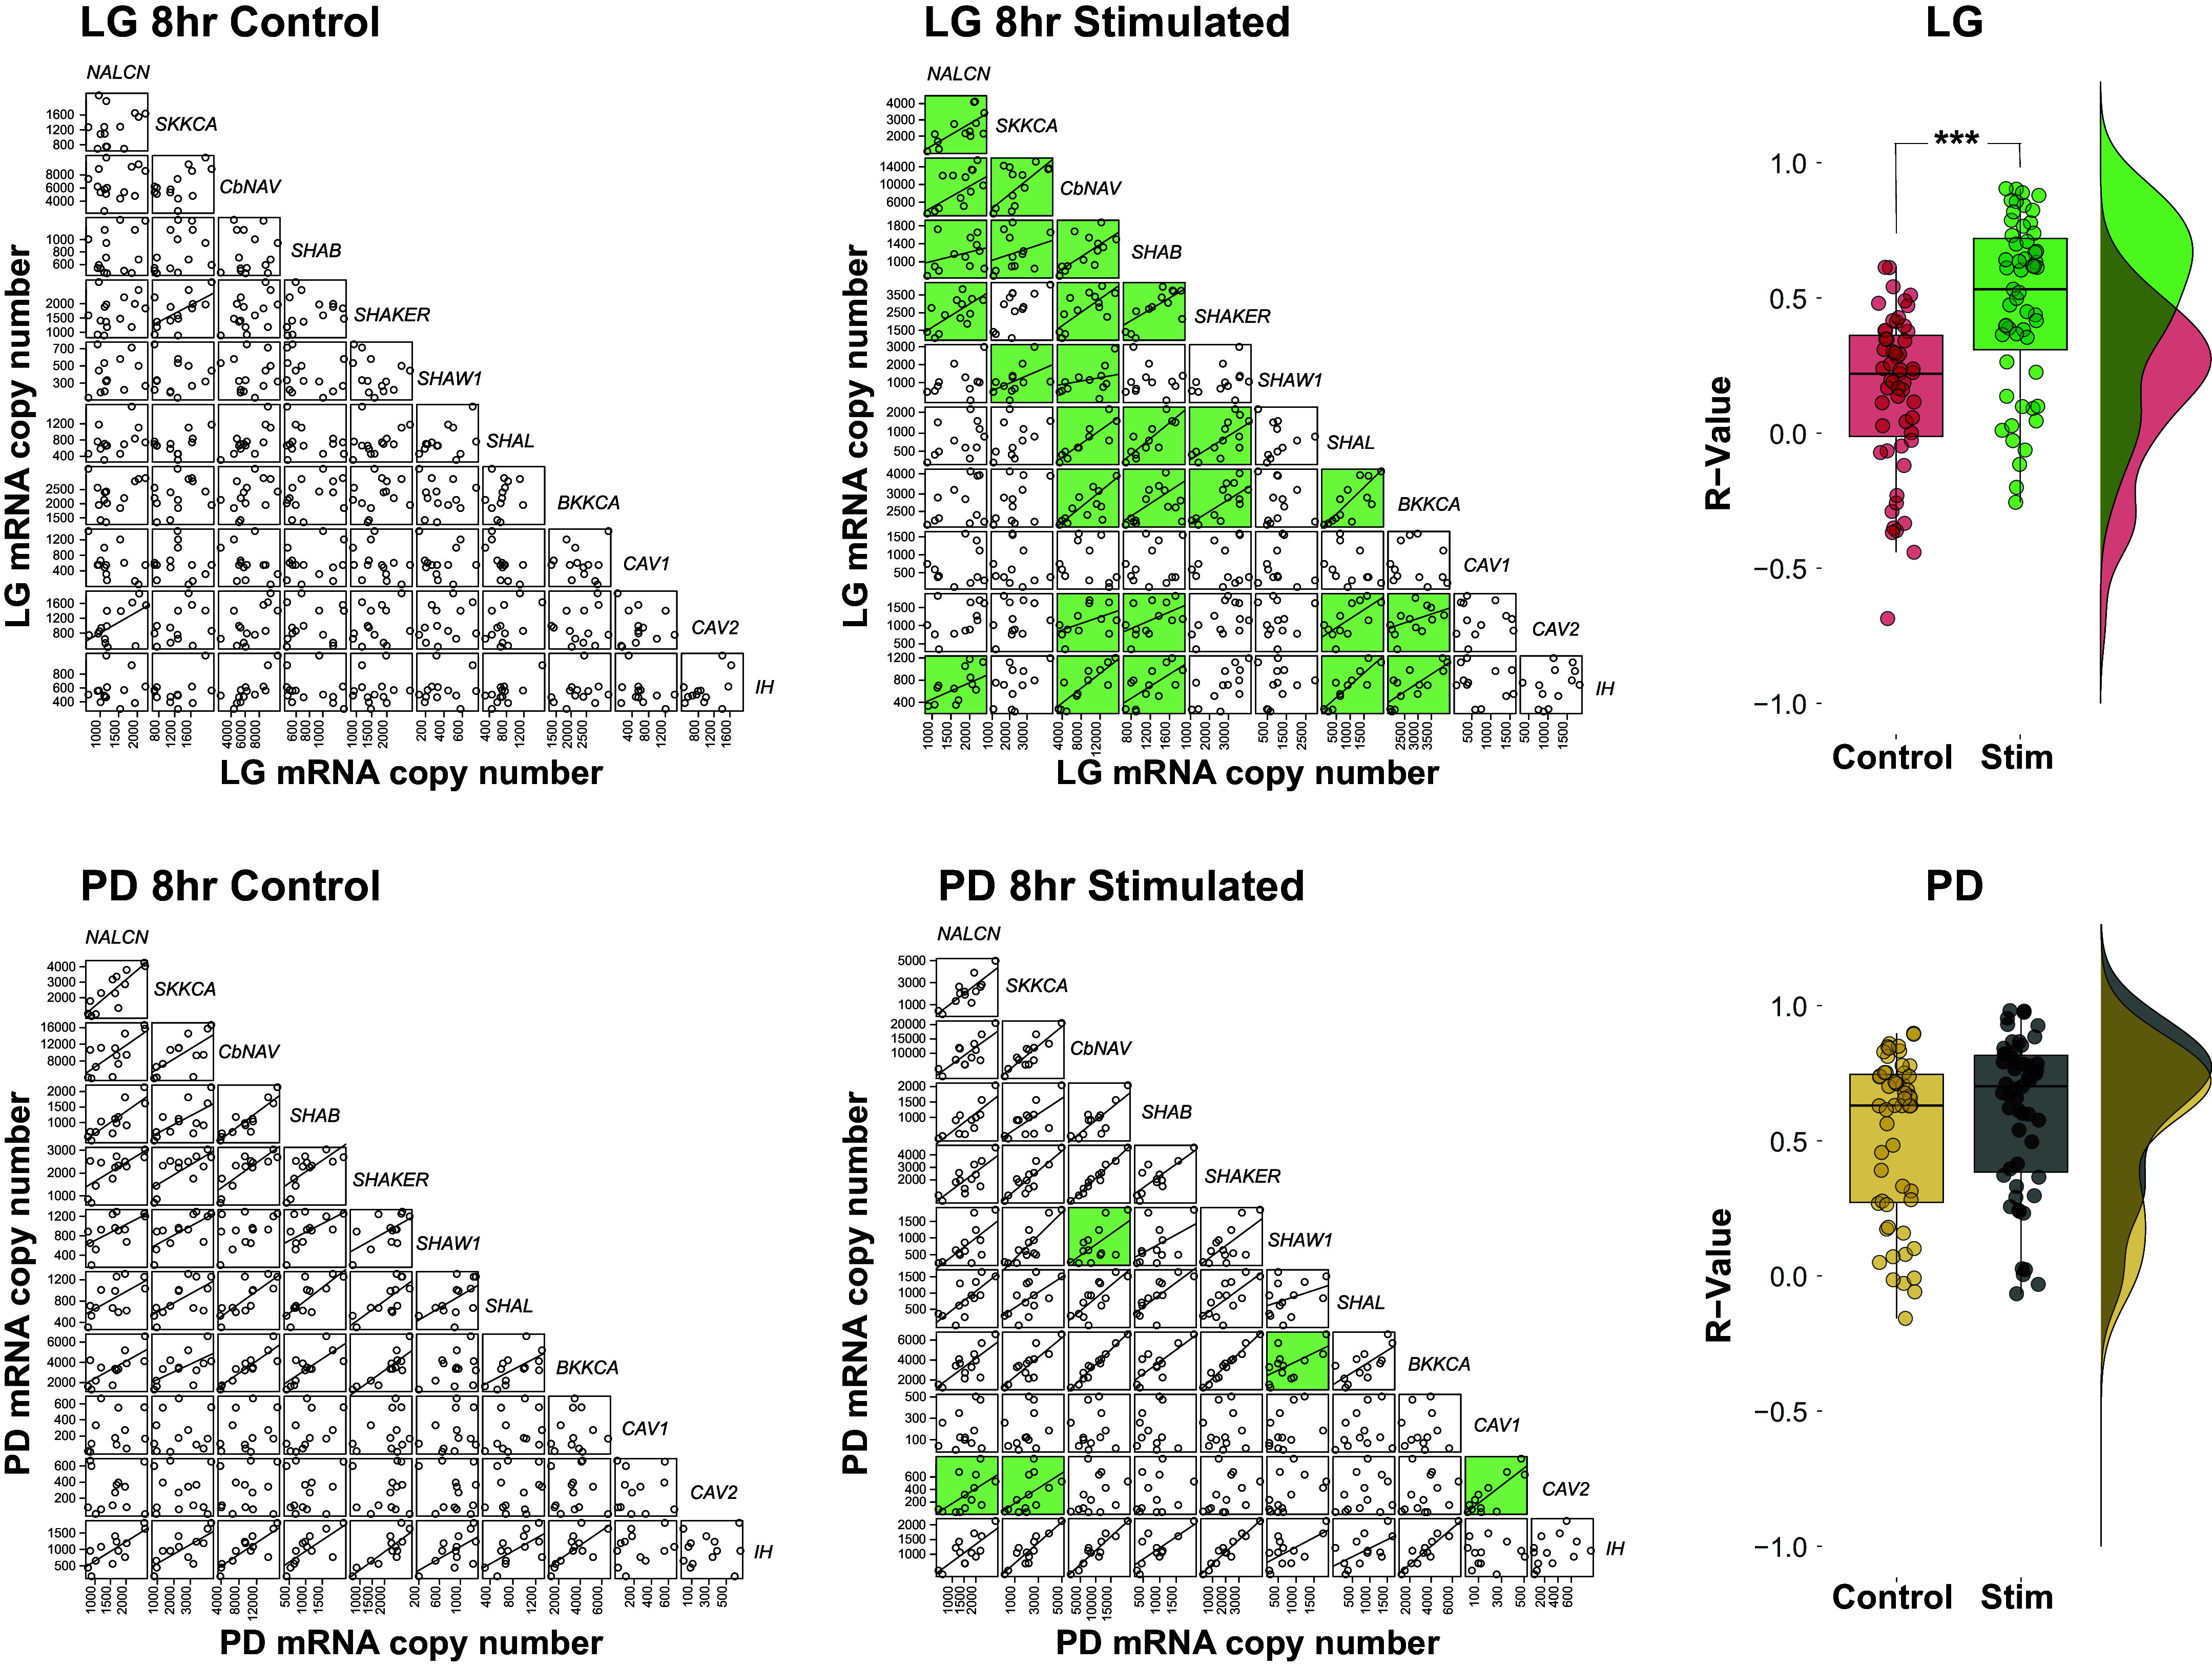
Gastric mill network activity induces more positively correlated ion channel mRNA relationships to form in LG than in PD neurons. Scatterplots of all possible mRNA ion channel relationships for LG and PD neurons in control (GMR OFF; n = 12 and n = 13 neurons, respectively) and stimulated (GMR ON; n = 13 and n = 13 neurons, respectively) preparations. Each point represents one cell. Strong correlations (Pearson or Spearman value > 0.6, P value < 0.05) are denoted by the plotting of a line of best fit. Relationships that become strongly correlated after 8 h of gastric activity (GMR ON) are highlighted with green boxes. Top: after 8 h of gastric activity, 27/55 relationships become more positively correlated in LG-stimulated neurons. This is also represented by a significant increase in the overall R values in stimulated versus control LG cells (far right, ***P < 0.001 via Student’s t test). Bottom: after 8 h of gastric activity (GMR ON), 5/55 relationships become strongly correlated in PD neurons relative to control PD neurons. There were no differences in the mean collective R values of channel mRNA relationships in PD neurons from stimulated or control preparations. LG, lateral gastric; PD, pyloric dilator.
LG Neurons Receive Feedback That Influences Channel mRNA Levels Even When the Gastric Mill Rhythm Is Off
We next asked whether there is a baseline level of modulation that helps establish the mRNA profile of inactive LG neurons when the gastric mill rhythm is off. Although control LG neurons are not active, they are still receiving descending neuromodulatory inputs, although not the full complement of neuromodulators necessary to initiate their rhythmic bursting activity (40). To remove the influence of endogenous descending modulation, we kept the STG in a decentralized state for a period of 8 h. Decentralization was achieved by first bath applying tetrodotoxin (TTX) to the entire STNS preparation and then cutting the stomatogastric nerve (stn). This two-step approach stops transmission of all neuromodulatory substances from the commissural ganglia (CoG) and esophageal ganglion (OG) to the STG (8). There is not a noticeable change in activity of decentralized LG neurons relative to controls; both are silent (see Fig. 1B for Control recording). For ion channel mRNA abundances, 7 out of 11 were significantly different in the TTX group (Fig. 4 black boxplots; Table 3) relative to control LG neurons (Fig. 4 red boxplots; Table 3). Six of these (CBNAV, BKKCA, IH, SHAB, SHAKER, and SHAL) were significantly higher and one (CAV1) was significantly lower (Fig. 4 and Table 3). Conversely, only one channel mRNA abundance, CAV1, was significantly different between the TTX and Stimulated group (Fig. 1D, Stimulated), where gastric activity was elicited for 8 h (Fig. 4 and Table 3). Only two channel correlations were found to differ between Control and TTX groups, and both involve the sodium leak channel NALCN; both NALCN-SHAB and NALCN-IH were significantly correlated in the TTX group but not the Controls.
Figure 4.
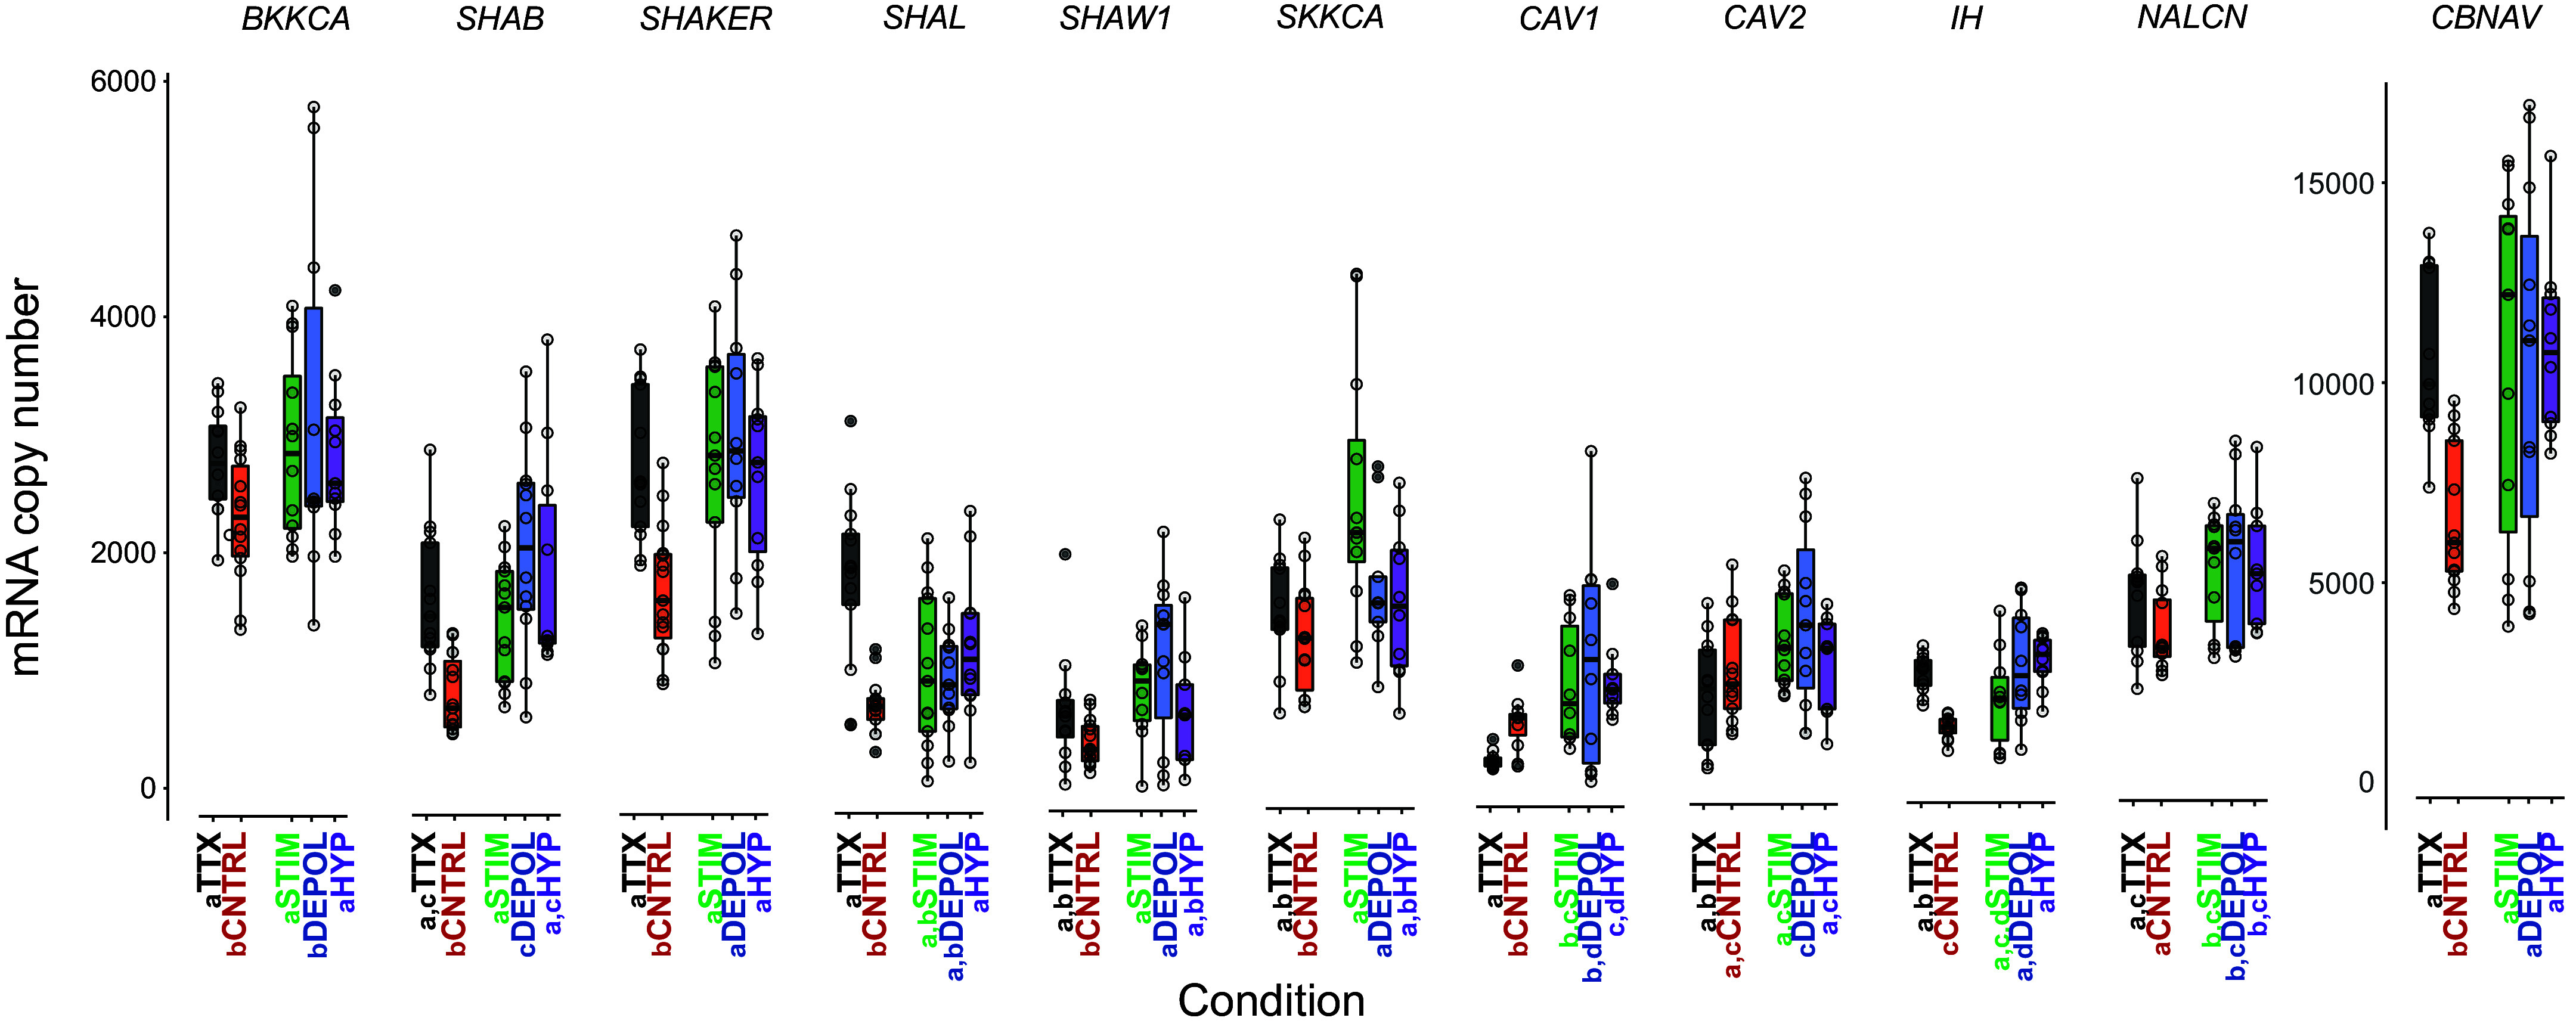
Pairwise comparisons of LG ion channel mRNA abundances across five experimental groups. Boxplots displaying the mRNA abundances for 11 ion channel mRNAs in five experimental groups. Each circle represents one single LG neuron from the five different conditions: Control (red, n = 12) where the gastric mill was not active for 8 h; TTX condition (black, n = 11 neurons) where TTX was bath applied, the stn cut, and the preparation incubated for 8 h; Stimulated condition (green, n = 13 neurons) where the gastric mill rhythm was active for 8 h; Depolarized (blue, n = 11 neurons) where the gastric mill rhythm was not induced but where LG neurons were depolarized for 8 h in the absence of modulatory inputs from the CoGs; Hyperpolarized (purple, n = 11) where LG neurons were hyperpolarized for 8 h but were still under the influence of gastric network modulatory inputs. For each gene, if the same letter is found in front of the group names for two different groups, we found no significant differences between those conditions (Welch’s independent two-sample t test or Wilcoxon’s rank-sum test, P > 0.05). Different letters (present in one and missing in another) correspond to significant differences between those conditions (Welch’s independent two-sample t test and Wilcoxon’s rank-sum test, P > 0.05). CoGs, commissural ganglias; LG, lateral gastric; TTX, tetrodotoxin.
Multiple Feedback Signals Constrain the Ion Channel mRNA Profiles of LG Neurons When the Gastric Mill Rhythm Is On
We then set out to determine the nature of the signals that were inducing and maintaining the mRNA profiles present in LG during stimulation that elicits the gastric mill rhythm (Table 2). We separated LG’s own activity (i.e., membrane voltage) from neuromodulatory inputs (i.e., the metabotropic effects of modulatory compounds) and measured differences in the ion channel mRNA profile relative to the active state. To isolate the influence of membrane voltage (i.e., activity), we used STG preparations that received no gastric mill stimulation for 8 h and where both inferior esophageal nerves (ions) were cut. This prevented spontaneous gastric activity by blocking the transmission of descending neuromodulation from the CoGs to the gastric circuit (36). We then current clamped LG neurons to a depolarized waveform (0.125-Hz stimulation with a 75% duty cycle) for a duration of 8 h (Fig. 1D, Depolarized). This current-clamp protocol approximated LG’s own native active state while preserving LG’s connectivity within the STG, but in the absence of neuromodulation that activates gastric activity. For ion channel mRNA abundances in this Depolarized group (Fig. 4, blue boxplots) 8 out of 11 were significantly different relative to control LG neurons (Fig. 4, red boxplots). All eight of these channel mRNAs (CBNAV, CAV1, IH, NALCN, SHAB, SHAKER, SHAW1, and SKKCA) were significantly higher relative to control (Fig. 4 and Table 3). Conversely, only two channel mRNAs, BKKCA and SHAB, were significantly different in their abundances between the Depolarized and Stimulated group, where gastric activity was elicited for 8 h (Fig. 4 and Table 3).
To isolate the effects of only neuromodulation, we initiated and sustained gastric mill activity with dpon stimulation as described previously, but then immediately current clamped LG to a hyperpolarized state with −5 nA to −10 nA of DC current for 8 h to prevent its normal firing activity and hold this to a silent state that approximated that of control inactive cells (Fig. 1D, Hyperpolarized). Gastric mill activity is initiated by the convergence of C. borealis tachykinin-related peptide Ia (CabTRP Ia) onto LG, which gives rise to its characteristic waveform (40) (Fig. 1D, Stimulated). However, this peptide also converges to gastric neurons like the dorsal gastric (DG) neuron to further finetune gastric activity (40). During these hyperpolarization experiments, we indirectly confirmed the release and presence of descending gastric neuromodulatory substances from the CoGs due to the activation of DG bursting visible on the dorsal gastric nerve recording (Fig. 1D, Hyperpolarized, see dgn record). For ion channel mRNA abundances in this Hyperpolarized group (Fig. 4 and Table 3), 8 out of 11 were significantly different (purple boxplots) relative to control LG neurons (red boxplots). All eight of these channel mRNAs (CBNAV, BKKCA, CAV1, IH, NALCN, SHAB, SHAKER, and SHAL) were significantly higher relative to control (Fig. 4 and Table 3). Conversely, none of the channel mRNA abundances were significantly different between the Hyperpolarized and Stimulated groups (Fig. 4 and Table 3).
Lastly, these experiments also allow us to determine the nature of the feedback that is constraining pairwise mRNA correlations as well. We characterized these as follows: 1) if a pairwise relationship formed during stimulated gastric activity and was present also only in the Depolarized group (but not the Hyperpolarized group), then this pairwise relationship is classified as activity-dependent and 2) if a pairwise relationship formed during gastric activity and was present also only in the Hyperpolarized group (but not the Depolarized group), then this relationship could be classified as modulator-dependent. We found 27/55 possible LG ion channel mRNA relationships were strongly correlated after 8 h of gastric activity (Fig. 3, top). Based on our analysis, 10 of these pairwise relationships could be classified as activity-dependent (Fig. 5A). These activity-dependent relationships in Fig. 5A had neither slopes (analysis of covariance; P value > 0.05; Table 9) nor Pearson or Spearman values (Fisher transformation and Fisher’s Z statistic; P value > 0.05; Table 9) that were significantly different between the Stimulated and Depolarized groups. We also classified seven pairwise relationships as modulator-dependent (Fig. 5B). All modulator-dependent relationships in Fig. 5B had neither slopes nor Pearson or Spearman values that were significantly different between the Stimulated and Hyperpolarized groups (Table 10). Figure 6 (left) summarizes the classification of both types of feedback mechanisms on pairwise relationships in LG neurons.
Figure 5.
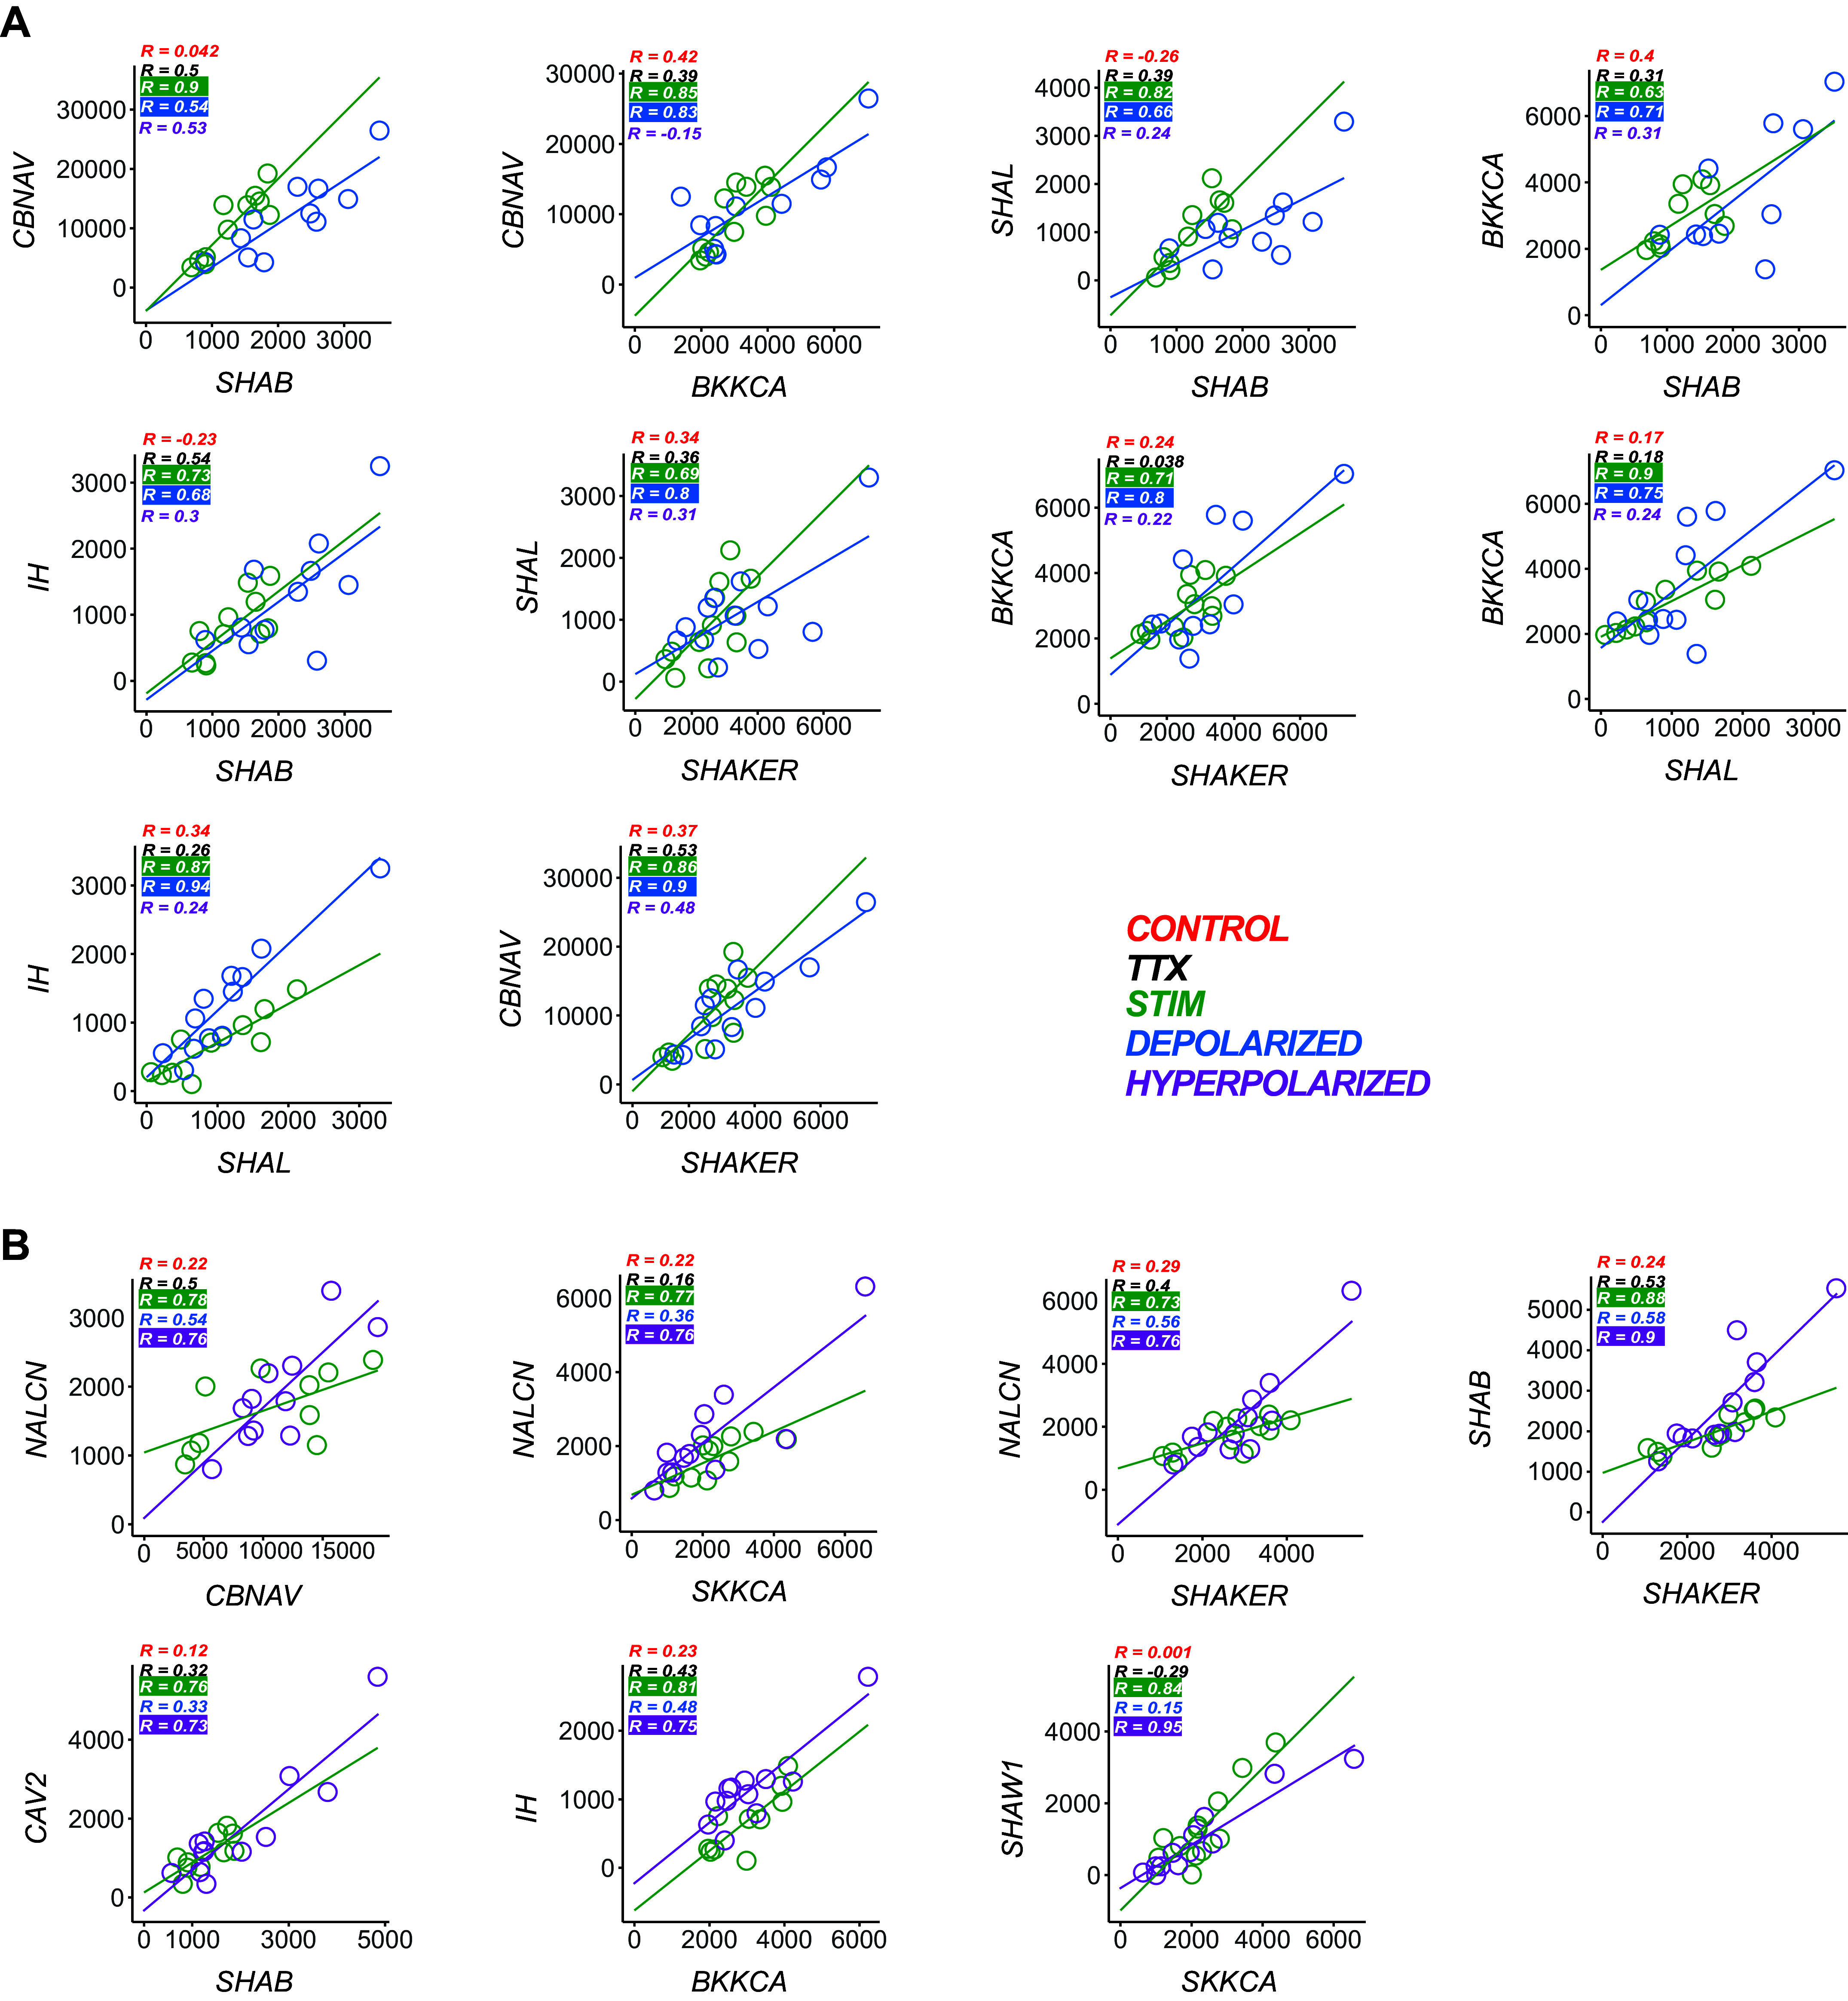
Activity- and neuromodulator-dependent channel mRNA relationships in LG neurons. A: activity-dependent ion channel mRNA relationships in LG neurons. Each plot consists of a pair of channel mRNAs that were strongly correlated in both the Stimulated (green, n = 13) and the Depolarized (blue, n = 11) groups. These are considered activity-dependent relationships. None of the R values for these correlations in the Stimulated and Depolarized groups were significantly different across groups (Fisher transformation and Fisher’s Z statistic; P > 0.05). Furthermore, the slopes for the Stimulated (green) versus Depolarized (blue) conditions also were not significantly different from each other [analysis of covariance (ANCOVA) P > 0.05]. R values are also listed for each relationship in Control (red), TTX (black), and Hyperpolarized (purple) groups to denote the lack of a strong pairwise correlation in these groups for these channel mRNAs. B: modulator-dependent ion channel mRNA relationships in LG neurons. Each plot consists of a pair of channel mRNAs that were strongly correlated in both the Stimulated (green, n = 13) and the Hyperpolarized (purple, n = 11) groups. These are considered modulator-dependent relationships. None of the R values for these correlations in the Stimulated and Hyperpolarized groups were significantly different across groups (Fisher transformation and Fisher’s Z statistic; P > 0.05). Furthermore, the slopes for the Stimulated (green) versus Hyperpolarized (purple) conditions also were not significantly different from each other [analysis of covariance (ANCOVA) P > 0.05). R values are also listed for each relationship in Control (red), TTX (black), and Depolarized (blue) groups to denote the lack of a strong pairwise correlation in these groups for these channel mRNAs. LG, lateral gastric.
Table 9.
LG activity-dependent ion channel mRNA correlations: ANCOVA P values and Fisher’s Z statistics
| Relationship | Stimulated R Value | Depolarized R Value | ANCOVA P Value | Fisher Z Statistic |
|---|---|---|---|---|
| CBNAV vs. SHAB | 0.900 | 0.810 | 0.9720 | 0.662 |
| CBNAV vs. BKKCA | 0.850 | 0.830 | 0.5723 | 0.890 |
| SHAL vs. SHAB | 0.820 | 0.660 | 0.3240 | 0.470 |
| BKKCA vs. SHAB | 0.630 | 0.710 | 0.9230 | 0.750 |
| IH vs. SHAB | 0.730 | 0.680 | 0.9990 | 0.828 |
| SHAL vs. SHAKER | 0.690 | 0.800 | 0.5080 | 0.605 |
| BKKCA vs. SHAKER | 0.710 | 0.800 | 0.9410 | 0.653 |
| BKKCA vs. SHAL | 0.900 | 0.750 | 0.6630 | 0.318 |
| IH vs. SHAL | 0.870 | 0.940 | 0.1400 | 0.390 |
| CBNAV vs. SHAKER | 0.860 | 0.900 | 0.7040 | 0.333 |
We used ANCOVA to analyze potential differences in the slopes of relationships, and Fisher’s Z to compare R values across conditions. Both tests were only performed between correlations that were strong in both the stimulated and depolarized correlations (R > 0.6, P value < 0.05). When the same relationship was found in Stimulated and Depolarized groups, there were no significant differences in the slope or R value of any of those relationships. LG, lateral gastric.
Table 10.
LG modulator-dependent ion channel mRNA correlations: ANCOVA P values and Fisher’s Z statistics
| Relationship | Stimulated R Value | Depolarized R Value | ANCOVA P Value | Fisher Z Statistic |
|---|---|---|---|---|
| NALCN vs. CBNAV | 0.780 | 0.760 | 0.255 | 0.919 |
| NALCN vs. SKKCA | 0.770 | 0.760 | 0.480 | 0.962 |
| SHAKER vs. NALCN | 0.730 | 0.760 | 0.060 | 0.886 |
| SHAB vs. SHAKER | 0.880 | 0.900 | 0.734 | 0.842 |
| SHAB vs. CbCAV2 | 0.760 | 0.730 | 0.900 | 0.900 |
| BKKCA vs. IH | 0.810 | 0.750 | 0.185 | 0.760 |
| SKKCA vs. SHAW1 | 0.840 | 0.950 | 0.370 | 0.195 |
We used ANCOVA to analyze potential differences in the slopes of relationships and Fisher’s Z to compare R values across conditions. Both tests were only performed between correlations that were strong in both the Stimulated and Hyperpolarized correlations (R > 0.6, P value < 0.05). When the same relationship was found among these groups, there were no significant differences in the slope or R value of any of those relationships. LG, lateral gastric.
Figure 6.
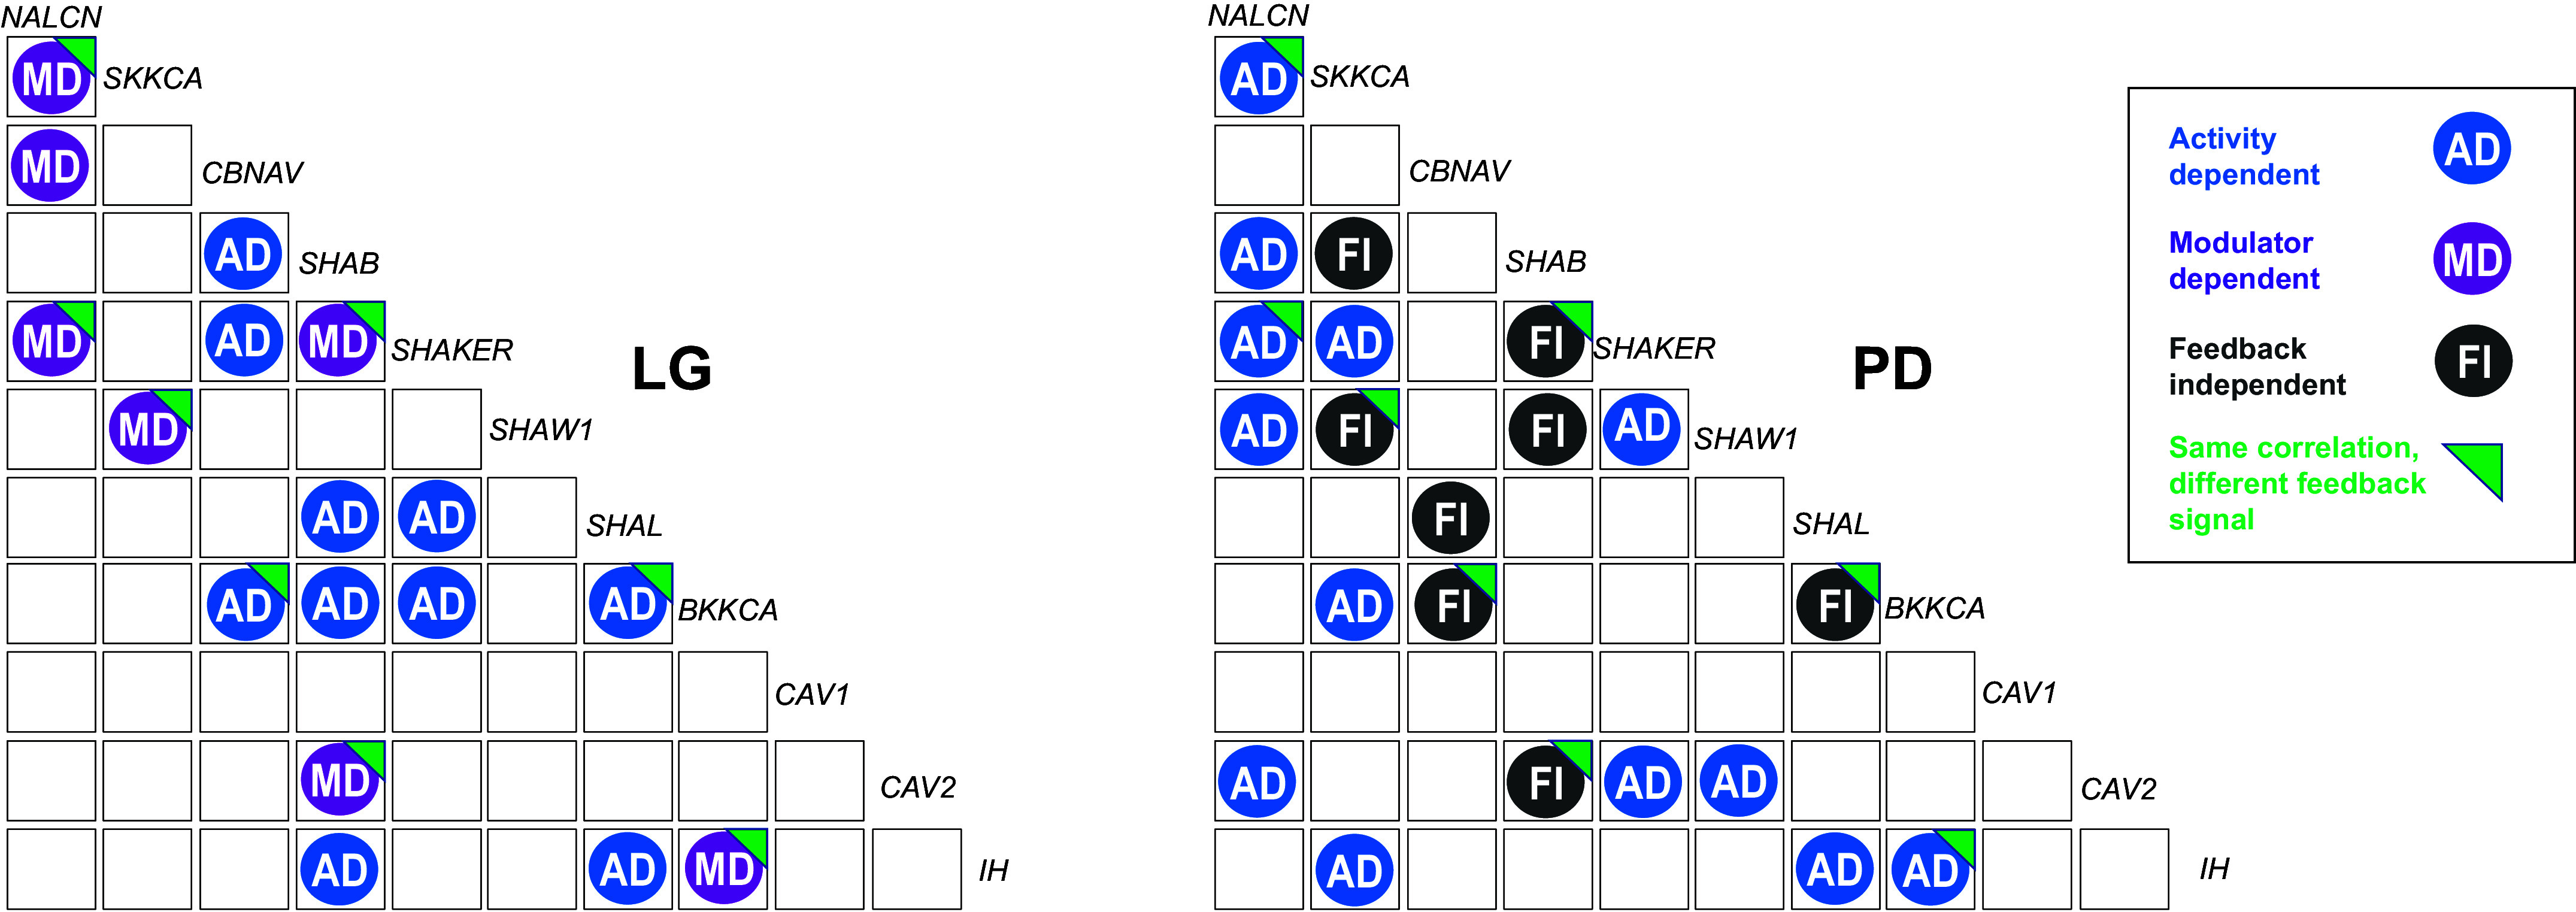
The same ion channel mRNA relationship can be present in LG and PD neurons, but the feedback mechanism constraining that relationship is different. Correlogram of shared ion channel mRNA relationships for LG (left) and PD (right) neurons. All of the relationships that could be attributed to either activity- or modulator-dependent in LG in our study are shown on the left (n = 17 relationships). Relationships previously identified as either activity-dependent or feedback-independent in PD neurons are shown on the right. Blue circles represent ion channel mRNA relationships that are constrained by activity-dependent (AD) feedback; purple circles represent ion channel mRNA relationships constrained by modulator-dependent feedback (MD); black circles represent ion channel mRNA relationships that are independent of either feedback mechanism (FI). Green right triangles on a circle represent relationships present in both LG and PD neurons, but that are constrained by a different feedback mechanism. The nature of PD relationships is taken from published work by Santin and Schulz (11) and were not experimentally determined in the data collected in this study. LG, lateral gastric; PD, pyloric dilator.
Ion Channel mRNA Correlations That Are Present in LG during Gastric Mill Activity Also Are Present in PD Neurons, but Are Constrained by Different Feedback Mechanisms
Because work has been previously published to determine the nature of the feedback mechanisms that constrain pairwise channel mRNA relationships in PD neurons (11), we did not repeat those experiments here. However, we can use those results to compare whether the same channel mRNA relationships found in PD and LG neurons are constrained by the same or different mechanisms. Figure 6 shows the subset of relationships (n = 17) that we have definitively identified as either activity- or modulator-dependent in LG cells alongside those relationships that were identified as either activity-dependent or feedback-independent in PD neurons by Santin et al. (see Ref 11). A total of eight of these ion channel mRNA correlations are shared by PD and LG (Fig. 6). Three activity-dependent relationships in PD cells (NALCN-SKKCA, NALCN-SHAKER, and BKKCA-IH) were neuromodulator-dependent in LG cells, whereas three relationships (SKKCA-SHAW1, SHAB-SHAKER, and SHAB-CAV2) that are feedback independent in PD cells were modulator-dependent in LG. Finally, one additional feedback-independent relationship in PD cells (CBNAV-BKKCA) was found to be activity-dependent in LG. The only pairwise relationship found to be activity-dependent in both LG and PD was SHAL and IH.
DISCUSSION
In this study, we have shown that different motor neuron subtypes within the stomatogastric ganglion use distinct feedback strategies to potentially coregulate the same ion channel mRNAs (Fig. 6). Specifically, the periodically active LG neuron of the gastric mill network uses a combination of activity-dependent and neuromodulator-dependent feedback (Fig. 5) to induce and coordinate new ion channel mRNA correlations that form during its active state (Fig. 3). Many of these mRNA relationships are also present in PD neurons but in PD, these are constrained predominantly by activity-dependent feedback (11). Thus, although regulation of steady-state mRNA has previously been shown to be activity-dependent (9, 11, 41–44) or neuromodulation-dependent (8, 45), our results demonstrate the presence of both feedback mechanisms in parallel within a single neuron (LG). More striking is the realization that a given channel mRNA pair can be under activity-dependent control in one neuron type, whereas the same relationship can be neuromodulator-dependent in another cell in the same ganglion.
Stimulation of descending modulatory projections activates the gastric mill pattern generator, including bursting activity in LG neurons and induces the formation of 27 distinct channel mRNA relationships relative to LG cells in their silent states. By decoupling the influences of activity (i.e., membrane voltage) and neuromodulation (i.e., metabotropic signaling) in LG cells, we reveal a complex system of regulation that works to constrain the entirety of the channel mRNA profile in active LG cells through at least four distinct feedback mechanisms. We identified 10-channel mRNA correlations that we classify as activity-dependent, whereby the majority of the regulation of those relationships can be attributed to membrane voltage. Specifically, when no stimulation of descending modulatory projections was applied, but LG neurons were current-clamped to a pattern of spiking activity that was reminiscent of stimulated gastric activity, these correlations were evident. We also identified seven relationships that were neuromodulator-dependent. That is, when descending modulatory projections were stimulated but LG membrane voltage was held constant (and at a hyperpolarized level), these correlations were present. The majority of the conclusions we draw in this study are based on the comparison of these two distinct and separable forms of feedback regulation on channel mRNA relationships across neurons of the STG. However, we also could classify two other apparent channel relationships. We identified those that were apparently dependent on both activity and neuromodulation (n = 5), where correlations were only detected when descending modulatory projections were stimulated and activity was ongoing (Table 6). Lastly, we detected a group of relationships that were seemingly dependent on either activity or modulation (n = 5; Table 6). These correlations were present when the gastric mill was activated by stimulating descending projections and persisted both in the Depolarized (activity only) and Hyperpolarized (modulation only) experimental groups. Finally, there were many potential channel mRNA relationships in LG that either were never correlated in any condition (n = 18; Table 7) or could not be classified based on our experimental design (n = 10; Table 6).
After identifying distinct activity- and neuromodulator-dependent channel mRNA relationships in LG cells, we examined these relationships across cell types by comparing with known activity-dependent mechanisms in PD cells. Most striking in these comparisons is that three relationships that are activity-dependent in PD cells are neuromodulator-dependent in LG cells. A further four relationships are feedback independent in PD cells; they persist in PD regardless of whether activity or modulation is present (11). Three of these relationships are modulator-dependent in LG, whereas one is activity-dependent. Thus, there must exist distinct regulatory pathways for constraining these relationships in different cells, even cells of the same ganglia. The existence of clear cell-type specific signaling pathways is both intuitive with respect to the integration of systems likely necessary to result in functional network architectures, but nonetheless striking that neurons that are so closely functionally and developmentally related would have fundamentally different mechanisms to constrain the same channel mRNA relationships.
At this time, we have no direct evidence as to the proximate mechanisms involved in translating either activity or modulation into relationships among these steady-state channel mRNA levels. Activity-dependent regulation of gene expression is a well-known phenomenon, including among voltage-dependent ion channel genes (11, 46). In particular, there is emerging evidence linking specific firing patterns to distinct transcriptome profiles as well (47, 48). Only more recently have mechanistic analyses of the pathways involved in such regulation started to become clearer. Most studies in other animal systems to date implicate calcium-signaling pathways (44) and calcium-responsive transcriptional regulators such as the MAPK/ERK pathway (48, 49). Furthermore, in fast-spiking basket cells of mouse cortex, a direct link between neuronal firing rate, the transcription factor Er81, and regulation of expression of Kv1.1 (SHAKER) subunits has been demonstrated (50). However, there are few mechanistic studies on how correlated channel mRNAs may ultimately arise. Similarly, the neuromodulation-dependent feedback almost certainly acts through second-messenger signaling pathways activated by neuropeptide G-protein coupled receptors (51–53). The nature of those pathways in the STG as to how they influence steady-state mRNA has yet to be explored, although dopamine has been shown to signal in STG cells through a PKA-dependent pathway that involves transcriptional and posttranscriptional aspects to affect membrane conductance (54, 55).
The presence of simultaneous feedback mechanisms during the active state of LG may hint at the physiological importance of parallel feedback strategies within single neuron types (56, 57). In the American bullfrog, multiple feedback signals were found to shape the synaptic scaling response of respiratory motor neurons during hibernation; specifically, these signals were dependent on activity, calcium signaling, and possibly, environmental influences (57). Thus, neurons, regardless of their activity profile (periodic vs. constitutively active), may necessitate multiple forms of feedback signaling to produce the appropriate output. In crustaceans, descending neuromodulatory inputs to the STG gastric circuit can be influenced by hormonal, sensory, and other modulatory influences (58, 59). In turn, divergent descending modulatory inputs to the STG can lead to different permutations of the gastric rhythm (16, 27, 60), which in turn elicits distinct patterns of activity (20, 21, 61). Thus, parallel signaling from activity and neuromodulation could act on LG to reconfigure distinct portions of its mRNA profile to one conducive to the appropriate corresponding output. Although our study only describes how some ion channel mRNA relationships can be coregulated by these two signals, the influence of other signals such as trophic factors and circulating hormones (62–64) could also play a role.
Our results also raise some intriguing questions. First, if periodically active neurons have multiple states of activity, then do multiple mechanisms exist that coordinate the ion channel mRNA relationships across each state? We know that silent LG neurons are still receiving modulatory inputs during periods when the gastric mill is not active, although not the full complement that would lead to normal gastric activity (28). In our results, we found that if LG neurons are completely isolated from their neuromodulatory inputs and have their activity silenced with TTX, their ion channel mRNA abundances change when compared with intact silent LG neurons. This suggests LG neurons may possess a continuous baseline level of modulation that may constrain specific ion channel abundances. The functional purpose of this baseline modulation is hinted at by other mRNA relationships (data not shown) that became correlated only during the TTX condition and not correlated in any other condition. This may point to an active mechanism in LG neurons to suppress mRNA relationships that may be detrimental to appropriate output as hypothesized in other studies (11). Our results also raise another important question: are mRNA abundances or mRNA correlations better at representing physiologically relevant changes to the state of a neuron? Our results show that most mRNA abundances are not significantly different between the TTX and stimulated LG groups. One interpretation might be that the TTX group can achieve comparable transcriptional changes to those of the stimulated LG group. Yet this is not the case, as our results demonstrate that most correlated ion channel mRNAs occur as a result of neuromodulation or activity but not in the absence of both as in TTX. This suggests that mRNA relationships, rather than strictly abundances, may be a better indicator of the overall state or identity of a neuron.
Lastly, when LG neurons become active, their ion channel mRNA profile changes dramatically. What is the functional purpose of these mRNA-level changes? Work in C. borealis cardiac neurons showed that negatively correlated ionic currents may serve to reciprocally compensate for each other whenever one current is decreased; this response happened in time spans of less than an hour (65). That work hypothesized that this fast response may be facilitated by readily available pools of correlated ion channel mRNAs (65). This is supported by other studies that have reported that neurons not only possess protein reservoirs (66, 67) but also reservoirs of mRNA that can be stored in different neuronal compartments and that can be translated at later points in time (68, 69). Thus, the active state of LG neurons may serve to build up a pool of correlated transcripts that could be translated at a later time and grant LG the appropriate ion channel profile to resume its activity the next time it turns on.
In conclusion, we have shown that motor neurons can use cell-type specific feedback mechanisms to coregulate the same ion channel mRNAs. This suggests that motor networks may not ascribe to a “one size fit all” approach to stabilize the mRNA profiles of different neuron populations. Instead, cell-type specific signaling may reflect the challenges that each neuron faces; while PD neurons experience continuous updates on their activity, LG neurons are often silent and may require multiple forms of signaling. The multiple feedback solutions used by the different states of LG may reflect the distinct modalities of sensory (27, 70, 71) and neuromodulatory inputs (62) needed to shape a behavior-like feeding. Thus, to engage different permutations of the gastric output, different portions of LG’s ion channel mRNA profile may require distinct constraining feedback mechanisms.
DATA AVAILABILITY
Data will be made available upon reasonable request.
GRANTS
This work was supported by National Science Foundation (IOS Grant No. 1856370) awarded to Dr. David Schulz and seed funds provided by the University of Missouri-Columbia.
DISCLOSURES
No conflicts of interest, financial or otherwise, are declared by the authors.
AUTHOR CONTRIBUTIONS
J.A.V. and D.J.S. conceived and designed research; J.A.V. performed experiments; J.A.V. and D.J.S. analyzed data; J.A.V. and D.J.S. interpreted results of experiments; J.A.V. and D.J.S. prepared figures; J.A.V. drafted manuscript; J.A.V. and D.J.S. edited and revised manuscript; J.A.V. and D.J.S. approved final version of manuscript.
ACKNOWLEDGMENTS
We thank Dr. Joseph Santin for the use of previous results to help interpret our data, as well as for his overall feedback on the manuscript.
REFERENCES
- 1. Marder E, Bucher D. Central pattern generators and the control of rhythmic movements. Curr Biol 11: R986–R996, 2001. doi: 10.1016/S0960-9822(01)00581-4. [DOI] [PubMed] [Google Scholar]
- 2. Katz PS. Evolution of central pattern generators and rhythmic behaviours. Phil Trans R Soc Lond B Biol Sci 371: 20150057, 2016. doi: 10.1098/rstb.2015.0057. [DOI] [PMC free article] [PubMed] [Google Scholar]
- 3. Haddad SA, Marder E. Circuit robustness to temperature perturbation is altered by neuromodulators. Neuron 100: 609–623.e3, 2018. doi: 10.1016/j.neuron.2018.08.035. [DOI] [PMC free article] [PubMed] [Google Scholar]
- 4. Conrad R, Stölting G, Hendriks J, Ruello G, Kortzak D, Jordan N, Gensch T, Hidalgo P. Rapid turnover of the cardiac L-type CaV1.2 channel by endocytic recycling regulates its cell surface availability. iScience 7: 1–15, 2018. doi: 10.1016/j.isci.2018.08.012. [DOI] [PMC free article] [PubMed] [Google Scholar]
- 5. Khorkova O, Golowasch J. Neuromodulators, not activity, control coordinated expression of ionic currents. J Neurosci 27: 8709–8718, 2007. doi: 10.1523/JNEUROSCI.1274-07.2007. [DOI] [PMC free article] [PubMed] [Google Scholar]
- 6. Ransdel JL, Nair SS, Schulz DJ. Neurons within the same network independently achieve conserved output by differentially balancing variable conductance magnitudes. J Neurosci 33: 9950–9956, 2013. doi: 10.1523/JNEUROSCI.1095-13.2013. [DOI] [PMC free article] [PubMed] [Google Scholar]
- 7. Schulz DJ, Goaillard J-M, Marder EE. Quantitative expression profiling of identified neurons reveals cell-specific constraints on highly variable levels of gene expression. Proc Natl Acad Sci USA 104: 13187–13191, 2007. doi: 10.1073/pnas.0705827104. [DOI] [PMC free article] [PubMed] [Google Scholar]
- 8. Temporal S, Desai M, Khorkova O, Varghese G, Dai A, Schulz DJ, Golowasch J. Neuromodulation independently determines correlated channel expression and conductance levels in motor neurons of the stomatogastric ganglion. J Neurophysiol 107: 718–727, 2012. doi: 10.1152/jn.00622.2011. [DOI] [PMC free article] [PubMed] [Google Scholar]
- 9. Temporal S, Lett KM, Schulz DJ. Activity-dependent feedback regulates correlated ion channel mRNA levels in single identified motor neurons. Curr Biol 24: 1899–1904, 2014. doi: 10.1016/j.cub.2014.06.067. [DOI] [PubMed] [Google Scholar]
- 10. Zhao S, Golowasch J. Ionic current correlations underlie the global tuning of large numbers of neuronal activity attributes. J Neurosci 32: 13380–13388, 2012. doi: 10.1523/JNEUROSCI.6500-11.2012. [DOI] [PMC free article] [PubMed] [Google Scholar]
- 11. Santin JM, Schulz DJ. Membrane voltage is a direct feedback signal that influences correlated ion channel expression in neurons. Curr Biol 29: 1683–1688.e2, 2019. doi: 10.1016/j.cub.2019.04.008. [DOI] [PMC free article] [PubMed] [Google Scholar]
- 12. Rodriguez JC, Blitz DM, Nusbaum MP. Convergent rhythm generation from divergent cellular mechanisms. J Neurosci 33: 18047–18064, 2013. doi: 10.1523/JNEUROSCI.3217-13.2013. [DOI] [PMC free article] [PubMed] [Google Scholar]
- 13. Diehl F, White RS, Stein W, Nusbaum MP. Motor circuit-specific burst patterns drive different muscle and behavior patterns. J Neurosci 33: 12013–12029, 2013. doi: 10.1523/JNEUROSCI.1060-13.2013. [DOI] [PMC free article] [PubMed] [Google Scholar]
- 14. Daur N, Nadim F, Bucher D. The complexity of small circuits: the stomatogastric nervous system. Curr Opin Neurobiol 41: 1–7, 2016. doi: 10.1016/j.conb.2016.07.005. [DOI] [PMC free article] [PubMed] [Google Scholar]
- 15. Marder E, Bucher D. Understanding circuit dynamics using the stomatogastric nervous system of lobsters and crabs. Annu Rev Physiol 69: 291–316, 2007. doi: 10.1146/annurev.physiol.69.031905.161516. [DOI] [PubMed] [Google Scholar]
- 16. Stein W. Modulation of stomatogastric rhythms. J Comp Physiol A Neuroethol Sens Neural Behav Physiol 195: 989–1009, 2009. doi: 10.1007/s00359-009-0483-y. [DOI] [PubMed] [Google Scholar]
- 17. Meyrand P, Simmers J, Moulins M. Dynamic construction of a neural network from multiple pattern generators in the lobster stomatogastric nervous system. J Neurosci 14: 630–644, 1994. doi: 10.1523/JNEUROSCI.14-02-00630.1994. [DOI] [PMC free article] [PubMed] [Google Scholar]
- 18. Weimann JM, Marder E. Switching neurons are integral members of multiple oscillatory networks. Curr Biol 4: 896–902, 1994. doi: 10.1016/s0960-9822(00)00199-8. [DOI] [PubMed] [Google Scholar]
- 19. Weimann JM, Meyrand P, Marder E. Neurons that form multiple pattern generators: Identification and multiple activity patterns of gastric/pyloric neurons in the crab stomatogastric system. J Neurophysiol 65: 111–122, 1991. doi: 10.1152/jn.1991.65.1.111. [DOI] [PubMed] [Google Scholar]
- 20. Blitz DM, Christie AE, Cook AP, Dickinson PS, Nusbaum MP. Similarities and differences in circuit responses to applied Gly1-SIFamide and peptidergic (Gly1-SIFamide) neuron stimulation. J Neurophysiol 121: 950–972, 2019. doi: 10.1152/jn.00567.2018. [DOI] [PMC free article] [PubMed] [Google Scholar]
- 21. Yarger AM, Stein W. Sources and range of long-term variability of rhythmic motor patterns in vivo. J Exp Biol 218: 3950–3961, 2015. doi: 10.1242/jeb.126581. [DOI] [PubMed] [Google Scholar]
- 22. Beenhakker MP, Blitz DM, Nusbaum MP. Long-lasting activation of rhythmic neuronal activity by a novel mechanosensory system in the crustacean stomatogastric nervous system. J Neurophysiol 91: 78–91, 2004. doi: 10.1152/jn.00741.2003. [DOI] [PMC free article] [PubMed] [Google Scholar]
- 23. Clemens S, Combes D, Meyrand P, Simmers J. Long-term expression of two interacting motor pattern-generating networks in the stomatogastric system of freely behaving lobster. J Neurophysiol 79: 1396–1408, 1998. doi: 10.1152/jn.1998.79.3.1396. [DOI] [PubMed] [Google Scholar]
- 24. Cook AP, Nusbaum MP. Feeding state-dependent modulation of feeding-related motor patterns. J Neurophysiol 126: 1903–1924, 2021. doi: 10.1152/jn.00387.2021. [DOI] [PMC free article] [PubMed] [Google Scholar]
- 25. Turrigiano G, Selverston AI. A cholecystokinin-like hormone activates a feeding-related neural circuit in lobster. Nature 344: 866–868, 1990. doi: 10.1038/344866a0. [DOI] [PubMed] [Google Scholar]
- 26. Bartos M, Manor Y, Nadim F, Marder E, Nusbaum MP. Coordination of fast and slow rhythmic neuronal circuits. J Neurosci 19: 6650–6660, 1999. doi: 10.1523/JNEUROSCI.19-15-06650.1999. [DOI] [PMC free article] [PubMed] [Google Scholar]
- 27. Powell DJ, Marder E, Nusbaum MP. Perturbation-specific responses by two neural circuits generating similar activity patterns. Curr Biol 31: 4831–4838.e4, 2021. doi: 10.1016/j.cub.2021.08.042. [DOI] [PMC free article] [PubMed] [Google Scholar]
- 28. White RS, Nusbaum MP. The same core rhythm generator underlies different rhythmic motor patterns. J Neurosci 31: 11484–11494, 2011. doi: 10.1523/JNEUROSCI.1885-11.2011. [DOI] [PMC free article] [PubMed] [Google Scholar]
- 29. Harris-Warrick RM. Voltage-sensitive ion channels in rhythmic motor systems. Curr Opin Neurobiol 12: 646–651, 2002. doi: 10.1016/S0959-4388(02)00377-X. [DOI] [PubMed] [Google Scholar]
- 30. Vetri F, Choudhury MSR, Pelligrino DA, Sundivakkam P. BKCa channels as physiological regulators: a focused review. J Receptor Ligand Channel Res 7: 3–13, 2014. doi: 10.2147/JRLCR.S36065. [DOI] [Google Scholar]
- 31. Guan D, Armstrong WE, Foehring RC. Kv2 channels regulate firing rate in pyramidal neurons from rat sensorimotor cortex. J Physiol 591: 4807–4825, 2013. doi: 10.1113/jphysiol.2013.257253. [DOI] [PMC free article] [PubMed] [Google Scholar]
- 32. King B, Rizwan AP, Asmara H, Heath NC, Engbers JDT, Dykstra S, Bartoletti TM, Hameed S, Zamponi GW, Turner RW. IKCa channels are a critical determinant of the slow AHP in CA1 pyramidal neurons. Cell Rep 11: 175–182, 2015. doi: 10.1016/j.celrep.2015.03.026. [DOI] [PubMed] [Google Scholar]
- 33. Chua HC, Wulf M, Weidling C, Rasmussen LP, Pless SA. The NALCN channel complex is voltage sensitive and directly modulated by extracellular calcium. Sci Adv 6: eaaz3154, 2020. doi: 10.1126/sciadv.aaz3154. [DOI] [PMC free article] [PubMed] [Google Scholar]
- 34. Golowasch J, Marder E. Ionic currents of the lateral pyloric neuron of the stomatogastric ganglion of the crab. J Neurophysiol 67: 318–331, 1992. doi: 10.1152/jn.1992.67.2.318. [DOI] [PubMed] [Google Scholar]
- 35. Northcutt AJ, Lett KM, Garcia VB, Diester CM, Lane BJ, Marder E, Schulz DJ. Deep sequencing of transcriptomes from the nervous systems of two decapod crustaceans to characterize genes important for neural circuit function and modulation. BMC Genomics 17: 868, 2016. doi: 10.1186/s12864-016-3215-z. [DOI] [PMC free article] [PubMed] [Google Scholar]
- 36. DeLong ND, Kirby MS, Blitz DM, Nusbaum MP. Parallel regulation of a modulator-activated current via distinct dynamics underlies comodulation of motor circuit output. J Neurosci 29: 12355–12367, 2009. doi: 10.1523/JNEUROSCI.3079-09.2009. [DOI] [PMC free article] [PubMed] [Google Scholar]
- 37. Beenhakker MP, Nusbaum MP. Mechanosensory activation of a motor circuit by coactivation of two projection neurons. J Neurosci 24: 6741–6750, 2004. doi: 10.1523/JNEUROSCI.1682-04.2004. [DOI] [PMC free article] [PubMed] [Google Scholar]
- 38. Schulz DJ, Goaillard J-M, Marder E. Variable channel expression in identified single and electrically coupled neurons in different animals. Nat Neurosci 9: 356–362, 2006. doi: 10.1038/nn1639. [DOI] [PubMed] [Google Scholar]
- 39. Northcutt AJ, Kick DR, Otopalik AG, Goetz BM, Harris RM, Santin JM, Hofmann HA, Marder E, Schulz DJ. Molecular profiling of single neurons of known identity in two ganglia from the crab Cancer borealis. Proc Natl Acad Sci USA 116: 26980–26990, 2019. doi: 10.1073/pnas.1911413116. [DOI] [PMC free article] [PubMed] [Google Scholar]
- 40. Svensson E, Apergis-Schoute J, Burnstock G, Nusbaum MP, Parker D, Schiöth HB. General principles of neuronal co-transmission: insights from multiple model systems. Front Neural Circuits 12: 117, 2018. doi: 10.3389/fncir.2018.00117. [DOI] [PMC free article] [PubMed] [Google Scholar]
- 41. Lee PR, Fields RD. Activity-dependent gene expression in neurons. Neuroscientist 27: 355–366, 2021. doi: 10.1177/1073858420943515. [DOI] [PMC free article] [PubMed] [Google Scholar]
- 42. Segal M. Calcium stores regulate excitability in cultured rat hippocampal neurons. J Neurophysiol 120: 2694–2705, 2018. doi: 10.1152/jn.00447.2018. [DOI] [PubMed] [Google Scholar]
- 43. West AE. Biological functions of activity-dependent transcription revealed. Neuron 60: 523–525, 2008. doi: 10.1016/j.neuron.2008.11.008. [DOI] [PubMed] [Google Scholar]
- 44. West AE, Greenberg ME. Neuronal activity-regulated gene transcription in synapse development and cognitive function. Cold Spring Harb Perspect Biol 3: a005744, 2011. doi: 10.1101/cshperspect.a005744. [DOI] [PMC free article] [PubMed] [Google Scholar]
- 45. Lett KM, Garcia VJ, Temporal S, Bucher D, Schulz DJ. Removal of endogenous neuromodulators in a small motor network enhances responsiveness to neuromodulation. J Neurophysiol 118: 1749–1761, 2017. doi: 10.1152/jn.00383.2017. [DOI] [PMC free article] [PubMed] [Google Scholar]
- 46. Mee CJ, Pym ECG, Moffat KG, Baines RA. Regulation of neuronal excitability through pumilio-dependent control of a sodium channel gene. J Neurosci 24: 8695–8703, 2004. doi: 10.1523/JNEUROSCI.2282-04.2004. [DOI] [PMC free article] [PubMed] [Google Scholar]
- 47. Adams JP, Dudek SM. Late-phase long-term potentiation: getting to the nucleus. Nat Rev Neurosci 6: 737–743, 2005. doi: 10.1038/nrn1749. [DOI] [PubMed] [Google Scholar]
- 48. Tyssowski KM, Letai KC, Rendall SD, Tan C, Nizhnik A, Kaeser PS, Gray JM. Firing rate homeostasis can occur in the absence of neuronal activity-regulated transcription. J Neurosci 39: 9885–9899, 2019. doi: 10.1523/JNEUROSCI.1108-19.2019. [DOI] [PMC free article] [PubMed] [Google Scholar]
- 49. Brosenitsch TA, Katz DM. Physiological patterns of electrical stimulation can induce neuronal gene expression by activating N-type calcium channels. J Neurosci 21: 2571–2579, 2001. doi: 10.1523/JNEUROSCI.21-08-02571.2001. [DOI] [PMC free article] [PubMed] [Google Scholar]
- 50. Dehorter N, Ciceri G, Bartolini G, Lim L, del Pino I, Marín O. Tuning of fast-spiking interneuron properties by an activity-dependent transcriptional switch. Science 349: 1216–1220, 2015. doi: 10.1126/science.aab3415. [DOI] [PMC free article] [PubMed] [Google Scholar]
- 51. Christie AE, Chi M, Lameyer TJ, Pascual MG, Shea DN, Stanhope ME, Schulz DJ, Dickinson PS. Neuropeptidergic signaling in the American lobster Homarus americanus: new insights from high-throughput nucleotide sequencing. PLoS One 10: e0145964, 2015. doi: 10.1371/journal.pone.0145964. [DOI] [PMC free article] [PubMed] [Google Scholar]
- 52. Christie AE, Pascual MG. Peptidergic signaling in the crab Cancer borealis: tapping the power of transcriptomics for neuropeptidome expansion. Gen Comp Endocrinol 237: 53–67, 2016. doi: 10.1016/j.ygcen.2016.08.002. [DOI] [PubMed] [Google Scholar]
- 53. Clark MC, Khan R, Baro DJ. Crustacean dopamine receptors: localization and G protein coupling in the stomatogastric ganglion. J Neurochem 104: 1006–1019, 2008. doi: 10.1111/j.1471-4159.2007.05029.x. [DOI] [PMC free article] [PubMed] [Google Scholar]
- 54. Krenz WDC, Parker AR, Rodgers EW, Baro DJ. Dopaminergic tone persistently regulates voltage-gated ion current densities through the D1R-PKA axis, RNA polymerase II transcription, RNAi, mTORC1, and translation. Front Cell Neurosci 8: 39, 2014. doi: 10.3389/fncel.2014.00039. [DOI] [PMC free article] [PubMed] [Google Scholar]
- 55. Rodgers EW, Krenz WD, Jiang X, Li L, Baro DJ. Dopaminergic tone regulates transient potassium current maximal conductance through a translational mechanism requiring D1Rs, cAMP/PKA, Erk and mTOR. BMC Neurosci 14: 143, 2013. doi: 10.1186/1471-2202-14-143. [DOI] [PMC free article] [PubMed] [Google Scholar]
- 56. Kulik Y, Jones R, Moughamian AJ, Whippen J, Davis GW. Dual separable feedback systems govern firing rate homeostasis. eLife 8: e45717, 2019. doi: 10.7554/eLife.45717. [DOI] [PMC free article] [PubMed] [Google Scholar]
- 57. Zubov T, Amaral-Silva L, Santin JM. Inactivity and Ca2+ signaling regulate synaptic compensation in motoneurons following hibernation in American bullfrogs. Sci Rep 12: 11610, 2022. doi: 10.1038/s41598-022-15525-8. [DOI] [PMC free article] [PubMed] [Google Scholar]
- 58. Katz PS, Eigg MH, Harris-Warrick RM. Serotoninergic/cholinergic muscle receptor cells in the crab stomatogastric nervous system. I. Identification and characterization of the gastropyloric receptor cells. J Neurophysiol 62: 558–570, 1989. doi: 10.1152/jn.1989.62.2.558. [DOI] [PubMed] [Google Scholar]
- 59. Skiebe P. Neuropeptides are ubiquitous chemical mediators: using the stomatogastric nervous system as a model system. J Exp Biol 204: 2035–2048, 2001. doi: 10.1242/jeb.204.12.2035. [DOI] [PubMed] [Google Scholar]
- 60. Blitz DM, Beenhakker MP, Nusbaum MP. Different sensory systems share projection neurons but elicit distinct motor patterns. J Neurosci 24: 11381–11390, 2004. doi: 10.1523/JNEUROSCI.3219-04.2004. [DOI] [PMC free article] [PubMed] [Google Scholar]
- 61. Blitz DM, White RS, Saideman SR, Cook A, Christie AE, Nadim F, Nusbaum MP. A newly identified extrinsic input triggers a distinct gastric mill rhythm via activation of modulatory projection neurons. J Exp Biol 211: 1000–1011, 2008. doi: 10.1242/jeb.015222. [DOI] [PMC free article] [PubMed] [Google Scholar]
- 62. DeLaney K, Hu M, Wu W, Nusbaum MP, Li L. Mass spectrometry profiling and quantitation of changes in circulating hormones secreted over time in Cancer borealis hemolymph due to feeding behavior. Anal Bioanal Chem 414: 533–543, 2022. doi: 10.1007/s00216-021-03479-1. [DOI] [PMC free article] [PubMed] [Google Scholar]
- 63. Li L, Kelley WP, Billimoria CP, Christie AE, Pulver SR, Sweedler JV, Marder E. Mass spectrometric investigation of the neuropeptide complement and release in the pericardial organs of the crab, Cancer borealis. J Neurochem 87: 642–656, 2003. doi: 10.1046/j.1471-4159.2003.02031.x. [DOI] [PubMed] [Google Scholar]
- 64. Thoby-Brisson M, Simmers J. Neuromodulatory inputs maintain expression of a lobster motor pattern-generating network in a modulation-dependent state: evidence from long-term decentralization in vitro. J Neurosci 18: 2212–2225, 1998. doi: 10.1523/JNEUROSCI.18-06-02212.1998. [DOI] [PMC free article] [PubMed] [Google Scholar]
- 65. Ransdell JL, Nair SS, Schulz DJ. Rapid homeostatic plasticity of intrinsic excitability in a central pattern generator network stabilizes functional neural network output. J Neurosci 32: 9649–9658, 2012. doi: 10.1523/JNEUROSCI.1945-12.2012. [DOI] [PMC free article] [PubMed] [Google Scholar]
- 66. Fernández-Alfonso T, Kwan R, Ryan TA. Synaptic vesicles interchange their membrane proteins with a large surface reservoir during recycling. Neuron 51: 179–186, 2006. doi: 10.1016/j.neuron.2006.06.008. [DOI] [PubMed] [Google Scholar]
- 67. Hayashi Y, Shi SH, Esteban JA, Piccini A, Poncer JC, Malinow R. Driving AMPA receptors into synapses by LTP and CaMKII: requirement for GluR1 and PDZ domain interaction. Science 287: 2262–2267, 2000. doi: 10.1126/science.287.5461.2262. [DOI] [PubMed] [Google Scholar]
- 68. Minis A, Dahary D, Manor O, Leshkowitz D, Pilpel Y, Yaron A. Subcellular transcriptomics-dissection of the mRNA composition in the axonal compartment of sensory neurons. Dev Neurobiol 74: 365–381, 2014. doi: 10.1002/dneu.22140. [DOI] [PubMed] [Google Scholar]
- 69. Taylor AL, Goaillard J-M, Marder E. How multiple conductances determine electrophysiological properties in a multicompartment model. J Neurosci 29: 5573–5586, 2009. doi: 10.1523/JNEUROSCI.4438-08.2009. [DOI] [PMC free article] [PubMed] [Google Scholar]
- 70. Chen R, Xiao M, Buchberger A, Li L. Quantitative neuropeptidomics study of the effects of temperature change in the crab Cancer borealis. J Proteome Res 13: 5767–5776, 2014. doi: 10.1021/pr500742q. [DOI] [PMC free article] [PubMed] [Google Scholar]
- 71. Marder E. Neuromodulation of neuronal circuits: back to the future. Neuron 76: 1–11, 2012. doi: 10.1016/j.neuron.2012.09.010. [DOI] [PMC free article] [PubMed] [Google Scholar]
Associated Data
This section collects any data citations, data availability statements, or supplementary materials included in this article.
Data Availability Statement
Data will be made available upon reasonable request.