

Abstract
Introduction
Hospital performance is significantly affected by external factors (political and economic) rather than internal factors (effectiveness and efficiency). Emergency department (ED) overcrowding is a significant issue for emergency care services globally, characterized by a rising number of visits and persistent unsolved issues, resulting in increased challenges faced by ED staff and decreased patient satisfaction. This study aimed to explore the obstacles and challenges that cause variation in ED quality indicators (QIs) based on five domains: infrastructure, population, workflow, workforce, and administration.
Methods
A tertiary emergency center in Saudi Arabia administered a questionnaire with standardized measures to 180 nurses, using a cross-sectional descriptive design.
Results
Most nurses (75.5%) believed that crowded waiting rooms in the ED were the most influential factor affecting QIs. Many other challenges were identified, including bed capacity, triage area/workflow, increased volume during peak periods, demand for nonemergency visits, staff and shortages. Significant differences in nurses’ responses were found on the basis of education level (for infrastructure only, p = 0.004), specialty (for nursing administration only, p = 0.052), and ED experience (for all variables, p = 0.008–0.039).
Conclusion
The analysis uncovered various critical aspects of infrastructure, workflow, population, workforce, and nursing administration that have a major effect on patient flow in the ED. Comprehending these aspects will greatly affect the quality measures of ED performance and assist policymakers in formulating strategic plans to enhance ED performance. Therefore, successful implementation and optimization of ED resources depend greatly on considering the right decision variables and resource restrictions.
Keywords: emergency department, nursing, quality improvement
INTRODUCTION
Hospital performance is significantly affected by external factors (political and economic) rather than internal factors (effectiveness and efficiency).[1] Emergency department (ED) overcrowding is a significant issue for emergency care services globally,[2] characterized by a rising number of visits and persistent unsolved issues, resulting in increased challenges faced by ED staff and decreased patient satisfaction.[3]
Patient length of stay (LOS) is one important indicator that should be measured and monitored in the ED; therefore, investigating factors that influence LOS could improve healthcare delivery and patient safety.[4] Factors such as high patient volume, long distances between emergency units, poor communication, and a low workforce are major challenges that lead to prolonged waiting times; hence, to reduce patient waiting time, a fair distribution of the workforce in different working shifts and also on weekdays and holidays is necessary.[5]
EDs encounter difficulties throughout the world, including a lack of specialists and the inability to treat patients promptly. In addition, a multitude of factors, including a high patient volume, scarcity of nurses, shift work, caring for critical patients, psychological strain in the workplace, and an overwhelming number of rules to follow, raise the risk for mistakes when nurses provide care, owing to delay or inappropriate treatments,[6] thereby affecting the ED quality indicators (QIs), such as patient satisfaction. Doctors and nurses have identified other factors such as high workload, lack of control, and organizational failure (ambiguous emergency service structure, inadequate number of beds and limited resources, electronic patient records).[7–9] To improve ED performance and services, which were mostly influenced by the decision-to-disposition time, it is imperative to identify factors that affect waiting time and LOS.[10–12]
Redesigning processes to improve ED performance plays an essential role in increasing the quality of services provided and is paramount to increasing the efficiency of the hospital as a whole.[13] Patient outcomes are substantially affected by the quality of ED care. However, only a subset of QIs are required to design improvement strategies, and meeting standard hospital compliance indicators is the minimum requirement for ensure the quality of care in an ED setting.[14] Other QIs can be adapted or disaggregated to fit each hospital’s needs, such as promoting professionalisim in the work place, managing utilization of limited resources, improving inpatient work flows, maintaining capacity in bed availability, focused care for older people, and introducing emergency medicine specialists to reduce LOS, and others.[15–21] A performance indicators dashboard can be used for real-time information display, alert system creation, and monitoring of data sources and quality of data, as well as integration with other relevant systems.[20,21]
In Saudi Arabia, inefficiencies in health services, as a whole, remain an obstacle and a critical challenge in public hospitals. More studies are needed to strengthen knowledge on hospital efficiency in light of the limited data at the national and regional level.[22] The identification of hospital performance relative to QIs remains valuable as it enables agile identification of areas for additional exploration and remediation within the healthcare system.[23]
To address concerns about noncompliance with ED-specified key performance indicators, a review of the existing performance indicators is encouraged, i.e., providing a concise list of QIs and targets against which hospital performance can be actively monitored and managed. While the drivers of performance on these metrics are multifactorial, performance across each QI, nonetheless, may enable a more systematic approach to identifying improvements to healthcare delivery. The benefits of improved performance on designated QIs are, in most cases, quantifiable’ so the level of potential investment to be undertaken should reflect this, with emphasis on patients’ safety. Where appropriate, focused interventions to improve ED performance on designated QIs should be commenced.
The present study aimed to identify and assess the obstacles and challenges that cause variation of ED QIs in a complex tertiary hospital in Saudi Arabia, including a comparison of the characteristics of ED nurses. This goal will be achieved by answering the following questions:
What obstacles (extrinsic factors) and challenges (intrinsic factors) affect the ED QIs?
Is there a significant variation in nurses’ perceptions about ED QIs?
METHODS
This study was conducted at King Fahad Medical City (KFMC), Riyadh Second Health Cluster (R2), Riyadh City, Central Region, Saudi Arabia. The Institutional Review Board at KFMC approved the study. Before participants were enrolled, the researcher explained the study’s purpose and that participation was voluntary. Furthermore, all participants were informed of the anonymity and confidentiality issues and the option of terminating the study at any time without affecting their current or future work. If the participants verbally agreed to participate in the study, they would be enrolled and asked to complete the required surveys. The research has met all applicable standards concerning the ethics of experimentation and research integrity, and the following is certified and declared valid.
Study Population
Quality indicator data were extracted from the electronic medical record (Epic) from January until the end of December 2023 (Supplemental Table S1, available online).
Inclusion criteria included all nurses who had been working in adult and pediatric ED for more than 3 months. Exclusion criteria included all nurses who did not complete the 3-month probationary period.
Three hundred nurses working in the ED underwent the eligibility criteria screening before being recruited into the study; 250 nurses were eligible. The target sample size (n = 160) was calculated by using Raosoft[24] for a cross-sectional study.
Survey Preparation
Nursing leaders collected the survey items based on daily observations, safety metrics report (Epic), quality report, opportunity reporting system, patients’ experience administration report, Ministry of Health hotline, nurses’ satisfaction survey, patients’ satisfaction survey, and literature review; and then divided them into five domains (infrastructure, population, workforce, workflow, and administration). The survey tool was then carefully examined, revised, and scrutinized by an expert nursing panel for its face and content validity. It was then subjected to a small-scale exploratory pilot study for reliability testing (Cronbach α = 0.98) (Supplemental Table S2).
Data Collection
At the time of data collection (April 8–May 30, 2024), questionnaires were sent to all participants. Self-reported questionnaires were used to obtain participants’ demographic data, which included sex, age, educational level, professional title, type of hospital, level of hospital, area of work, level of competence, years of experience in nursing, and years of experience in the ED. The questionnaire was also used to explore the obstacles (extrinsic factors) and challenges (intrinsic factors) affecting the nurses’ daily work.
Statistical Analysis
The data were analyzed by using IBM SPSS version 27. Descriptive statistics were used to describe the participants’ characteristics and to examine the distribution of data values, including outliers and patterns of missing values, in the collected data. All nominal and ordinal data were presented as frequencies and percentages, whereas numerical data were presented as mean or median and SDs.
A test of normality (Kolmogorov-Smirnov) indicated data were not normally distributed (Supplemental Tables S3 and S4). Therefore, nonparametric tests were used to compare the mean rank (median) among the participants’ characteristics. The mean rank was used to measure the effect of the outcome variables (infrastructure, population, workflow, workforce, and nursing administration), determined by dividing the total mean ranks by the total number of questions. The result was compared against each question’s mean rank; if the individual mean rank was below 4, the effect was low, whereas if the individual mean rank was 4 or above, the effect was high.
RESULTS
Participants’ Characteristics
There were 180 responses in all (response rate, 72%), and most participants are female nurses (71.7%), aged between 26 and 30 years (24.4%), with a bachelor’s degree (86.1%), registered nurse (RN) license (87.2%), and working in adult ED (74.4%). Many nurses (42.8%) had more than 10 years of nursing experience, but most (39.4%) had less than 1 year experience in the ED. Only 5.5% of participants were aware of the QIs implemented in the ED (Supplemental Table S5).
Nurses’ Views Concerning Obstacles and Challenges
The analysis of nurses’ positive and negative reactions to the obstacles and challenges that affect ED QIs are displayed in Table 1 and Figure 1. Neutral (sometimes) replies remained unchanged, the positive (often and always) and negative (never and rarely) responses were merged to strengthen the results.
Table 1.
Descriptive analysis of the nurses’ responses (positive vs negative) (N = 180)
| Negative, n (%)a | Neutral, n (%)a | Positive, n (%)a | Median (IQR)b | Effect | |
|---|---|---|---|---|---|
| Infrastructure | |||||
| 1. How often does the ED bed capacity affect the QIs? | 10 (5.6) | 45 (25.0) | 125 (69.5) | 4 (3–5) | High |
| 2. How often does the triage area workflow and structure affect the ED QIs? | 14 (7.8) | 42 (23.3) | 124 (68.9) | 4 (3–5) | High |
| 3. How often does the availability of vacant ED beds affect the QIs? | 18 (10.0) | 38 (21.1) | 124 (68.8) | 4 (3–5) | High |
| 4. How often does the shortage of or insufficient resources that lead to deficiencies in the diagnostic and therapeutic processes (e.g., lack of equipment, lack of supplies, etc.) affect the QIs? | 17 (9.4) | 46 (25.6) | 117 (65.0) | 4 (3–5) | High |
| 5. How often does the insufficient infrastructure (e.g., radiology service, lab service, pharmacy service, isolation rooms, etc.) affect the QIs? | 15 (8.3) | 55 (30.6) | 110 (61.1) | 4 (3–5) | High |
| 6. How often do the effectiveness and efficiency of the ED system (e.g., CTAS, EMR, etc.) affect the QIs? | 26 (14.5) | 52 (28.9) | 102 (56.7) | 4 (3–5) | High |
| 7. How often does the updated standard medical equipment (i.e., PPM) affect the QIs? | 33 (18.4) | 59 (32.8) | 88 (48.9) | 3 (3–5) | Low |
| Population | |||||
| 8. How often does increasing ED volume in specific periods (e.g., winter, noon time, etc.) affect the QIs? | 9 (5.0) | 44 (24.4) | 127 (70.5) | 4 (3–5) | High |
| 9. How often do the patients who frequently re-visit the ED affect the QIs? | 18 (10.0) | 43 (23.9) | 119 (66.1) | 4 (3–5) | High |
| 10. How often does the demand for non-emergency (CTAS level 4 & 5) visits affect the QIs? | 20 (11.1) | 36 (20.0) | 124 (68.9) | 4 (3–5) | High |
| 11. How often do the patients’ acuity census and complexity of care affect the QIs? | 13 (7.3) | 54 (30.0) | 113 (62.8) | 4 (3–5) | High |
| 12. How often do the epidemiological changes in the ED population patterns (e.g., chronic diseases, infectious diseases, morbidity and mortality patterns, life expectancy, etc.) affect the QIs? | 15 (8.3) | 63 (35.0) | 102 (56.7) | 4 (3–5) | High |
| 13. How often do the changes in the needs and perceptions of the ED population affect the QIs? | 14 (7.8) | 62 (34.4) | 104 (57.8) | 4 (3–5) | High |
| Workflow | |||||
| 14. How often do the crowded waiting rooms affect the QIs? | 6 (3.4) | 38 (21.1) | 136 (75.5) | 4 (3–5) | High |
| 15. How often does the improper triaging process (under or over-triaging) affect the QIs? | 20 (11.1) | 54 (30.0) | 106 (58.9) | 4 (3–5) | High |
| 16. How often do the coordinated, accountable para clinics (e.g., fast-track, rapid assessment, treatment, etc.) affect the QIs? | 21 (11.6) | 55 (30.6) | 104 (57.7) | 4 (3–5) | High |
| 17. How often does the timely disposition of patients affect the QIs? | 14 (7.8) | 54 (30.0) | 112 (62.3) | 4 (3–5) | High |
| 18. How often does the availability of clinical guides and pathways (e.g., CMG, Preset Order, Code Pathway, etc.) affect the QIs? | 25 (13.9) | 59 (32.8) | 96 (53.4) | 4 (3–5) | High |
| 19. How often does the variation in nurses’ perceptions and practice of nursing assessment and management affect the ED QIs? | 27 (15.0) | 55 (30.6) | 98 (54.5) | 4 (3–5) | High |
| 20. How often does the ED resolution capacity (flow in and out) affect the QIs? | 17 (9.5) | 63 (35.0) | 100 (55.5) | 4 (3–5) | High |
| 21. How often does the lack of hospitalization beds affect the QIs? | 7 (3.9) | 49 (27.2) | 124 (68.9) | 4 (3–5) | High |
| 22. How often does the over-demand of low or medium-severity patients (some between 80% and 90% of the total consultations), who should be seen at the primary care level, affect the QIs? | 14 (7.8) | 49 (27.2) | 117 (65.0) | 4 (3–5) | High |
| 23. How often does the deficient primary care affect the QIs? | 20 (11.1) | 52 (28.9) | 108 (60.0) | 4 (3–5) | High |
| 24. How often does an unplanned referral to our hospital (e.g., life-saving, life-threatening, etc.) affect the QIs? | 23 (12.7) | 53 (29.4) | 104 (57.8) | 4 (3–5) | High |
| 25. How often does the referral to other hospitals affect the QIs? | 28 (15.6) | 64 (35.6) | 88 (48.9) | 3 (3–5) | Low |
| 26. How often does a higher ratio of ED patients per medical doctor and nurse affect the QIs? | 12 (6.7) | 43 (23.9) | 125 (69.5) | 4 (3–5) | High |
| 27. How often do the changes in the needs and perceptions of the ED population affect the QIs? | 12 (6.7) | 61 (33.9) | 107 (59.4) | 4 (3–5) | High |
| Workforce | |||||
| 28. How often does the shortage of or insufficient physicians to allow a constant flow of patients affect the QIs? | 16 (8.9) | 54 (30.0) | 110 (61.2) | 4 (3–5) | High |
| 29. How often does the shortage of or insufficient nurses affect the QIs? | 8 (4.5) | 50 (27.8) | 122 (67.8) | 4 (3–5) | High |
| 30. How often does the shortage of or insufficient health professional staff (e.g., phlebotomist, lab technician, radiologist, pharmacist, etc.) affect the QIs? | 13 (7.2) | 53 (29.4) | 114 (63.3) | 4 (3–5) | High |
| 31. How often does the shortage of or insufficient ancillary or support staff (e.g., porter, housekeeper, etc.) affect the QIs? | 13 (7.3) | 51 (28.3) | 116 (64.5) | 4 (3–5) | High |
| 32. How often does the nurses’ job description affect the QIs? | 25 (13.9) | 56 (31.1) | 99 (55.0) | 4 (3–5) | High |
| 33. How often does the nurses’ experience affect the QIs? | 24 (13.4) | 60 (33.3) | 96 (53.4) | 4 (3–5) | High |
| 34. How often does the nurse’s competency level (e.g., skills, education, training, etc.) affect the QIs? | 26 (14.4) | 52 (28.9) | 102 (56.7) | 4 (3–5) | High |
| Nursing administration | |||||
| 35. How often do the availability of the unit strategies and clinical workflows affect the QIs? | 23 (12.8) | 58 (32.2) | 99 (55.0) | 4 (3–5) | High |
| 36. How often do the correct control and implementation of the unit strategies affect the QIs? | 21 (11.7) | 57 (31.7) | 102 (56.7) | 4 (3–5) | High |
| 37. How often do the low goals of competition and improvement affect the QIs? | 23 (12.8) | 64 (35.6) | 93 (51.7) | 4 (3–5) | High |
| 38. How often does the nurses’ motivation affect the QIs? | 21 (11.7) | 56 (31.1) | 103 (57.2) | 4 (3–5) | High |
| 39. How often does the supervisory role of the superior organization (i.e., MOH) affect the QIs? | 26 (14.4) | 61 (33.9) | 93 (51.6) | 4 (3–5) | High |
| 40. How often do unique visits (i.e., VIP, recommended customers, etc.) affect the QIs? | 33 (18.3) | 60 (33.3) | 87 (48.3) | 3 (3–5) | Low |
| 41. How often do the organizational/departmental bylaws and regulations (e.g., standard operating procedures) affect the QIs? | 28 (15.5) | 59 (32.8) | 103 (51.6) | 4 (3–5) | High |
| 42. How often does the nurses’ rotation/cross-training affect the QIs? | 26 (14.5) | 62 (34.4) | 92 (51.1) | 4 (3–5) | High |
| 43. How often does the management function and leadership role (e.g., style, approach, etc.) affect the QIs? | 26 (14.2) | 39 (21.7) | 98 (54.5) | 4 (3–5) | High |
Note:
Neutral (“sometimes”) replies remained unchanged, the positive (“often” and “always”) and negative (“never” and “rarely”) responses were merged to strengthen the results.
Decision-weighted mean rank average = 4. CMG: clinical medical guidelines; CTAS: Canadian Triage and Acuity Scale; ED: emergency department; EMR: electronic medical record; MOH: Ministry of Health; PPM: planned/periodic preventive maintenance; QIs: quality indicators; IQR: interquartile range.
Figure 1.
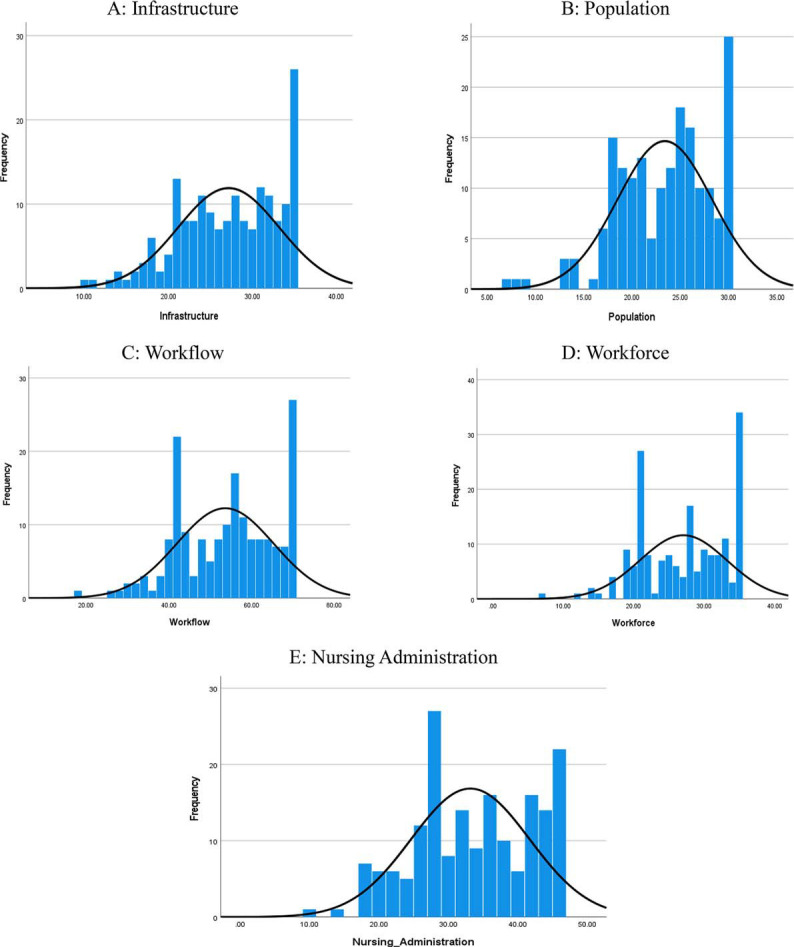
Descriptive analysis of nurses’ responses, N = 180. Frequency is the number of responses. Mean (SD) values for each domain are as follows: (A) Infrastructure: 27.19 (6.04); (B) Population: 23.39 (4.90); (C) Workflow: 53.66 (11.73); (D) Workforce: 27.05 (6.18); and (E) Nursing administration: 33.17 (8.53).
Infrastructure
Most nurses (69.5%) indicated that ED bed capacity has an effect on QIs, as well as triage area workflow/structure (68.9%), and limited resources (65.0%). The only infrastructure factor with a low impact on QIs was updated standard medical equipment (i.e., PPM), which most nurses viewed as having a negative (18.4%) or neutral (32.8%) impact.
Population
Most nurses (70.5%) thought that QIs were affected by increased ED volume during certain periods, such as wintertime and noontime, as well as the demand for nonemergency (CTAS level 4 and 5) visits (68.9%) and frequent visits from repeat patients (66.1%). All population factors were considered to have a high impact on QIs in the ED.
Workflow
All workflow factors were considered to have a large impact on ED QIs by at least half of the nurse participants, with the exception of referrals to other hospitals, which was viewed as having little or no impact by most nurses. Crowded waiting rooms were the main factor according to 75.5% of nurses, followed by a high ratio of patients to staff (69.5%), lack of hospital beds (68.9%), and over-demand of low or medium-severity patients who should be seen at the primary care level (65.0%).
Workforce
All workforce factors were considered to have a high impact on ED QIs by 53% or more of nurses. Most nurses (67.8%) believed that QIs are often impacted by a shortage of or insufficient nurses, as well as shortages of other health professional staff (63.3%) and ancillary or support staff (64.5%).
Nursing administration
With the exception of unique visits (i.e., VIP or recommended customers), more than 50% of nurses indicated that administration-related issues often impact QIs. Most participants (57.2%) agreed that the nurses’ motivation often affected the QIs, followed by control and implementation strategies (56.7%), and the availability of unit strategies and clinical workflows (55.0%).
Additional Comparisons
The outcome variables (infrastructure, population, workflow, workforce, and nursing administration) were assessed according to independent variables (age, sex, education level, professional title, adult or pediatric specialty, work area, nursing and ED experience, and awareness ED QIs). The results are presented in Tables 2 and 3 and Supplemental Figs. S1 and S2.
Table 2.
Mann-Whitney results for dichotomous sociodemographic variables (N = 180)
| Outcome Variables | Independent Variables | n | Mean Rank | z | U | p | Effect Size | Effecta |
|---|---|---|---|---|---|---|---|---|
| Sex | ||||||||
| Infrastructure | Male | 51 | 94.52 | −0.652 | 3084.5 | 0.514 | 0.05 | Small |
| Female | 129 | 88.91 | ||||||
| Population | Male | 51 | 92.71 | −0.358 | 3177 | 0.720 | 0.03 | Small |
| Female | 129 | 89.63 | ||||||
| Workflow | Male | 51 | 90.39 | −0.017 | 3284 | 0.986 | 0.00 | Small |
| Female | 129 | 90.54 | ||||||
| Workforce | Male | 51 | 92.71 | −0.359 | 3177 | 0.719 | 0.03 | Small |
| Female | 129 | 89.63 | ||||||
| Nursing administration | Male | 51 | 91.37 | −0.142 | 3245 | 0.887 | 0.01 | Small |
| Female | 129 | 90.16 | ||||||
| Specialty | ||||||||
| Infrastructure | Adult | 134 | 87.56 | −1.296 | 2688 | 0.195 | 0.10 | Small |
| Pediatric | 46 | 99.07 | ||||||
| Population | Adult | 134 | 86.92 | −1.580 | 2602 | 0.114 | 0.12 | Small |
| Pediatric | 46 | 100.93 | ||||||
| Workflow | Adult | 134 | 87.08 | −1.505 | 2624 | 0.132 | 0.11 | Small |
| Pediatric | 46 | 100.46 | ||||||
| Workforce | Adult | 134 | 87.79 | −1.199 | 2718.5 | 0.230 | 0.09 | Small |
| Pediatric | 46 | 98.40 | ||||||
| Nursing administration | Adult | 134 | 86.09 | −1.944 | 2491 | 0.052 | 0.14 | Small |
| Pediatric | 46 | 103.35 | ||||||
| Aware of QIs in ED | ||||||||
| Infrastructure | Yes | 170 | 89.44 | −1.130 | 669.5 | 0.258 | 0.08 | Small |
| No | 10 | 108.55 | ||||||
| Population | Yes | 170 | 89.44 | −1.134 | 669 | 0.257 | 0.08 | Small |
| No | 10 | 108.60 | ||||||
| Workflow | Yes | 170 | 89.77 | −0.776 | 726 | 0.438 | 0.06 | Small |
| No | 10 | 102.90 | ||||||
| Workforce | Yes | 170 | 89.34 | −1.244 | 652 | 0.214 | 0.09 | Small |
| No | 10 | 110.30 | ||||||
| Nursing administration | Yes | 170 | 89.00 | −1.597 | 595 | 0.110 | 0.12 | Small |
| No | 10 | 116.00 | ||||||
Effect size (r): small (0.01 to < 0.30), medium (0.30 to < 0.50), large (≥ 0.50).
Table 3.
Kruskal-Wallis results for continuous sociodemographic variables (N = 180)
| Outcome Variables | Independent Variables | n | Mean Rank | df | H | p | Effect Size | Effecta |
|---|---|---|---|---|---|---|---|---|
| Age, y | ||||||||
| Infrastructure | ≤ 25 | 24 | 96.46 | 4 | 2.388 | 0.665 | 0.01 | Small |
| 26–30 | 44 | 98.25 | ||||||
| 31–35 | 38 | 82.41 | ||||||
| 36–40 | 39 | 87.38 | ||||||
| >40 | 35 | 88.93 | ||||||
| Population | ≤ 25 | 24 | 89.10 | 4 | 2.525 | 0.640 | 0.01 | Small |
| 26–30 | 44 | 94.66 | ||||||
| 31–35 | 38 | 79.74 | ||||||
| 36–40 | 39 | 91.12 | ||||||
| >40 | 35 | 97.23 | ||||||
| Workflow | ≤ 25 | 24 | 93.02 | 4 | 3.497 | 0.478 | 0.02 | Small |
| 26–30 | 44 | 99.19 | ||||||
| 31–35 | 38 | 82.03 | ||||||
| 36–40 | 39 | 82.78 | ||||||
| >40 | 35 | 95.64 | ||||||
| Workforce | ≤ 25 | 24 | 102.6 | 4 | 2.741 | 0.602 | 0.02 | Small |
| 26–30 | 44 | 93.94 | ||||||
| 31–35 | 38 | 84.66 | ||||||
| 36–40 | 39 | 83.46 | ||||||
| >40 | 35 | 92.06 | ||||||
| Nursing administration | ≤ 25 | 24 | 98.46 | 4 | 2.509 | 0.643 | 0.01 | Small |
| 26–30 | 44 | 95.66 | ||||||
| 31–35 | 38 | 86.54 | ||||||
| 36–40 | 39 | 81.36 | ||||||
| >40 | 35 | 93.04 | ||||||
| Education Level | ||||||||
| Infrastructure | Diploma | 18 | 55.50 | 3 | 13.476 | 0.004** | 0.08 | Small |
| Bachelor’s | 155 | 96.15 | ||||||
| Master’s | 6 | 59.58 | ||||||
| Other | 1 | 30.00 | ||||||
| Population | Diploma | 18 | 69.25 | 3 | 7.290 | 0.063 | 0.04 | Small |
| Bachelor’s | 155 | 94.55 | ||||||
| Master’s | 6 | 58.42 | ||||||
| Other | 1 | 37.50 | ||||||
| Workflow | Diploma | 18 | 69.89 | 3 | 4.720 | 0.193 | 0.03 | Small |
| Bachelor’s | 155 | 93.60 | ||||||
| Master’s | 6 | 81.50 | ||||||
| Other | 1 | 34.50 | ||||||
| Workforce | Diploma | 18 | 69.31 | 3 | 5.283 | 0.152 | 0.03 | Small |
| Bachelor’s | 155 | 93.92 | ||||||
| Master’s | 6 | 74.58 | ||||||
| Other | 1 | 38.00 | ||||||
| Nursing administration | Diploma | 18 | 73.72 | 3 | 3.224 | 0.358 | 0.02 | Small |
| Bachelor’s | 155 | 93.20 | ||||||
| Master’s | 6 | 77.67 | ||||||
| Other | 1 | 51.50 | ||||||
| Professional Title | ||||||||
| Infrastructure | RN | 157 | 88.81 | 2 | 2.482 | 0.289 | 0.01 | Small |
| CN | 19 | 107.45 | ||||||
| HN | 4 | 76.38 | ||||||
| Population | RN | 157 | 88.73 | 2 | 1.665 | 0.435 | 0.01 | Small |
| CN | 19 | 105.00 | ||||||
| HN | 4 | 91.13 | ||||||
| Workflow | RN | 157 | 88.48 | 2 | 1.859 | 0.395 | 0.01 | Small |
| CN | 19 | 104.45 | ||||||
| HN | 4 | 103.63 | ||||||
| Workforce | RN | 157 | 88.88 | 2 | 1.312 | 0.519 | 0.01 | Small |
| CN | 19 | 103.21 | ||||||
| HN | 4 | 93.63 | ||||||
| Nursing administration | RN | 157 | 89.49 | 2 | 1.609 | 0.447 | 0.01 | Small |
| CN | 19 | 102.71 | ||||||
| HN | 4 | 72.13 | ||||||
| Work Area | ||||||||
| Infrastructure | PAC | 35 | 105.70 | 5 | 4.823 | 0.438 | 0.03 | Small |
| PCC | 10 | 78.95 | ||||||
| AAC | 34 | 89.81 | ||||||
| RZ | 31 | 85.26 | ||||||
| ACC | 36 | 92.38 | ||||||
| AAC extension | 34 | 81.74 | ||||||
| Population | PAC | 35 | 106.67 | 5 | 8.68 | 0.123 | 0.05 | Small |
| PCC | 10 | 88.55 | ||||||
| AAC | 34 | 78.37 | ||||||
| RZ | 31 | 99.37 | ||||||
| ACC | 36 | 92.35 | ||||||
| AAC extension | 34 | 76.51 | ||||||
| Workflow | PAC | 35 | 105.06 | 5 | 7.059 | 0.216 | 0.04 | Small |
| PCC | 10 | 81.45 | ||||||
| AAC | 34 | 91.35 | ||||||
| RZ | 31 | 93.94 | ||||||
| ACC | 36 | 91.63 | ||||||
| AAC extension | 34 | 73.00 | ||||||
| Workforce | PAC | 35 | 104.14 | 5 | 8.760 | 0.119 | 0.05 | Small |
| PCC | 10 | 79.80 | ||||||
| AAC | 34 | 85.78 | ||||||
| RZ | 31 | 87.95 | ||||||
| ACC | 36 | 102.68 | ||||||
| AAC extension | 34 | 73.75 | ||||||
| Nursing administration | PAC | 35 | 109.46 | 5 | 8.216 | 0.145 | 0.05 | Small |
| PCC | 10 | 79.80 | ||||||
| AAC | 34 | 92.88 | ||||||
| RZ | 31 | 87.40 | ||||||
| ACC | 36 | 89.90 | ||||||
| AAC extension | 34 | 75.21 | ||||||
| Years of Nursing Experience | ||||||||
| Infrastructure | < 1 | 29 | 98.79 | 3 | 1.096 | 0.778 | 0.01 | Small |
| 1–5 | 42 | 91.71 | ||||||
| 6–10 | 32 | 86.17 | ||||||
| > 10 | 77 | 88.51 | ||||||
| Population | < 1 | 29 | 93.34 | 3 | 0.671 | 0.880 | 0.00 | Small |
| 1–5 | 42 | 86.44 | ||||||
| 6–10 | 32 | 87.08 | ||||||
| > 10 | 77 | 93.06 | ||||||
| Workflow | < 1 | 29 | 96.83 | 3 | 0.804 | 0.848 | 0.00 | Small |
| 1–5 | 42 | 90.61 | ||||||
| 6–10 | 32 | 84.88 | ||||||
| > 10 | 77 | 90.40 | ||||||
| Workforce | < 1 | 29 | 103.52 | 3 | 2.267 | 0.519 | 0.01 | Small |
| 1–5 | 42 | 87.60 | ||||||
| 6–10 | 32 | 85.98 | ||||||
| > 10 | 77 | 89.06 | ||||||
| Nursing administration | < 1 | 29 | 103.00 | 3 | 2.104 | 0.551 | 0.01 | Small |
| 1–5 | 42 | 90.07 | ||||||
| 6–10 | 32 | 86.28 | ||||||
| > 10 | 77 | 87.78 | ||||||
| Years of ED Experience | ||||||||
| Infrastructure | < 1 | 71 | 79.98 | 3 | 11.729 | 0.008** | 0.07 | Small |
| 1–5 | 49 | 93.87 | ||||||
| 6–10 | 28 | 118.52 | ||||||
| > 10 | 32 | 84.17 | ||||||
| Population | < 1 | 71 | 77.39 | 3 | 9.465 | 0.024* | 0.05 | Small |
| 1–5 | 49 | 91.51 | ||||||
| 6–10 | 28 | 107.64 | ||||||
| > 10 | 32 | 103.05 | ||||||
| Workflow | < 1 | 71 | 79.46 | 3 | 10.687 | 0.014* | 0.06 | Small |
| 1–5 | 49 | 88.18 | ||||||
| 6–10 | 28 | 116.63 | ||||||
| > 10 | 32 | 95.69 | ||||||
| Workforce | < 1 | 71 | 83.36 | 3 | 8.392 | 0.039* | 0.05 | Small |
| 1–5 | 49 | 85.67 | ||||||
| 6–10 | 28 | 115.64 | ||||||
| > 10 | 32 | 91.73 | ||||||
| Nursing administration | < 1 | 71 | 80.87 | 3 | 9.535 | 0.023* | 0.05 | Small |
| 1–5 | 49 | 89.49 | ||||||
| 6–10 | 28 | 116.63 | ||||||
| > 10 | 32 | 90.55 | ||||||
Effect size (E2R): small (0.01 to < 0.08), medium (0.08 to < 0.26), large (≥ 0.26).
Statistically significant at α ≤ 0.05; **statistically significant at α ≤ 0.01.
AAC: adult acute care; ACC: adult critical care; CN: charge nurse; ED: emergency department; HN: head nurse; PAC: pediatric acute care; PCC: pediatric critical care; RN: registered nurse; RZ: respiratory zone.
There were no significant differences in outcome variables on the basis of age, sex, nursing experience, professional title, work area, or awareness of ED QIs. Significant differences were found on the basis of education level (for infrastructure only, p = 0.004), specialty (for nursing administration only, p = 0.052), and ED experience (for all variables, p = 0.008–0.039).
Post hoc testing was performed to better understand where the significant difference arises within subgroups of independent variables (Table 4). Comparisons made among the educational level groups show a significant difference for the number of nurses with master’s (n = 6) versus bachelor’s degrees (n = 155) (p = 0.010). Comparisons made among the years of experience in the ED concerning infrastructure show a significant difference for the < 1 (n = 71) versus 6–10 (n = 28) years-of-ED-experience groups for the infrastructure (p = 0.005), workflow (p = 0.008), workforce (p = 0.031), and nursing administration (p = 0.012).
Table 4.
Pairwise comparisons of nurse characteristics by Emergency Department (ED) Quality Indicator (N = 180)
| Test Statistic | Std Error | Std Test Statistic | Sig | Adj Siga | |
|---|---|---|---|---|---|
| Education Level – Infrastructure | |||||
| Other vs Master’s | 25.500 | 53.393 | 0.478 | 0.633 | 1.000 |
| Other vs Diploma | 29.583 | 56.133 | 0.527 | 0.598 | 1.000 |
| Other vs Bachelor’s | 66.152 | 52.136 | 1.269 | 0.205 | 1.000 |
| Master’s vs Diploma | −4.083 | 24.498 | −0.167 | 0.868 | 1.000 |
| Master’s vs Bachelor’s | −40.652 | 12.941 | −3.141 | 0.002 | 0.010* |
| Diploma vs Bachelor’s | 36.568 | 21.623 | 1.691 | 0.091 | 0.545 |
| Years of Experience in ED – Infrastructure | |||||
| < 1 vs 1–5 | −4.193 | 11.065 | −0.379 | 0.705 | 1.000 |
| < 1 vs > 10 | −13.888 | 9.652 | −1.439 | 0.150 | 0.901 |
| < 1 vs 6–10 | −38.539 | 11.597 | −3.323 | 0.001 | 0.005** |
| 1–5 vs > 10 | 9.695 | 11.812 | 0.821 | 0.412 | 1.000 |
| 1–5 vs 6–10 | 34.346 | 13.448 | 2.554 | 0.011 | 0.064 |
| >10 vs 6–10 | −24.651 | 12.311 | −2.002 | 0.045 | 0.272 |
| Years of Experience in ED –Population | |||||
| < 1 vs 1–5 | −14.123 | 9.644 | −1.464 | 0.143 | 0.859 |
| < 1 vs > 10 | −25.660 | 11.057 | −2.321 | 0.020 | 0.122 |
| < 1 vs 6–10 | −30.256 | 11.588 | −2.611 | 0.009 | 0.054 |
| 1–5 vs > 10 | −11.537 | 11.803 | −0.977 | 0.328 | 1.000 |
| 1–5 vs 6-10 | −16.133 | 12.302 | −1.311 | 0.190 | 1.000 |
| > 10 vs 6–10 | 4.596 | 13.438 | 0.342 | 0.732 | 1.000 |
| Years of Experience in ED – Workflow | |||||
| < 1 vs 1–5 | −8.726 | 9.657 | −0.904 | 0.366 | 1.000 |
| < 1 vs >10 | −16.230 | 11.071 | −1.466 | 0.143 | 0.856 |
| < 1 vs 6–10 | −37.167 | 11.603 | −3.203 | 0.001 | 0.008** |
| 1–5 vs > 10 | −7.504 | 11.818 | −0.635 | 0.525 | 1.000 |
| 1–5 vs 6–10 | −28.441 | 12.318 | −2.309 | 0.021 | 0.126 |
| > 10 vs 6–10 | 20.938 | 13.455 | 1.556 | 0.120 | 0.718 |
| Years of Experience in ED – Workforce | |||||
| < 1 vs 1–5 | −2.314 | 9.619 | −0.241 | 0.810 | 1.000 |
| < 1 vs > 10 | −8.375 | 11.028 | −0.759 | 0.448 | 1.000 |
| < 1 vs 6–10 | −32.284 | 11.558 | −2.793 | 0.005 | 0.031* |
| 1–5 vs > 10 | −6.061 | 11.772 | −0.515 | 0.607 | 1.000 |
| 1–5 vs 6–10 | −29.969 | 12.270 | −2.442 | 0.015 | 0.088 |
| > 10 vs 6–10 | 23.908 | 13.403 | 1.784 | 0.074 | 0.447 |
| Years of Experience in ED – Nursing Administration | |||||
| < 1 vs 1–5 | −8.617 | 9.650 | −0.893 | 0.372 | 1.000 |
| < 1 vs > 10 | −9.674 | 11.063 | −0.874 | 0.382 | 1.000 |
| < 1 vs 6–10 | −35.752 | 11.594 | −3.084 | 0.002 | 0.012* |
| 1–5 vs > 10 | −1.057 | 11.809 | −0.090 | 0.929 | 1.000 |
| 1–5 vs 6–10 | −27.135 | 12.309 | −2.205 | 0.027 | 0.165 |
| > 10 vs 6–10 | 26.078 | 13.445 | 1.940 | 0.052 | 0.315 |
Significance values have been adjusted by the Bonferroni correction for multiple tests.
Statistically significant at α ≤ 0.05; **statistically significant at α ≤ 0.01.
Adj: adjusted; ED: emergency department; Sig: significance; Std: standard.
DISCUSSION
Performance analysis is prodigiously significant in upsurging healthcare organizations’ operational efficiency, which is influenced by numerous indicators. Healthcare management must monitor and assess performance for better decision-making and policy-making.[25,26] Therefore, development of QIs will eventually be used for planning and evaluating performance in the ED.[27,28]
Regarding ED infrastructure, our study found that bed capacity is a significant challenge that often affects QIs.[29] Moreover, lack of institutional capacity (surge capacity) leads to boarding in the ED with resultant ED crowding.[30,31] Therefore, improving the efficiency of patient discharge from the ED can enhance QIs and reduce LOS, leading to a decrease in ED congestion.[11,32] Additionally, proper distribution of infrastructure resources has had a good impact on reducing overcrowding in the ED, eliminating boarders, and enhancing the quality of care and patient satisfaction.[33] Availability of critical inpatient beds affects the ability to transfer patients with complicated conditions to their definitive care unit, resulting in longer ED boarding times and worse patient outcomes and is associated with an increase in all-cause 30-day mortality.[34–37]
ED overcrowding has become a serious public health problem caused by multiple, intertwined factors, consequently leading to delays in care and affecting ED flow.[38,39] Although most identified causes related to the number and type of people attending the ED and timely discharge from the ED, the suggested solutions focused on efficient patient flow within the ED rather than the introduction of whole-of-system initiatives.[40] This study indicated that workflow is another influential challenge attributed to the healthcare providers’ perceptions and practice. Variation of inpatient bed requests is perplexing and results in longer delays in receiving an inpatient bed.[41] Consequently, the proactive inpatient bed allocation request can significantly reduce bed allocation delays for ED patients by almost 50% without causing delays for other admission sources.[42] Thus, using the hallway for admitting boarded patients can enhance flow and reduce the LOS for ED bed occupancy[43]; therefore, such a resource should be considered in the workflow at the time of resource limitation.
The workforce domain presents significant challenges and occasionally acts as a barrier to meeting performance targets. The findings of our study indicate that a shortage of nurses was perceived as affecting QIs and conflicts with staff competency, which has been demonstrated to have an impact in other studies.[44] Understaffing is undoubtedly a critical factor; therefore, staffing must match the demand for services.[45,46] Reduced turnaround times for beds due to a rise in critically ill patients who require emergency care can create a burden for ED staff, who may already be experiencing stress and burnout. Therefore, the ED administration must take into account departmental bylaws and regulations regarding indicators that address staff satisfaction.[14]
Significant variations in the perceptions of ED nurses concerning the impact of infrastructure and workflow on ED QIs were found among the field of expertise, i.e., adult versus pediatric nurses. Such critical differences could be attributed to the number of beds in adult EDs, which is more than double that of pediatric EDs; to the availability of some quality metrics in adult EDs that are not available in pediatric Eds, such as door to electrocardiograph time; and to the availability of some services in adult EDs being guided by certain protocols and guidelines that are not provided in pediatric EDs, such as Code Stroke and Code STEMI (ST-elevation myocardial infarction).
Lessons and Limitations
The study has some limitations. It is a single-site study, and the participants were nurses only, with no involvement of other healthcare professionals. Further, the cross-sectional design precludes causation. Lastly, although most participants were aware of the ED QIs, this does not prove that they have enough appropriate or accurate knowledge of QIs.[47]
Based on the lessons learned from this study, the following recommendations are provided to address and overcome obstacles and challenges regarding ED QIs.
Urge ED policymakers to use follow-up and ongoing evaluation data to reduce waiting times.
Improve the effective and efficient use of primary healthcare facilities to accept all ED referrals for levels 4 and 5 of the Canadian Triage and Acuity Scale (CTAS) around-the-clock to reduce the demands of unnecessary visits to ED.
Create mobile tents or facilities with quick assessment and treatment beds and para-clinics for patients triaged at CTAS level 4 or 5.
Facilitate and enhance the throughput of ED-boarded dischargeable patients so they do not stay in the ED for an extended amount of time.
Increase the workforce and maximize the use of resources at peak times.
Critical patients should not stay long in the ED, as this could worsen their outcomes and consume more resources; hence, improved throughput and targeted care is suggested for patients awaiting intensive care unit admission.
Reduce elective admissions, implementation of both early daily discharges and continued discharges throughout the weekend, all to improve capacity, as well as the development and activation of the full-capacity protocol (bed crisis policy) when overall hospital capacity has been exceeded.
Implications for Emergency Department Administration and Policymakers
Our findings suggest that raising awareness of QIs might improve ED performance, as they are useful in assessing whether progress has been made. ED performance may be better understood by comparing performance indicators inside an ED or between EDs, which fosters learning and continual improvement. Also, these findings will help nursing administrators to (1) enhance the performance of the ED in particular, and the hospital in general, by identifying the critical indicators that affect their operations for better decision-making; (2) form a panel of healthcare professionals to set a clear plan, propose suitable solutions, and streamline the implementation process to overcome these hindrances; and (3) explore and exploit all available resources to improve the ED performance by (a) selecting the appropriate solutions that maintain the highest standards of emergency care provided to the community; (b) establishing strategies for the sustainability of quality indicators in the ED, i.e., the hospital should consider how it may need to adapt its strategies in the future as staff, technology, funding, or the social context changes; and (c) overcoming the contributing factors by using the latest evidence, acquiring and sharing national or worldwide expertise, and establishing partnerships with other healthcare organizations.
The following key points can be applied to increase awareness for QIs and impact performance in the ED:[48]
Create a uniform fast-tracks care pathway for patients with low-acuity conditions.
Standardize the processes by conducting a daily huddle.
Distribute real-time performance metrics by sharing a daily data report with frontline and executive staff; this will facilitate adjustments to the new processes.
Allocate staff properly to maintain team consistency.
Engage and align with an executive strategic plan.
CONCLUSION
The analysis uncovered various critical aspects of infrastructure, workflow, population, workforce, and nursing administration that have a major effect on patient flow in the ED. Comprehending these aspects will greatly affect the quality measures of ED performance and assist policymakers in formulating strategic plans to enhance ED performance. Therefore, successful implementation and optimization of ED resources depend greatly on considering the right decision variables and resource restrictions.
Supplemental Material
Supplemental materials are available online with the article.
Supplementary Material
Acknowledgments
We acknowledge King Fahad Medical City Research Center for technical support.
References
- 1.Shojaei P Pourmohammadi K Hatam N et al.. Identification and prioritization of critical factors affecting the performance of Iranian public hospitals using the best-worst method: a prospective study. Iran J Med Sci. 2022;47:549. [DOI] [PMC free article] [PubMed] [Google Scholar]
- 2.Samadbeik M Staib A Boyle J et al.. Patient flow in emergency departments: a comprehensive umbrella review of solutions and challenges across the health system. BMC Health Serv Res. 2024;24:274. [DOI] [PMC free article] [PubMed] [Google Scholar]
- 3.Butun A Kafdag EE Gunduz H et al.. Emergency department overcrowding: causes and solutions. Emerg Crit Care Med. 2023;3:171−176. [Google Scholar]
- 4.Ba-Aoum M Hosseinichimeh N Triantis KP et al.. Statistical analysis of factors influencing patient length of stay in emergency departments. IJIEOM. 2023;5:220−239. [Google Scholar]
- 5.Hemmati F Mahmoudi G Dabbaghi F et al.. The factors affecting the waiting time of outpatients in the emergency unit of selected teaching hospitals of Tehran. Electron J Gen Med. 2018;15. 10.29333/ejgm/93135 [DOI] [Google Scholar]
- 6.Ersun A Basbakkal Z Yardimci F et al.. A study of the malpractice trends in pediatric nurses. 1st PNAE Congress on Paediatric Nursing; 2011:135. [Google Scholar]
- 7.Källberg A-S.Patient Safety in the Emergency Department: Errors, Interruptions and Staff Experience. Karolinska Institutet; 2015. [Google Scholar]
- 8.Al-Amer R Darwish M Malak M et al.. Nurses experience of caring for patients with COVID-19: a phenomenological study. Front Psychiatry. 2022;13:922410. [DOI] [PMC free article] [PubMed] [Google Scholar]
- 9.Abuzied Y Al-Amer R Somduth S et al.. Psychological responses among healthcare workers providing care for patients with COVID-19: a web-based cross-sectional survey in Riyadh, Saudi Arabia. Glob J Qual Saf Healthc. 2021;4:131–134. [DOI] [PMC free article] [PubMed] [Google Scholar]
- 10.Al Nhdi N, Al Asmari H, Al Thobaity A. Investigating indicators of waiting time and length of stay in emergency departments. Open Access Emerg Med. 2021:311−318. [DOI] [PMC free article] [PubMed] [Google Scholar]
- 11.Abuzied Y, Maymani H, AlMatouq B, AlDosary O. Reducing the length of stay by enhancing the patient discharge process: using quality improvement tools to optimize hospital efficiency. Glob J Qual Saf Healthc. 2021;4:44−49. [DOI] [PMC free article] [PubMed] [Google Scholar]
- 12.Alshammary SA, Abuzied Y, Ratnapalan S. Enhancing palliative care occupancy and efficiency: a quality improvement project that uses a healthcare pathway for service integration and policy development. BMJ Open Qual. 2021;10:e001391. [DOI] [PMC free article] [PubMed] [Google Scholar]
- 13.Majidi SA, Nasiripour AA, Tabibi SJ, Masoudi I. Evaluation of emergency department performance improvement—a systematic review on influence factors. Int J Med Res Health Sci. 2016;5:85−100. [Google Scholar]
- 14.Núñez A Neriz L Mateo R et al.. Emergency departments key performance indicators: a unified framework and its practice. Int J Health Plann Manage. 2018;33:915−933. [DOI] [PubMed] [Google Scholar]
- 15.Agustina V, Efendy I, Lubis M. Analysis of factors affecting the performance of emergency nurses in Bhayangkara Tebing Tinggi Public Hospital. J La Medihealtico. 2020;1:52–64. [Google Scholar]
- 16.Savsar M, Çiçek H. Analysis of effects of some factors on performance of a dental clinic. Avrupa Bilim ve Teknoloji Dergisi. 2020:335−344. [Google Scholar]
- 17.Weigl M, Schneider A. Associations of work characteristics, employee strain and self-perceived quality of care in emergency departments: a cross-sectional study. Int Emerg Nurs. 2017;30:20−24. [DOI] [PubMed] [Google Scholar]
- 18.Almasi S, Rabiei R, Moghaddasi H, Vahidi-Asl M. Emergency department quality dashboard: a systematic review of performance indicators, functionalities, and challenges. Arch Acad Emerg Med. 2021;9:e47. [DOI] [PMC free article] [PubMed] [Google Scholar]
- 19.McCabe A Fhailí SNA O’Sullivan R et al.. Development and validation of a data dictionary for a feasibility analysis of emergency department key performance indicators. Int J Med Inform. 2019;126:59−64. [DOI] [PubMed] [Google Scholar]
- 20.Sethi S Boulind C Reeve J et al.. Effect of hospital interventions to improve patient flow on emergency department clinical quality indicators. Emerg Med J. 2020;37:787−792. [DOI] [PubMed] [Google Scholar]
- 21.Sorić M, Špoljar D, Golubić M. Effect of the introduction of emergency medicine specialists on the emergency department performance indicators: a retrospective data analysis. Acta Clin Croat. 2022;61(suppl 1):9−12. [DOI] [PMC free article] [PubMed] [Google Scholar]
- 22.Alatawi AD Niessen LW Bhardwaj M et al.. Factors influencing the efficiency of public hospitals in Saudi Arabia: a qualitative study exploring stakeholders’ perspectives and suggestions for improvement. Front Public Health. 2022;10:922597. [DOI] [PMC free article] [PubMed] [Google Scholar]
- 23.Clancy C, Shine C, Hennessy M. Spending Review 2022—hospital performance: an analysis of HSE key performance indicators. Irish Government Economic and Evaluation Service; Research Services & Policy Unit, Department of Health. 2023. [Google Scholar]
- 24.Sample size calculator. Raosoft. Accessed Jul 2, 2024. www.raosoft.com/samplesize.html
- 25.Abuzied Y Deeb A AlAnizy L et al.. Improving venous thromboembolism prophylaxis through service integration, policy enhancement, and health informatics. Glob J Qual Saf Healthc. 2024;7:22–27. [DOI] [PMC free article] [PubMed] [Google Scholar]
- 26.Abuzied Y, Al-Amer R, Abuzaid M, Somduth S. The Magnet recognition program and quality improvement in nursing. Glob J Qual Saf Healthc. 2022;5:106–108. [DOI] [PMC free article] [PubMed] [Google Scholar]
- 27.MayelAfshar M, Noohi F, Riahi L, Nikravan A. Identification of the key performance indicators for designing an emergency department dashboard in a referral cardiac hospital. Iran Red Crescent Med J. 2021;23. 10.32592/ircmj.2021.23.7.714 [DOI] [Google Scholar]
- 28.Abuzied Y, Alshammary SA, Alhalahlah T, Somduth S. Using FOCUS-PDSA quality improvement methodology model in healthcare: process and outcomes. Glob J Qual Saf Healthc. 2023;6:70–72. [DOI] [PMC free article] [PubMed] [Google Scholar]
- 29.Etu E-E Monplaisir L Aguwa C et al.. Identifying indicators influencing emergency department performance during a medical surge: a consensus-based modified fuzzy Delphi approach. PLoS One. 2022;17:e0265101. [DOI] [PMC free article] [PubMed] [Google Scholar]
- 30.McKenna P Heslin SM Viccellio P et al.. Emergency department and hospital crowding: causes, consequences, and cures. Clin Exp Emerg Med. 2019;6:189. [DOI] [PMC free article] [PubMed] [Google Scholar]
- 31.Kenny JF, Chang BC, Hemmert KC. Factors affecting emergency department crowding. Emerg Med Clin. 2020;38:573–587. [DOI] [PubMed] [Google Scholar]
- 32.Khare RK, Powell ES, Reinhardt G, Lucenti M. Adding more beds to the emergency department or reducing admitted patient boarding times: which has a more significant influence on emergency department congestion? Ann Emerg Med. 2009;53:575–585.e2. [DOI] [PubMed] [Google Scholar]
- 33.Thomas Schneider A Luuk Besselink P Zonderland ME et al.. Allocating emergency beds improves the emergency admission flow. Interfaces. 2018;48:384–394. [Google Scholar]
- 34.Mathews KS Durst MS Vargas-Torres C et al.. Effect of emergency department and ICU occupancy on admission decisions and outcomes for critically ill patients. Crit Care Med. 2018;46:720–727. [DOI] [PMC free article] [PubMed] [Google Scholar]
- 35.Jones S Moulton C Swift S et al.. Association between delays to patient admission from the emergency department and all-cause 30-day mortality. Emerg Med J. 2022;39:168–173. [DOI] [PubMed] [Google Scholar]
- 36.Salehi L Phalpher P Valani R et al.. Emergency department boarding: a descriptive analysis and measurement of impact on outcomes. Can J Emerg Med. 2018;20:929–937. [DOI] [PubMed] [Google Scholar]
- 37.Kusumawati HI, Magarey J, Rasmussen P. Analysis of factors influencing length of stay in the Emergency Department in public hospital, Yogyakarta, Indonesia. Australas Emerg Care. 2019;22:174–179. [DOI] [PubMed] [Google Scholar]
- 38.Potts L, Ryan C, Diegel-Vacek L, Murchek A. Improving patient flow from the emergency department utilizing a standardized electronic nursing handoff process. J Nurs Adm. 2018;48:432–436. [DOI] [PubMed] [Google Scholar]
- 39.DeAnda R. Stop the bottleneck: improving patient throughput in the emergency department. J Emerg Nurs. 2018;44:582–588. [DOI] [PubMed] [Google Scholar]
- 40.Morley C Unwin M Peterson GM et al.. Emergency department crowding: a systematic review of causes, consequences and solutions. PLoS One. 2018;13:e0203316. [DOI] [PMC free article] [PubMed] [Google Scholar]
- 41.Feizi A, Carson A, Jaeker JB, Baker WE. To batch or not to batch: impact of admission batching on emergency department boarding time and physician productivity. Oper Res. 2023;71:939–957. [Google Scholar]
- 42.Lee S-Y Chinnam RB Dalkiran E et al.. Proactive coordination of inpatient bed management to reduce emergency department patient boarding. Int J Prod Econ. 2021;231:107842. [Google Scholar]
- 43.Valipoor S Hatami M Hakimjavadi H et al.. Data-driven design strategies to address crowding and boarding in an emergency department: a discrete-event simulation study. Health Environ Res Design J. 2021;14:161–177. [DOI] [PubMed] [Google Scholar]
- 44.Austin EE Blakely B Tufanaru C et al.. Strategies to measure and improve emergency department performance: a scoping review. Scand J Trauma Resuscitation Emerg Med. 2020;28:1–14. [DOI] [PMC free article] [PubMed] [Google Scholar]
- 45.Wang J. Patient flow modeling and optimal staffing for emergency departments: a Petri Net Approach. IEEE Trans Comput Soc Syst. 2023;10:2022–2032. [Google Scholar]
- 46.Ahsan KB, Alam M, Morel DG, Karim M. Emergency department resource optimisation for improved performance: a review. J Ind Eng Int. 2019;15:253–266. [Google Scholar]
- 47.Masoumi G Rezai M Dehghani A et al.. Emergency medicine specialists’ knowledge of hospital emergency department indicators and their role in patient treatment: a qualitative study. Shiraz E Med J. 2023;24. 10.5812/semj-130697 [DOI] [Google Scholar]
- 48.Mercer MP, Singh MK, Kanzaria HK. Reducing emergency department length of stay. Jama. 2019;321:1402–1403. [DOI] [PubMed] [Google Scholar]
Associated Data
This section collects any data citations, data availability statements, or supplementary materials included in this article.