



Abstract
Traumatic brain injury (TBI) is associated with various endocrine abnormalities, including pituitary axis dysfunction. Understanding the prevalence and temporal patterns of these dysfunctions is crucial for effective clinical management. This study aimed to systematically review the literature and conduct a meta-analysis to determine the prevalence of pituitary axis dysfunction following TBI, assess temporal patterns across different post-injury durations, and identify potential contributing factors. A comprehensive search was conducted across multiple electronic databases between 1st of January 2000 until 31st March 2024. Studies reporting the prevalence of pituitary axis dysfunction post-TBI were included. Pooled estimates with 95% confidence intervals (CIs) were calculated using random-effects models in the R statistical software. Subgroup analyses were performed based on duration post-TBI (< 3 months, 3–6 months, 6–12 months, > 12 months) to explore temporal variations. Heterogeneity was assessed using the I^2 statistic. A total of 52 studies were included in the meta-analysis, encompassing 7367 participants. The pooled estimate for the prevalence of any pituitary axis dysfunction post-TBI was 33% (95% CI [28%; 37%]). Subgroup analysis by duration revealed varying prevalence rates: < 3 months (40%, 95% CI [27%; 53%]), 3–6 months (31%, 95% CI [15%; 47%]), 6–12 months (26%, 95% CI [19%; 33%]), and > 12 months (32%, 95% CI [26%; 38%]). Prevalence of multiple axes affection was 7% (95% CI [6%; 9%]), with varying rates across durations. Specific axes affection varied: Growth Hormone (GH) deficiency was 18% (95% CI [14%; 21%]), adrenocorticotropic hormone (ACTH) deficiency was 10% (95% CI [8%; 13%]), pituitary–gonadal axis hormones deficiency was 16% (95% CI [12%; 19%]), and thyroid-stimulating hormone (TSH) deficiency was 6% (95% CI [5%; 7%]). This meta-analysis highlights a significant prevalence of pituitary axis dysfunction following TBI, with temporal variations observed across different post-injury durations. The findings underscore the importance of tailored clinical management strategies based on the duration and type of dysfunction. Further research addressing potential contributing factors is warranted to enhance understanding and management of these conditions.
Keywords: Traumatic brain injury, Pituitary axis dysfunction, Prevalence, Meta-analysis, Temporal patterns, Endocrine abnormalities
Background
Traumatic brain injury (TBI) is a significant public health concern globally, contributing to substantial morbidity and mortality rates across all age groups [1, 2]. TBI encompasses a spectrum of injuries resulting from external mechanical forces to the head, leading to transient or permanent neurological dysfunction. Common causes of TBI include motor vehicle accidents, falls, assaults, and sports-related injuries [3–5].
One of the lesser-known but clinically significant consequences of TBI is its potential to disrupt the functioning of the pituitary gland, leading to a spectrum of endocrine abnormalities collectively termed hypopituitarism [6–8]. Hypopituitarism following TBI can manifest as deficiencies in the adenohypophysis hormones such as: growth hormone (GH), adrenocorticotropic hormone (ACTH), thyroid-stimulating hormone (TSH), and pituitary–gonadal axis hormones. Furthermore, it can also manifest as deficiencies in the neurohypophysis hormones such as: antidiuretic hormone (ADH) [8, 9].
The pathophysiology of pituitary dysfunction post-TBI is multifactorial and not entirely understood. Direct trauma to the pituitary gland, disruption of the hypothalamic-pituitary axis, ischemic injury, and neuroinflammatory responses are among the proposed mechanisms contributing to post-TBI hypopituitarism [10]. The extent and severity of pituitary dysfunction may vary depending on factors such as the nature of the injury (e.g., focal vs. diffuse), TBI severity (mild, moderate, severe), time elapsed since the injury, and individual patient characteristics [11].
Understanding the prevalence and patterns of pituitary axis dysfunction following TBI is essential for several reasons. Firstly, unrecognized and untreated hypopituitarism can lead to a range of adverse health outcomes, including metabolic derangements, impaired quality of life, cognitive deficits, and increased mortality rates [12]. Secondly, early detection and management of hormone deficiencies can mitigate long-term complications and improve patient outcomes. However, diagnosing post-TBI hypopituitarism presents challenges due to its nonspecific symptoms, overlapping with those of TBI sequelae and other comorbidities [9, 13].
Previous epidemiological studies investigating the prevalence of hypopituitarism following TBI have reported varying prevalence rates, ranging from single-digit percentages to more than 50%, this variation in prevalence might be related to varying TBI severity, which is established by Glasgow Coma Score (GCS) and paraclinical findings, and depending on the study population, methodology, and diagnostic criteria employed [6, 14]. However, a comprehensive synthesis and analysis of existing literature are necessary to provide a more accurate estimate of the prevalence of pituitary axis dysfunction post-TBI, identify potential risk factors associated with its development, and guide clinical management strategies.
Study aim and objectives
The aim of this study is to conduct a systematic review and meta-analysis to determine the prevalence of pituitary axis dysfunction following traumatic brain injury (TBI) and to explore temporal trends in prevalence rates over different time intervals. By the following:
Assess the prevalence of pituitary axis dysfunction after traumatic brain injury (TBI).
Examine different types of hormone deficiencies related to the pituitary gland post-injury.
Identify temporal trends in the prevalence of pituitary dysfunction over various time frames, from less than 3 months to over 12 months after the injury.
Methodology
Study design
This meta-analysis follows a systematic and comprehensive approach to synthesize available evidence on the prevalence of hypopituitarism following traumatic brain injury (TBI). The study design adhered to the Preferred Reporting Items for Systematic Reviews and Meta-Analyses (PRISMA) guidelines [15].
Study duration
The meta-analysis includes studies published between 1st of January 2000 until the search date of 31st of March 2024. No restrictions were placed on the publication year to ensure the inclusion of relevant studies spanning a wide timeframe.
Search strategy
A comprehensive literature search was conducted across multiple electronic databases, including PubMed, Web of Science, Scopus, Medline, the Cochrane Library, and Google Scholar. The search strategy utilized a combination of terms: traumatic brain injury, pituitary axis dysfunction, hypopituitarism, endocrine abnormalities, prevalence, and epidemiology. Extracted articles from google scholar were vetted by our authors through screening the title and abstract without selecting articles reporting exclusively endocrine findings. Boolean operators (AND, OR) were used to refine the search and ensure comprehensive coverage of relevant literature. The search was limited to studies published in English between 1st of January 2000 until the search date of 31st of March 2024.
Study selection
Studies were initially screened based on titles and abstracts to identify potentially relevant articles by three authors (GA, AT, ARA) independently. Reviewers avoided bias by disregarding authors’ name and affiliated institutions. Subsequently, full-text articles were retrieved for detailed evaluation against the inclusion criteria. The outcome was then gathered into Microsoft Excel and the Preferred Reporting Items for Systemic Reviews and Meta-Analysis (PRISMA) statement was performed in its three stages (Fig. 1). Consensus was the method to resolve disagreement.
Fig. 1.

PRISMA flow diagram for summary of search and screening processes
Inclusion criteria
Studies were included if they met the following criteria:
Observational studies, cohort studies, case–control studies, and cross-sectional studies.
Published in English.
Pituitary dysfunction post traumatic brain injury diagnosed by blood tests using cutoff values based current guidelines.
Reported prevalence rates or provided data to calculate prevalence.
Used clear diagnostic criteria for pituitary dysfunction.
Included adult human subjects.
Exclusion criteria
Studies were excluded if they:
Did not report primary data on pituitary dysfunction prevalence regardless of the study design.
Secondary sources (i.e. not reporting original data)
Were duplicates or redundant publications.
Had sample sizes of fewer than 10 participants to ensure statistical reliability.
Studies with a score bellow 7 on Newcastle–Ottawa Scale (NOS)
Data extraction and synthesis
Data extraction was performed independently by two reviewers using a standardised data extraction form. Extracted data included study characteristics (e.g., author names, publication year, study design, country), participant demographics (e.g., sample size, age, gender distribution), TBI severity, prevalence rates of any pituitary axis dysfunction and specific axis dysfunctions (e.g., growth hormone deficiency, adrenocorticotropic hormone deficiency), and temporal data (e.g., duration post-TBI).
Quality assessment
The methodological quality of included studies was assessed using the Newcastle–Ottawa Scale (NOS) for observational studies. The NOS evaluates studies based on three domains: selection of study groups, comparability of groups, and ascertainment of outcomes. Studies were evaluated by three investigators independently on a scale of 0 to 9, with higher scores indicating higher methodological quality [16]. Studies with a score between 7 and 9 were included.
Software and statistical analysis
The R meta package was utilised for statistical analyses [17]. Pooled estimates of prevalence rates were calculated using random-effects models, which account for both within-study and between-study variability. The most used method with random-effects model is the DerSimonian-Laird (D-L) method which was employed to estimate the between-study variance (tau-squared). D-L method was applied due its simplicity and computational efficiency in which makes it reliable for diverse levels of heterogeneity as seen in our data. The publication bias was assessed using funnel plots. Forest plots were generated to visually represent the pooled estimates along with their 95% confidence intervals (CIs).
Assessment of heterogeneity
Heterogeneity among studies was assessed using the I^2 statistic, with values of 25%, 50%, and 75% indicating low, moderate, and high heterogeneity, respectively. Subgroup analyses were conducted based on the duration post-TBI (< 3 months, 3–6 months, 6–12 months, > 12 months) to explore temporal variations in prevalence rates.
Results
Search results
Our comprehensive search across multiple databases including PubMed, Web of Science, Scopus, Medine, the Cochrane Library, and Google Scholar yielded a total of 3166 records. After removing duplicates (2062 records), 1104 unique records were screened based on their titles and abstracts. Of these, 887 records were excluded, leading to 217 studies being sought for full-text retrieval. However, 7 studies were not retrieved, resulting in 210 studies that were assessed for eligibility. Through a meticulous eligibility assessment, 158 studies were further excluded, leaving us with a final inclusion of 52 studies for our meta-analysis (Fig. 1). The characters of the included studies are presented in Table 1.
Table 1.
Characters of the included studies and populations of TBI patients (n = 52)
| Study | Country | Study design | Sample size | M% | Age | Time after event, months | BMI | Mild TBI, n | Moderate TBI, n | Severe TBI, n | NOS Score |
|---|---|---|---|---|---|---|---|---|---|---|---|
| Agha et al., 2005 [18] | Ireland | Prospective | 50 | 76.0% | 37 ± 14 | 7d, 6 m, 12 m | NR | NR | NR | NR | 8 |
| Agha et al., 2004 [19] | Ireland | Cross-sectional | 102 | 83.3% | 28 (15–65) | 6-36 m | NR | NR | NR | NR | 8 |
| Aimaretti et al., 2004 [20] | Italy | Prospective | 100 | 69.0% | 37.1 ± 1.8 | 3 m | 23.7 ± 0.4 | 55 | 24 | 21 | 9 |
| Aimaretti et al., 2005 [21] | Italy | Prospective | 70 | 71.4% | 39.3 ± 2.4 | 12 m | 23.8 ± 0.4 | 33 | 22 | 15 | 8 |
| Alavi et al., 2015 [22] | UK | Prospective | 105 | 74.3% | NR | 6-12 m, > 12 m | NR | NR | NR | NR | 9 |
| Bavisetty et al., 2008 [23] | USA | Prospective | 70 | 81.4% | 32 | 6-9 m | NR | NR | NR | NR | 8 |
| Bensalah et al., 2020 [24] | Algeria | Prospective | 133 | 96.2% | 32.2 ± 10 | 3 m, 12 m | NR | 0 | 100 | 33 | 8 |
| Berg et al., 2010 [25] | Germany | Cross-sectional | 246 | 54.1% | 39 ± 14 | 4-47 m | 25.8 ± 4.2 | NR | NR | NR | 8 |
| Bondanelli et al., 2004 [26] | Italy | Cross-sectional | 50 | 80.0% | 37.6 ± 2.4 | 12-64 m | 24.6 ± 0.4 | 16 | 7 | 27 | 8 |
| Bushnik et al., 2007 [27] | USA | Cross-sectional | 64 | 67.2% | 42 ± 12 | 1.2-31y | NR | NR | NR | NR | 8 |
| Choudhary et al., 2023 [28] | India | Prospective | 100 | NR | NR | 2d, 14d, 1 m, 3 m, 6 m | NR | 0 | 77 | 23 | 9 |
| Ciarlone et al., 2020 [29] | USA | Retrospective | 59 | 94.9% | NR | 1y, 2y, 3y | 24.5 ± 3.6 | 59 | 0 | 0 | 7 |
| Claessen et al., 2024 [30] | Iceland | Retrospective | 131 | 0.0% | 29.3 ± 7.6 | 4.3y | 26.3 ± 4.7 | 131 | 0 | 0 | 7 |
| Cuesta et al., 2016 [31] | Ireland | Prospective | 112 | 68.8% | 31 ± 11 | 19 m | NR | 0 | 112 | 8 | |
| Daloglu et al., 2024 [32] | Turkey | Retrospective | 30 | 86.7% | 38.1 ± 14.2 | > 12 m | 26.4 (23.0–27.9) | NR | NR | NR | 7 |
| Dimopoulou et al., 2004 [33] | Greece | Prospective | 34 | 79.4% | 37 ± 16 | 9-60d | NR | 0 | 9 | 25 | 8 |
| Frendl et al., 2017 [34] | Hungary | Prospective | 61 | 75.4% | 44 ± 19 | 6-12 m | NR | 61 | 0 | 0 | 8 |
| Gupta et al., 2021 [35] | India | Prospective | 84 | 66.7% | 40.2 (18–78) | 1d, 7d | NR | 36 | 34 | 14 | 8 |
| Herrmann et al., 2006 [36] | Germany | Cross-sectional | 76 | 69.7% | 39 ± 14 | 5-47 m | 25.8 ± 4.2 | NR | NR | NR | 8 |
| High et al., 2010 [37] | USA | Cross-sectional | 83 | NR | NR | > 1y | NR | NR | NR | NR | 8 |
| Jeong et al., 2010 [38] | Korea | Prospective | 65 | 70.8% | 30.1 | 6 m | NR | NR | NR | NR | 8 |
| Kleindienst et al., 2009 [39] | Germany | Prospective | 71 | 80.3% | 53 ± 20 | 7d, 2y | 25.6 ± 3.9 | 24 | 32 | 15 | 7 |
| Klose et al., 2007 [40] | Denmark | Cross-sectional | 104 | 75.0% | 37 (21–64) | 10-27 m | 24.1 (19.2–30.0) | 44 | 20 | 40 | 9 |
| Kokshoorn et al., 2011 [41] | Netherlands | Cross-sectional | 112 | 67.0% | 48 (19–69) | Mean 4.2y | 26.7 ± 4.8 | 64 | 48 | 9 | |
| Kopczak et al., 2014 [42] | Germany | Cross-sectional | 340 | 75.6% | 40 ± 15 | Median 5-12w | 23.1 ± 3.9 | NR | NR | NR | 7 |
| Krahulik et al., 2010 [43] | Czech Republic | Prospective | 89 | 74.2% | 36 (18–65) | 6 m, 1y | NR | NR | NR | NR | 8 |
| Krewer et al., 2016 [44] | Germany | Prospective | 245 | 67.3% | 50 | > 1 year (1–55 years) | 26.4 ± 5.4 | 51 | 6 | 37 | 8 |
| Kumar et al., 2016 [45] | India | Prospective | 56 | 78.6% | 31.7 ± 7.8 | 0-10d, 6 m, 12 m | NR | 6 | 19 | 31 | 8 |
| Leal-Cerro et al., 2005 [46] | Spain | Cross-sectional | 170 | 58.2% | 29.2 ± 1.1 | > 12 m | 24.7 ± 0.2 | NR | NR | NR | 7 |
| Lee et al., 2021 [47] | USA | Retrospective | 58 | 86.2% | 41 (34–45) | 96 m | 29.9 (26.8–35.0) | 42 | 10 | 6 | 8 |
| Monreau et al., 2012 [48] | France | Prospective | 55 | 83.6% | 36.1 ± 11.3 | 79.2 m | 25.2 (18.0–35.5) | NR | NR | NR | 8 |
| Nemes et al., 2016 [49] | Hungary | Prospective | 63 | 82.5% | 37.5 ± 17 | 1.1y | NR | 0 | 0 | 63 | 7 |
| Nourollahi et al., 2014 [50] | Germany | Retrospective | 97 | 70.1% | 33.5 ± 14.4 | 12-64 m | NR | 34 | 8 | 45 | 9 |
| Park et al., 2010 [51] | Korea | Prospective | 45 | 71.1% | 32.6 ± 17.6 | 16.4 m | NR | 0 | 19 | 26 | 9 |
| Popovic et al., 2004 [52] | Serbia | Cross-sectional | 67 | 58.2% | 37.5 ± 1.8 | 1-22y | 24.8 ± 0.5 | NR | NR | NR | 7 |
| Prodam et al., 2013 [53] | Italy | Retrospective | 54 | 70.4% | 37.1 ± 2.5 | 7.4y | 24.1 ± 1.1 | 0 | 9 | 45 | 9 |
| Salleh et al., 2023 [54] | Malaysia | Prospective | 105 | 79.0% | 36.9 ± 12.4 | 9.8 m | NR | 36 | 21 | 48 | 9 |
| Schneider et al., 2011 [55] | Germany | Cross-sectional | 825 | 73.5% | 45.1 ± 29.1 | 3 m, 5 m | 27.2 ± 9.8 | NR | NR | NR | 8 |
| Schneider et al., 2006 [56] | Germany | Prospective | 78 | 66.7% | 36 ± 15 | 3 m, 12 m | 22.0 ± 3.1 | NR | NR | NR | 8 |
| Sigurjónsson et al., 2022 [57] | Iceland | Prospective | 21 | 81.0% | 34 | 0-6d | NR | 0 | 6 | 15 | 9 |
| Silva et al., 2015 [58] | USA | Retrospective | 165 | 70.9% | 41.6 (18,076) | 40.4 m | NR | 114 | 51 | 8 | |
| Srinivasan et al., 2009 [59] | USA | Cross-sectional | 18 | 66.7% | 31.9 (20–59) | Mean 8 m | 26.7 (22.3–34.8) | NR | NR | NR | 8 |
| Tanriverdi et al., 2013 [60] | Turkey | Prospective | 25 | 80.0% | 36.8 ± 2.1 | 5y | NR | 16 | 5 | 4 | 8 |
| Tanriverdi et al., 2006 [61] | Turkey | Prospective | 52 | 82.7% | 35.9 ± 13.8 | 1d, 12 m | NR | 33 | 8 | 13 | 9 |
| Tanriverdi et al., 2008 [62] | Turkey | Prospective | 30 | 83.3% | 37.2 ± 2.4 | 3y | NR | 19 | 6 | 5 | 8 |
| Tölli et al., 2015 [63] | Sweden | Prospective | 84 | 77.4% | 48.3 ± 16.9 | 10 days | 25.5 ± 4.9 | 0 | 21 | 63 | 8 |
| Tölli et al., 2017 [64] | Sweden | Prospective | 56 | 73.2% | 47.1 ± 16.6 | 10d, 3 m, 6 m, 12 m | 25.6 ± 4.8 | 0 | 12 | 44 | 9 |
| Ulfarsson et al., 2010 [65] | Sweden | Retrospective | 51 | 74.5% | 37.9 (16–64) | 68 m | 24.0 (18–29) | NR | NR | NR | 8 |
| van der Eerden et al., 2010 [66] | Netherlands | Cross-sectional | 107 | 65.4% | 45 (22–63) | 3-30 m | NR | 77 | 30 | 8 | |
| Verma et al., 2021 [67] | India | Cross-sectional | 200 | 87.5% | NR | 3 m- > 5y | NR | 0 | 0 | 200 | 8 |
| Zacharia et al., 2022 [68] | India | Prospective | 66 | 100.0% | 32.9 ± 5.8 | 6-24y | 24.7 ± 4.2 | 0 | 30 | 36 | 9 |
| Zgarljardic et al., 2011 [69] | USA | Retrospective | 138 | 71.0% | 35.8 ± 10.7 | 63.4 m | NR | NR | NR | NR | 8 |
Characteristics of the included studies
Study design
The included studies varied in their design, encompassing prospective 28 (53.8%), retrospective 9 (17.4%), and cross-sectional 15 (28.8%) approaches. Prospective studies such as Agha et al. (2005), Aimaretti et al. (2004, 2005), and others provided longitudinal insights into acute and chronic hypopituitarism following traumatic brain injury (TBI) [18, 20, 21]. Retrospective studies like Srinivasan et al. (2009) and Nourollahi et al. (2014) contributed retrospective data analysis, while cross-sectional studies such as Berg et al. (2010) offered a snapshot of the condition across different time points [25, 50, 59].
Country and population
The geographical distribution of the studies spanned various countries including Ireland, Italy, the UK, the USA, Germany, India, and others. Studies from the mentioned regions reported varying prevalence rates of hypopituitarism post-TBI. Studies like Klose et al. (2007) in Denmark and Tanriverdi et al. (2013, 2006, 2008) in Turkey highlighted the global impact of this condition [40, 60–62].
Patient demographics
The sample sizes across studies ranged widely, from smaller cohorts like Daloglu et al. (2024) with 30 participants to larger studies like Schneider et al. (2011) with 825 participants [32, 55]. The mean age of participants varied from 29.2 years (Leal-Cerro et al., 2005) to 48.3 years (Tölli et al., 2015) [46, 63]. Male proportions in the studies ranged from 0% (Claessen et al., 2024) to 100% (Zacharia et al., 2022), reflecting the gender distribution within each cohort [30, 68].
Quality assessment (NOS)
Quality assessment using the Newcastle–Ottawa Scale (NOS) revealed scores ranging from 7 to 9 with an average of 8.09 across the included studies. The three domains, selection of study groups, comparability of groups, and ascertainment of outcomes, averaged 3.9, 1.39, and 2.8, respectively. Studies like Choudhary et al. (2023) and Tanriverdi et al. (2006, 2008) obtained NOS scores of 9, indicating a high level of methodological quality, while others obtained scores of 7 or 8, reflecting robustness in study design and execution [28, 61, 62].
Quantitative data synthesis
Prevalence of any and multiple axes affection
The prevalence of any and multiple axes affection following traumatic brain injury (TBI) was assessed through a quantitative data synthesis. A random-effects model, along with subgroup analysis and a test for subgroup differences, was used to address heterogeneity. The results are presented in Table 2 and Figs. 2 and 3.
Table 2.
Pooled effect sizes and heterogeneity assessment for the prevalence of any and multiple axes affection outcomes
| Measurement | Duration | Number of datasets | Number of studies | Participants (Total) | Model | Pooled Estimate [95% CI] | Heterogeneity ( |
|---|---|---|---|---|---|---|---|
| Prevalence of any axis affection (Fig. 2) | < 3 months (Fig. 2A) | 14 | 11 | 1156 | Random Effects | 40% [27%; 53%] | Tau^2 = 0.0560; Chi^2 = 410.67, df = 13 (P < 0.01); I^2 = 97% |
| 3–6 months (Fig. 2B) | 6 | 6 | 1283 | Random Effects | 31% [15%; 47%] | Tau^2 = 0.0385; Chi^2 = 170.45, df = 5 (P < 0.01); I^2 = 97% | |
| 6–12 months (Fig. 2C) | 12 | 11 | 1483 | Random Effects | 26% [19%; 33%] | Tau^2 = 0.0120; Chi^2 = 101.04, df = 11 (P < 0.01); I^2 = 89% | |
| > 12 months (Fig. 2D) | 40 | 38 | 4120 | Random Effects | 32% [26%; 38%] | Tau^2 = 0.0347; Chi^2 = 840.82, df = 39 (P < 0.01); I^2 = 95% | |
| Overall | 72 | 52 | 7367 | Random Effects | 33% [28%; 37%] | Tau^2 = 0.0356; Chi^2 = 1533.24, df = 71 (P < 0.01); I^2 = 95% | |
| Prevalence of multiple axes affection (Fig. 3) | < 3 months (Fig. 3A) | 5 | 5 | 528 | Random Effects | 13% [6%; 20%] | Tau^2 = 0.0040; Chi^2 = 16.09, df = 4 (P< 0.01); I^2 = 75% |
| 3–6 months (Fig. 3B) | 3 | 3 | 311 | Random Effects | 7% [4%; 10%] | Tau^2 = 0; Chi^2 = 1.27, df = 2 (P = 0.53); I^2 = 0% | |
| 6–12 months (Fig. 3C) | 6 | 6 | 360 | Random Effects | 7% [3%; 11%] | Tau^2 = 0.0017; Chi^2 = 15.07, df = 5 (P = 0.01); I^2 = 67% | |
| > 12 months (Fig. 3D) | 30 | 28 | 2407 | Random Effects | 7% [5%; 9%] | Tau^2 = 0.0024; Chi^2 = 152.75, df = 29 (P < 0.01); I^2 = 81% | |
| Overall | 44 | 36 | 3606 | Random Effects | 7% [6%; 9%] | Tau^2 = 0.0022; Chi^2 = 212.36, df = 43 (P < 0.01); I^2 = 80% |
Fig. 2.
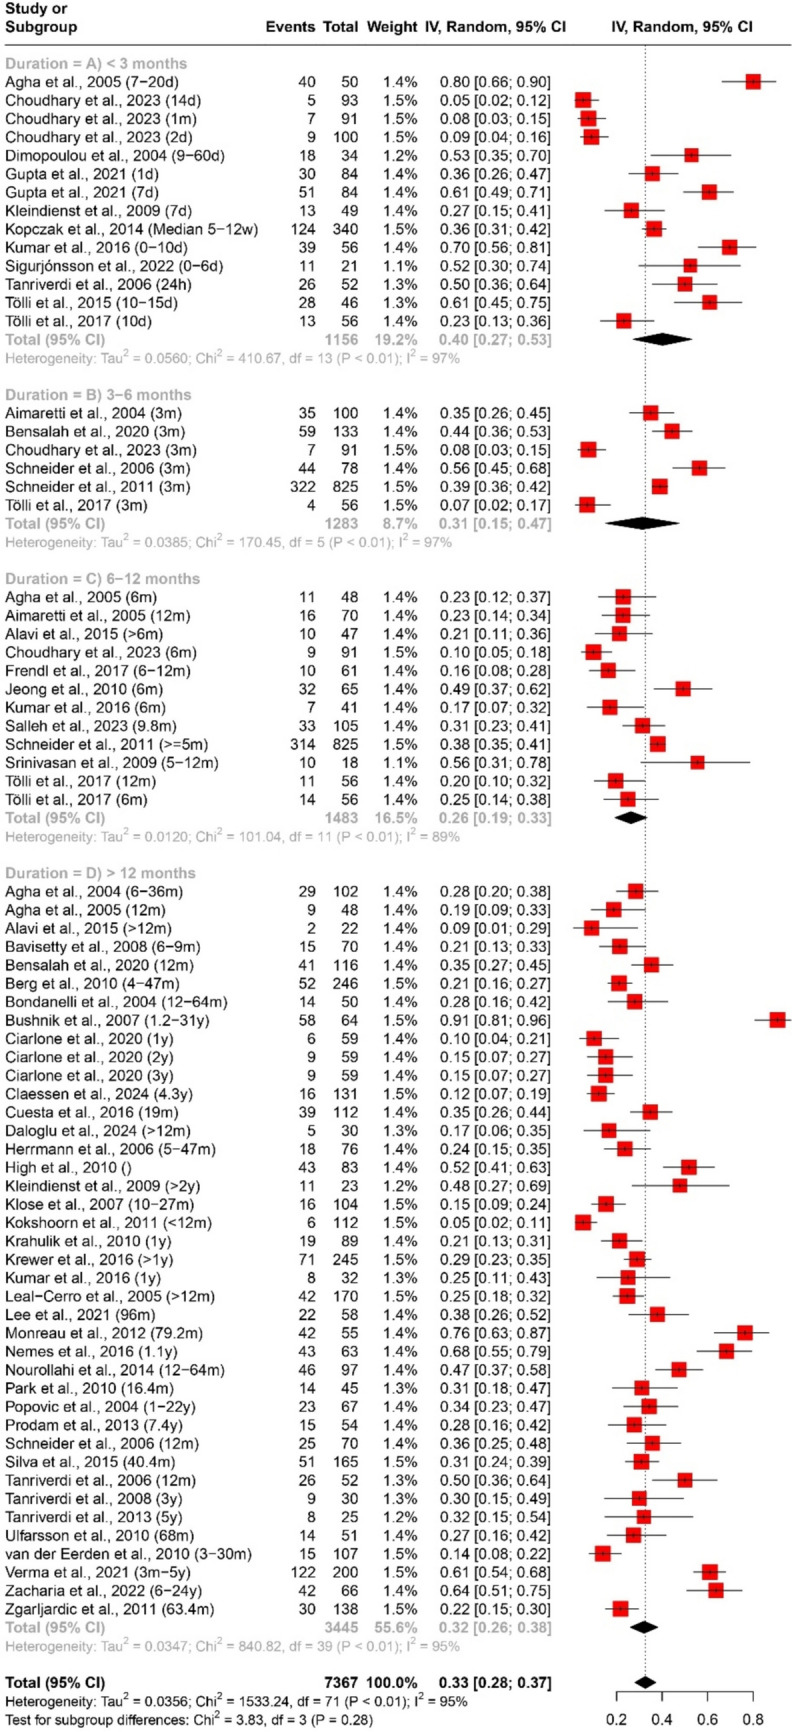
Forest plot of the pooled prevalence of any axis affection (n = 52)
Fig. 3.

Forest plot of the pooled prevalence of multiple axes affection (n = 36)
Prevalence of any axis affection
The analysis included data from 72 datasets and 52 studies, encompassing a total of 7367 participants. The pooled estimate for the prevalence of any axis affection was 33% (95% CI [28%; 37%]), indicating a substantial occurrence of pituitary axis dysfunction post-TBI.
Subgroup analysis based on duration post-TBI revealed varying prevalence rates. Within the first 3 months (< 3 months), the prevalence was highest at 40% (95% CI [27%; 53%]), as illustrated in Fig. 2A. This prevalence gradually decreased over time: 31% (95% CI [15%; 47%]) at 3–6 months (Fig. 2B), 26% (95% CI [19%; 33%]) at 6–12 months (Fig. 2C), and 32% (95% CI [26%; 38%]) beyond 12 months (Fig. 2D). Overall, substantial heterogeneity was observed across all durations, with I^2 values ranging from 89 to 97%.
Prevalence of multiple axes affection
The analysis also investigated the prevalence of multiple axes affection, indicating dysfunction across multiple pituitary axes simultaneously. Across different durations, the overall prevalence of multiple axes affection was 7% (95% CI [6%; 9%]), as depicted in Fig. 3.
Subgroup analysis by duration revealed varying prevalence rates: 13% (95% CI [6%; 20%]) for < 3 months (Fig. 3A), 7% (95% CI [4%; 10%]) for 3–6 months (Fig. 3B), 7% (95% CI [3%; 11%]) for 6–12 months (Fig. 3C), and 7% (95% CI [5%; 9%]) for > 12 months (Fig. 3D). Notably, heterogeneity levels varied across these subgroups, ranging from 0 to 81%.
The observed heterogeneity suggests that factors beyond duration, such as TBI severity, patient demographics, and study methodologies, may contribute to the variability in prevalence rates across different axes affection and timeframes.
Prevalence of specific axes affection
In evaluating the prevalence of specific axes affection following traumatic brain injury (TBI), a quantitative data synthesis was conducted. We used a random-effects model, accompanied by subgroup analysis and a test for subgroup differences to address heterogeneity, as outlined in Table 3 and Figs. 4, 5, 6, 7.
Table 3.
Pooled effect sizes and heterogeneity assessment for the prevalence of specific axes affection outcomes
| Measurement | Duration | Number of datasets | Number of studies | Participants (Total) | Model | Pooled Estimate [95% CI] | Heterogeneity |
|---|---|---|---|---|---|---|---|
| Prevalence of GH deficiency (Fig. 4) | < 3 months (Fig. 4A) | 12 | 9 | 1042 | Random Effects | 18% [11%; 24%] | Tau^2 = 0.0119; Chi^2 = 72.46, df = 11 (P < 0.01); I^2 = 85% |
| 3–6 months (Fig. 4B) | 4 | 4 | 401 | Random Effects | 13% [5%; 22%] | Tau^2 = 0.0070; Chi^2 = 23.75, df = 3 (P < 0.01); I^2 = 87% | |
| 6–12 months (Fig. 4C) | 9 | 8 | 506 | Random Effects | 11% [7%; 16%] | Tau^2 = 0.0037; Chi^2 = 25.2, df = 8 (P < 0.01); I^2 = 68% | |
| > 12 months (Fig. 4D) | 39 | 37 | 3343 | Random Effects | 19% [14%; 24%] | Tau^2 = 0.0206; Chi^2 = 664.61, df = 38 (P < 0.01); I^2 = 94% | |
| Overall | 64 | 46 | 5292 | Random Effects | 18% [14%; 21%] | Tau^2 = 0.0157; Chi^2 = 798.40, df = 63 (P < 0.01); I^2 = 92% | |
| Prevalence of ACTH deficiency (Fig. 5) | < 3 months (Fig. 5A) | 14 | 11 | 1185 | Random Effects | 7% [3%; 11%] | Tau^2 = 0.0042; Chi^2 = 68.74, df = 13 (P < 0.01); I^2 = 81% |
| 3–6 months (Fig. 5B) | 5 | 5 | 457 | Random Effects | 12% [2%; 22%] | Tau^2 = 0.0121; Chi^2 = 61.99, df = 4 (P < 0.01); I^2 = 94% | |
| 6–12 months (Fig. 5C) | 11 | 10 | 658 | Random Effects | 5% [2%; 7%] | Tau^2 = 0.0012; Chi^2 = 39.48, df = 10 (P < 0.01); I^2 = 75% | |
| > 12 months (Fig. 5D) | 36 | 34 | 3076 | Random Effects | 12% [8%; 16%] | Tau^2 = 0.0169; Chi^2 = 459.83, df = 35 (P < 0.01); I^2 = 92% | |
| Overall | 66 | 47 | 5376 | Random Effects | 10% [8%; 13%] | Tau^2 = 0.0115; Chi^2 = 653.48, df = 65 (P< 0.01); I^2 = 90% | |
| Prevalence of pituitary–gonadal axis hormones deficiency (Fig. 6) | < 3 months (Fig. 6A) | 12 | 9 | 1003 | Random Effects | 34% [21%; 47%] | Tau^2 = 0.0523; Chi^2 = 306.71, df = 11 (P < 0.01); I^2 = 96% |
| 3–6 months (Fig. 6B) | 4 | 4 | 2297 | Random Effects | 15% [5%; 26%] | Tau^2 = 0.0109; Chi^2 = 22.48, df = 3 (P < 0.01); I^2 = 87% | |
| 6–12 months (Fig. 6C) | 11 | 10 | 1343 | Random Effects | 13% [8%; 17%] | Tau^2 = 0.0038; Chi^2 = 30.08, df = 10 (P < 0.01); I^2 = 67% | |
| > 12 months (Fig. 6D) | 36 | 34 | 3453 | Random Effects | 10% [8%; 13%] | Tau^2 = 0.0041; Chi^2 = 311.79, df = 35 (P < 0.01); I^2 = 89% | |
| Overall | 63 | 45 | 5093 | Random Effects | 16% [12%; 19%] | Tau^2 = 0.0182; Chi^2 = 991.31, df = 62 (P < 0.01); I^2 = 94% | |
| Prevalence of TSH deficiency (Fig. 7) | < 3 months (Fig. 7A) | 14 | 11 | 1184 | Random Effects | 11% [7%; 15%] | Tau^2 = 0.0051; Chi^2 = 66.35, df = 13 (P< 0.01); I^2 = 80% |
| 3–6 months (Fig. 7B) | 5 | 5 | 457 | RE | 3% [1%; 6%] | Tau^2 = 0.0004; Chi^2 = 8.51, df = 4 (P = 0.07); I^2 = 53% | |
| 6–12 months (Fig. 7C) | 11 | 10 | 658 | RE | 4% [1%; 6%] | Tau^2 = 0.0010; Chi^2 = 28.4, df = 10 (P < 0.01); I^2 = 65% | |
| > 12 months (Fig. 7D) | 31 | 31 | 2763 | RE | 5% [3%; 7%] | Tau^2 = 0.0022; Chi^2 = 160.54, df = 30 (P < 0.01); I^2 = 81% | |
| Overall | 61 | 45 | 5062 | RE | 6% [5%; 7%] | Tau^2 = 0.0024; Chi^2 = 285.98, df = 60 (P < 0.01); I^2 = 79% |
Growth hormone (GH) deficiency
The analysis encompassed 64 datasets and 46 studies, totaling 5292 participants. The pooled estimate for GH deficiency prevalence was 18% (95% CI [14%; 21%]). Subgroup analysis based on duration revealed varying prevalence rates: 18% (95% CI [11%; 24%]) for < 3 months, 13% (95% CI [5%; 22%]) for 3–6 months, 11% (95% CI [7%; 16%]) for 6–12 months, and 19% (95% CI [14%; 24%]) for > 12 months. Heterogeneity levels were substantial, ranging from 68 to 94%, as shown in Fig. 4.
Fig. 4.

Forest plot of the pooled prevalence of growth hormone deficiency (n = 46)
Adrenocorticotropic hormone (ACTH) deficiency
For ACTH deficiency, the analysis included 66 datasets and 47 studies with a total of 5376 participants. The overall prevalence was 10% (95% CI [8%; 13%]). Subgroup analysis by duration showed prevalence rates of 7% (95% CI [3%; 11%]) for < 3 months, 12% (95% CI [2%; 22%]) for 3–6 months, 5% (95% CI [2%; 7%]) for 6–12 months, and 12% (95% CI [8%; 16%]) for > 12 months. Heterogeneity varied substantially across durations, ranging from 75 to 94%, as depicted in Fig. 5.
Fig. 5.

Forest plot of the pooled prevalence of adrenocorticotrophic hormone deficiency (n = 47)
Pituitary–Gonadal axis hormones deficiency
The analysis for pituitary–gonadal axis hormones deficiency involved 63 datasets and 45 studies, with 5093 participants. The pooled prevalence was 16% (95% CI [12%; 19%]). Prevalence rates differed across durations: 34% (95% CI [21%; 47%]) for < 3 months, 15% (95% CI [5%; 26%]) for 3–6 months, 13% (95% CI [8%; 17%]) for 6–12 months, and 10% (95% CI [8%; 13%]) for > 12 months. Notably, heterogeneity was high, ranging from 67 to 96%, as illustrated in Fig. 6.
Fig. 6.

Forest plot of the pooled prevalence of pituitary–gonadal axis hormones deficiency (n = 45)
Thyroid-Stimulating hormone (TSH) deficiency
The analysis of TSH deficiency included 61 datasets and 45 studies, totalling 5062 participants. The overall prevalence was 6% (95% CI [5%; 7%]). Prevalence rates by duration were 11% (95% CI [7%; 15%]) for < 3 months, 3% (95% CI [1%; 6%]) for 3–6 months, 4% (95% CI [1%; 6%]) for 6–12 months, and 5% (95% CI [3%; 7%]) for > 12 months. Heterogeneity ranged from 53 to 81%, as shown in Fig. 7.
Fig. 7.

Forest plot of the pooled prevalence of TSH deficiency (n = 45)
These findings highlight the variability in prevalence rates of specific axes affection post-TBI across different durations, emphasising the need for tailored clinical management strategies based on the duration and type of pituitary axis dysfunction observed.
Discussion
TBI represents a significant public health concern globally, with long-term consequences extending beyond the initial injury [1, 2]. One such consequence that has garnered increasing attention is hypopituitarism, characterised by pituitary axis dysfunction. The pituitary gland plays a crucial role in regulating hormone production, and disruption post-TBI can lead to a range of endocrine abnormalities [6, 7]. However, the prevalence and temporal patterns of pituitary axis dysfunction following TBI have not been comprehensively elucidated, prompting this systematic review and meta-analysis to provide a more nuanced understanding of this complex relationship.
Our meta-analysis synthesised data from 52 studies comprising 7367 participants, shedding light on the prevalence and temporal changes in pituitary axis dysfunction post-TBI. The pooled prevalence of any axis affection was found to be 33% (95% CI [28%; 37%]), indicating a substantial burden of pituitary dysfunction in this population. Subgroup analysis based on duration post-TBI revealed intriguing temporal patterns. Within the first 3 months, the prevalence of any axis affection peaked at 40% (95% CI [27%; 53%]), gradually decreasing over time to 31% (95% CI [15%; 47%]) at 3–6 months, 26% (95% CI [19%; 33%]) at 6–12 months, and 32% (95% CI [26%; 38%]) beyond 12 months. These findings suggest an initial surge in pituitary dysfunction post-TBI, followed by a gradual decline, although prevalence remains elevated even in the chronic phase.
In terms of multiple axes affection, our analysis revealed an overall prevalence of 7% (95% CI [6%; 9%]), indicating that while simultaneous dysfunction across multiple axes is less common, it is still clinically significant. Subgroup analysis by duration showed relatively stable prevalence rates across different timeframes, ranging from 13% (95% CI [6%; 20%]) for < 3 months to 7% (95% CI [5%; 9%]) for > 12 months.
The observed prevalence rates of any axis affection post-TBI align with previous literature documenting a high prevalence of pituitary axis dysfunction in this population [7, 9]. The initial surge in dysfunction within the first 3 months could be attributed to acute TBI-related pathophysiological processes, such as neuroinflammation post-TBI trigering an immune response that aims to clear damaged neuronal cells which can become prolonged or excessive, leading to secondary damage, as well as neuroendocrine disruption due to direct damage to the hypophysis axes. As the post-TBI period progresses, a combination of adaptive mechanisms and therapeutic interventions may contribute to the gradual decline in prevalence, although persistent dysfunction underscores the chronic nature of this complication [70, 71].
Comparing our findings with existing literature, several studies have reported comparable prevalence rates of pituitary dysfunction following TBI. For example, Agha et al. (2005) found a prevalence of 35% for any axis affection, corroborating our overall estimate. Similarly, Aimaretti et al. (2004) [18] and Bondanelli et al. (2004) [26] highlighted the dynamic nature of pituitary dysfunction post-TBI, with prevalence rates mirroring our subgroup analyses based on duration [72, 73].
The stability of multiple axes affection prevalence across different timeframes suggests that while initial dysfunction may involve multiple axes, the chronic phase often manifests as isolated or fewer axis dysfunctions. This observation is supported by studies such as Berg et al. (2010), which demonstrated a shift in pituitary axis involvement over time post-TBI [8, 9, 25].
Notably, specific axes affection showed distinct prevalence rates, with GH deficiency being the most prevalent at 18% (95% CI [14%; 21%]). This finding is consistent with prior research highlighting GH deficiency as a common consequence of TBI-induced hypopituitarism. Studies emphasised the clinical significance of GH deficiency in TBI patients, underscoring the importance of targeted screening and management strategies [10].
Similarly, the prevalence of ACTH deficiency (10%; 95% CI [8%; 13%]), pituitary–gonadal axis hormones deficiency (16%; 95% CI [12%; 19%]), and TSH deficiency (6%; 95% CI [5%; 7%]) provides valuable insights into the spectrum of pituitary axis involvement post-TBI. These findings resonate with previous literature elucidating the multifaceted endocrine disturbances following TBI, as highlighted by studies. Clinical manifestation of the deficiencies is presented in (Table 4) [6, 10].
Table 4.
Clinical Implications of Pituitary Hormone Deficiencies
| Hormonal Deficiency | Symptoms | Clinical Findings |
|---|---|---|
| GH |
- Fatigue - Decreased muscle mass - Increased body fat - Depression or anxiety - Poor quality of life - Reduced exercise capacity |
- Low GH levels on stimulation test - Reduced IGF-1 levels - Decreased lean body mass - Increased fat mass |
| LH/FSH |
- Reduced libido - Infertility - Irregular or absent menstruation (in women) - Erectile dysfunction (in men) - Hot flashes |
- Low testosterone levels (men) - Low estrogen levels (women) - Low or inappropriately normal LH/FSH levels |
| ACTH |
- Fatigue - Weight loss - Nausea, vomiting - Dizziness, especially upon standing - Low blood pressure |
- Low cortisol levels - Low ACTH levels - Hyponatremia (low sodium) - Hypoglycemia (low blood sugar) |
| TSH |
- Fatigue - Weight gain - Cold intolerance - Constipation - Dry skin, hair loss - Depressed mood |
- Low free T4 and T3 levels - Low or inappropriately normal TSH levels - Bradycardia (slow heart rate) - Elevated cholesterol levels |
Gaps and limitations
The study has several limitations. First, potential risk factors related to TBI, particularly those involving clinical manifestations in the acute phase and conditions that mimic hypopituitarism, remain unclear and require further investigation. Second, there is a possibility of publication bias, as studies with positive findings are more likely to be published, which may have distorted the results. Third, by restricting the search to English-language studies, significant research published in other languages may have been excluded, which could impact the generalizability of the findings. Additionally, incomplete reporting in some studies posed challenges for data extraction and quality assessment. Lastly, despite employing a comprehensive search strategy, some relevant recent studies may have been overlooked.
Conclusion
In conclusion, our meta-analysis underscores the high prevalence and dynamic nature of pituitary axis dysfunction following TBI, with distinct temporal patterns and axis-specific variations. Key findings include a pooled prevalence of any pituitary axis affection at 33% (95% CI [28%; 37%]), underscoring the substantial burden of pituitary dysfunction in this population. Growth hormone (GH) deficiency was found to have the highest pooled prevalence among all axes (18% (95% CI [14%; 21%])), with the highest rates observed beyond 12 months post-injury at 19% (95% CI [14%; 24%]). Adrenocorticotropic hormone (ACTH) deficiency showed an overall prevalence of 10% (95% CI [8%; 13%]), with rates peaking at 12% (95% CI [2%; 22%]) during the 3–6 months post-injury. Pituitary–gonadal axis hormone deficiency exhibited a pooled prevalence of 16% (95% CI [12%; 19%]), with a particularly high prevalence within the first three months at 34% (95% CI [21%; 47%]). Thyroid-stimulating hormone (TSH) deficiency had the lowest overall prevalence at 6% (95% CI [5%; 7%]), with a peak within the first three months at 11% (95% CI [7%; 15%]). These findings highlight the persistent and varying nature of pituitary dysfunction following TBI, emphasizing the need for ongoing monitoring and tailored clinical management of affected patients. The variability in prevalence rates raises the question of how extensive is the role played by factors such as TBI severity, patient demographics, and both clinical and paraclinical variables in this inconsistency, highlighting the need for further research to clarify these relationships.
Acknowledgements
Publication of this paper was supported by the University of Medicine and Pharmacy Carol Davila, through the institutional Open access program.
Author contribution
G.A, A.T, and A.R.A wrote and edited the main manuscript text, analyzed the data, and interpreted the data. G.A and A.T prepared figures and tables. M.P.R. Editing and reevaluating the final manuscript. T.M.P and C.T supervised the writing process All authors reviewed the manuscript.
Funding
Not applicable.
Data availability
No datasets were generated or analysed during the current study.
Declarations
Ethical approval
Not applicable.
Competing interests
The authors declare no competing interests.
Footnotes
Publisher's Note
Springer Nature remains neutral with regard to jurisdictional claims in published maps and institutional affiliations.
References
- 1.Faul M, Coronado V (2015) Epidemiology of traumatic brain injury. Handb Clin Neurol 127:3–13 [DOI] [PubMed] [Google Scholar]
- 2.Williamson C, Rajajee V (2023) Traumatic brain injury: epidemiology, classification, and pathophysiology. In: Post TW (ed) UpToDate. UpToDate, Waltham
- 3.Capizzi A, Woo J, Verduzco-Gutierrez M (2020) Traumatic brain injury: an overview of epidemiology, pathophysiology, and medical management. Med Clin 104(2):213–238 [DOI] [PubMed] [Google Scholar]
- 4.McCrea MA, Giacino JT, Barber J et al (2021) Functional outcomes over the first year after moderate to severe traumatic brain injury in the prospective, longitudinal TRACK-TBI study. JAMA Neurol 78(8):982–992. 10.1001/jamaneurol.2021.2043 [DOI] [PMC free article] [PubMed] [Google Scholar]
- 5.Bonow RH, Barber J, Temkin NR, Videtta W, Rondina C, Petroni G, Lujan S, Alanis V, La Fuente G, Lavadenz A, Merida R, Jibaja M, Gonzáles L, Falcao A, Romero R, Dikmen S, Pridgeon J, Chesnut RM, Global Neurotrauma Research Group (2018) The outcome of severe traumatic brain injury in Latin America. World Neurosurg 111:e82–e90. 10.1016/j.wneu.2017.11.171 [DOI] [PMC free article] [PubMed]
- 6.Sav A, Rotondo F, Syro LV, Serna CA, Kovacs K (2019) Pituitary pathology in traumatic brain injury: a review. Pituitary 22:201–211 [DOI] [PubMed] [Google Scholar]
- 7.Glynn N, Agha A (2019) The frequency and the diagnosis of pituitary dysfunction after traumatic brain injury. Pituitary 15(22):249–260 [DOI] [PubMed] [Google Scholar]
- 8.Mele C, Pingue V, Caputo M, Zavattaro M, Pagano L, Prodam F, Nardone A, Aimaretti G, Marzullo P (2021) Neuroinflammation and hypothalamo-pituitary dysfunction: focus of traumatic brain injury. Int J Mol Sci 22(5):2686 [DOI] [PMC free article] [PubMed] [Google Scholar]
- 9.Kałas M, Miksiewicz M, Kowalke A, Siemiński M (2023) Post-Traumatic Hypopituitarism: A Neglected Consequence of Traumatic Brain Injury. Neuroendocrinology 113(6):579–588 [DOI] [PubMed] [Google Scholar]
- 10.Temizkan S, Kelestimur F (2019) A clinical and pathophysiological approach to traumatic brain injury-induced pituitary dysfunction. Pituitary 22:220–228 [DOI] [PubMed] [Google Scholar]
- 11.Klose M, Feldt-Rasmussen U (2018) Chronic endocrine consequences of traumatic brain injury—what is the evidence? Nat Rev Endocrinol 14(1):57–62 [DOI] [PubMed] [Google Scholar]
- 12.Molaie AM, Maguire J (2018) Neuroendocrine abnormalities following traumatic brain injury: an important contributor to neuropsychiatric sequelae. Front Endocrinol 9:329644 [DOI] [PMC free article] [PubMed] [Google Scholar]
- 13.Pavlovic D, Pekic S, Stojanovic M, Popovic V (2019) Traumatic brain injury: neuropathological, neurocognitive and neurobehavioral sequelae. Pituitary 22:270–282 [DOI] [PubMed] [Google Scholar]
- 14.Caputo M, Mele C, Prodam F, Marzullo P, Aimaretti G (2019) Clinical picture and the treatment of TBI-induced hypopituitarism. Pituitary 22:261–269 [DOI] [PubMed] [Google Scholar]
- 15.Page MJ, Moher D, Bossuyt PM, Boutron I, Hoffmann TC, Mulrow CD, Shamseer L, Tetzlaff JM, Akl EA, Brennan SE, Chou R, Glanville J, Grimshaw JM, Hróbjartsson A, Lalu MM, Li T, Loder EW, Mayo-Wilson E, McDonald S, McGuinness LA, Stewart LA, Thomas J, Tricco AC, Welch VA, Whiting P, McKenzie JE (2021) PRISMA 2020 explanation and elaboration: updated guidance and exemplars for reporting systematic reviews. BMJ 372:n160. 10.1136/bmj.n160 [DOI] [PMC free article] [PubMed]
- 16.Peterson J, Welch V, Losos M, Tugwell P (2011) The Newcastle-Ottawa Scale (NOS) for assessing the quality of nonrandomized studies in meta-analyses. Ottawa Hospital Research Institute, Ottawa
- 17.Balduzzi S, Rücker G, Schwarzer G (2019) How to perform a meta-analysis with R: a practical tutorial. BMJ Ment Health 22(4):153–160 [DOI] [PMC free article] [PubMed] [Google Scholar]
- 18.Agha A, Phillips J, O’Kelly P, Tormey W, Thompson CJ (2005) The natural history of post-traumatic hypopituitarism: implications for assessment and treatment. Am J Med 118(12):1416-e1 [DOI] [PubMed] [Google Scholar]
- 19.Agha A, Rogers B, Sherlock M, O’Kelly P, Tormey W, Phillips J, Thompson CJ (2004) Anterior pituitary dysfunction in survivors of traumatic brain injury. J Clin Endocrinol Metab 89(10):4929–36 [DOI] [PubMed] [Google Scholar]
- 20.Aimaretti G, Ambrosio MR, Di Somma C, Fusco A, Cannavò S, Gasperi M, Scaroni C, De Marinis L, Benvenga S, Uberti EC, Lombardi G (2004) Traumatic brain injury and subarachnoid haemorrhage are conditions at high risk for hypopituitarism: screening study at 3 months after the brain injury. Clin Endocrinol 61(3):320–6 [DOI] [PubMed] [Google Scholar]
- 21.Aimaretti G, Ambrosio MR, Di Somma C, Gasperi M, Cannavo S, Scaroni C, Fusco A, Del Monte P, De Menis E, Faustini-Fustini M, Grimaldi F (2005) Residual pituitary function after brain injury-induced hypopituitarism: a prospective 12-month study. J Clin Endocrinol Metab 90(11):6085–92 [DOI] [PubMed] [Google Scholar]
- 22.Alavi SA, Tan CL, Menon DK, Simpson HL, Hutchinson PJ (2016) Incidence of pituitary dysfunction following traumatic brain injury: A prospective study from a regional neurosurgical centre. Br J Neurosurg 30(3):302–6 [DOI] [PubMed] [Google Scholar]
- 23.Bavisetty S, Bavisetty S, McArthur DL, Dusick JR, Wang C, Cohan P, Boscardin WJ, Swerdloff R, Levin H, Chang DJ, Muizelaar JP (2008) Chronic hypopituitarism after traumatic brain injury: risk assessment and relationship to outcome. Neurosurgery 62(5):1080–94 [DOI] [PubMed] [Google Scholar]
- 24.Bensalah M, Donaldson M, Labassen M, Cherfi L, Nebbal M, Haffaf EM, Abdennebi B, Guenane K, Kemali Z, Ould KS (2020) Prevalence of hypopituitarism and quality of life in survivors of post-traumatic brain injury. Endocrinol Diabetes Metab 3(3):e00146 [DOI] [PMC free article] [PubMed] [Google Scholar]
- 25.Berg C, Oeffner A, Schumm-Draeger PM, Badorrek F, Brabant G, Gerbert B, Bornstein S, Zimmermann A, Weber M, Broecker-Preuss M, Mann K (2010) Prevalence of anterior pituitary dysfunction in patients following traumatic brain injury in a German multi-centre screening program. Exp Clin Endocrinol Diabetes 118(02):139–44 [DOI] [PubMed] [Google Scholar]
- 26.Bondanelli M, De Marinis L, Ambrosio MR, Monesi M, Valle D, Zatelli MC, Fusco A, Bianchi A, Farneti M, Degli EC (2004) Occurrence of pituitary dysfunction following traumatic brain injury. J Neurotrauma 21(6):685–96 [DOI] [PubMed] [Google Scholar]
- 27.Bushnik T, Englander J, Katznelson L (2007) Fatigue after TBI: association with neuroendocrine abnormalities. Brain Inj 21(6):559–66 [DOI] [PubMed] [Google Scholar]
- 28.Choudhary A, Sobti S, Dev N, Kulshreshtha B, Sharma R, Kaushik K, Kumar A (2023) Dilemmas in the management of acute TBI: a prospective observational study of anterior pituitary dysfunction and its correlation with outcome. Indian J Neurotrauma 21. 10.1055/s-0043-1769802
- 29.Ciarlone SL, Statz JK, Goodrich JA, Norris JN, Goforth CW, Ahlers ST, Tschiffely AE (2020) Neuroendocrine function and associated mental health outcomes following mild traumatic brain injury in OEF-deployed service members. J Neurosci Res 98(6):1174–87 [DOI] [PubMed] [Google Scholar]
- 30.Eggertsdóttir Claessen LÓ, Kristjánsdóttir H, Jónsdóttir MK, Lund SH, Unnsteinsdóttir Kristensen I, Sigurjónsdóttir HÁ (2024) Pituitary dysfunction following mild traumatic brain injury in female athletes. Endocr Connect 13(2):e230363. 10.1530/EC-23-0363 [DOI] [PMC free article] [PubMed]
- 31.Cuesta M, Hannon MJ, Crowley RK, Behan LA, Tormey W, Rawluk D, Delargy M, Agha A, Thompson CJ (2016) Symptoms of gonadal dysfunction are more predictive of hypopituitarism than nonspecific symptoms in screening for pituitary dysfunction following moderate or severe traumatic brain injury. Clin Endocrinol 84(1):92–8 [DOI] [PubMed] [Google Scholar]
- 32.Daloglu OO, Unal MC, Kemaloglu CA, Bolatturk OF, Ozyazgan I, Tanriverdi F, Coruh AL, Kelestimur F (2024) Evaluation of pituitary function and metabolic parameters in patients with traumatic maxillofacial fractures. J Endocrinol Invest 19:1–9 [DOI] [PMC free article] [PubMed] [Google Scholar]
- 33.Dimopoulou I, Tsagarakis S, Theodorakopoulou M, Douka E, Zervou M, Kouyialis AT, Thalassinos N, Roussos C (2004) Endocrine abnormalities in critical care patients with moderate-to-severe head trauma: incidence, pattern and predisposing factors. Intensive Care Med 30:1051–7 [DOI] [PubMed] [Google Scholar]
- 34.Frendl I, Katko M, Galgoczi E, Boda J, Zsiros N, Nemeti Z, Bereczky Z, Hudak R, Kappelmayer J, Erdei A, Turchanyi B (2017) Plasminogen activator inhibitor type 1: a possible novel biomarker of late pituitary dysfunction after mild traumatic brain injury. J Neurotrauma 34(23):3238–44 [DOI] [PubMed] [Google Scholar]
- 35.Gupta P, Mittal RS, Sharma A, Kumar V (2021) Endocrine Dysfunction in Traumatic Subarachnoid Hemorrhage: A Prospective Study. Indian J Neurosurg 10(03):220–9 [Google Scholar]
- 36.Herrmann BL, Rehder J, Kahlke S, Wiedemayer H, Doerfler A, Ischebeck W, Laumer R, Forsting M, Stolke D, Mann K (2006) Hypopituitarism following severe traumatic brain injury. Exp Clin Endocrinol Diabetes 114(06):316–21 [DOI] [PubMed] [Google Scholar]
- 37.High WM Jr, Briones-Galang M, Clark JA, Gilkison C, Mossberg KA, Zgaljardic DJ, Masel BE, Urban RJ (2010) Effect of growth hormone replacement therapy on cognition after traumatic brain injury. J Neurotrauma 27(9):1565–75 [DOI] [PMC free article] [PubMed] [Google Scholar]
- 38.Jeong JH, Kim YZ, Cho YW, Kim JS (2010) Negative effect of hypopituitarism following brain trauma in patients with diffuse axonal injury. J Neurosurg 113(3):532–8 [DOI] [PubMed] [Google Scholar]
- 39.Kleindienst A, Brabant G, Bock C, Maser-Gluth C, Buchfelder M (2009) Neuroendocrine function following traumatic brain injury and subsequent intensive care treatment: a prospective longitudinal evaluation. J Neurotrauma 26(9):1435–46 [DOI] [PubMed] [Google Scholar]
- 40.Klose M, Juul A, Poulsgaard L, Kosteljanetz M, Brennum J, Feldt-Rasmussen U (2007) Prevalence and predictive factors of post-traumatic hypopituitarism. Clin Endocrinol 67(2):193–201 [DOI] [PubMed] [Google Scholar]
- 41.Kokshoorn NE, Smit JW, Nieuwlaat WA, Tiemensma J, Bisschop PH, Groote Veldman R, Roelfsema F, Franken AA, Wassenaar MJ, Biermasz NR, Romijn JA (2011) Low prevalence of hypopituitarism after traumatic brain injury: a multicenter study. Eur J Endocrinol 165(2):225–31 [DOI] [PubMed] [Google Scholar]
- 42.Kopczak A, Kilimann I, von Rosen F, Krewer C, Schneider HJ, Stalla GK, Schneider M (2014) Screening for hypopituitarism in 509 patients with traumatic brain injury or subarachnoid hemorrhage. J Neurotrauma 31(1):99–107 [DOI] [PubMed] [Google Scholar]
- 43.Krahulik D, Zapletalova J, Frysak Z, Vaverka M (2010) Dysfunction of hypothalamic-hypophysial axis after traumatic brain injury in adults. J Neurosurg 113(3):581–4 [DOI] [PubMed] [Google Scholar]
- 44.Krewer C, Schneider M, Schneider HJ, Kreitschmann-Andermahr I, Buchfelder M, Faust M, Berg C, Wallaschofski H, Renner C, Uhl E, Koenig E (2016) Neuroendocrine disturbances one to five or more years after traumatic brain injury and aneurysmal subarachnoid hemorrhage: data from the German database on hypopituitarism. J Neurotrauma 33(16):1544–53 [DOI] [PubMed] [Google Scholar]
- 45.Kumar KH, Swamy MN, Khan MA (2016) Prevalence of hypothalamo pituitary dysfunction in patients of traumatic brain injury. Indian J Endocrinol Metab 20(6):772–8 [DOI] [PMC free article] [PubMed] [Google Scholar]
- 46.Leal-Cerro A, Flores JM, Rincon M, Murillo F, Pujol M, Garcia-Pesquera F, Dieguez C, Casanueva FF (2005) Prevalence of hypopituitarism and growth hormone deficiency in adults long-term after severe traumatic brain injury. Clin Endocrinol 62(5):525–32 [DOI] [PubMed] [Google Scholar]
- 47.Lee J, Anderson LJ, Migula D, Yuen KC, McPeak L, Garcia JM (2021) Experience of a pituitary clinic for US military veterans with traumatic brain injury. J Endocrine Soc 5(4):bvab005 [DOI] [PMC free article] [PubMed] [Google Scholar]
- 48.Moreau OK, Yollin E, Merlen E, Daveluy W, Rousseaux M (2012) Lasting pituitary hormone deficiency after traumatic brain injury. J Neurotrauma 29(1):81–9 [DOI] [PubMed] [Google Scholar]
- 49.Nemes O, Kovacs N, Szujo S, Bodis B, Bajnok L, Buki A, Doczi T, Czeiter E, Mezosi E (2016) Can early clinical parameters predict post-traumatic pituitary dysfunction in severe traumatic brain injury? Acta Neurochir 158:2347–53 [DOI] [PubMed] [Google Scholar]
- 50.Nourollahi S, Wille J, Weiß V, Wedekind C, Lippert-Grüner M (2014) Quality-of-life in patients with post-traumatic hypopituitarism. Brain Inj 28(11):1425–9 [DOI] [PubMed] [Google Scholar]
- 51.Park KD, Kim DY, Lee JK, Nam HS, Park YG (2010) Anterior pituitary dysfunction in moderate-to-severe chronic traumatic brain injury patients and the influence on functional outcome. Brain Inj 24(11):1330–5 [DOI] [PubMed] [Google Scholar]
- 52.Popovic V, Pekic S, Pavlovic D, Maric N, Jasovic-Gasic M, Djurovic B, Medic-Stojanoska M, Zivkovic V, Stojanovic M, Doknic M, Milic N (2004) Hypopituitarism as a consequence of traumatic brain injury (TBI) and its possible relation with cognitive disabilities and mental distress. J Endocrinol Invest 27:1048–54 [DOI] [PubMed] [Google Scholar]
- 53.Prodam F, Gasco V, Caputo M, Zavattaro M, Pagano L, Marzullo P, Belcastro S, Busti A, Perino C, Grottoli S, Ghigo E (2013) Metabolic alterations in patients who develop traumatic brain injury (TBI)-induced hypopituitarism. Growth Hormon IGF Res 23(4):109–13 [DOI] [PubMed] [Google Scholar]
- 54.Salleh NM, Theophilus SC, Rahman NA, Ghani AR, Abdullah JM, Idris Z, Tan ZH, Kamil NM (2023) Chronic Anterior Pituitary Dysfunction Following Traumatic Head Injury: Prospective Study in Hospital Sultanah Aminah Johor Bahru, Malaysia. The Malaysian journal of medical sciences: MJMS 30(1):107 [DOI] [PMC free article] [PubMed] [Google Scholar]
- 55.Schneider HJ, Schneider M, Kreitschmann-Andermahr I, Tuschy U, Wallaschofski H, Fleck S, Faust M, Renner CI, Kopczak A, Saller B, Buchfelder M (2011) Structured assessment of hypopituitarism after traumatic brain injury and aneurysmal subarachnoid hemorrhage in 1242 patients: the German interdisciplinary database. J Neurotrauma 28(9):1693–8 [DOI] [PubMed] [Google Scholar]
- 56.Schneider HJ, Schneider M, Saller B, Petersenn S, Uhr M, Husemann B, Von Rosen F, Stalla GK (2006) Prevalence of anterior pituitary insufficiency 3 and 12 months after traumatic brain injury. Eur J Endocrinol 154(2):259–65 [DOI] [PubMed] [Google Scholar]
- 57.Sigurjónsson P, Jonasdottir A, Olafsson I, Karason S, Sigthorsson G, Sigurjonsdottir H (2022) Neuroendocrine changes are common during the acute phase of traumatic brain injury and subarachnoid hemorrhage. Med Res Arch 10(9). 10.18103/mra.v10i9.3055
- 58.Silva PP, Bhatnagar S, Herman SD, Zafonte R, Klibanski A, Miller KK, Tritos NA (2015) Predictors of hypopituitarism in patients with traumatic brain injury. J Neurotrauma 32(22):1789–95 [DOI] [PubMed] [Google Scholar]
- 59.Srinivasan L, Roberts B, Bushnik T, Englander J, Spain DA, Steinberg GK, Ren L, Elizabeth Sandel M, Al-Lawati Z, Teraoka J, Hoffman AR (2009) The impact of hypopituitarism on function and performance in subjects with recent history of traumatic brain injury and aneurysmal subarachnoid haemorrhage. Brain Inj 23(7–8):639–48 [DOI] [PubMed] [Google Scholar]
- 60.Tanriverdi F, De Bellis A, Ulutabanca H, Bizzarro A, Sinisi AA, Bellastella G, AmoresanoPaglionico V, Dalla Mora L, Selcuklu A, Unluhizarci K, Casanueva FF (2013) A five year prospective investigation of anterior pituitary function after traumatic brain injury: is hypopituitarism long-term after head trauma associated with autoimmunity? J Neurotrauma 30(16):1426–33 [DOI] [PubMed] [Google Scholar]
- 61.Tanriverdi F, Senyurek H, Unluhizarci K, Selcuklu A, Casanueva FF, Kelestimur F (2006) High risk of hypopituitarism after traumatic brain injury: a prospective investigation of anterior pituitary function in the acute phase and 12 months after trauma. J Clin Endocrinol Metab 91(6):2105–11 [DOI] [PubMed] [Google Scholar]
- 62.Tanriverdi F, Ulutabanca H, Unluhizarci K, Selcuklu A, Casanueva FF, Kelestimur F (2008) Three years prospective investigation of anterior pituitary function after traumatic brain injury: a pilot study. Clin Endocrinol 68(4):573–9 [DOI] [PubMed] [Google Scholar]
- 63.Tölli A, Borg J, Bellander BM, Höybye C (2015) Pituitary function in the acute phase of traumatic brain injury and subarachnoid hemorrhage. Int J Clin Med 6(06):411 [Google Scholar]
- 64.Tölli A, Borg J, Bellander BM, Johansson F, Höybye C (2017) Pituitary function within the first year after traumatic brain injury or subarachnoid haemorrhage. J Endocrinol Invest 40:193–205 [DOI] [PMC free article] [PubMed] [Google Scholar]
- 65.Ulfarsson T, Arnar Gudnason G, Rosén T, Blomstrand C, Stibrant Sunnerhagen K, Lundgren-Nilsson Å, Nilsson M (2013) Pituitary function and functional outcome in adults after severe traumatic brain injury: the long-term perspective. J Neurotrauma 30(4):271–80 [DOI] [PubMed] [Google Scholar]
- 66.van der Eerden AW, Twickler MT, Sweep FC, Beems T, Hendricks HT, Hermus AR, Vos PE (2010) Should anterior pituitary function be tested during follow-up of all patients presenting at the emergency department because of traumatic brain injury? Eur J Endocrinol 162(1):19–28 [DOI] [PubMed] [Google Scholar]
- 67.Verma PK, Rege SV, Jatav G, Kumar A (2021) Assessment of patterns of pituitary dysfunction after severe traumatic brain injury. Int J Surg 5(4):251–4 [Google Scholar]
- 68.Zacharia SS (2022) Endocrine dysfunction in patients with moderate to severe traumatic brain injury 6 months to 2 years after injury. Doctoral Dissertation, Christian Medical College, Vellore
- 69.Zgaljardic DJ, Guttikonda S, Grady JJ, Gilkison CR, Mossberg KA, High WM Jr, Masel BE, Urban RJ (2011) Serum IGF-1 concentrations in a sample of patients with traumatic brain injury as a diagnostic marker of growth hormone secretory response to glucagon stimulation testing. Clin Endocrinol 74(3):365–9 [DOI] [PubMed] [Google Scholar]
- 70.Tan CL, Hutchinson PJ (2019) A neurosurgical approach to traumatic brain injury and post-traumatic hypopituitarism. Pituitary 22:332–337 [DOI] [PMC free article] [PubMed] [Google Scholar]
- 71.Ntali G, Tsagarakis S (2020) Pituitary dysfunction after traumatic brain injury: prevalence and screening strategies. Expert Rev Endocrinol Metab 15(5):341–354 [DOI] [PubMed] [Google Scholar]
- 72.Quinn M, Agha A (2018) Post-traumatic hypopituitarism—who should be screened, when, and how? Front Endocrinol 9:328033 [DOI] [PMC free article] [PubMed] [Google Scholar]
- 73.Tudor RM, Thompson CJ (2019) Posterior pituitary dysfunction following traumatic brain injury. Pituitary 22(3):296–304 [DOI] [PubMed] [Google Scholar]
Associated Data
This section collects any data citations, data availability statements, or supplementary materials included in this article.
Data Availability Statement
No datasets were generated or analysed during the current study.