

Abstract
Background and purpose
The Rasch‐Built Pompe‐Specific Activity (R‐PAct) scale is a patient‐reported outcome measure specifically designed to quantify the effects of Pompe disease on daily life activities, developed for use in Dutch‐ and English‐speaking countries. This study aimed to validate the R‐PAct for use in other countries.
Methods
Four other language versions (German, French, Italian, and Spanish) of the R‐PAct were created and distributed among Pompe patients (≥16 years old) in Germany, France, Spain, Italy, and Switzerland and pooled with data of newly diagnosed patients from Australia, Belgium, Canada, the Netherlands, New Zealand, the USA, and the UK and the original validation cohort (n = 186). The psychometric properties of the scale were assessed by exploratory factor analysis and Rasch analysis.
Results
Data for 520 patients were eligible for analysis. Exploratory factor analysis suggested that the items separated into two domains: Activities of Daily Living and Mobility. Both domains independently displayed adequate Rasch model measurement properties, following the removal of one item ("Are you able to practice a sport?") from the Mobility domain, and can be added together to form a "higher order" factor as well. Differential item functioning (DIF)‐by‐language assessment indicated DIF for several items; however, the impact of accounting for DIF was negligible. We recalibrated the nomogram (raw score interval‐level transformation) for the updated 17‐item R‐PAct scale. The minimal detectable change value was 13.85 for the overall R‐PAct.
Conclusions
After removing one item, the modified‐R‐PAct scale is a valid disease‐specific patient‐reported outcome measure for patients with Pompe disease across multiple countries.
Keywords: daily life activities, patient‐reported outcome measure, Pompe disease, Rasch analysis
INTRODUCTION
Pompe disease (glycogen storage disease type II or acid maltase deficiency, Online Mendelian Inheritance in Man ID: 232300) is a rare inherited metabolic disorder in which deficiency of acid α‐glucosidase leads to lysosomal glycogen accumulation [1]. Late onset or nonclassic Pompe disease can present at any age and is characterized by slowly progressive skeletal and respiratory muscle weakness, often leading to wheelchair and/or ventilator dependency [2, 3]. Consequently, Pompe disease greatly impacts patients' daily life activities and social participation [4]. Currently, follow‐up studies and clinical trials commonly report 6‐min walking test (6MWT) and pulmonary function (forced vital capacity [FVC]) values. However, it is unclear whether changes in 6MWT or FVC impact a patient's daily life activities, or whether they are clinically relevant [5]. Moreover, these tests are impossible to perform for severely affected patients who are wheelchair and/or ventilator dependent.
To better quantify limitations in daily life activities in Pompe disease, we developed the Rasch‐Built Pompe‐Specific Activity (R‐PAct) scale, a patient‐reported outcome measure (PROM) designed using Rasch methods [6, 7]. Rasch methods are based on the probability of a person's response to an item, given the relative difference between the "difficulty" of the item and the "ability" of the patient. Rasch scales also allow ordinal scores to be transformed into interval measures, improving measurement precision and providing a more accurate reflection of disease impact and differences between patients [8, 9].
To improve care for patients with rare diseases, international collaboration is of great importance. Therefore, a European network on Pompe disease, the European Pompe Consortium (EPOC), was established [10]. The EPOC agreed upon a minimal dataset for European data‐sharing purposes, in which the R‐PAct was selected as a useful disease‐specific PROM. However, the R‐PAct has only been validated for use in English‐ and Dutch‐speaking countries. Therefore, this project aims to validate German, French, Spanish, and Italian language versions of the R‐PAct scale, and evaluate its validity across multiple countries, among a larger representative cohort of Pompe disease patients, using Rasch analysis.
MATERIALS AND METHODS
R‐PAct scale
A detailed description of the development of the scale has been previously reported [6]. The R‐PAct scale comprises 18 items, with three response options (0 = unable to perform; 1 = able to perform, but with difficulty; 2 = able to perform, without difficulty).
For the current study, the R‐PAct scale was translated using a standardized process of forward and backward translations by certified translators into German, French, Spanish, and Italian.
Study population
Patients aged ≥16 years were eligible for participation in this study. Patients were approached by their treating physician or by the patient affiliates of patient organizations in the respective countries. The following language versions of the R‐PAct scale were used: German (for Germany and Switzerland), French (France), Spanish (Spain), Italian (Italy), English (Australia, Canada, New Zealand, UK, USA), and Dutch (Belgium, the Netherlands). To maximize the analysis validation sample, new patient data were stacked with data from 186 patients who participated in the initial development of the R‐PAct scale [6]. Only pseudonymized data were used.
Because the original patients completed the preliminary R‐PAct questionnaire (consisting of 49 items with five response options), we selected their responses from the final 18 items of the R‐PAct scale and carried out a post hoc scoring adjustment to transform the five administered response categories into an equivalent of the three response options from the final R‐PAct scale.
Exploratory factor analysis
Exploratory factor analysis (EFA) was undertaken to inform on the factorial structure of the R‐PAct. EFA was carried out using MPlus software version 7.4, using a polychoric correlation matrix and geomin rotation, which accounts for the ordinality of the data structure [11].
Rasch analysis
Rasch Measurement Theory (RMT) provides a way to assess whether it is valid to sum the items of a scale into an overall total score. Moreover, RMT provides a unified framework for several aspects of internal construct validity to be assessed, highlighting any measurement anomalies within an item set. Rasch analysis was completed with RUMM2030 software [12], using the partial‐credit model. All items were assessed for individual fit to the Rasch model, to test whether each item contributes to the overall R‐PAct score (nonsignificant at Bonferroni‐adjusted chi‐squared p‐value, standardized fit‐residuals within ±2.5). Local dependency was assessed to determine whether the response to any item has a direct impact on the response to any other item (Q3 criterion cut point = 0.2 above average residual correlation) [13]. Item response structure was inspected through an assessment of item threshold ordering. Overall scale fit was assessed through the overall chi‐squared fit and scale targeting (relative distribution of item and person locations), with scale reliability assessed with person separation index (PSI) and Cronbach alpha values [14]. Unidimensionality was assessed via a series of t‐tests [15], where evidence of multidimensionality is apparent when independent subsets of items deliver significantly different person estimates, and the lower bound 95% confidence interval (CI) percentage of significantly different t‐tests is >5%.
Differential item functioning (DIF) was assessed by age, sex, disease duration, wheelchair use, use of mechanical ventilation, and language (nonsignificant at Bonferroni‐adjusted analysis of variance p‐value), where language is the most relevant factor relating to cross‐country generalizability. Where DIF was detected, the practical impact of this DIF on the final person estimates was investigated following the procedure outlined by Maritz et al. and Caselli et al. [16, 17]. This process compares the person estimates when DIF is taken into account to when DIF is not taken into account, and an effect size (Cohen d) is calculated. If d < 0.2, the impact of correcting for DIF is considered negligible, and therefore no DIF adjustment is necessary. If d > 0.2, the impact of correcting for DIF is considered to make a difference, and therefore the DIF adjustment should be retained.
When Rasch model assumptions are satisfied, the sufficiency of the raw score allows for a linear, interval‐level transformation of scores [8]. The transformed metric scores will be used to calculate the R‐PAct standard error of measurement, and minimal detectable change (MDC). MDC is a distribution‐based responsiveness indicator based on data from a single time point, indicating a score change value that can be interpreted as a real change (for a person) in the construct that is being measured [18].
Other analyses
Other analyses were performed using SPSS for Windows (v25; SPSS, Chicago, IL, USA). To summarize demographic data, descriptive statistics were used. Data were tested for normality by using the Shapiro–Wilk test. For continuous data, the Mann–Whitney test was used. For categorical data, the chi‐squared test was used. A p‐value of <0.05 was considered statistically significant.
RESULTS
Study population
In total, 525 patients were included. The initial R‐PAct validation cohort (n = 186) comprised patients from the Netherlands (n = 94), USA (n = 65), UK (n = 18), Canada (n = 6), and Belgium (n = 3). The new cohort (n = 339) comprised patients from Germany (n = 93), France (n = 73), the Netherlands (n = 63), Italy (n = 34), Spain (n = 31), Australia (n = 14), Belgium (n = 13), USA (n = 10), Switzerland (n = 5), UK (n = 1), New Zealand (n = 1), and Canada (n = 1). Patient characteristics and language details are summarized in Table 1. In the initial validation cohort, age was lower (p < 0.01), disease duration was shorter (p < 0.001), and more patients were wheelchair dependent (p < 0.001), reflecting a more severely affected patient cohort than the new cohort.
TABLE 1.
Descriptive statistics of the cohort.
| Characteristic | Total, n = 525 | New cohort, n = 339 | Initial validation cohort, n = 186 | p |
|---|---|---|---|---|
| Sex female, n (%) | 277 (53) | 181 (53) | 96 (52) | 0.646 |
| Age, years, mean (SD) a | 51.6 (14.2) | 52.9 (14.8) | 49.5 (13.0) | <0.01* |
| Disease duration, years, mean (SD) b | 16.0 (10.9) | 18.2 (11.3) | 12.3 (9.0) | <0.001* |
| Wheelchair use, n (%) | 147 (28) | 59 (17) | 88 (47) | <0.001* |
| Mechanical ventilation use, n (%) | 224 (43) | 140 (41) | 84 (45) | 0.474 |
| Language, n (%) | ||||
| Dutch | 170 (32) | 76 (22) | 94 (51) | |
| English | 119 (23) | 27 (8) | 92 (49) | |
| German | 98 (19) | 98 (29) | 0 | |
| French | 73 (14) | 73 (22) | 0 | |
| Italian | 34 (6) | 34 (10) | 0 | |
| Spanish | 31 (6) | 31 (9) | 0 | |
Abbreviation: n, number of patients.
n = 506.
n = 481.
Significant at 5% level.
Item analysis
Item 16 ("Are you able to practice a sport?") had the most missing responses (8%), but no items were omitted on this basis. Eighty‐three percent of the questionnaires were filled in completely. We removed two patients due to a high proportion of missing items (>one third missing). Three other patients were removed due to erratic response patterns (e.g., patients reporting that they cannot walk but can run without difficulty), leaving 520 patients for the Rasch analysis.
Rasch analysis and EFA
Initial Rasch analysis of the 18‐item R‐PAct scale indicated scale misfit and multidimensionality, with a series of t‐tests reporting significantly different person estimates in 10.42% (lower CI = 8.5%) of cases (Table 2, "Initial" analysis). An EFA was therefore carried out to investigate how the items partitioned, to inform the progression of the Rasch analysis. The EFA identified that the items loaded into two separate factors (see Table 3), where the EFA factor loadings also aligned with a conceptual separation of the items into the domains of Activities of Daily Living (ADL) and Mobility (root mean square error of approximation = 0.055, comparative fit index = 0.994, Tucker–Lewis index = 0.992). Each domain was then separately assessed within the Rasch analysis.
TABLE 2.
Rasch analysis summary fit details.
| Analysis | Items, n | Valid n (extremes, n) | Item fit residual | Person fit residual | Overall chi‐squared interaction | PSI | Alpha | Unidimensionality t‐tests | SEM a | MDC b | ||||||
|---|---|---|---|---|---|---|---|---|---|---|---|---|---|---|---|---|
| Mean | SD | Mean | SD | Value | df | p | Proportion significant | CI | ||||||||
| Complete item set | Initial | 18 | 499 (21) | −0.63 | 1.7 | −0.27 | 0.85 | 279 | 126 | <0.001 | 0.95 | 0.95 | 10.42% | 8.5%–12.3% | ||
| ADL | ADL1 | 7 | 427 (93) | −1.38 | 1.88 | −0.42 | 0.9 | 126 | 49 | <0.001 | 0.82 | 0.9 | 2.11% | 0%–4.2% | 10.45 | 28.98 |
| Mobility | Mob1 | 11 | 445 (75) | −0.49 | 1.9 | −0.39 | 0.9 | 140 | 77 | <0.001 | 0.91 | 0.94 | 4.72% | 2.7%–6.7% | ||
| Mob2 | 10 | 444 (76) | −0.5 | 1.56 | −0.36 | 0.84 | 87 | 70 | 0.088 | 0.91 | 0.94 | 6.12% | 4.1%–8.2% | 7.60 | 21.07 | |
| Two‐domain superitems | Bifactor | 2 | 432 (21) | −0.2 | 1.52 | −0.46 | 0.79 | 8 | 14 | 0.88 | 0.92 | 0.83 | 6.02% | 4.0%–8.1% | 5.00 | 13.85 |
| Target values | 0 | 1 | 0 | 1 | Nonsignificant | >0.7 | >0.7 | Lower CI < 0.05 | ||||||||
Abbreviations: ADL, Activities of Daily Living; CI, confidence interval; MDC, minimal detectable change; PSI, person separation index; SEM, standard error of measurement.
The SEM is calculated with the formula: , where SD is the standard deviation of the person estimates, and R is the reliability index of the scale (PSI was used, in this case).
MDC is calculated with the formula:
TABLE 3.
EFA loadings and individual item fit.
| Domain | R‐pact item code | Are you able to… | EFA geomin rotated loadings (* significant at 5% level) | From complete Item Set | Rasch item fit statistics | ||||
|---|---|---|---|---|---|---|---|---|---|
| Factor 1 | Factor 2 | PC1 loadings from Rasch PCA of residuals | Location | SE | Fit residual | Chi‐square p | |||
| ADL | 1 | comb your hair? | 0.985* | −0.136 | −0.426 | −1.357 | 0.117 | −1.438 | 0.309 |
| 2 | eat? | 0.697* | 0.002 | −0.187 | −1.84 | 0.124 | 1.559 | 0.000 | |
| 3 | put on your trousers? | 0.836* | 0.092 | −0.406 | 0.211 | 0.108 | −2.351 | 0.009 | |
| 4 | prepare a meal? | 0.939* | −0.041 | −0.552 | 0.245 | 0.1 | −1.994 | 0.096 | |
| 5 | take a shower? | 0.917* | 0.038 | −0.537 | 0.276 | 0.1 | −4.473 | 0.001 | |
| 6 | grab an object above the head? | 0.807* | 0.059 | −0.37 | 0.787 | 0.098 | −0.349 | 0.397 | |
| 8 | turn around in bed? | 0.541* | 0.351* | −0.091 | 1.677 | 0.113 | −0.632 | 0.017 | |
| Mobility | 7 | negotiate obstacles when walking? | 0.467* | 0.487* | 0.086 | −2.086 | 0.111 | −0.969 | 0.144 |
| 9 | walk on uneven ground? | 0.480* | 0.501* | 0.062 | −1.619 | 0.111 | −2.752 | 0.036 | |
| 10 | stand up from a sitting position? | 0.277* | 0.645* | 0.34 | −1.53 | 0.111 | −0.366 | 0.519 | |
| 11 | walk 1 km outside? | 0.374* | 0.542* | 0.065 | −0.768 | 0.098 | 0.5 | 0.134 | |
| 12 | walk 1 flight of stairs? | 0.388* | 0.578* | 0.274 | −0.545 | 0.113 | −2.635 | 0.042 | |
| 13 | bend over and pick up object from the floor? | 0.179* | 0.721* | 0.392 | −0.521 | 0.105 | 1.059 | 0.428 | |
| 14 | walk at a rapid speed? | 0.11 | 0.825* | 0.347 | 1.036 | 0.111 | −1.896 | 0.178 | |
| 15 | perform garden tasks? | 0.193* | 0.732* | 0.167 | 0.502 | 0.113 | 0.829 | 0.379 | |
| 16 | practice a sport? | −0.043 | 0.863* | 0.054 | 1.34 | 0.121 | 3.625 | 0.000 | |
| 17 | squat down and up? | 0 | 0.927* | 0.587 | 1.328 | 0.116 | −1.917 | 0.104 | |
| 18 | run? | −0.091 | 1.034* | 0.281 | 2.863 | 0.15 | −0.865 | 0.423 | |
 : Dominant factor;
  : Strongly cross‐loading items;
  : Fit residual outside +/−2.5 range;
  : Significant at Bonferroni adjusted p = 0.05.
ADL domain
The ADL domain consisted of seven items (see Table 3). The Rasch analysis indicated a degree of overall misfit (p < 0.001; see Table 2). However, there were no issues indicated with response category threshold ordering or unidimensionality of the item set. The scale‐sample targeting was slightly skewed, indicating that, on average, the sample (mean location = 1.87 logits) was generally functioning at higher levels than is being measured by the items within the scale (mean location = 0.00 logits). This mistargeting is shown in the difference between the two measures of reliability, where the PSI (0.82) reflects the skewed targeting, but the Cronbach alpha (0.90) does not.
In terms of individual item fit, item 2 ("Are you able to eat?") displayed an underdiscrimination misfit and item 5 ("Are you able to take a shower?") displayed an overdiscrimination misfit (see Table 3). There was also a borderline dependency indicated between items 3 and 5 ("Are you able to put on trousers" and "Are you able to take a shower?"; Q3 correlation value = 0.011 above the criterion).
Various options were explored to try to improve the fit, including item removal and combining items 3 and 5 into a superitem (testlet) to account for the dependency, but these had little impact on the scale fit statistics compared to the loss of information when removing an item. Although the removal of item 2 does remove the largest misfit anomaly, this item marks the "endpoint" of the scale, as it is the least problematic activity to perform. The removal of item 2 does result in a slightly better fit, but this is tempered by the loss of both clinical and statistical information that results from losing the item. Given the mistargeting of the scale to the sample, it was felt that the benefits of retaining the item outweigh the marginal improvements in scale fit. As a result, all items in the ADL domain were retained.
DIF analysis indicated that there was no uniform DIF by cohort, sex, age group, disease duration, or ventilation. The DIF‐by‐language assessment indicated one significant difference for item 6 ("Are you able to grab an object above the head?"). Post hoc analysis revealed that this item appears to work differently in France/French when compared to the other countries/languages. This DIF was accounted for through an item split, separating item 6 for the French group. Assessment of the impact of this DIF separation showed it to be negligible (mean group difference = 0.006 logits, Cohen d = 0.055), indicating that it is unnecessary.
Additionally, three items indicate DIF by wheelchair. In magnitude order, these are "Are you able to take a shower?", "Are you able to prepare a meal?", and "Are you able to put on your trousers?". All three items are biased toward non‐wheelchair users scoring higher (better outcome) than wheelchair users. This bias appears to make sense conceptually; therefore, the context of any data analysis would determine whether this DIF should be resolved. However, this decision should be taken at the analysis stage rather than the measurement stage [19].
Mobility domain
The mobility domain consisted of 11 items (see Table 3). The Rasch analysis indicated a degree of overall misfit (p < 0.001; see Table 2, "Mob1" analysis). However, no issues were indicated with response category threshold ordering or unidimensionality. Additionally, the scale‐sample targeting was slightly skewed, indicating that, on average, the sample (mean location = −1.65 logits) was generally functioning at lower levels than is being measured by the items within the scale (mean location = 0.00 logits), meaning that the skew was in the opposite direction from, and of a smaller magnitude than, the ADL scale. Again, the skewed targeting is shown in the difference between the two measures of reliability, where the PSI (0.91) reflects the skew, and the Cronbach alpha (0.94) does not, although the reliability level remains high in both.
In terms of individual item fit, item 16 ("Are you able to practice a sport?") displayed a standout underdiscrimination misfit anomaly within the item set. Items 9 ("Are you able to walk on uneven ground?") and 12 ("Are you able to walk one flight of stairs?") both displayed borderline overdiscrimination misfit (see Table 3). There was no local dependency indicated at the Q3 criterion level.
The clear underdiscrimination anomaly suggests that item 16 is measuring something slightly different from the rest of the items in the mobility item set. It was therefore removed from the scale, resulting in a vastly improved overall scale fit (p = 0.088; see Table 2, "Mob2" analysis). At this point, no further large issues were found. However, item 12 still displayed a borderline overdiscrimination (fit residual = −2.63), and a borderline dependency was found between item 11 ("Are you able to walk 1 km outside") and item 14 ("Are you able to walk at rapid speed?"; Q3 correlation value = 0.002 above the criterion).
DIF analysis indicated that there was no uniform DIF by cohort, sex, age group, disease duration, wheelchair, or ventilation. The DIF‐by‐language assessment indicated four significant differences, and post hoc analysis revealed that item 10 ("Are you able to stand up from a sitting position?") operated differently for the Dutch group, item 17 ("Are you able to squat down and up?") operated differently for the French group, item 15 ("Are you able to perform garden tasks?") operated differently for the Spanish group, and item 13 ("Are you able to bend over and pick up an object from the floor?") operated differently for the German group. This language DIF was accounted for through an iterative item‐splitting process, which also confirmed that none of the indicated DIF was artificial. The impact of the DIF separation was then assessed, and the effect size showed that the impact of accounting for the DIF was negligible (mean group difference = 0.001 logits, Cohen d = 0.007), suggesting that the DIF splitting is unnecessary.
R‐PAct higher order factor
The analysis suggests two separate domains are present within the R‐PAct scale. However, when each subscale works independently, it is possible to run a bifactor model to determine whether the subscales can be added together to form a "higher order" factor, where a single total score represents what is common between the subscales [20]. Each domain is treated as a superitem (testlet) within the analysis, which takes account of the within‐domain dependency when considering the total score. Due to technical issues when data are incomplete, only cases with complete data were used for this analysis. Results are summarized in Table 2 ("Bifactor" analysis), where excellent fit is indicated. The latent correlation between the domains was r = 0.99, the common nonerror variance between the domains was A = 0.96, and the series of t‐tests reported significantly different person estimates in 6.02% of cases (lower CI = 4.0%), indicating that the domains do combine to measure a unidimensional higher order factor. When the domains are combined in this way, the scale‐sample targeting is also much better (see Figure 1).
FIGURE 1.
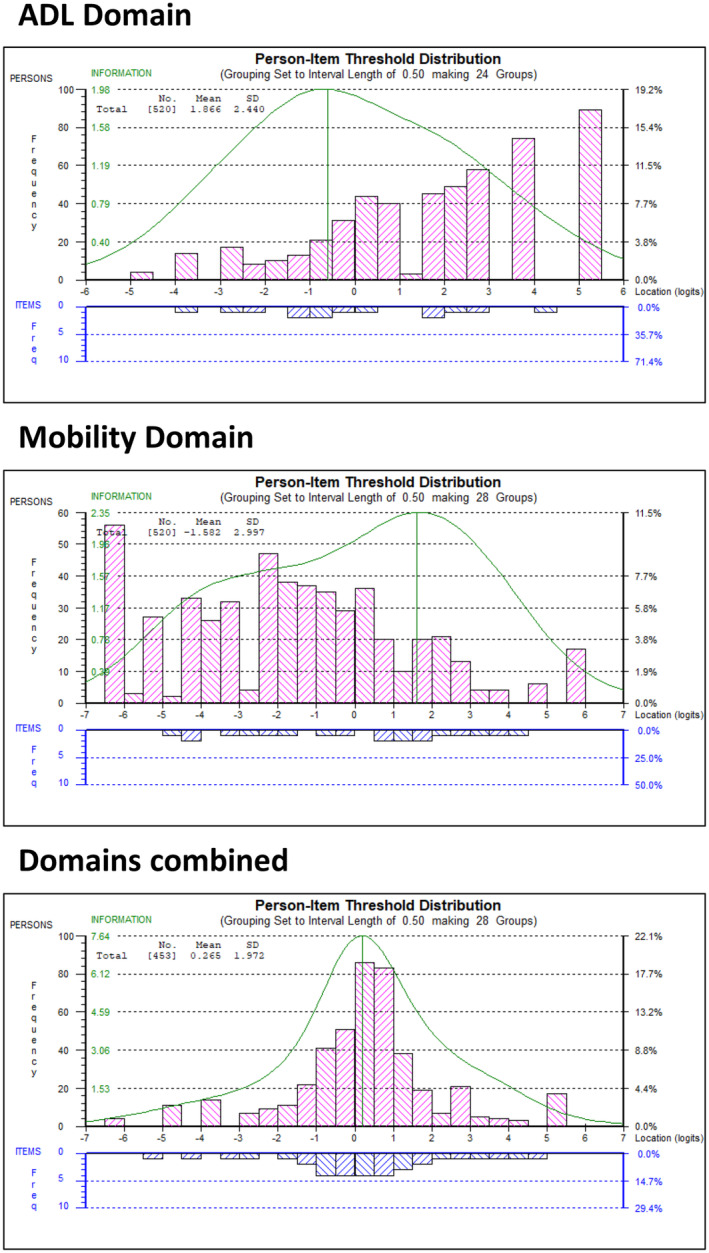
Targeting of separate domains and combined higher order factor. ADL, Activities of Daily Living.
Although this indicates that there is overlap between the ADL and mobility subscales, it should be noted that this "higher order" factor represents what is common between the domains after adjusting for within‐domain dependency. It is therefore recommended that the "higher order" score is used alongside, rather than instead of, the separate domain scores.
Table 4 presents the conversion nomograms for both domains and the "higher order" overall scores. These allow the conversion of R‐PAct summed raw scores to a Rasch person location (in logits) and to a centile metric. The nomogram can only be used when the patient has completed all questions.
TABLE 4.
Raw score to 0–100 metric conversion nomograms.
| ADL | Mobility | Overall (bifactor) | ||||||
|---|---|---|---|---|---|---|---|---|
| Raw score | Logit score | Centile metric | Raw score | Logit score | Centile metric | Raw score | Logit score | Centile metric |
| 0 | −4.72 | 0.00 | 0 | −6.20 | 0.00 | 0 | −6.00 | 0.00 |
| 1 | −3.66 | 10.69 | 1 | −5.24 | 8.13 | 1 | −4.79 | 10.90 |
| 2 | −2.83 | 19.09 | 2 | −4.43 | 14.98 | 2 | −3.80 | 19.75 |
| 3 | −2.18 | 25.69 | 3 | −3.74 | 20.76 | 3 | −3.00 | 26.94 |
| 4 | −1.62 | 31.33 | 4 | −3.10 | 26.17 | 4 | −2.37 | 32.55 |
| 5 | −1.11 | 36.43 | 5 | −2.49 | 31.40 | 5 | −1.90 | 36.79 |
| 6 | −0.63 | 41.32 | 6 | −1.88 | 36.54 | 6 | −1.54 | 40.02 |
| 7 | −0.14 | 46.27 | 7 | −1.28 | 41.59 | 7 | −1.26 | 42.54 |
| 8 | 0.38 | 51.52 | 8 | −0.71 | 46.45 | 8 | −1.03 | 44.59 |
| 9 | 0.95 | 57.23 | 9 | −0.17 | 50.98 | 9 | −0.83 | 46.33 |
| 10 | 1.55 | 63.34 | 10 | 0.32 | 55.14 | 10 | −0.66 | 47.86 |
| 11 | 2.20 | 69.84 | 11 | 0.78 | 58.99 | 11 | −0.51 | 49.25 |
| 12 | 2.93 | 77.24 | 12 | 1.21 | 62.62 | 12 | −0.36 | 50.53 |
| 13 | 3.90 | 87.04 | 13 | 1.62 | 66.14 | 13 | −0.23 | 51.75 |
| 14 | 5.18 | 100.00 | 14 | 2.04 | 69.63 | 14 | −0.10 | 52.91 |
| 15 | 2.46 | 73.19 | 15 | 0.03 | 54.05 | |||
| 16 | 2.90 | 76.94 | 16 | 0.16 | 55.18 | |||
| 17 | 3.39 | 81.05 | 17 | 0.28 | 56.30 | |||
| 18 | 3.95 | 85.81 | 18 | 0.41 | 57.43 | |||
| 19 | 4.68 | 91.99 | 19 | 0.54 | 58.58 | |||
| 20 | 5.63 | 100.00 | 20 | 0.67 | 59.78 | |||
| 21 | 0.81 | 61.04 | ||||||
| 22 | 0.96 | 62.37 | ||||||
| 23 | 1.12 | 63.79 | ||||||
| 24 | 1.29 | 65.34 | ||||||
| 25 | 1.48 | 67.06 | ||||||
| 26 | 1.70 | 68.99 | ||||||
| 27 | 1.94 | 71.17 | ||||||
| 28 | 2.22 | 73.68 | ||||||
| 29 | 2.54 | 76.58 | ||||||
| 30 | 2.92 | 79.90 | ||||||
| 31 | 3.34 | 83.69 | ||||||
| 32 | 3.82 | 87.99 | ||||||
| 33 | 4.42 | 93.34 | ||||||
| 34 | 5.16 | 100.00 | ||||||
Abbreviation: ADL, Activities of Daily Living.
The MDC for the three separate scales is shown in Table 2, with the MDCs reported as 28.98 for the ADL domain, 21.07 for the Mobility domain, and 13.85 for the overall R‐PAct score. All MDCs are given for the 0–100 scale scoring system.
DISCUSSION
Our study shows a robust validation of the R‐PAct scale in a large sample of late onset Pompe disease patients from 12 different countries. We demonstrate that this modified version of the R‐PAct, now termed modified R‐PAct (mR‐PAct), can be used across multiple countries in different language versions. The two domains within the mR‐PAct scale (i.e., ADL and Mobility), can be used separately and/or alongside a single total mR‐PAct score. One item ("Are you able to practice a sport?") was removed as it was a clear misfit anomaly. DIF‐by‐language assessment indicated DIF for several items in both domains. However, the impact of accounting for DIF (by DIF separation) was negligible.
The two domains of the scale can be used separately or together. Overall, the ADL domain comprises more accessible items than the Mobility domain, allowing evaluation of more severely affected patients. This is relevant because these patients are often unable to perform tests used for clinical assessments, for example, walking distance (6MWT), muscle strength, or pulmonary function. Therefore, data on severely affected patients are often lacking in studies. Moreover, clinical evaluation of treatment response in these patients is complicated. Another limitation of the currently used outcome measures is the lack of a defined minimal clinically important difference (MCID), that is, the minimum change score necessary to reflect clinically relevant change over time, specific for Pompe disease patients. For 6MWT and FVC, the MCID has been established for other (chronic) diseases (i.e., pulmonary fibrosis), but applying this to late onset Pompe disease patients has limitations, because the outcome of these measures is dependent on various, often disease‐specific, factors [21, 22]. Because of the cross‐sectional design of our study, the MCID could not yet be established. We calculated the MDC, which indicates the minimum change that can be interpreted as a real change in an individual patient's mR‐PAct 0–100 score. For the separate ADL and Mobility domains, the MDC is relatively high. The MDC is lower for the overall (bifactor) scale, indicating a more sensitive measure. In all cases, a shift toward the end of the scale range is easier to achieve than a shift in the middle of the scale range in terms of the MDC. However, it should be noted that MDC measures should be used cautiously, and that distribution‐based approaches should act only as temporary substitutes, pending the availability of empirically established anchor‐based MCID values [23].
Several PROMs are currently used in research in late onset Pompe disease patients. Commonly used are the Short Form 36 Health Survey, the EuroQol‐5D, and the World Health Organization Quality of Life or adapted versions of these scales [24, 25, 26]. The response options of these scales are based on ordinal (or Likert‐type) choices. In clinical use, 1‐point response change is generally considered equal between different response options (i.e., a change from score 1 to 2 is equivalent to a change from score 3 to 4). However, because the response options are ordinal based, the distance between the response categories is not truly known but probably unequal. Also, when calculating a sum score, every item on the scale gets the same “weight,” although not every item has equal (clinical) relevance. Linearly weighted outcome measures have been developed for neuromuscular disorders in general (e.g., ACTIVLIM) and for specific myopathies and neuropathies (e.g., R‐ODS, DM1‐Activ) [27, 28, 29]. Because different neuromuscular disorders have pronounced patterns of muscle involvement, causing various limitations in daily life activities, non‐disease‐specific scales might miss relevant clinical information for a particular disease. We therefore argue that disease‐specific scales are essential. The Pompe Disease Symptom Scale and the Pompe Disease Impact Scale are recently developed Pompe‐specific scales, but these scales are ordinal based too [30]. Moreover, these scales are multidimensional, addressing a variety of symptoms. In contrast, the mR‐PAct scale specifically captures activity and participation limitations in Pompe disease patients.
The strength of our current study is the exceptionally large sample size of >500 individual patients, considering the rarity of Pompe disease. The large patient number allowed recalibration of the original raw score‐to‐logit score conversion table (nomogram) for use in future studies or clinical trials. The most important limitation is the unequal distribution of patients among the different language/country groups and that some groups were too small for DIF analysis. Also, because all data were collected in Western countries, it is plausible that the scale cannot be used as it is in countries with a different health care system or culture/habits (e.g., third world/developing countries); this should be explored further. Furthermore, the responsiveness of the mR‐PAct scale (i.e., the ability of the scale to detect clinical changes over time), taking into account the concept of MCID, needs further evaluation.
In conclusion, after removing one item, this now 17‐item scale can be used in Pompe disease patients across multiple countries and in different stages of the disease, including severely affected patients.
AUTHOR CONTRIBUTIONS
Harmke A. van Kooten: Conceptualization; formal analysis; writing – original draft; investigation; project administration. Mike C. Horton: Formal analysis; supervision; writing – original draft. Stephan Wenninger: Resources; writing – review and editing. Haris Babačić: Resources; writing – review and editing. Benedikt Schoser: Resources; writing – review and editing. Claire Lefeuvre: Resources; writing – review and editing. Najib Taouagh: Resources; writing – review and editing. Pascal Laforêt: Resources; writing – review and editing. Sonia Segovia: Resources; writing – review and editing. Jordi Díaz‐Manera: Resources; writing – review and editing. Kristl G. Claeys: Resources; writing – review and editing. Tiziana Mongini: Resources; writing – review and editing. Olimpia Musumeci: Resources; writing – review and editing. Antonio Toscano: Resources; writing – review and editing. Thomas Hundsberger: Resources; writing – review and editing. Esther Brusse: Writing – review and editing. Pieter A. van Doorn: Writing – review and editing. Ans T. van der Ploeg: Writing – review and editing. Nadine A. M. E. van der Beek: Writing – original draft; conceptualization; supervision.
FUNDING INFORMATION
This study was financially supported by the Dutch Research Council (Veni grant to N.A.M.E.v.d.B, No. 09150161910230), the Helen Walker Research Grant (to N.A.M.E.v.d.B), an EUR fellowship (to N.A.M.E.v.d.B), Sanofi, and the PPP Allowance made available by Health~Holland, Top Sector Life Sciences & Health, to stimulate public–private partnerships (project No. LSHM16008). Sanofi did not have any influence on the content or design of the study and the drafting and content of the manuscript.
CONFLICT OF INTEREST STATEMENT
K.G.C. has received consulting fees for advisory boards and/or received speaker honoraria from Alnylam, Amicus, ArgenX, Biogen, CSL Behring, Ipsen, Janssen, Lupin, Pfizer, Roche, Sanofi‐Genzyme, and UCB. K.G.C. is Chairholder of the Emil von Behring Chair for Neuromuscular and Neurodegenerative Disorders for CSL Behring. T.H. has received consulting fees and/or travel expenses from Amicus therapeutics, Sanofi Genzyme, Bayer, and NovoCure and has received research grants from Bayer. J.D.‐M. has received payment for consultancy from Sanofi, Astellas, Amicus, and Spark and has received grants from Sanofi and Spark. A.T.v.d.P. has received funding for research and clinical trials and advisory fees from Sanofi‐Genzyme, Amicus Therapeutics, BioMarin, Ultragenyx, Sarepta, Audentes, and Spark Therapeutics, under agreements with Erasmus MC University Medical Center and the relevant industry. N.A.M.E.v.d.B. has received consulting fees for advisory boards and/or received speaker honoraria from Sanofi under agreements with Erasmus MC University Medical Center and the relevant industry. None of the other authors has any conflict of interest to disclose.
ACKNOWLEDGMENTS
We thank the patients for their participation in the study. We also would like to thank Thomas Schaller, Allan Muir, Tiffany House, Raymond Saich, Allyson Lock, and Brad Crittenden from the International Pompe Association for their role in distributing the questionnaires. We thank Prof. I. S. J. Merkies for his expert advice and development of the original scale. This project was performed under the EPOC umbrella. Several of the authors of this publication are members of the European Reference Network for Rare Neuromuscular Diseases (EURO‐NMD).
van Kooten HA, Horton MC, Wenninger S, et al. Improving outcome measures in late onset Pompe disease: Modified Rasch‐Built Pompe‐Specific Activity scale. Eur J Neurol. 2024;31:e16397. doi: 10.1111/ene.16397
European Pompe Consortium study group on outcome measures: H. A. van Kooten, E. Brusse, P. A. van Doorn, A. T. van der Ploeg, N. A. M. E. van der Beek (the Netherlands); S. Wenninger, H. Babačić, B. Schoser, F. Montagnese, N. Gracia Angarita (Germany); C. Lefeuvre, N. Taouagh, P. Laforêt, A. Béhin, C. Tard, E. Campana‐Salort, S. Sacconi, G. Solé, M. Spinazzi, F. Bouhour, F. Bouibede, D. Hamroun, J. Y. Hogrel (France); S. Segovia, J. Díaz‐Manera (Spain); K.G. Claeys (Belgium); T. Mongini, O. Musumeci, A. Toscano (Italy), T. Hundsberger (Switzerland), M. C. Horton (UK).
Contributor Information
Nadine A. M. E. van der Beek, Email: n.beek@erasmusmc.nl.
European Pompe Consortium study group on outcome measures:
H. A van Kooten, E. Brusse, P. A van Doorn, A. T. van der Ploeg, N. A. M. E. van der Beek, S. Wenninger, H. Babačić, B. Schoser, F. Montagnese, N. Gracia Angarita, C. Lefeuvre, N. Taouagh, P. Laforêt, A. Béhin, C. Tard, E. Campana‐Salort, S. Sacconi, G. Solé, M. Spinazzi, F. Bouhour, F. Bouibede, D. Hamroun, J. Y. Hogrel, S. Segovia, J. Díaz‐Manera, K.G. Claeys, T. Mongini, O. Musumeci, A. Toscano, T. Hundsberger, and M. C. Horton
DATA AVAILABILITY STATEMENT
The data that support the findings of this study are available from the corresponding author upon reasonable request.
REFERENCES
- 1. van der Ploeg AT, Reuser AJ. Pompe's disease. Lancet. 2008;372(9646):1342‐1353. [DOI] [PubMed] [Google Scholar]
- 2. Winkel LP, Hagemans ML, van Doorn PA, et al. The natural course of non‐classic Pompe's disease; a review of 225 published cases. J Neurol. 2005;252(8):875‐884. [DOI] [PubMed] [Google Scholar]
- 3. van Capelle CI, van der Meijden JC, van den Hout JM, et al. Childhood Pompe disease: clinical spectrum and genotype in 31 patients. Orphanet J Rare Dis. 2016;11(1):65. [DOI] [PMC free article] [PubMed] [Google Scholar]
- 4. Hagemans ML, Laforêt P, Hop WJ, et al. Impact of late‐onset Pompe disease on participation in daily life activities: evaluation of the Rotterdam Handicap Scale. Neuromuscul Disord. 2007;17(7):537‐543. [DOI] [PubMed] [Google Scholar]
- 5. Lachmann R, Schoser B. The clinical relevance of outcomes used in late‐onset Pompe disease: can we do better? Orphanet J Rare Dis. 2013;8:160. [DOI] [PMC free article] [PubMed] [Google Scholar]
- 6. van der Beek NA, Hagemans ML, van der Ploeg AT, van Doorn PA, Merkies IS. The Rasch‐built Pompe‐Specific Activity (R‐PAct) Scale. Neuromuscul Disord. 2013;23(3):256‐264. [DOI] [PubMed] [Google Scholar]
- 7. Rasch G. Probabilistic Models for some Intelligence and Attainment Tests. Danish Institute for Educational Research; 1960. [Google Scholar]
- 8. Tennant A, Conaghan PG. The Rasch measurement model in rheumatology: what is it and why use it? When should it be applied, and what should one look for in a Rasch paper? Arthritis Rheum. 2007;57(8):1358‐1362. [DOI] [PubMed] [Google Scholar]
- 9. Vanhoutte EK, Hermans MC, Faber CG, et al. Rasch‐ionale for neurologists. J Peripher Nerv Syst. 2015;20(3):260‐268. [DOI] [PubMed] [Google Scholar]
- 10. Schoser B, Laforêt P, Kruijshaar ME, et al. 208th ENMC international workshop: formation of a European network to develop a European data sharing model and treatment guidelines for Pompe disease Naarden, The Netherlands, 26–28 September 2014. Neuromuscul Disord. 2015;25(8):674‐678. [DOI] [PubMed] [Google Scholar]
- 11. Muthén LK, Muthén B. Mplus User's Guide. 8th ed. Muthén & Muthén; 1998. –2017. [Google Scholar]
- 12. Andrich D, Sheridan B, Luo G. Rumm 2030. RUMM Laboratory; 2010. [Google Scholar]
- 13. Christensen KB, Makransky G, Horton M. Critical values for Yen's Q (3): identification of local dependence in the Rasch model using residual correlations. Appl Psychol Meas. 2017;41(3):178‐194. [DOI] [PMC free article] [PubMed] [Google Scholar]
- 14. Hagquist C, Bruce M, Gustavsson JP. Using the Rasch model in nursing research: an introduction and illustrative example. Int J Nurs Stud. 2009;46(3):380‐393. [DOI] [PubMed] [Google Scholar]
- 15. Smith EV Jr. Detecting and evaluating the impact of multidimensionality using item fit statistics and principal component analysis of residuals. J Appl Meas. 2002;3(2):205‐231. [PubMed] [Google Scholar]
- 16. Maritz R, Tennant A, Fellinghauer C, Stucki G, Prodinger B. The functional independence measure 18‐item version can be reported as a unidimensional interval‐scaled metric: internal construct validity revisited. J Rehabil Med. 2019;51(3):193‐200. [DOI] [PubMed] [Google Scholar]
- 17. Caselli S, Kreiner S, Ianes AB, Piperno R, Porta F. The early functional abilities‐revised may bridge the gap between the disorder of consciousness and the functional independence scales: evidence from Rasch analysis. Eur J Phys Rehabil Med. 2022;58(6):805‐817. [DOI] [PMC free article] [PubMed] [Google Scholar]
- 18. Dontje ML, Dall PM, Skelton DA, Gill JMR, Chastin SFM, Seniors USPT. Reliability, minimal detectable change and responsiveness to change: indicators to select the best method to measure sedentary behaviour in older adults in different study designs. PLoS One. 2018;13(4):e0195424. [DOI] [PMC free article] [PubMed] [Google Scholar]
- 19. Hagquist C. Explaining differential item functioning focusing on the crucial role of external information–an example from the measurement of adolescent mental health. BMC Med Res Methodol. 2019;19(1):185. [DOI] [PMC free article] [PubMed] [Google Scholar]
- 20. Andrich D. Components of variance of scales with a bifactor subscale structure from two calculations of α. Educ Meas Issues Pract. 2016;35(4):25‐30. [Google Scholar]
- 21. du Bois RM, Weycker D, Albera C, et al. Forced vital capacity in patients with idiopathic pulmonary fibrosis: test properties and minimal clinically important difference. Am J Respir Crit Care Med. 2011;184(12):1382‐1389. [DOI] [PubMed] [Google Scholar]
- 22. du Bois RM, Weycker D, Albera C, et al. Six‐minute‐walk test in idiopathic pulmonary fibrosis: test validation and minimal clinically important difference. Am J Respir Crit Care Med. 2011;183(9):1231‐1237. [DOI] [PubMed] [Google Scholar]
- 23. Turner D, Schünemann HJ, Griffith LE, et al. The minimal detectable change cannot reliably replace the minimal important difference. J Clin Epidemiol. 2010;63(1):28‐36. [DOI] [PubMed] [Google Scholar]
- 24. Ware JE Jr, Sherbourne CD. The MOS 36‐item short‐form health survey (SF‐36). I. Conceptual framework and item selection. Med Care. 1992;30(6):473‐483. [PubMed] [Google Scholar]
- 25. Brooks R. EuroQol: the current state of play. Health Policy. 1996;37(1):53‐72. [DOI] [PubMed] [Google Scholar]
- 26. The World Health Organization Quality of Life Assessment (WHOQOL): development and general psychometric properties. Soc Sci Med. 1998;46(12):1569‐1585. [DOI] [PubMed] [Google Scholar]
- 27. Vandervelde L, Van den Bergh PY, Goemans N, Thonnard JL. ACTIVLIM: a Rasch‐built measure of activity limitations in children and adults with neuromuscular disorders. Neuromuscul Disord. 2007;17(6):459‐469. [DOI] [PubMed] [Google Scholar]
- 28. van Nes SI, Vanhoutte EK, van Doorn PA, et al. Rasch‐built overall disability scale (R‐ODS) for immune‐mediated peripheral neuropathies. Neurology. 2011;76(4):337‐345. [DOI] [PubMed] [Google Scholar]
- 29. Hermans MC, Faber CG, De Baets MH, de Die‐Smulders CE, Merkies IS. Rasch‐built myotonic dystrophy type 1 activity and participation scale (DM1‐Activ). Neuromuscul Disord. 2010;20(5):310‐318. [DOI] [PubMed] [Google Scholar]
- 30. Hamed A, An Haack K, Gwaltney C, et al. Qualitative interviews to improve patient‐reported outcome measures in late‐onset Pompe disease: the patient perspective. Orphanet J Rare Dis. 2021;16(1):428. [DOI] [PMC free article] [PubMed] [Google Scholar]
Associated Data
This section collects any data citations, data availability statements, or supplementary materials included in this article.
Data Availability Statement
The data that support the findings of this study are available from the corresponding author upon reasonable request.