

Abstract
Background and purpose
Behavioral variant frontotemporal dementia (bvFTD) and primary psychiatric disorders (PPD), such as mood, psychotic, and autism spectrum disorders, share similar clinical characteristics of behavior and social cognition. Better understanding of clinical progression in bvFTD and PPD is essential for adequate disease monitoring and trial design.
Methods
In this longitudinal study (N = 89), patients with bvFTD and PPD with at least one follow‐up assessment were included from the Social Brain Project of the Alzheimer Center Amsterdam. Behavioral change and social cognitive decline were assessed via informant‐rated questionnaires (Cambridge Behavioral Inventory–Revised, Frontal Behavioral Inventory [FBI], Stereotypy Rating Inventory, Frontotemporal Dementia Rating Scale, Revised Self‐Monitoring Scale [RSMS]‐caregiver) and patient assessment (Ekman 60‐Faces Test, RSMS‐patient, Emotional Contagion Scale). Clinical trajectories (median = 1.4 years, interquartile range = 1.0–2.2) were examined using linear mixed models. In a subsample, associations with baseline serum neurofilament light (sNfL) were examined.
Results
At baseline, behavioral and social cognitive symptoms were similar between diagnosis groups, except for poorer emotion recognition in bvFTD. Over time, behavioral symptoms worsened in bvFTD, whereas most measures remained stable and the FBI improved in PPD. Regarding social cognition, emotion recognition and caregiver‐reported socioemotional sensitivity worsened in bvFTD and remained stable in PPD. Patient‐reported social cognitive measures did not change over time. Higher sNfL was associated with faster behavioral change.
Conclusions
Trajectories of behavior and social cognition differentiate bvFTD from PPD, provided that social cognition is not patient‐reported. Therefore, we stress the need to optimize longitudinal social cognitive assessment in bvFTD. sNfL may be a useful prognostic marker of behavioral progression in neuropsychiatric populations.
Keywords: cohort study, disease progression, neuropsychiatric symptoms, outcome measures, social functioning
This longitudinal study (N = 89) revealed distinct trajectories of behavior and social cognition between patients with behavioral variant frontotemporal dementia (bvFTD) and primary psychiatric disorders (PPD). bvFTD showed worsening of symptoms over time, whereas PPD remained stable or improved, with patient‐reported measures detecting no change, highlighting the need to optimize social cognitive assessment methods. Additionally, higher baseline serum neurofilament light levels were associated with faster behavioral decline, suggesting its potential as a prognostic marker in neuropsychiatric populations.
INTRODUCTION
The behavioral variant frontotemporal dementia (bvFTD) is a devastating neurodegenerative disease characterized by prominent changes in behavior and personality [1], challenging early diagnosis, accurate disease monitoring, and appropriate trial design. First, the clinical resemblance between behavioral manifestations seen in bvFTD and primary psychiatric disorders (PPD) poses a major diagnostic dilemma. Several core features of bvFTD, which include the symptoms of apathy, disinhibition, and stereotypy, show considerable overlap with symptoms of major depressive disorder (MDD), bipolar disorder, schizophrenia, and obsessive–compulsive disorder (OCD) [2, 3]. As a consequence, difficulty differentiating bvFTD from PPD results in frequent misdiagnosis, severe diagnostic delay, and inappropriate disease management [4]. Furthermore, the clinical heterogeneity inherent to bvFTD and lack of a validated biological marker tracking underlying neuropathological changes hinder the use of standardized assessment tools and precise detection of progression. A promising clinical feature of bvFTD, social cognitive impairment, is considered to underlie dissocial behaviors and has been well validated for diagnosing bvFTD [3, 5]. However, prominent social cognitive deficits in bvFTD may resemble socioemotional profiles of PPD as well, such as state‐dependent difficulties in emotion recognition in MDD, autism spectrum disorder (ASD), and schizophrenia [6, 7, 8]. Gaining deeper insight in similarities and differences in the clinical phenotypes of bvFTD and PPD is essential for ensuring accurate research and care of these distinct entities.
During disease progression, prevalence and prominence of behavioral symptoms may vary in bvFTD [9]. Several longitudinal studies support a crescendo–decrescendo trajectory of behavior, in which positive symptoms (such as disinhibition and perseverations) increase until intermediate phases, whereas negative symptoms (such as apathy) increase throughout the disease course and dominate severe disease stages of bvFTD [10, 11, 12, 13]. Regarding social cognitive impairment, literature on progression is limited and inconclusive. Results in longitudinal studies on emotion recognition, assessed with the Ekman 60‐Faces Test (EK‐60) [14], are inconsistent [15, 16, 17]. Studies on socioemotional sensitivity, assessed with the informant‐rated Revised Self‐Monitoring Scale (RSMS), yield some promise, showing decline over 1 year in bvFTD [18], but need further longitudinal validation. Among the available biomarkers in bvFTD, neurofilament light (NfL), a marker for neuroaxonal damage detected in cerebrospinal fluid or serum, has shown great potential for differentiating bvFTD from PPD, as well as reflecting disease severity [19, 20]. However, NfL levels may vary in FTD, and slight elevations have been observed in PPD (e.g., bipolar disorder, schizophrenia, and MDD), various neurological disorders, and (healthy) advanced ageing [21, 22]. The prognostic value of NfL on changes of behavior and social cognition has been less defined.
Better understanding of the natural course of behavior and social cognitive disturbances in bvFTD and PPD is essential for tailored care and cohort design. Importantly, accurate evaluation of clinically meaningful disease progression, such as socioemotional changes, is crucial for the assessment of the effectiveness of future clinical trials in bvFTD. In this longitudinal study, we aim to compare trajectories of behavior and social cognition through comprehensive clinical assessment in patients with bvFTD and various PPD. Additionally, we examine the predictive value of serum NfL (sNfL) on behavioral change and social cognitive decline in this neuropsychiatric population.
METHODS
Participants
Eighty‐nine patients were included from the Social Brain Project, between November 2016 and September 2022, in collaboration with the Alzheimer Center Amsterdam of Amsterdam University Medical Center (UMC) and the Old Age Psychiatry Department of GGZ inGeest. The Social Brain Project is an observational and prospective cohort study, designed to examine late onset sociobehavioral change in patients with bvFTD and PPD, presenting with similar clinical symptoms, such as apathy, disinhibition, stereotypy, and/or loss of empathy. Inclusion criteria comprised late onset (>40 years of age) prominent behavioral change indicated by scores on the Frontal Behavioral Inventory (FBI; >11) or the Stereotypy Rating Inventory (SRI; >10). Exclusion criteria encompassed inability to sign the informed consent, alcohol abuse, severe cognitive deterioration indicated by the Mini‐Mental State Examination (MMSE; <18), or a diagnosis other than bvFTD or PPD. The study protocol was approved by the medical ethics committee of the Amsterdam UMC. All patients provided written informed consent to use their data for research purposes. Age, sex, and educational level were assessed, as well as several screening tools for global cognition (MMSE), frontal dysfunction (Frontal Assessment Battery [FAB]), presence of depressive symptoms (Montgomery–Åsberg Depression Rating Scale [MADRS]), and caregiver burden (Zarit Burden Interview [ZBI]). All patients with at least one follow‐up measurement were included (N = 89), of whom 71 patients completed a 1‐year follow‐up (mean = 1.1 ± 0.3 years from baseline) and 56 patients completed a 2‐year follow‐up (mean = 2.5 ± 0.5 years from baseline). Due to the naturalistic character of this study, the number of visits after 1 year was lower in PPD than bvFTD (Χ2 = 7.571 [1], p = 0.006). However, the distribution of total follow‐up visits and follow‐up duration did not differ between diagnosis groups (all p > 0.05).
Diagnostic workup
For diagnostic evaluation at baseline, patients received a standardized dementia screening and additional neuropsychiatric evaluation, including medical history, informant‐based history, neurological and medical examination, neuropsychiatric and neuropsychological investigation, brain magnetic resonance imaging, laboratory tests, and genetic screening (standard dementia panel and additional FTD‐related genes on indication). Anticipating the characteristic loss of insight in patients with bvFTD, multiple informant‐rated clinical questionnaires were administered to informal caregivers (i.e., partners or family members of the patient). In a multidisciplinary consensus meeting, the clinical diagnosis was determined by an expert neurologist and psychiatrist, according to Frontotemporal Dementia Consortium criteria [1] and the Diagnostic and Statistical Manual of Mental Disorders, 5th edition. At follow‐up, clinical assessments were repeated, including neurological, neuropsychiatric, and neuropsychological investigation. The bvFTD group consisted of 63 patients, including 45 patients with probable bvFTD (i.e., cases with frontal and/or anterior temporal atrophy or hypoperfusion on neuroimaging) and 18 patients with definite bvFTD (i.e., carriers of a known pathogenic mutation associated with FTD). The definite bvFTD cases included mutations of C9ORF72 repeat expansion (n = 13), MAPT (n = 1), GRN (n = 1), TARDBP (n = 1), TBK1 (n = 1), and OPTN (n = 1). The PPD group consisted of 26 patients, for whom diagnoses varied between MDD (n = 11), bipolar disorder (n = 3), ASD (n = 6), personality disorder (n = 5), and psychotic disorder (n = 1). From baseline to follow‐up, n = 64 cases (71.9%) did not change diagnosis over time (n = 51 bvFTD, n = 13 PPD) and n = 16 (18%) switched from a postponed diagnosis to a diagnosis group (n = 6 bvFTD, n = 10 PPD). Furthermore, n = 3 (3.4%) switched from possible bvFTD to PPD (n = 1 personality disorder, n = 1 ASD, n = 1 MDD) and n = 6 (6.7%) switched from possible bvFTD to probable bvFTD.
Behavioral assessment
Behavioral symptoms were assessed with four informant‐rated questionnaires. The Cambridge Behavioral Inventory–Revised (CBI‐R) assessed the frequency of a range of behaviors, through 45 items on a 5‐point scale, covering 10 domains (memory and orientation, instrumental activities of daily life, self‐care, abnormal behavior, mood, perception, eating habits, sleep, stereotypical and motor behavior, motivation) [23, 24]. This results in a CBI‐R total score ranging from 0 to 180, with higher scores indicating more behavioral change. Similarly, the FBI assessed the severity of a range of behaviors, through 24 items on a 4‐point scale, resulting in an FBI total score ranging from 0 to 72, with higher scores indicating more behavioral change [25]. Additionally, a FBI positive symptom score (e.g., impulsivity, agitation) and an FBI negative symptom score (e.g., apathy, indifference) were obtained, to investigate more specific behavioral profiles. The SRI was used to rate the frequency and severity of five stereotypic and compulsive behaviors (eating and cooking, roaming, speaking, movements, daily rhythm), resulting in a total score ranging from 0 to 60, with higher scores indicating more behavioral change [26]. The Frontotemporal Dementia Rating Scale (FTD‐FRS) was used to rate the presence of functional dependence and behavioral symptoms through 30 items covering seven domains (behavior, transportation and groceries, domestic tasks, finance, medication, cooking and eating, self‐care and mobility) [27]. The total FRS score was given as a percentage (0%–100%), with a lower percentage indicating more behavioral change. Data availability of longitudinal behavioral measures comprised a total of 103 assessments of the CBI‐R (n = 79 bvFTD, n = 24 PPD), 106 assessments of the FBI (n = 81 bvFTD, n = 25 PPD), 124 assessments of the SRI (n = 94 bvFTD, n = 30 PPD), and 117 assessments of the FTD‐FRS (n = 90 bvFTD, n = 27 PPD), divided over 1‐year and/or 2‐year follow‐up.
Social cognition assessment
Social cognition was assessed in multiple facets, including emotional recognition, socioemotional sensitivity, and emotional susceptibility. Emotion recognition was assessed with the EK‐60, a 60‐item cognitive test in which six basic emotions (happiness, sadness, anger, fear, surprise, disgust) are asked to be identified in male and female faces, with a total score ranging between 0 and 60 [14]. Socioemotional sensitivity was assessed with the RSMS, by the informant (RSMS‐caregiver) and patient (RSMS‐patient) [28, 29, 30]. This 13‐item questionnaire measures an individual's awareness and sensitivity to socioemotional behavior and expressions (such as the ability to understand social cues and adapt one's behavior) on a 6‐point scale, with a total RSMS score ranging from 0 to 65. More specifically, emotional susceptibility was measured with the Emotional Contagion (EC) scale, a self‐rated 15‐item questionnaire that measures physical and psychological reactivity to one's socioemotional surroundings, for example, tears or joyful feelings generated by mimicry [31]. The rating of 15 items on a 4‐point scale within five emotional domains (happiness, love, fear, anger, sadness) results in a total EC score ranging from 0 to 60. For all social cognitive measures, lower scores indicate poorer social cognitive functioning. Data availability of longitudinal social cognition measures comprised a total of 102 assessments of the EK‐60 (n = 74 bvFTD, n = 28 PPD), 94 assessments of the RSMS‐caregiver (n = 73 bvFTD, n = 21 PPD), 78 assessments of the RSMS‐patient (n = 59 bvFTD, n = 19 PPD), and 82 assessments of the EC scale (n = 57 bvFTD, n = 25 PPD), divided over 1‐year and/or 2‐year follow‐up.
NfL analysis
sNfL levels were available for 22 patients (n = 15 bvFTD, n = 7 PDD). Serum was obtained through venipuncture around the time of the baseline visit (mean difference [SD] = 6.55 [8.73] months). After an approximate 10–15‐min centrifugation at 1800–1900 × g (room temperature), serum was distributed in 0.5‐mL aliquots in polypropylene tubes and stored at a temperature of −80°C until dispatch. NfL concentrations were determined using Single Molecular Array (Simoa) technology. Samples underwent centrifugation at 10,000 × g for 5 min to distinguish the debris. For detection of the target protein (NfL), 70 μL of each sample was pipetted, transferred into 96‐well Quanterix plates, adjoined with reagent, and 4× diluted.
Statistical analyses
All statistical analyses were performed in R (v4.2.1., https://www.r‐project.org/, package lme4, package ggplot2) and SPSS (v28, SPSS Statistics for Windows, IBM, Armonk, NY, USA). Assumptions for normality were checked. Differences in baseline characteristics between groups were tested using independent samples t‐test, chi‐square test, and Mann–Whitney U‐test, when appropriate. The Bonferroni method was applied to correct for multiple comparisons in baseline outcome measures (MMSE, FAB, MADRS, ZBI, CBI‐R, FBI, SRI, FTD‐FRS, RSMS‐caregiver, RSMS‐patient, EK‐60, EC, adjusted p‐value = 0.05/12 = 0.0042). Changes over time were assessed with linear mixed‐effects models (LMM). Because patients with bvFTD were significantly older than patients with PPD, LMM analyses were adjusted for age. The model included terms for time (years), diagnosis (bvFTD/PPD), an interaction term of diagnosis*time, and age at baseline. In all models, subject‐specific random intercepts and random slopes with time were assumed based on a priori hypotheses and overall model fit, meaning that the model accounted for individual variation of baseline measure and individual variation of change in outcome measure over time. Because certain genetic forms of bvFTD (e.g., C9ORF72 repeat expansion) are known for typical neuropsychiatric phenotypes and/or progression rates [32], LMM analyses were repeated excluding genetic cases. In additional (LMM) analyses, we tested whether baseline sNfL was predictive of changes over time in behavioral and social cognition measures. The model included terms for time (years), an interaction term of sNfL*time, and covariate adjustment for age at baseline and time difference between venipuncture and baseline measurement. Results are presented with test statistic (df); p‐value and 95% confidence interval (CI); or estimated coefficient (B), standard error (SE), and p‐value. To quantify the magnitude of effect sizes (small = 0.2, medium = 0.5, large = 0.8), standardized coefficients (Cohen d) are presented for significant results. Significance was set at p < 0.05 for all results, except for interaction effects (p < 0.10) [33].
RESULTS
Characteristics
We included 63 patients with bvFTD and 26 patients with PPD (Table 1). Patients with bvFTD were older than patients with PPD (t[87] = 3.28, p < 0.01, 95% CI = 2.1–8.7). There were no differences in distribution of sex and level of educational between diagnosis groups. Patients with bvFTD scored lower on a screener for global cognition (MMSE: U = 840.5, p < 0.01), and patients with PPD scored higher on a screener for depressive symptoms than bvFTD (MADRS: U = 1187.5, p < 0.001). The severity of caregiver burden was comparable between caregivers of patients with bvFTD and PPD (ZBI). Baseline measures for behavioral symptoms (CBI‐R, FBI, SRI, FTD‐FRS) and social cognitive functioning (RSMS‐caregiver, RSMS‐patient, EC scale) did not differ between diagnosis groups, except for lower scores on emotion recognition in the bvFTD group compared to PPD (EK‐60, t[86] = −4.31, p < 0.001, 95% CI = −13.7 to −5.0). The total number of follow‐up visits and follow‐up duration were similar between diagnosis groups.
TABLE 1.
Baseline characteristics of the total sample and diagnosis group differences.
| Characteristic | Total | bvFTD | PPD | p |
|---|---|---|---|---|
| n | 89 (100) | 63 (70.8) | 26 (29.2) | |
| Age, years | 64.2 ± 7.5 | 65.8 ± 6.8 | 60.4 ± 7.7 | <0.01 |
| Sex, female | 30 (33.7) | 24 (38.1) | 6 (23.1) | 0.17 |
| Education, years | 10.9 ± 2.8 | 10.7 ± 2.8 | 11.4 ± 2.8 | 0.27 |
| Global cognition screener, MMSE | 26 [24–28] | 26 [24–28] | 28 [27–29] | <0.01 |
| Frontal cognition screener, FAB | 15 [12–17] | 15 [11–17] | 17 [15–18] | <0.05 |
| Depressive symptoms, MADRS | 6 [2–12] | 4 [2–8] | 14 [8–28] | <0.001 |
| Caregiver burden, ZBI | 33.7 ± 15.4 | 32.2 ± 14.7 | 37.4 ± 16.9 | 0.25 |
| Baseline behavior | ||||
| Functional/behavior, CBI‐R | 52.2 ± 22.3 | 51.0 ± 22.7 | 55.4 ± 21.5 | 0.45 |
| Frontal behavior, FBI | 23.4 ± 9.5 | 22.4 ± 9.6 | 26.7 ± 8.9 | 0.10 |
| Stereotypy, SRI | 10.2 ± 9.6 | 11.1 ± 10.1 | 8.0 ± 7.9 | 0.20 |
| Functional/behavior, FTD‐FRS | 55.8 ± 20.3 | 56.8 ± 20.3 | 53.3 ± 20.6 | 0.51 |
| Baseline social cognition | ||||
| Socioemotional sensitivity, RSMS‐caregiver | 26.4 ± 11.8 | 26.5 ± 12.9 | 26.2 ± 9.1 | 0.92 |
| Socioemotional sensitivity, RSMS‐patient | 34.8 ± 10.1 | 35.7 ± 10.6 | 32.7 ± 9.0 | 0.28 |
| Emotion recognition, EK‐60 | 34.9 ± 10.2 | 32.1 ± 9.7 | 41.5 ± 8.1 | <0.001 |
| Emotional susceptibility, EC scale | 39.9 ± 8.3 | 39.7 ± 8.3 | 40.5 ± 8.4 | 0.74 |
| Longitudinal assessment | ||||
| Total follow‐up visits, n | 127 (47.6) | 95 (50.3) | 32 (41.0) | 0.17 |
| Total follow‐up duration, years | 1.4 [1.0–2.2] | 1.4 [1.0–2.2] | 1.6 [1.0–2.4] | 0.10 |
Note: Data are presented as n (%), mean ± SD, or median [interquartile range]. For CBI‐R, FBI, and SRI, higher scores indicate more behavioral symptoms; for FTD‐FRS, RSMS, EK‐60, and EC scale, lower scores indicate poorer functioning;
Abbreviations: bvFTD, behavioral variant frontotemporal dementia; CBI‐R, Cambridge Behavioral Inventory–Revised (max. 180); EC, Emotional Contagion (max. 60); EK‐60, Ekman 60‐Faces Test (max. 60); FAB, Frontal Assessment Battery (max. 18); FBI, Frontal Behavioral Inventory (max. 72); FTD‐FRS, Frontotemporal Dementia Rating Scale (max. 100); MADRS, Montgomery–Åsberg Depression Rating Scale (max. 60); MMSE, Mini‐Mental State Examination (max. 30); PPD, primary psychiatric disorders; RSMS, Revised Self‐Monitoring Scale (caregiver‐rated or patient‐rated, max. 65); SRI, Stereotypy Rating Inventory (max. 60); ZBI, Zarit Burden Interview (max. 88).
Behavioral change
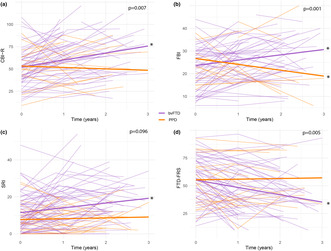
Change in behavioral symptoms over time, as measured with the CBI‐R and the FBI, differed between patients with bvFTD and PPD (CBI‐R interaction: B [SE] = −9.56 [3.39], p < 0.01, Cohen d = −0.43; FBI interaction: B [SE] = −5.05 [1.40], p < 0.001, Cohen d = −0.54; Table 2). Compared to baseline, behavioral symptoms worsened in bvFTD (CBI‐R: B [SE] = 7.88 [1.71], p < 0.001, Cohen d = 0.36; FBI: B [SE] = 2.36 [0.66], p < 0.001, Cohen d = 0.25) and remained stable (CBI‐R) or slightly improved in PPD (FBI: B [SE] = −2.69 [1.23], p < 0.05, Cohen d = −0.29; Figure 1a,b). For the FBI, course of the negative subscale (e.g., apathy, indifference) and the positive subscale (e.g., impulsivity, agitation) differed between diagnosis groups (FBI negative subscale interaction: B [SE] = −3.21 [0.99], p < 0.01, Cohen d = −0.46; FBI positive subscale interaction: B [SE] = −1.38 [0.53], p < 0.05, Cohen d = −0.35). In bvFTD, negative symptoms increased (B [SE] = 1.86 [0.49], p < 0.001, Cohen d = 0.27) and positive symptoms remained stable over time, whereas in PPD negative symptoms remained stable and positive symptoms decreased over time (B [SE] = −1.07 [0.47], p < 0.05, Cohen d = −0.27). Change in stereotypical behavior over time, measured with the SRI, differed between diagnosis groups (SRI interaction: B [SE] = −2.32 [1.36], p < 0.10, Cohen d = −0.22). Compared to baseline, stereotypical behaviors increased in bvFTD (B [SE] = 2.61 [0.70], p < 0.001, Cohen d = 0.25) and remained stable in PPD (Figure 1c). The trajectory of functional dependence and behavioral disturbance, as measured with the FTD‐FRS, differed between patients with bvFTD and PPD (FTD‐FRS interaction: B [SE] = 7.24 [2.50], p < 0.01, Cohen d = 0.35). Over time, daily and behavioral functioning decreased in bvFTD (B [SE] = −6.62 [1.25], p < 0.001, Cohen d = −0.32), whereas PPD patients remained stable (Figure 1d). When analyses were repeated in a sample excluding definite bvFTD (n = 18), results were comparable (Table S1).
TABLE 2.
Progression of behavior and social cognition over time per diagnosis group and difference in trajectories.
| Measure | n | Change in bvFTD | Change in PPD | Different trajectories |
|---|---|---|---|---|
| CBI‐R | 88 | 7.88 (1.71)** | −1.68 (2.93) | −9.56 (3.39)* |
| FBI | 87 | 2.36 (0.66)** | −2.69 (1.23)* | −5.05 (1.40)** |
| FBI positive | 88 | 0.31 (0.24) | −1.07 (0.47)* | −1.38 (0.53)* |
| FBI negative | 89 | 1.86 (0.49)** | −1.35 (0.86) | −3.21 (0.99)* |
| SRI | 89 | 2.61 (0.70)** | 0.29 (1.17) | −2.32 (1.36)*** |
| FTD‐FRS | 88 | −6.62 (1.25)** | 0.61 (2.16) | 7.24 (2.50)* |
| RSMS‐caregiver | 76 | −2.55 (0.83)* | 0.34 (1.46) | 2.89 (1.68)*** |
| RSMS‐patient | 72 | −1.38 (0.95) | 0.74 (1.47) | 2.11 (1.76) |
| EK‐60 | 88 | −2.07 (0.42)** | −0.24 (0.61) | 1.83 (0.75)* |
| EC scale | 74 | −0.95 (0.61) | −0.85 (0.83) | 0.10 (1.03) |
Note: Data are presented as B (standard error). For CBI‐R, FBI, and SRI, higher scores indicate worsening of symptoms; for FTD‐FRS, RSMS, EK‐60, and EC scale, lower scores indicate worsening of symptoms.
Abbreviations: bvFTD, behavioral variant frontotemporal dementia; CBI‐R, Cambridge Behavioral Inventory–Revised; EC, Emotional Contagion; EK‐60, Ekman 60‐Faces Test; FBI, Frontal Behavioral Inventory; FTD‐FRS, Frontotemporal Dementia Rating Scale; PPD, primary psychiatric disorders; RSMS, Revised Self‐Monitoring Scale; SRI, Stereotypy Rating Inventory.
p < 0.05,
p < 0.001,
p < 0.10.
FIGURE 1.
Trajectories of behavioral change in patients with bvFTD versus PDD. bvFTD, behavioral variant frontotemporal dementia; CBI‐R, Cambridge Behavioral Inventory–Revised; FBI, frontal behavioral inventory; FTD‐FRS, Frontotemporal Dementia Rating Scale; PPD, primary psychiatric disorders; SRI, Stereotypy Rating Inventory. For CBI‐R (a), FBI (b), and SRI (c), higher scores indicate worsening of symptoms; for FTD‐FRS (d), lower scores indicate worsening of symptoms, *p < 0.05.
Social cognitive decline
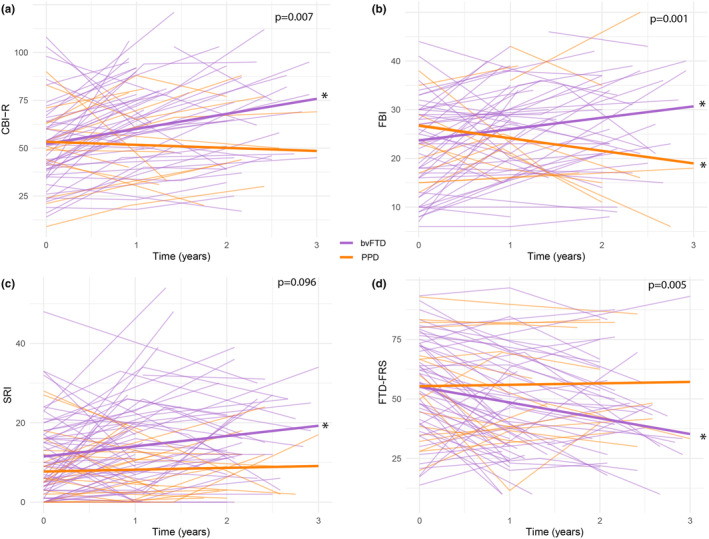
Change in socioemotional sensitivity over time differed between patients with bvFTD and PPD, as measured with RSMS‐caregiver (interaction: B [SE] = 2.89 [1.68], p < 0.10, Cohen d = 0.27) but not with RSMS‐patient (Figure 2a,b). In bvFTD, caregivers reported decreased socioemotional sensitivity over time (B [SE] = −2.55 [0.83], p < 0.01, Cohen d = −0.24), whereas patients did not report change. In PPD, socioemotional sensitivity did not change, according to caregivers and patients. The course of emotion recognition, as measured with the EK‐60, differed between patients with bvFTD and PPD (interaction: B [SE] = 1.83 [0.75], p < 0.05, Cohen d = 0.19). Compared to baseline, emotion recognition decreased in bvFTD (B [SE] = −2.07 [0.42], p < 0.001, Cohen d = −0.22) but remained stable in PPD (Figure 2c). Change in emotional susceptibility, as measured with the EC scale, was similar between diagnosis groups, and did not decline in bvFTD or PPD (Figure 2d). When analyses were repeated in a sample excluding definite bvFTD (n = 18), results were comparable (Table S1).
FIGURE 2.
Trajectories of social cognitive decline in patients with bvFTD versus PDD. bvFTD, behavioral variant frontotemporal dementia; EC, Emotional Contagion; EK‐60, Ekman 60‐Faces Test; PPD, primary psychiatric disorders; RSMS, Revised Self‐Monitoring Scale. For RSMS (a, b), EK‐60 (c), and EC scale (d), lower scores indicate worsening of symptoms, *p < 0.05.
Baseline sNfL in relation to clinical progression
In a subsample of neuropsychiatric patients (n = 15 bvFTD, n = 7 PPD), sNfL levels were associated with rate of behavioral change (Table 3). Higher sNfL levels at baseline were associated with faster increase of behavioral symptoms (CBI‐R: B [SE] = 0.60 [0.2], p < 0.05, Cohen d = 0.52), with a particular increase of negative behavioral symptoms (FBI negative subscale: B [SE] = 0.12 [0.05], p < 0.05, Cohen d = 0.36) and steeper decline of functional dependence and behavioral disturbance (FTD‐FRS: B [SE] = −0.33 [0.16], p < 0.05, Cohen d = −0.29). There were no significant associations between baseline sNfL levels and rate of change on other behavioral or social cognition measures.
TABLE 3.
Associations of baseline sNfL with progression of behavior and social cognition over time.
| Measure | n | sNfL prediction | p |
|---|---|---|---|
| CBI‐R | 22 | 0.60 (0.2) | 0.01* |
| FBI | 21 | 0.12 (0.09) | 0.18 |
| FBI positive | 22 | 0.02 (0.03) | 0.45 |
| FBI negative | 22 | 0.12 (0.05) | 0.03* |
| SRI | 22 | 0.10 (0.08) | 0.18 |
| FTD‐FRS | 22 | −0.33 (0.16) | 0.04* |
| RSMS‐caregiver | 18 | −0.16 (0.09) | 0.10 |
| RSMS‐patient | 17 | 0.06 (0.07) | 0.36 |
| EK‐60 | 22 | −0.02 (0.03) | 0.59 |
| EC scale | 20 | 0.05 (0.04) | 0.23 |
Note: Data are presented as B (standard error). For CBI‐R, FBI, and SRI, higher scores indicate worsening of symptoms; for FTD‐FRS, RSMS, EK‐60, and EC scale, lower scores indicate worsening of symptoms.
Abbreviations: CBI‐R, Cambridge Behavioral Inventory–Revised; EC, Emotional Contagion; EK‐60, Ekman 60‐Faces Test; FBI, Frontal Behavioral Inventory; FTD‐FRS, Frontotemporal Dementia Rating Scale; RSMS, Revised Self‐Monitoring Scale; sNfL, serum neurofilament light; SRI, Stereotypy Rating Inventory.
p < 0.05.
DISCUSSION
In this longitudinal study, we examined clinical progression by means of behavioral change and social cognitive decline in patients with bvFTD and PPD. Trajectories of behavior and social cognition differed between diagnosis groups, except for patient‐reported social cognition. In bvFTD, multiple behavioral symptoms, emotion recognition, and (caregiver‐reported) socioemotional sensitivity worsened over time, whereas patient‐reported social cognitive measures did not change. In PPD, most measures remained stable over time, despite improvement of positive behavioral symptoms. In this neuropsychiatric sample, higher baseline levels of sNfL were associated with a faster rate of behavioral change.
These findings are consistent with longitudinal studies in bvFTD with similar outcome measures, stating an increase of overall behavioral symptoms, including stereotypy (FBI, CBI‐R, FTD‐FRS, SRI) [12, 17, 34, 35, 36, 37], and a decrease of emotion recognition and (caregiver‐reported) socioemotional sensitivity (EK‐60, RSMS‐caregiver) [15, 18]. At the same time, our results contradict studies reporting unchanged stereotypy or emotion recognition over time [16, 17]. At baseline, emotion recognition was the only differential feature between bvFTD and PPD, confirming the robust diagnostic utility and less pronounced prognostic value of the EK‐60 [5]. Several factors are suggested to contribute to current findings on clinical trajectories, highlighting fundamental aspects of bvFTD and PPD. First, it is likely that anosognosia, the lack of insight into and awareness of a patient's own symptoms that is inherent to bvFTD, impeded the reliability of patient‐reported social cognition (RSMS‐patient, EC scale). With this in mind, it is important to distinguish patient‐reported and caregiver‐reported outcome measures in bvFTD, with the most validation for caregiver‐reported questionnaires (e.g., RSMS) and patient‐assessed tests (e.g., EK‐60). Current results stress the need for better operationalization of socioemotional change over time, preferably on multiple levels of social cognition (i.e., social perception, interpretation, and reasoning). Furthermore, our results support the notion that (distinct facets of) behavioral progression may not be linear. We found an increase of negative symptoms and unchanged positive symptoms in bvFTD, in line with studies reporting dominating negative symptoms (e.g., apathy) over time [10, 11, 12, 13]. Although the sum of behaviors (total scores of CBI‐R, FBI, and FTD‐FRS) showed a clear decline in our bvFTD sample, clinical trials should account for longitudinal interbehavioral fluctuations when interpreting these outcome measures. Observations of the PPD group showed unchanged or improved symptoms over time, which may reflect differential responses to psychiatric treatments. Effective disease management in PPD, by means of psychotherapy and/or psychopharmacology, intended to modify clinical course, may explain the decrease of positive behavioral symptoms in the current PPD sample. Although behavioral disturbances are known to be multifactorial, in a broader context, these results might suggest that certain positive behaviors are state rather than trait in PPD. However, with regard to interpretation of PPD trajectories, one should bear in mind that current measures, such as the FTD‐FRS, are most suitable for bvFTD, not PPD. Development of outcome measures that are (equally) suitable for clinical evaluation of both entities may improve precise comparison of progression.
Regarding the prognostic value of sNfL, our findings are in line with studies associating (serum or cerebrospinal fluid) NfL with several indicators of disease severity in FTD, such as regional brain atrophy and decline on functional or cognitive screeners (Clinical Dementia Rating [CDR]–Frontotemporal Lobar Degeneration, CDR, FAB) [17, 20, 38, 39]. Although sNfL was not associated with decline of the FBI total score and SRI, similar to one previous study [17], we do find associations with other robust behavioral measures (CBI‐R, FTD‐FRS) and the negative subscale of FBI. Another study reported a comparable lack of association between NfL and social changes, using the Social Norms Questionnaire [39], but further investigation with (optimized) social cognitive measures is needed. Although not disease‐specific, sNfL may be a useful prognostic marker, at least of behavioral progression, in neuropsychiatric populations.
In this study, there are limitations to consider. First, current the PPD sample was relatively small and diverse, which may have influenced results on differential diagnostic ability. Yet, this sample represents clinical practice well, heightening general applicability. Second, the use of patient‐reported outcomes might be unreliable for detection of deficits in social cognition, a construct encompassing the reflection of one's self in relation to others. Lastly, current follow‐up time may be too short to record change in certain symptoms, and data over a more extensive period of time may further elucidate progression profiles. However, this is one of the first longitudinal studies comparing clinical progression of bvFTD and PPD, using an extensive battery of (bvFTD‐specific) behavioral questionnaires and socioemotional assessment. In this unique neuropsychiatric sample, representing various causes of late onset behavioral change, diagnostic certainty is notably high, due to an extensive (multidisciplinary) diagnostic workup and evaluation of an expert neurologist and psychiatrist. Our analyses of the prognostic value of baseline sNfL contribute to current neuropsychiatric literature as one of the few studies associating NfL to specific measures of behavior and social cognition. Future research should focus on larger samples of various PPD and bvFTD subtypes, allowing separate analyses of major PPD diagnoses and genetic and sporadic bvFTD subtypes, as well as adjustment of potential confounding factors, such as body mass index, in sNfL associations [40]. In addition, inclusion of more validated and sensitive (caregiver‐reported) social cognition outcome measures and extended follow‐up time (>5 years) may enhance the robustness and generalizability of these findings.
Concluding, behavioral trajectories differed between bvFTD and PPD, whereas differences in social cognition trajectories were limited to emotion recognition (EK‐60) and caregiver‐reported socioemotional sensitivity (RSMS‐caregiver). Importantly, current operationalization of social cognition, using two patient‐reported outcome measures (RSMS‐patient, EC scale), seemed insufficient to detect change in bvFTD. In light of potential endpoints for clinical trials, we stress the need to optimize longitudinal social cognitive assessment through more comprehensive, caregiver‐reported and patient‐assessed, proxies of socioemotional changes.
AUTHOR CONTRIBUTIONS
Jay L. P. Fieldhouse: Conceptualization; methodology; data curation; investigation; formal analysis; visualization; project administration; writing – review and editing; writing – original draft. Marie‐Paule E. van Engelen: Conceptualization; methodology; formal analysis; investigation; data curation; writing – review and editing. Dédé Handgraaf: Writing – review and editing; project administration; data curation; investigation. Sterre C. M. de Boer: Writing – review and editing; investigation. Jochum J. van't Hooft: Writing – review and editing; visualization; investigation. Sigfried N. T. M. Schouws: Writing – review and editing; investigation. Daniël van Grootheest: Writing – review and editing. Cora Kerssens: Writing – review and editing. Flora H. Duits: Writing – review and editing. Argonde C. van Harten: Writing – review and editing. Mardien L. Oudega: Writing – review and editing; supervision; conceptualization; methodology. Everard G. B. Vijverberg: Supervision; writing – review and editing; conceptualization; methodology. Yolande A. L. Pijnenburg: Supervision; writing – review and editing; funding acquisition; conceptualization; methodology.
CONFLICT OF INTEREST STATEMENT
The authors report no potential conflict of interest.
CONSENT
All human subjects provided informed consent.
Supporting information
Table S1.
ACKNOWLEDGMENTS
Research of Alzheimer Center Amsterdam is part of the neurodegeneration research program of Amsterdam Neuroscience. Alzheimer Center Amsterdam is supported by Stichting Alzheimer Nederland and Stichting Steun Alzheimercentrum Amsterdam. Y.A.L.P. received funding from Stichting Dioraphte, which had no role in the design, practice, or analysis of this study.
Fieldhouse JLP, van Engelen M‐P, Handgraaf D, et al. Trajectories of behavior and social cognition in behavioral variant frontotemporal dementia and primary psychiatric disorders: A call for better operationalization of socioemotional changes. Eur J Neurol. 2024;31:e16426. doi: 10.1111/ene.16426
DATA AVAILABILITY STATEMENT
Data are available upon reasonable request.
REFERENCES
- 1. Rascovsky K, Hodges JR, Knopman D, et al. Sensitivity of revised diagnostic criteria for the behavioural variant of frontotemporal dementia. Brain. 2011;134(Pt 9):2456‐2477. [DOI] [PMC free article] [PubMed] [Google Scholar]
- 2. Pose M, Cetkovich M, Gleichgerrcht E, Ibáñez A, Torralva T, Manes F. The overlap of symptomatic dimensions between frontotemporal dementia and several psychiatric disorders that appear in late adulthood. Int Rev Psychiatry. 2013;25(2):159‐167. [DOI] [PubMed] [Google Scholar]
- 3. Ducharme S, Dols A, Laforce R, et al. Recommendations to distinguish behavioural variant frontotemporal dementia from psychiatric disorders. Brain. 2020;143:1632‐1650. [DOI] [PMC free article] [PubMed] [Google Scholar]
- 4. Woolley JD, Khan BK, Murthy NK, Miller BL, Rankin KP. The diagnostic challenge of psychiatric symptoms in neurodegenerative disease: rates of and risk factors for prior psychiatric diagnosis in patients with early neurodegenerative disease. J Clin Psychiatry. 2011;72(2):126‐133. [DOI] [PMC free article] [PubMed] [Google Scholar]
- 5. Gossink F, Schouws S, Krudop W, et al. Social cognition differentiates behavioral variant frontotemporal dementia from other neurodegenerative diseases and psychiatric disorders. Am J Geriatr Psychiatry. 2018;26(5):1545‐7214. [DOI] [PubMed] [Google Scholar]
- 6. Dalili MN, Penton‐Voak IS, Harmer CJ, Munafò MR. Meta‐analysis of emotion recognition deficits in major depressive disorder. Psychol Med. 2015;45(6):1135‐1144. [DOI] [PMC free article] [PubMed] [Google Scholar]
- 7. Kennedy DP, Adolphs R. Perception of emotions from facial expressions in high‐functioning adults with autism. Neuropsychologia. 2012;50(14):3313‐3319. [DOI] [PMC free article] [PubMed] [Google Scholar]
- 8. Schneider F, Gur RC, Koch K, et al. Impairment in the specificity of emotion processing in schizophrenia. Am J Psychiatry. 2006;163(3):442‐447. [DOI] [PubMed] [Google Scholar]
- 9. Diehl‐Schmid J, Pohl C, Perneczky R, Förstl H, Kurz A. Behavioral disturbances in the course of frontotemporal dementia. Dement Geriatr Cogn Disord. 2006;22(4):352‐357. [DOI] [PubMed] [Google Scholar]
- 10. Chow TW, Fridhandler JD, Binns MA, et al. Trajectories of behavioral disturbance in dementia. J Alzheimers Dis. 2012;31(1):143‐149. [DOI] [PMC free article] [PubMed] [Google Scholar]
- 11. Cosseddu M, Benussi A, Gazzina S, et al. Progression of behavioural disturbances across frontotemporal dementia: a longitudinal observational study. Eur J Neurol. 2019;27:265‐272. [DOI] [PubMed] [Google Scholar]
- 12. O'Connor CM, Clemson L, Hornberger M, et al. Longitudinal change in everyday function and behavioral symptoms in frontotemporal dementia. Neurol Clin Pract. 2016;6(5):419‐428. [DOI] [PMC free article] [PubMed] [Google Scholar]
- 13. Borges LG, Rademaker AW, Bigio EH, Mesulam MM, Weintraub S. Apathy and disinhibition related to neuropathology in amnestic versus behavioral dementias. Am J Alzheimers Dis Other Dement. 2019;34(5):337‐343. [DOI] [PMC free article] [PubMed] [Google Scholar]
- 14. Aw Y et al. Facial Expressions of Emotion: Stimuli and Tests (FEEST). Thames Valley Test Company (TVTC); 2002. [Google Scholar]
- 15. Kumfor F, Irish M, Leyton C, et al. Tracking the progression of social cognition in neurodegenerative disorders. J Neurol Neurosurg Psychiatry. 2014;85(10):1076‐1083. [DOI] [PubMed] [Google Scholar]
- 16. Lavenu I, Pasquier F. Perception of emotion on faces in frontotemporal dementia and Alzheimer's disease: a longitudinal study. Dement Geriatr Cogn Disord. 2005;19(1):37‐41. [DOI] [PubMed] [Google Scholar]
- 17. Reus LM, Vijverberg EGB, Tijms BM, et al. Disease trajectories in behavioural variant frontotemporal dementia, primary psychiatric and other neurodegenerative disorders presenting with behavioural change. J Psychiatr Res. 2018;104:183‐191. [DOI] [PubMed] [Google Scholar]
- 18. Toller G, Ranasinghe K, Cobigo Y, et al. Revised self‐monitoring scale: a potential endpoint for frontotemporal dementia clinical trials. Neurology. 2020;94(22):e2384‐e2395. [DOI] [PMC free article] [PubMed] [Google Scholar]
- 19. Katisko K, Cajanus A, Jääskeläinen O, et al. Serum neurofilament light chain is a discriminative biomarker between frontotemporal lobar degeneration and primary psychiatric disorders. J Neurol. 2020;267(1):162‐167. [DOI] [PMC free article] [PubMed] [Google Scholar]
- 20. Rohrer JD, Woollacott IOC, Dick KM, et al. Serum neurofilament light chain protein is a measure of disease intensity in frontotemporal dementia. Neurology. 2016;87(13):1329‐1336. [DOI] [PMC free article] [PubMed] [Google Scholar]
- 21. Abu‐Rumeileh S, Abdelhak A, Foschi M, et al. The multifaceted role of neurofilament light chain protein in non‐primary neurological diseases. Brain. 2023;146(2):421‐437. [DOI] [PMC free article] [PubMed] [Google Scholar]
- 22. Khalil M, Teunissen CE, Otto M, et al. Neurofilaments as biomarkers in neurological disorders. Nat Rev Neurol. 2018;14(10):577‐589. [DOI] [PubMed] [Google Scholar]
- 23. Nagahama Y, Okina T, Suzuki N, Matsuda M. The Cambridge Behavioral Inventory: validation and application in a memory clinic. J Geriatr Psychiatry Neurol. 2006;19(4):220‐225. [DOI] [PubMed] [Google Scholar]
- 24. Wear HJ, Wedderburn CJ, Mioshi E, et al. The Cambridge Behavioural Inventory revised. Dement Neuropsychol. 2008;2(2):102‐107. [DOI] [PMC free article] [PubMed] [Google Scholar]
- 25. Kertesz A, Davidson W, Fox H. Frontal behavioral inventory: diagnostic criteria for frontal lobe dementi. Can J Neurol Sci. 1997;24(1):29‐36. [DOI] [PubMed] [Google Scholar]
- 26. Shigenobu K, Ikeda M, Fukuhara R, et al. The stereotypy rating inventory for frontotemporal lobar degeneration. Psychiatry Res. 2002;110(2):175‐187. [DOI] [PubMed] [Google Scholar]
- 27. Mioshi E, Hsieh S, Savage S, Hornberger M, Hodges JR. Clinical staging and disease progression in frontotemporal dementia. Neurology. 2010;74(20):1591‐1597. [DOI] [PubMed] [Google Scholar]
- 28. Foster PH, Russell LL, Peakman G, et al. Examining empathy deficits across familial forms of frontotemporal dementia within the GENFI cohort. Cortex. 2022;150:12‐28. [DOI] [PMC free article] [PubMed] [Google Scholar]
- 29. Davis M. A multidimensional approach to individual differences in empathy. JSAS Catalog Sel Doc Psychol. 1980;10. [Google Scholar]
- 30. Davis M. Measuring individual differences in empathy: evidence for a multidimensional approach. J Pers Soc Psychol. 1983;44:113‐126. [Google Scholar]
- 31. Doherty RW. The emotional contagion scale: a measure of individual differences. J Nonverbal Behav. 1997;21(2):131‐154. [Google Scholar]
- 32. Devenney E, Hornberger M, Irish M, et al. Frontotemporal dementia associated with the C9ORF72 mutation: a unique clinical profile. JAMA Neurol. 2014;71(3):331‐339. [DOI] [PubMed] [Google Scholar]
- 33. Unwin A. Discovering statistics using R by Andy field, Jeremy miles, Zoë field. Int Stat Rev. 2013;81:170. [Google Scholar]
- 34. Boutoleau‐Bretonniere C et al. Prospective evaluation of behavioral scales in the behavioral variant of frontotemporal dementia. Dement Geriatr Cogn Disord. 2012;34(2):75‐82. [DOI] [PubMed] [Google Scholar]
- 35. Marczinski CA, Davidson W, Kertesz A. A longitudinal study of behavior in frontotemporal dementia and primary progressive aphasia. Cogn Behav Neurol. 2004;17(4):185‐190. [PubMed] [Google Scholar]
- 36. Devenney E, Bartley L, Hoon C, et al. Progression in behavioral variant frontotemporal dementia: a longitudinal study. JAMA Neurol. 2015;72(12):1501‐1509. [DOI] [PubMed] [Google Scholar]
- 37. Gossink FT, Vijverberg E, Krudop W, et al. Predicting progression in the late onset frontal lobe syndrome. Int Psychogeriatr. 2019;31(5):743‐748. [DOI] [PubMed] [Google Scholar]
- 38. Steinacker P et al. Serum neurofilament light chain in behavioral variant frontotemporal dementia. Neurology. 2018;91(15):e1390‐e1401. [DOI] [PubMed] [Google Scholar]
- 39. Gendron TF, Heckman MG, White LJ, et al. Comprehensive cross‐sectional and longitudinal analyses of plasma neurofilament light across FTD spectrum disorders. Cell Rep Med. 2022;3(4):100607. [DOI] [PMC free article] [PubMed] [Google Scholar]
- 40. Manouchehrinia A, Piehl F, Hillert J, et al. Confounding effect of blood volume and body mass index on blood neurofilament light chain levels. Ann Clin Transl Neurol. 2020;7(1):139‐143. [DOI] [PMC free article] [PubMed] [Google Scholar]
Associated Data
This section collects any data citations, data availability statements, or supplementary materials included in this article.
Supplementary Materials
Table S1.
Data Availability Statement
Data are available upon reasonable request.