Abstract
This study proposes a synthetic data generation model to create a classification framework for cerebellar ataxia patients using trajectory data from the visuomotor adaptation task. The classification objectives include patients with cerebellar ataxia, age-matched normal individuals, and young healthy subjects. Synthetic data for the three classes is generated based on class conditions and random noise by leveraging a combination of conditional adversarial generative neural networks and reconstruction networks. This synthetic data, alongside real data, is utilized as training data for the patient classification model to enhance classification accuracy. The fidelity of the synthetic data is assessed visually to measure the validity and diversity of the generated data qualitatively while quantitatively evaluating distribution similarity to real data. Furthermore, the clinical efficacy of the patient classification model employing synthetic data is demonstrated by showcasing improved classification accuracy through a comparative analysis between results obtained using solely real data and those obtained when both real and synthetic data are utilized. This methodological approach holds promise in addressing data insufficiency in the digital healthcare domain, employing deep learning methodologies, and developing early disease diagnosis tools.
Supplementary Information
The online version contains supplementary material available at 10.1186/s12911-024-02720-y.
Keywords: Cerebellar ataxia diagnosis, Visuomotor adaptation task, Conditional generative adversarial network, Synthetic data, Digital healthcare
Introduction
With the advancements of deep learning (DL) technology utilizing data-driven deep neural networks such as large language models based on transformer [1, 2], various DL studies are actively underway in digital healthcare [3–6]. One of the key challenges influencing the robustness and reliability of DL models is the acquisition of sufficient high-quality learning data [7]. Specifically, obtaining adequate high-quality, class-balanced dataset poses a substantial challenge in applying DL technology in medical and clinical fields, where obtaining real data inherently difficult and often severely limited. However, recent developments in generative adversarial networks (GANs) [8], a DL-based generative model, have facilitated synthetic data generation closely resembling the distribution of real data [9]. Studies employing this approach to overcome data scarcity issues and effectively execute various tasks in medical and clinical fields are actively pursued [10–12]. For instance, the encoder-decoder-based DL generative models have been utilized to classify cerebellar ataxia types and predict the disease using function scores and magnetic resonance images (MRI) [13]. Additionally, research employing synthetic data of motor symptoms [6] and digital handwriting drawings [11] generated using GANs to develop DL models for Parkinson’s disease diagnosis has been introduced. However, a direct evaluation of the reliability of the synthesized data resulting from DL-based generative models has not been present. Instead, the effect has been demonstrated through the improvement rate of accuracy in patient classification tasks before and after data augmentation using synthetic data.
In this study, we evaluate the fidelity and clinical utility of the synthetic data generated for a visuomotor adaptation task and use it to develop a classifier to identify patients with cerebellar ataxia, thereby aiding in the clinical diagnosis of cerebellar ataxia.
The cerebellum is recognized for its substantial role in motor learning and control [14]. Cerebellar ataxia represents a prominent motor disorder characterized by impairments in balance, posture, extremity dysdiadochokinesia, and eye movement abnormalities, often accompanied by cognitive and emotional disorders [15–19]. Various behavioral tests have been developed to assist clinicians in identifying cerebellar ataxia [20, 21], alongside clinimetric scales such as the assessment scale and rating of ataxia (SARA) [22] for evaluating its severity. However, ataxia rating scales may not encompass all neurological abnormalities stemming from cerebellar atrophy or lesions. Notably, individuals with cerebellar lesions often struggle with tasks requiring adaptation to visual rotation, like prism adaptation [23, 24]. Hence, the visuomotor adaptation task holds promise as a behavioral test for detecting behavioral deviations associated with cerebellar atrophy. In the early stages of degenerative cerebellar ataxias, cerebellar atrophy may be mild, making detection of ataxia challenging through clinical examinations. Several studies have investigated visuomotor adaptation abilities in patients with cerebellar disorders [16, 25, 26], but there has been limited research on the effects of aging. Since controlling for age-related changes is crucial for increasing the sensitivity of tests using behavioral markers to detect the disease, further research in this area is needed. Consequently, there remains an unmet need for early diagnosis of movement disorders resulting from cerebellar ataxia, necessitating the development of sensitive methods to detect neurological symptoms related to cerebellar atrophy in asymptomatic carriers of hereditary cerebellar ataxias [27].
Thus, our study aims to develop a synthetic data generation and evaluation method for the visuomotor adaptation task and a classifier distinguishing between normal subjects and patients with cerebellar ataxia using synthetic data in conjunction with real data, to create a DL model aiding in the early diagnosis of movement disorders due to degenerative cerebellar ataxia. To procure initial real data on visuomotor adaptation, degenerative cerebellar patients and age-matched healthy controls, including young and older adults, were tasked with performing a task in a virtual reality (VR) environment utilizing a head-mounted display (HMD) for digitization of results [28]. The obtained real dataset from this experiment consists of 46 cases, and additional learning data is required to develop a DL model for the early identification of cerebellar ataxia. To this end, we introduce a conditional GAN-based generative model named “TraCA_CGAN” to generate synthetic visuomotor adaptation data using the acquired small real data sample and evaluate its fidelity. “TraCA_CGAN” is an abbreviated notation for a model that generates trajectories of cerebellar ataxia patients using conditional GAN. Furthermore, we aim to develop a patient classification model, “CA_CLS,” for cerebellar ataxia diagnosis utilizing both real and synthetic data and examine the clinical utility of the proposed model. “CA_CLS” is an abbreviated notation for a classification model for identifying patients with cerebellar ataxia.
Data
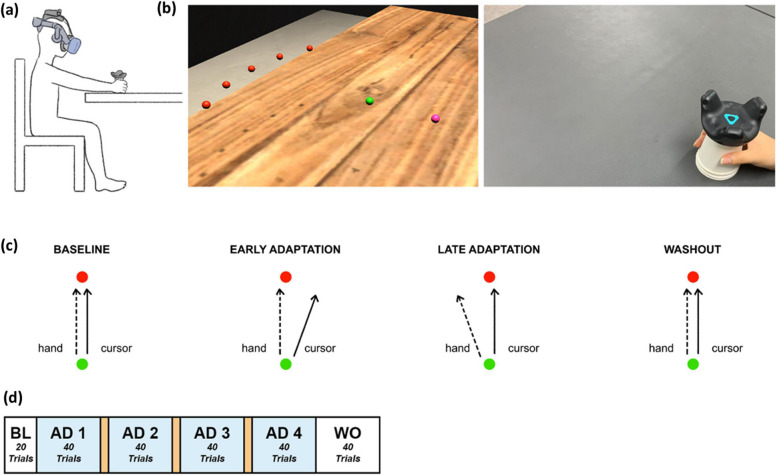
The behavioral task used in this study aims to evaluate the cerebellum’s role in motor adaptation and motor control in response to visual perturbations. Such experiments are widely recognized as highly effective methods for detecting cerebellar dysfunctions and identifying changes in motor adaptation patterns. To assess the impact of cerebellar dysfunction on motor adaptation, we compared the cerebellar patient group with the age-matched control group. Additionally, to evaluate the effects of aging on motor adaptation, we compared the age-matched control group with the young adult control group [16, 25, 26]. Motor trajectory data were collected from patients with cerebellar ataxia, age-matched controls, and young healthy individuals [28]. Participants engaged in a goal-directed reaching task toward a target positioned 20 cm in front of them within an HMD-VR environment. This environment allowed for real-time visual distortion based on the participant’s hand position while performing the task, as depicted in Fig. 1a. Participants were seated in front of a table and experienced the VR environment through an HMD, manipulating a cup attached to a tracker with their right hand. In Fig. 1b, participants executed goal-directed reaching movements within the VR environment. The left side of Fig. 1b illustrates the established HMD-VR experimental setup. Hand positions, starting points, and targets were represented as spheres (0.5 cm radius), distinguished by colors (pink for hand position, green for starting, and red for target), and positioned 12 cm above the table, which corresponded to the cup’s height. During the practice session, five targets were simultaneously represent, while each trial of the experimental task focused on a single target. The targets (red spheres) were spaced 15 apart on an invisible sector around the starting point (green sphere) with a radius of 20 cm. The real-world view is depicted on the right of Fig. 1b. Participants manipulated a VR tracker attached to a cup for each reaching movement.
Fig. 1.
Experimental overview [28]: (a) experimental setup, (b) experimental environment. c experimental task consisting of baseline, adaptation, and washout with (d) 20, 160, and 40 trials
Based on the visual cues provided in the virtual reality experimental environment, each participant held a disposable paper cup attached to the tracker with their right hand and executed quick straight-stretch tasks toward the target. In Fig. 1c, participants moved the tracker from the starting point (green sphere) to a target (red sphere). As the participant moved the tracker and the cursor (pink sphere) reached the starting point (green sphere), the target (red sphere) appeared, disappearing immediately upon the cursor reaching the target position. For each trial, the target randomly appeared at one of five positions at 15 (-30, -15, 0, +15, +30), with a radius of 20 cm from the starting point (Fig. 1c).
The entire experiment comprised three phases: baseline (BL), adaptation (AD), and washout (WO) as illustrated in Fig. 1d. During the BL phase, both the hand trajectory and cursor trajectory were identical. A total of 20 trials were conducted, with no visual distortion of the hand’s position. Subsequently, the AD phase trials connected. In the AD phase, the cursor was rotated 20 clockwise from the actual hand trajectory, and participants learned to adjust their hand movements to compensate for this rotation. The visual feedback of the hand movement was also rotated 20 clockwise. Consequently, at the beginning of the AD phase, the initial heading of the hand constrained an error of up to 20. In typical scenario, through the mechanism of visuomotor adaptation, these heading angle errors gradually diminish with continued trials. However, it is recognized that patients with cerebellar ataxia encounter challenges with visuomotor adaptation, resulting in substantial residual heading angle errors over multiple trials. The AD phase is divided into four experimental blocks comprising 40 trials. A one-minute rest period is provided between the first and second blocks and between the third and fourth blocks. After completing the 40 trials of fourth block in the AD phase, the visual rotation of the hand position is removed. During these WO trials, heading angle errors of the opposite direction occur. Similar to the AD blocks, as a total of 40 trials progress, the heading angle error gradually diminishes.
A total of 52 subjects participated in the experiment, comprising 18 patients diagnosed with cerebellar ataxia, 11 healthy age-matched adults, and 23 young adults. The patient group consisted of individuals diagnosed with hereditary spinocerebellar ataxias or idiopathic late-onset cerebellar ataxia, regularly monitored at the movement disorders clinic in the neurology department of Seoul Metropolitan Government-Seoul National University Boramae Medical Center (SMG-SNU BMC). These individuals, aged 20 to 70, exhibited no brain lesions except cerebellar degeneration in brain MRI. Patients with dementia or other etiologies for cerebellar atrophy besides primary degenerative conditions were excluded from the study. The age-matched controls were recruited from individuals visited the family medicine department of SMG-SNU BMC. They were healthy adults without neurological disease or a family history of cerebellar disease. The young adult group with normal visual acuity participated in this study. They had none or fewer than two VR experiences. All participants from the three groups gave their written informed consent prior to participation. All experimental procedures, including recruitment, were conducted in accordance with ethical guidelines and procedures approved by the Institutional Review Board of SMG-SNU BMC (IRB no. 30-2019-88). After completing the experiments for data collection, preprocessing was conducted. During this process, the entire dataset of an individual had to be excluded from analysis if a single trial was poorly performed or contained an error. This led to the removal of data from 2 patients, 1 age-matched control, and 3 young healthy controls. The final dataset consisted of 16 patients (8 females, 8 males, mean ag = 56.94 ± 7.19), 10 age-matched controls (8 females, 2 males, mean age = 51.2 ± 13.55), and 20 young healthy controls (4 females, 16 males, mean age = 21.5 ± 2.48), which were used for data synthesis and the development of the classification model.
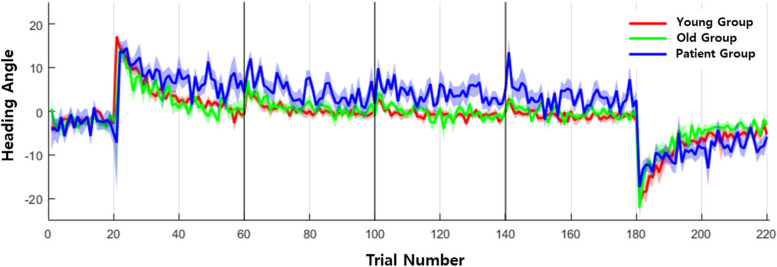
The performance of the subjects’ experimental task was assessed based on the heading angle. The heading angle was defined as the angle between the straight line from the start of the movement to the point of peak movement speed and the ideal straight trajectory from the starting point to the target. During BL trials, the overall heading angle remained at 0. However, during the AD phase, it could reach up to 20 due to the imposed visual rotation. The reduction of this error was quantified as the visuomotor adaptation of each participant, as illustrated in Fig. 2.
Fig. 2.
Heading angle in baseline (trials 1-20), adaptation (trials 21-180), and washout (trials 181-220) phases of real data for the groups of normal young, normal old, and patients
Methods
The cerebellar ataxia diagnosis model comprises two main components: the TraCA_CGAN, which generates synthetic data about the visuomotor adaptation trajectory, and the CA_CLS classification model, which discriminates between patients and normal individuals using both real and synthesized data.
TraCA_CGAN
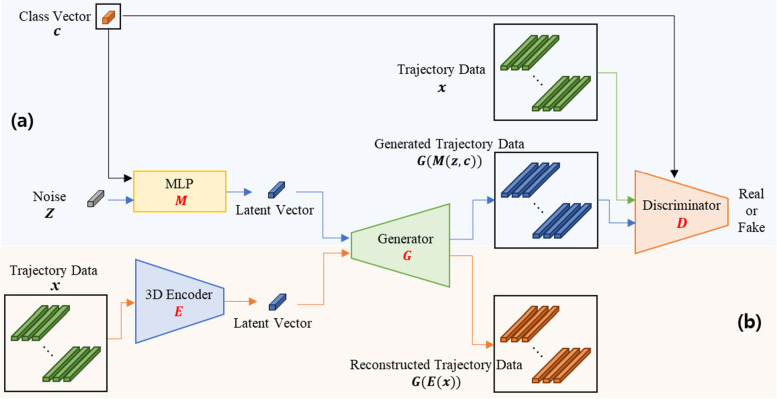
As depicted in Fig. 3, TraCA_CGAN consists of two main components: a conditional GAN (Fig. 3a) for synthesizing trajectories for patients and normal individuals, and a data reconstruction network (Fig. 3b) for evaluating the validity of the generated trajectories. In Fig. 3a, the conditional GAN receives input with random noise conditioned on one of three classes (Class Vector; C): patient, Normal_Y, and Normal_A. This input is processed through a multilayer perceptron (MLP; M), resulting in a latent vector. The latent vector is then fed into the Generator (G) to generate trajectory data. Concurrently, the Discriminator (D) evaluates whether the generated trajectory data, along with real trajectory data mapped to the class condition, is real or fake. In Fig. 3b, the reconstruction component receives the same real trajectory data used in the conditional GAN as input. This data is passed through a 3D Encoder (E) to extract features, resulting in a latent vector. The latent vector is then fed back into the input of G to generate reconstructed trajectory data.
Fig. 3.
Framework of TraCA_CGAN for (a) generating synthetic data on visuomotor adaptation trajectory of cerebellar ataxia patient and normal and (b) data reconstruction module for evaluating the validity of generated data
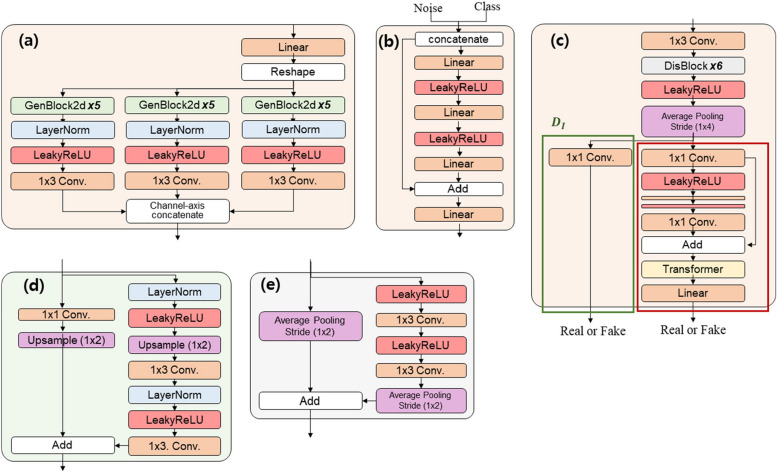
Through the simultaneous learning of the conditional GAN and reconstruction networks, TraCA_CGAN can effectively generate trajectory data that closely resembles real data. Additionally, the validity of the generated data can be assessed by comparing it with the reconstructed trajectory data. The architectural details of the individual sub-networks comprising TraCA_CGAN, including G, MLP, D, and E, are presented in Figs. 3 and 4. In Fig. 4a, G generates trajectory data from a latent vector. Three paths are utilized to generate x- and y-axis coordinates and time, respectively. These sequences are concatenated along the channel axis to produce the final output sequences. The concatenation is achieved through bilinear upsampling of each features of x- and y-axis coordinates and time via GenBlock2d, as illustrated in Fig. 4d. The MLP depicted in Fig. 4b receives noise and a class vector as conditions and embeds them into vectors before delivering them to G. In Fig. 4c, D is composed of an image discriminator () and a video discriminator (). determines whether an individual trajectory is real or fake, while assesses the entire trajectory’s authenticity. D learns spatial features of trajectories (x,y) while preserving temporal information of the input trajectory sequence. Subsequently, it compares the learned spatial and spatiotemporal features with ground-truth data to determine authenticity. The detailed layer construction of DisBlock, which comprises D, is depicted in Fig. 4e.
Fig. 4.
Architectural details of (a) Generator, (b) MLP, (c) Discriminator, (d) GenBlock2d in Generator, and (e) DisBlock in Discriminator constituting the TraCA_CGAN in Fig. 3a
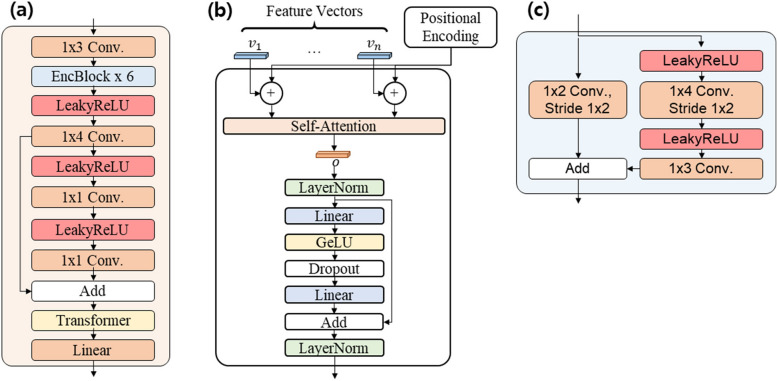
In Fig. 5a, E maintains the temporal information of the input sequence while learning the spatial features of each (x, y) trajectory through the EncBlock as depicted in Fig. 5c. Finally, E generates latent vectors by encoding temporal information through a Transformer in the last layer, as shown in Fig. 5b. The Transformer in Fig. 5b produces the temporal feature of the spatial feature vector sequence in the last layer of D and E. It is trained to encode the positional information of each sequence through positional encoding and to determine useful temporal information with a high contribution among them.
Fig. 5.
Architectural details of (a) 3D Encoder with (c) EncBlock and (b) Transformer comprising the reconstruction network depicted in Fig. 3b
CA_CLS
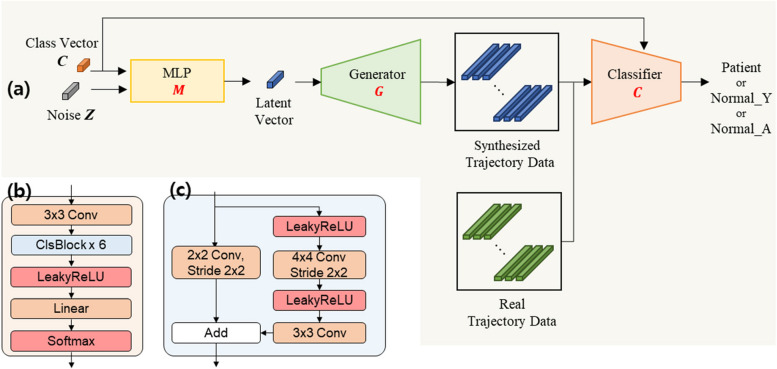
The framework of the CA_CLS classifier for diagnosing cerebellar ataxia and its architectural details, specifically the classifier C with ClsBlock, is outlined in Fig. 6. The trained G of TraCA_CGAN receives input with random noise under one of three class conditions (Class Vector; C): patient, Normal_Y, and Normal_A. It then generates synthesized trajectory data as output, which is combined with real data used to train the classifier C.
Fig. 6.
The framework of (a) CA_CLS for cerebellar ataxia diagnosis and its architectural detail of (b) classifier C with (c) ClsBlock
The classifier C is trained using a supervised approach, utilizing both synthesized and real trajectory data with corresponding class labels (i.e., patient, Normal_Y, or Normal_A). This allows the classifier to classify any trajectory input into one of these three classes based on learned features and class information.
Learning strategy and loss functions
TraCA_CGAN incorporates both GAN loss () and reconstruction loss (), aiming to minimize them simultaneously. is designed to reconstruct the latent representation for real trajectory data back to its original form. This approach addresses the challenge of limited real data samples available for model training before data augmentation through data GAN-based data generation. It serves to mitigate potential issues such as overfitting of D and G, which is trained to deceive D [29]. Therefore, function as a training loss that encourages G to generate all training data samples, regardless of D’s state. The formulation of is as follows:
| 1 |
Next, the D is trained to differentiate between real and fake trajectory data using GAN loss (), while G and M are trained to deceive D making them mutually hostile (). Consequently, the entire conditional GAN loss is represented as:
| 2 |
To address the learning instabilities inherent in GANs [30], particularly in the training of D, we employ the Wasserstein GAN with gradient penalty (WGAN-GP) [31] loss. This approach offers improved gradients during the training phase, leading to more stable convergence. WGAN imposes a Lipschitz constraint on D, requiring it to be within the space of 1-Lipschitz functions, thus preventing gradient explosion or vanishing. To enforce the Lipschitz constraint, we incorporate GP into the loss function of D. GP penalized D when its gradient deviates substantially from 1. Moreover, to selectively generate trajectory data of a specific class, we configure M and D in the form of a conditional GAN, which receives class vectors as additionally input. The loss functions for D and G are derived as follows:
| 3 |
| 4 |
where is set to 10 to control the intensity of the GP [32], and denotes a data distribution. The second term of Eq. 3, , represent the GP loss. Training of the WGAN-GP involves alternating between the optimization of and using a stochastic gradient descent algorithm, similar to original GAN.
The C is trained for class classification. It utilizes synthesized trajectory data generated from the trained G in TraCA_CGAN along with real trajectory data. The loss functions for training C are formulated as follows:
| 5 |
Experiments
Although individual trajectories obtained through the visuomotor adaptation task performed by participants may consist of varying number of points, all trajectories were standardized to consist of 128 points through interpolation. This standardization was essential for using the trajectories as input data for the proposed network training. Each trajectory, created by a participant, was represented as a sequence vector, where a three-dimensional (3D) vector of (x-axis, y-axis, time) continued for the duration of the time steps. The shape of the input data for network training was formatted as (channel, time step, width), resulting in a shape of (3, 220, 128). Real trajectories obtained from the visuomotor adaptation tasks were rotated and aligned to ensure that the starting point was (0,0) and the ending point was (1,1).This alignment was necessary because the destination points varied irregularly even within experiments conducted by the same individual.
The ablation experiment for determining the TraCA_CGAN architecture is performed on the proposed 2D CNN as a generator for generating synthetic trajectory time series data and the state-of-the-art (SOTA) MoCoGAN [33] for decomposing motion and content for video generation, which shows excellent performance in generating time series data for motion data. In addition, for more accurate trajectory generation, the TraCA_CGAN is a structure that performs multi-task learning by performing synthetic trajectory data generation and trajectory reconstruction tasks simultaneously, and a comparative experiment is also conducted to compare the effect of reconstruction task. Furthermore, an ablation experiment is conducted on the proposed 3D CNN as a CA_CLS classifier for the three-class classification task for trajectories, with the 2D CNN that basically learns the features of the input data.
The participant data included 30 healthy individuals and 16 patients (labeled as P-05 to P-23, excluding P-11, P-16, and P-18). The healthy group was further categorized into 20 young individuals (Normal_Y; labeled as Y-01 to Y-23, excluding Y-02, Y-05, and Y-08) and 10 aged individuals (Normal_A; labeled as A-01 to A-11, excluding A-06). Among these groups, 16, 8, and 12 dataset were utilized as training data for the TraCA_CGAN and initial CA_CLS. The remaining 4 (Y-20, Y-21, Y-22, Y-23), 2 (A-10, A-11), and 4 (P-20, P-21, P-22, P-23) datasets were allocated for testing. TraCA_CGAN received conditions for three classes and random noise, and was trained with real data augmented by adding 4,000 trajectory data points. The generator (G), trained through TraCA_CGAN, generated 20 synthetic trajectory data points for each of the patients, Normal_Y, and Normal_A groups. These synthetic data points were utilized for training and testing the CA_CLS. In total, 46 real datasets and 60 synthetic datasets were utilized to train a CA_CLS for diagnosing patients with cerebellar ataxia.
In addition, in order to conduct experiments on experimental reproducibility and performance consistency, while maintaining the training-test data split ratio at 80:20, we performed four experiments in which the test samples were randomly configured so that they did not overlap, and the relevant data division is as shown in Supplementary Table 1.
TraCA_CGAN is trained using the Adam optimizer with a learning rate () of 0.0001, of 0, and of 0.9. The values of and are set according to the WGAN-GP training conditions. Training involves 10,000 iterations, and following the learning method of WGAN-GP, the G is updated once every time the D is updated 5 times. The CA_CLS undergoes repeated training for 10,000 iterations using the Adam optimizer with a learning rate () of 0.0001, of 0.9, and of 0.999.
Model training and all experiments were conducted on a workstation equipped with an NVidia RTX 3090 GPU with 24 GB memory, an Intel i9 CPU, and 48 GB main memory. The batch size used for training was 9. The reason why the batch size was decided to be 9 is because it is the maximum size available on a single GPU with 24G memory used in the experiment. In this experiment, batch size 1 consists of 220 trajectories, so in reality, it is equivalent to updating the model with the gradient calculated from 1,100 (9x220) trajectories. Since enough trajectories are used for model update, the model error decreases steadily even at smaller batch size (5), and for larger batche size (18), the error decreases quickly in the early stage of training, but after the model has been sufficiently updated, about 10,000 iterations or more, it reaches a global optimum that is almost the same regardless of the batch size. The proposed network and algorithms were implemented using Python 3.6.9 and PyTorch 1.8.1.
Results
The evaluation of synthetic trajectory data generated by TraCA_CGAN encompasses two primary aspects: 1) assessing the fidelity of synthetic data compared to real trajectory data and 2) evaluating its clinical utility in diagnosing patients with cerebellar ataxia. The fidelity of the synthesized data is quantitatively evaluated by comparing its distribution similarity with real data, while the validity and diversity of the generated trajectory are qualitatively assessed visually. Additionally, the clinical utility of the synthetic data as an early diagnosis tools for patients with cerebellar ataxia is determined by measuring the classification accuracy of CA_CLS, which was trained using real and synthetic data.
Figure 7 depicts the performance of the subject’s experimental task, as indicated by heading angle, with real and synthetic data overlaid for all 200 trials across each of the three classes (i.e., groups). The heading angle is defined as the angle between the straight line from the start of the movement to the peak movement speed and the ideal straight trajectory from the starting point to the target. During baseline trials, the overall heading angle remains at 0, while in the adaptation phase, it can extend up to 20. The reduction of this error serves as a measure of the visuomotor adaptation of each participant. Note that for real data, the number of samples per class is 16, 20, and 10 for patients, Normal_Y, and Normal_A, respectively. Conversely, for synthetic data, there are 20 samples available for each class.
Fig. 7.
Heading angle in baseline (1-20 trial), adaptation (trials 21-180), and washout (trials 181-220) phase of real and synthetic data for the groups of (a) healthy young individuals, (b) age-matched subjects, and (c) patients diagnosed with cerebellar ataxia
The Kullback-Leibler divergence (D), also known as relative entropy, is a measure utilized to quantify the distinction between two probability distributions [34]. Hence, D serves as a valuable evaluation metric for assessing the similarity or dissimilarity of various distributions. Let P(x) and Q(x) represent two probability distributions of a discrete random variable x. Hence, both P(x) and Q(x) sum up to 1, and P(x)> 0 and Q(x) > 0 for any x in X. The definition of D(P(x),Q(x)) is provided in Eq. 6.
| 6 |
The D measures the expected number of extra bits required to encode samples from the probability distribution P(x) when using a code based on Q(x), rather than using a code based on P(x) [34]. In our study, P(x) represent the probability distribution of heading angles in synthesized trajectories. Figure 8 illustrates the distribution of heading angles from both real and synthetic trajectory data for each of the three groups: patients, Normal_Y, and Normal_A. The D values for each groups are as follows: for the healthy young group (Normal_Y), the D was 0.0625; for the age-matched normal group (Normal_A), the D was 0.1787; and for the group of patients with cerebellar ataxia, the D was 0.1135.
Fig. 8.
Probability distribution of heading angle from real (red bars) and synthetic (blue bars) trajectory data of (a) healthy young (Normal_Y), (b) age-matched normal (Normal_A), and (c) patients with degenerative cerebellar ataxia
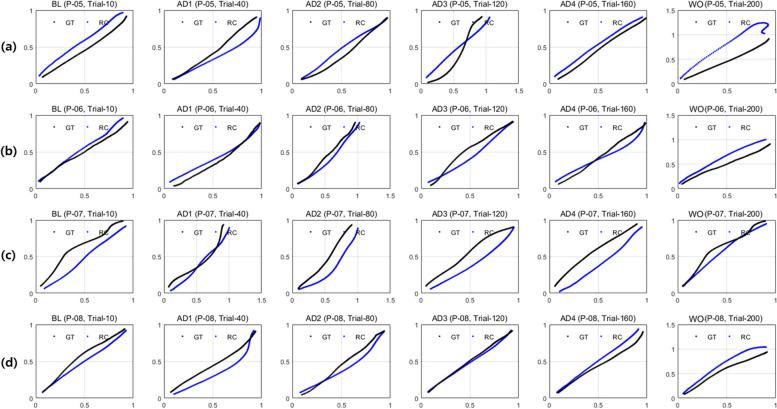
For qualitative visual assessment of the validity and diversity of synthetic data generated by the proposed network, the reconstructed trajectories extracted from the TraCA_CGAN learning process and the synthetic trajectories generated through the trained G in TraCA_CGAN are presented in Figs. 9 and 10, respectively. The aim is to extract represented features from the TraCA_CGAN for the real trajectory used in model training, reconstruct them through a reconstruction network, and compare them with real data to evaluate the similarity of the generated trajectory to the real trajectory. Figure 9a, b, c, and d depict the real (black line) and reconstructed (blue line) trajectories for patient data P-05, P-06, P-07, and P-08 used as training data, respectively, in trial 10 (BL), 40 (AD1), 80 (AD2), 120 (AD3), 160 (AD4), and 200 (WO) from left to right in the picture. It is observed that the TraCA_CGAN effectively generates straight trajectories and a variety of curved trajectories that are exhibit greater diversity than real trajectories.
Fig. 9.
Comparison of trials 10, 40, 80, 120, 180, and 200 with trajectory generated by the reconstruction network using the features from E of real trajectory data for patients of (a) P-05, (b) P-06, (c) P-07 and (d) P-08 during TraCA_CGAN learning
Fig. 10.
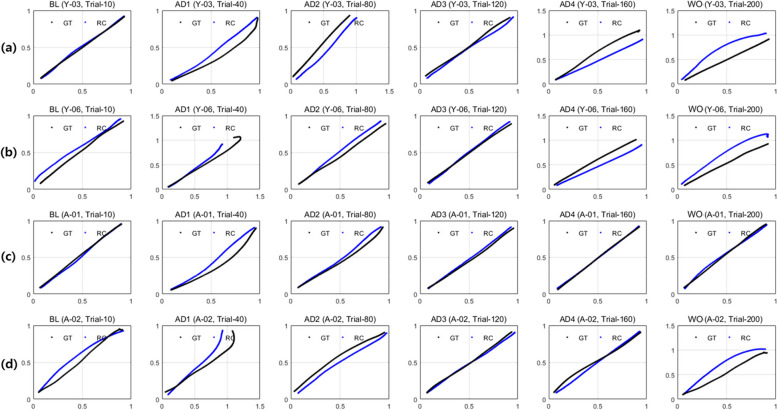
Comparison of trials 10, 40, 80, 120, 180, and 200 with trajectory generated by the reconstruction network using features from E of real trajectory data for healthy young (Normal_Y) participants (a) Y-03 and (b) Y-06, and age-matched normal (Normal_A) participants (c) A-01 and (d) A-02
Additionally, Fig. 10a, b, c, and d display the real (black line) and reconstructed (blue line) trajectories for Normal_Y of (a) Y-03 and (b) Y-06, and the Normal_A of (c) A-01 and (d) A-02 used as training data, respectively, in trial 10 (BL), 40 (AD1), 80 (AD2), 120 (AD3), 160 (AD4), and 200 (WO) from left to right in the picture. These trajectories demonstrate a pattern close to a straight line with less variation compared to the patient data depicted in Fig. 9. Importantly, the generated trajectories (blue line) are well reconstructed to closely match the real trajectory (black line).
Furthermore, Fig. 11 illustrates synthesized trajectories generated by the generator G of the trained TraCA_CGAN by receiving random noise and the class to be generated as conditions. Among the 20 synthesized datasets for each class, 5 trajectories (represented by lines of black, blue, red, pink, and cyan) are visualized for patients, Normal_Y, and Normal_A. From left to right in the figure, the 5 trial stages BL, AD1, AD2, AD3, AD4, and WO are displayed. It is evident that the variation in the shape of trajectories at AD1 is greater than other trial stages, indicating that trajectories exhibit diverse shapes during the adaptation phase. More, similar but diverse trajectories are synthesized at each class or trial stage, highlighting the TraCA_CGAN’s capability to generate varied trajectory patterns based on different conditions.
Fig. 11.
Synthesized trajectories for trials BL, AD-1, AD-2, AD-3, AD-4, and WO using the trained G of the TraCA_CGAN: (a) patient, (b) healthy young (Normal_Y), and (c) age-matched normal (Normal_A)
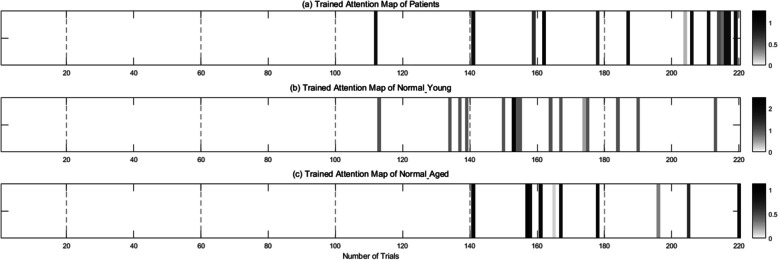
Figure 12a, b, and c depict the trained attention maps for patient, Normal_Y, and Normal_A, respectively, generated through the Transformer’s self-attention mechanism (as illustrated in Fig. 5b) located at the bottom of the E in Fig. 5a. These attention maps reveal which trajectories contributes a higher weight compared to others during TraCA_CGAN training with input data, depending on the class. From the visualized attention map in Fig. 12a, it is evident that the main trajectories distinguishing patients are primarily AD4 and WO trials. Figure 12b and c display the trained attention maps for Normal_Y, and Normal_A, respectively. It can be observed that in the case of Normal_Y, the attention weight is concentrated on AD4, while for Normal_A, there are instances where attention weight is also given to WO trials, similar to the characteristics observed in the patient group. Considering this collectively, it can be inferred that TraCA_CGAN has learned distinguishing features primarily from WO trials for patients and from AD4 trials for the normal group in the visuomotor adaptation task data. Furthermore, within the normal groups of Normal_A and Normal_Y, TraCA_CGAN appears to differentiate between Normal_A and Normal_Y, respectively, depending on whether it primarily learns the features of trials on AD4 alone or incorporates the features of trials on both AD3 and WO together.
Fig. 12.
Attention maps for (a) patients, (b) healthy young (Normal_Y), and (c) age-matched normal (Normal_A) extracted through feature representation learning of TraCA_CGAN from trials of visuomotor adaptation task data for each class
Moreover, to assess the clinical utility of the proposed method, such as early diagnosis for patients with cerebellar ataxia, the classification performance of CA_CLS for patients is evaluated using synthetic data generated through the trained G in TraCA_CGAN. To show classification accuracy, recall (or sensitivity), and precision are calculated using the confusion matrix for the three classes. Table 1 presents the accuracy-recall (or sensitivity)-precision values in % of CA_CLS, which categorizes the input trajectory data into one of three classes: patients, Normal_Y, and Normal_A. This is a multi-class classification with three classes. If the predicted value is the same as the real value, it is calculated as positive, and all others are calculated as negative. A confusion matrix is created in the same way as binary classification, and accuracy, recall (or sensitivity), and precision are calculated from the confusion matrix [35]. Two datasets are available for training and test CA_CLS: real and synthetic data. Additionally, there are three scenarios in which these datasets can be used separately or together, resulting in a total of nine experiments. When only real data was used for both training and test, the classification accuracy for three classes was 90.00%. However, when both real and synthetic data were combined for training, and only real data was used for test, the accuracy improved to 94.08%, representing a 4.08% increase. Conversely, when only synthetic data was utilized for training, the classification accuracy of real data dropped to 71.31%, indicating the poorest classification performance. Remarkably, when real and synthetic data were employed together for both training and test, the classification accuracy reached its peak at 98.33%. This notable improvement compared to the classification accuracy of 94.08% observed when testing only with real data indicates that the synthetic data closely followed the data distribution for each class, as indicated by the D results.
Table 1.
Classification performance in the order of accuracy / recall (or sensitivity) / precision in % depending on the combination of real and synthetic trajectory data used for training and test
| Test | ||||
|---|---|---|---|---|
| Real data | Real data + Synthesized data | Synthesized data | ||
| Training | Real data | 90.00 / 83.33 / 93.33 | 96.67 / 96.67 / 96.75 | 80.00 / 66.67 / 55.56 |
| Real data + Synthesized data | 94.08 / 86.60 / 94.16 | 98.33 / 98.33 / 98.41 | 98.00 / 91.45 / 86.51 | |
| Synthesized data | 71.31 / 59.42 / 52.71 | 76.17 / 64.07 / 59.13 | 96.50 / 96.05 / 96.07 | |
Furthermore, Table 2 shows the classification performance on real data according to the with and without multi-task learning that performs both the generation task and the reconstruction task, and the use of 2D CNN and MoCoGAN, a SOTA model, as Generators in TraCA_CGAN for producing trajectory time series data. When performing trajectory time series data generation and reconstruction tasks simultaneously using 2D CNN of TraCA_CGAN’s generator, it shows the best classification performance of 90% for real data. Many SOTA time-series generation GAN models include modules that can learn relationships between adjacent time series, such as Long Short-Term Memory (LSTM), Transformer, or 3D CNN. However, the trajectory data in this study consists of three stages (baseline, adaptation, washout), and has a continuous feature within the same stage but discontinuous when the stage changes. We observed that when the Generator is encouraged to learn relationships between time series, including LSTM, Transformer, or 3D CNN, it has difficulty in generating discontinuous patterns, and instead is limited to generating patterns that change gradually to different stages. Since this is different from the pattern of real data, the generated data did not help to improve the classification accuracy any further. Therefore, the proposed 2D CNN-based Generator structure embeds the input latent vector into 220 2D maps using a single linear layer, and then generates trajectories independently using a 2D CNN. Although it may lack the ability to generate continuous videos compared to other SOTA Generator, it is excellent in generating discontinuous patterns of the trajectory data in our experiment. Note that only real data was used in the performance evaluation to determine the optimal architecture for the model in order to exclude the influence of synthetic data. In addition, as a result of a comparative experiment using 2D CNN and 3D CNN (in CA_CLS) to extract the features of the input data, trajectory time series, as an ablation experiment for determining the classification model, the classification accuracy using real data was 80% and 90%, respectively. Unlike the generation task where the pattern of each trajectory needs to be accurate, we observed that the task of classifying the entire trajectory into one of three categories is a relatively easy task where the training loss quickly converges to 0. The more parameters the model has and the more complex its structure is, the more easily overfitting occurs, which tends to significantly reduce the classification accuracy for the test dataset. Instead of adopting the SOTA classification model structure including self-attention, the proposed classifier adopts a structure that minimizes complexity to prevent overfitting, and adopts the simplest CNN structure except for the residual structure to prevent the gradient vanishing problem. In addition, unlike the generation task where each trajectory pattern needs to be accurate, the classification task does not necessarily need to separate the trajectories because the entire trajectory is classified into one of three categories, so the proposed 3D CNN-based classifier in CA_CLS is shown to be effective in extracting features of the input data with fewer parameters.
Table 2.
Classification accuracy on real data on ablation experiments of the TraCA_CGAN for the Generator and multitask learning of generation and reconstruction of the trajectory time series data
| Generator | ||
|---|---|---|
| 2D CNN | MoCoGAN | |
| With Reconstruction | 90.00 % | 80.00 % |
| Without Reconstruction | 80.00 % | 80.00 % |
In addition, to evaluate the reproducibility and performance consistency of CA_CLS, four experiments were conducted in which test samples were randomly selected without duplication. The training-test data split ratio was kept at 80:20. The classification performance was represented in Supplementary Tables 1-4. When synthetic data is added to training and test, there is a slight difference in performance because different data is used for each experiment due to the principle of the generative model that generates trajectories from random noise. In the case where only synthetic data was used, the same test data set cannot be used due to the principle of the synthetic trajectory data generated from random noise, so it was excluded from additional experiments. Depending on the configuration of the training-test data, the classification accuracy is the same or shows a slight difference. However, if there is a difference, since there are only 10 test data for the patient group, it should be taken into account that a classification error for single sample will inevitably causes a 10% difference. Furthermore, we identified that this ±10-20% difference was due to the classification error between young and old in the normal class, not the patient class.
Conclusion and discussion
In this study, we have developed a DL-based synthetic data generation model, TraCA_CGAN, and a classification model, CA_CLS, for the early diagnosis of diseases utilizing data from the visuomotor adaptation task. We evaluated their performance by applying them to patients with degenerative cerebellar ataxia. To assess the fidelity of the generated synthetic data, we examined the distribution similarity with real data, as well as the validity and diversity of the synthesized trajectories of visuomotor adaptation. Additionally, we evaluated the clinical utility by enhancing the classification accuracy of patients with cerebellar ataxia, age-matched normal individuals, and young healthy subjects through the utilization of synthetic data as training data, as opposed to solely relying on real data. This assessment was crucial in measuring the effectiveness of synthetic data in improving the diagnostic accuracy across different groups. In particular, the visualization of the attention map, an implicit feature that distinguishes the trajectory data among patients with cerebellar ataxia, age-matched normal individuals, and young healthy subjects during model training, enabled us identify spatial features of the input data hold high relevance to the model output. This facilitated a deeper understanding of the distinguishing characteristics present in trajectory data associated with each group, thereby enhancing the diagnostic capabilities of the models.
Synthetic data has shown promise in improving diagnostic and predictive accuracy in various medical fields. Wong et al. [36] proposed a method to increase the diagnostic accuracy of Alzheimer’s disease (AD) by generating synthetic magnetic resonance imaging (MRI) scans. The researchers employed a generative adversarial network (GAN) to produce synthetic brain MRI scans representing different stages of AD progression. This study demonstrated that by augmenting the training dataset with these synthetic images, multi-level AD classification accuracy of over 80% could be achieved even when the real dataset was reduced. Additionally, [37] showed that seizure prediction algorithms could be improved by generating synthetic electroencephalography (EEG) data. They proposed an algorithm that generates synthetic data using a deep convolutional generative adversarial network (DCGAN) trained on real EEG data in a patient-specific manner. Similar to these studies, our synthetic trajectory data improved the diagnostic accuracy of cerebellar ataxia.
One aspect to consider regarding the performance of the proposed model is that the current DL-based approach uses input with fixed size dimensions, requiring trajectory data of various sizes to be converted to a standardized format. If variant sized trajectory data could be directly utilized, it might lead to better representation learning in patients and controls. This could potentially result in the generation of more realistic synthetic trajectories and improve patient classification accuracy, which is an area of focus for our future work.
In the real data collected for this study, there is an imbalance in the number of samples between groups, which is a common challenge in clinical research. While our results showed that synthetic data techniques could effectively supplement the insufficient data, this study did not delve deeply into how various challenges posed by data imbalance can be resolved. Therefore, future research should focus on developing comprehensive strategies to effectively address data imbalance, such as expanding to larger cohorts or applying advanced analytical methods tailored for imbalanced data.
This study’s main contribution lies in addressing the challenges of data insufficiency encountered when applying data-driven approaches to the medical domain, particularly in digital healthcare. This is achieved through the generation of synthetic data via adversarial learning of a generative model. Additionally, we contributed to demonstrating the clinical utility of the proposed methodology in early disease diagnosis by both qualitatively and quantitatively evaluating the fidelity of the synthesized data and applying it to patient classification to enhance accuracy.
Supplementary Information
Acknowledgements
This work was supported by Institute of Information & Communications Technology Planning & Evaluation (IITP) grant funded by the Korea government(MSIT) (RS-2023-00223446, Development of object-oriented synthetic data generation and evaluation methods).
Code availability
For non-commercial purposes and research purposes, sharing is possible upon request via email contact for non-commercial research purposes only.
Authors' contributions
J.L., J.R. and S.W. conceptualized and designed the study. J.K. and T.K. developed and tested the deep learning model. S.W., J.L. and J.K. analyzed the data and evaluated the results. J.L., W. Y., J. S. and J.R. have directly accessed and verified the underlying data reported in the manuscript. J.K. and S.W. drafted the manuscript, which was edited and critically reviewed by T.K., J.L., and J.R. All authors read and approved the final manuscript and had final responsibility for the decision to submit for publication.
Data availability
De-identified data supporting this study may be shared based on reasonable written request to the corresponding author. Access to deidentified data will require a Data Access Agreement and IRB clearance, which will be considered by the institutions who provided the data for this research. For synthetic trajectory data, sharing is possible upon request via email contact for non-commercial research purposes only.
Declarations
Ethics approval and consent to participate
All experimental procedures, including recruitment, were conducted in accordance with ethical guidelines and procedures approved by the Institutional Review Board of Seoul Metropolitan Government Seoul National University Boramae Medical Center (IRB no. 30-2019-88). All participants gave their written informed consent prior to participation.
Consent for publication
N/a.
Competing interests
The authors declare no competing interests.
Footnotes
Publisher's Note
Springer Nature remains neutral with regard to jurisdictional claims in published maps and institutional affiliations.
Contributor Information
Jee-Young Lee, Email: wieber04@snu.ac.kr.
Jeh-Kwang Ryu, Email: ryujk@dgu.ac.kr.
References
- 1.Vaswani A, Shazeer N, Parmar N, Uszkoreit J, Jones L, Gomez AN, et al. Attention is all you need. Adv Neural Inf Process Syst. 2017;30:5998–6008.
- 2.Zhao WX, Zhou K, Li J, Tang T, Wang X, Hou Y, et al. A survey of large language models. 2023. arXiv preprint arXiv:2303.18223.
- 3.Ratner AJ, Ehrenberg H, Hussain Z, Dunnmon J, Re C. Learning to compose domain-specific transformations for data augmentation. Adv Neural Inf Process Syst. 2017;30:3236–46. [PMC free article] [PubMed]
- 4.Frid-Adar M, Diamant I, Klang E, Amitai M, Goldberger J, Greenspan H. GAN-based synthetic medical image augmentation for increased CNN performance in liver lesion classification. Neurocomputing. 2018;321:321–31. [Google Scholar]
- 5.Golany T, Radinsky K. Pgans: Personalized generative adversarial networks for ecg synthesis to improve patient-specific deep ecg classification. Proceedings of the AAAI Conference on Artificial Intelligence. 2019;33(1):557–64. 10.1609/aaai.v33i01.3301557
- 6.Ramesh V, Bilal E. Detecting motor symptom fluctuations in Parkinson’s disease with generative adversarial networks. NPJ Digit Med. 2022;5(1):138. [DOI] [PMC free article] [PubMed] [Google Scholar]
- 7.Johnson JM, Khoshgoftaar TM. Survey on deep learning with class imbalance. J Big Data. 2019;6(1):1–54. [Google Scholar]
- 8.Goodfellow I, Pouget-Abadie J, Mirza M, Xu B, Warde-Farley D, Ozair S, et al. Generative adversarial networks. Commun ACM. 2020;63(11):139–44. [Google Scholar]
- 9.Cenggoro TW, et al. Deep learning for imbalance data classification using class expert generative adversarial network. Procedia Comput Sci. 2018;135:60–7. [Google Scholar]
- 10.Ramesh T, Lilhore UK, Poongodi M, Simaiya S, Kaur A, Hamdi M. Predictive analysis of heart diseases with machine learning approaches. Malays J Comput Sci. 2022:132–48.
- 11.Dzotsenidze E, Valla E, Nõmm S, Medijainen K, Taba P, Toomela A. Generative Adversarial Networks as a Data Augmentation Tool for CNN-Based Parkinson’s Disease Diagnostics. IFAC-PapersOnLine. 2022;55(29):108–13. [Google Scholar]
- 12.Jadala VC, Pasupuleti SK, Yellamma P, et al. Deep Learning analysis using ResNet for Early Detection of Cerebellar Ataxia Disease. In: 2022 International Conference on Advancements in Smart, Secure and Intelligent Computing (ASSIC). IEEE; 2022. pp. 1–6.
- 13.Yang Z, Zhong S, Carass A, Ying SH, Prince JL. Deep learning for cerebellar ataxia classification and functional score regression. In: Machine Learning in Medical Imaging: 5th International Workshop, MLMI 2014, Held in Conjunction with MICCAI 2014, Boston, MA, USA, September 14, 2014. Proceedings 5. Springer; 2014. pp. 68–76. [DOI] [PMC free article] [PubMed]
- 14.Manto M, Bower JM, Conforto AB, et al. Consensus Paper: Roles of the Cerebellum in Motor Control—The Diversity of Ideas on Cerebellar Involvement in Movement. Cerebellum. 2012;11:457–87. 10.1007/s12311-011-0331-9. [DOI] [PMC free article] [PubMed]
- 15.Block H, Celnik P. Stimulating the cerebellum affects visuomotor adaptation but not intermanual transfer of learning. Cerebellum. 2013;12:781–93. [DOI] [PMC free article] [PubMed] [Google Scholar]
- 16.Butcher PA, Ivry RB, Kuo SH, Rydz D, Krakauer JW, Taylor JA. The cerebellum does more than sensory prediction error-based learning in sensorimotor adaptation tasks. J Neurophys. 2017;118(3):1622–36. [DOI] [PMC free article] [PubMed] [Google Scholar]
- 17.Therrien AS, Bastian AJ. The cerebellum as a movement sensor. Neurosci Lett. 2019;688:37–40. [DOI] [PubMed] [Google Scholar]
- 18.Tzvi E, Loens S, Donchin O. Mini-review: the role of the cerebellum in visuomotor adaptation. Cerebellum. 2022;21(2):306–13. [DOI] [PMC free article] [PubMed] [Google Scholar]
- 19.Tsay JS, Kim H, Haith AM, Ivry RB. Understanding implicit sensorimotor adaptation as a process of proprioceptive re-alignment. Elife. 2022;11:e76639. [DOI] [PMC free article] [PubMed] [Google Scholar]
- 20.Trouillas P, Takayanagi T, Hallett M, Currier R, Subramony S, Wessel K, et al. International Cooperative Ataxia Rating Scale for pharmacological assessment of the cerebellar syndrome. J Neurol Sci. 1997;145(2):205–11. [DOI] [PubMed] [Google Scholar]
- 21.Subramony S, May W, Lynch D, Gomez C, Fischbeck K, Hallett M, et al. Measuring Friedreich ataxia: interrater reliability of a neurologic rating scale. Neurology. 2005;64(7):1261–2. [DOI] [PubMed] [Google Scholar]
- 22.Schmitz-Hübsch T, Du Montcel ST, Baliko L, Berciano J, Boesch S, Depondt C, et al. Scale for the assessment and rating of ataxia: development of a new clinical scale. Neurology. 2006;66(11):1717–20. [DOI] [PubMed] [Google Scholar]
- 23.Martin T, Keating J, Goodkin H, Bastian A, Thach W. Throwing while looking through prisms: I. Focal olivocerebellar lesions impair adaptation Brain. 1996;119(4):1183–98. [DOI] [PubMed] [Google Scholar]
- 24.Block HJ, Bastian AJ. Cerebellar involvement in motor but not sensory adaptation. Neuropsychologia. 2012;50(8):1766–75. [DOI] [PMC free article] [PubMed] [Google Scholar]
- 25.Panouillères MT, Joundi RA, Benitez-Rivero S, Cheeran B, Butler CR, Németh AH, et al. Sensorimotor adaptation as a behavioural biomarker of early spinocerebellar ataxia type 6. Sci Rep. 2017;7(1):2366. [DOI] [PMC free article] [PubMed] [Google Scholar]
- 26.Wong AL, Marvel CL, Taylor JA, Krakauer JW. Can patients with cerebellar disease switch learning mechanisms to reduce their adaptation deficits? Brain. 2019;142(3):662–73. [DOI] [PMC free article] [PubMed] [Google Scholar]
- 27.Kim DH, Kim R, Lee JY, Lee KM. Clinical, imaging, and laboratory markers of premanifest spinocerebellar ataxia 1, 2, 3, and 6: a systematic review. J Clin Neurol (Seoul, Korea). 2021;17(2):187. [DOI] [PMC free article] [PubMed] [Google Scholar]
- 28.Chang H, Woo SH, Kang S, Lee CY, Lee JY, Ryu JK. A curtailed task for quantitative evaluation of visuomotor adaptation in the head-mounted display virtual reality environment. Front Psychiatry. 2023;13:963303. [DOI] [PMC free article] [PubMed] [Google Scholar]
- 29.Kushwaha V, Nandi G, et al. Study of prevention of mode collapse in generative adversarial network (gan). In: 2020 IEEE 4th Conference on Information & Communication Technology (CICT). IEEE; 2020. pp. 1–6.
- 30.Salimans T, Goodfellow I, Zaremba W, Cheung V, Radford A, Chen X. Improved techniques for training gans. Adv Neural Inf Process Syst. 2016;29:3237–35.
- 31.Arjovsky M, Chintala S, Bottou L. Wasserstein generative adversarial networks. In: International conference on machine learning. PMLR; 2017. pp. 214–223.
- 32.Gulrajani I, Ahmed F, Arjovsky M, Dumoulin V, Courville AC. Improved training of wasserstein gans. Adv Neural Inf Process Syst. 2017;30:5768–78.
- 33.Tulyakov S, Liu MY, Yang X, Kautz J. MoCoGAN: Decomposing motion and content for video generation, 2018 IEEE/CVF Conference on computer vision and pattern recognition. Salt Lake City: 2018. p. 1526–35. 10.1109/CVPR.2018.00165.
- 34.Wu G, Zhang H, He Y, Bao X, Li L, Hu X. Learning Kullback-Leibler divergence-based Gaussian model for multivariate time series classification. IEEE Access. 2019;7:139580–91. [Google Scholar]
- 35.de Carvalho AC, Freitas AA. A Tutorial on Multi-label Classification Techniques. In: Abraham A, Hassanien AE, Snášel V. (eds) Foundations of Computational Intelligence Volume 5. Studies in Computational Intelligence. Heidelberg: Springer; 2019;205. 10.1007/978-3-642-01536-6_8.
- 36.Wong PC, Abdullah SS, Shapiai MI. Exceptional performance with minimal data using a generative adversarial network for Alzheimer’s disease classification. Sci Rep. 2024;14(1):17037. [DOI] [PMC free article] [PubMed] [Google Scholar]
- 37.Rasheed K, Qadir J, O’Brien TJ, Kuhlmann L, Razi A. A generative model to synthesize EEG data for epileptic seizure prediction. IEEE Trans Neural Syst Rehabil Eng. 2021;29:2322–32. [DOI] [PMC free article] [PubMed] [Google Scholar]
Associated Data
This section collects any data citations, data availability statements, or supplementary materials included in this article.
Supplementary Materials
Data Availability Statement
De-identified data supporting this study may be shared based on reasonable written request to the corresponding author. Access to deidentified data will require a Data Access Agreement and IRB clearance, which will be considered by the institutions who provided the data for this research. For synthetic trajectory data, sharing is possible upon request via email contact for non-commercial research purposes only.


