Abstract
Gliomas represent a highly aggressive class of tumors located in the brain. Despite the availability of multiple treatment modalities, the prognosis for patients diagnosed with glioma remains unfavorable. Therefore, further exploration of new biomarkers is crucial to enhance the prognostic assessment of glioma and to investigate more effective treatment options. In this research, we utilized multiple machine learning techniques to assess the significance of genes related to angiogenesis and epithelial-mesenchymal transition (EMT) in the context of prognosis and treatment for glioma patients. The random forest algorithm highlighted the significance of CALU, and further analysis indicated that the effect of CALU on glioma progression may be regulated by MYC. Different machine learning approaches were employed in our investigation to uncover crucial genes associated with angiogenesis and EMT in glioma. Our findings verify the connection between these genes and the prognosis of patients with glioma, as well as the results of immunotherapeutic interventions. Notably, through experimental verification, we identified CALU as a new prognostic marker for glioma, and inhibiting the expression of CALU can impede the progression of glioma.
Supplementary Information
The online version contains supplementary material available at 10.1186/s13062-024-00565-z.
Keywords: Gliomas, Angiogenesis, Epithelial-mesenchymal transition, CALU
Introduction
Gliomas represent a class of highly aggressive tumors located in the brain [1]. Despite a variety of treatment modalities—including surgical intervention, radiotherapeutic measures, chemotherapy, and immune-based therapies—the prognosis for those diagnosed with glioma remains unfavorable [2]. The challenges in achieving significant success with immunotherapy can be attributed to the complex characteristics of the tumor microenvironment and the variety of strategies that allow for immune evasion [3]. In recent years, various immunotherapeutic strategies for glioma, such as immune checkpoint inhibitors and CAR-T cell therapies, have been gradually implemented; however, their effectiveness is still hampered by several factors [4]. Progress in molecular biology has improved our comprehension of glioma origins and has unveiled related genetic abnormalities in a clinical context. It is essential to identify further immune-related molecular markers to enhance prognostic assessments for glioma and to investigate more effective therapeutic alternatives.
Studies suggest that this microenvironment contains a high density of immunosuppressive cells, including regulatory T cells (Tregs) and tumor-associated macrophages (TAMs) [5, 6]. These immune cells disrupt anti-tumor responses through the secretion of numerous inhibitory substances. For instance, recent studies have demonstrated a significant correlation between TAM proliferation and tumor aggressiveness, which may offer new clinical markers for evaluating tumor prognosis [7]. Moreover, the tumor immune microenvironment not only affects tumor progression but also plays a vital role in how tumors respond to immunotherapy [8–10]. Another critical aspect of glioma growth and advancement is angiogenesis. Glioma cells enhance angiogenesis by releasing factors like vascular endothelial growth factor (VEGF), which is crucial for delivering the necessary oxygen and nutrients to fuel tumor expansion [11]. For instance, research by Ishikawa et al. highlights that elevated VEGF levels are strongly linked to patient outcomes, and treatments targeting VEGF have demonstrated encouraging clinical results [12]. Additionally, the link between angiogenesis and tumor invasiveness and metastasis has led to significant interest in developing therapeutic strategies that focus on inhibiting angiogenesis.
Another important line of inquiry in glioma research is the epithelial-to-mesenchymal transition (EMT), which entails the conversion of tumor cells from an epithelial configuration to a mesenchymal one, thereby increasing their ability to migrate and invade [11]. Recent studies have demonstrated a close relationship between EMT and the prognosis of glioma. Specifically, research indicates that the activation of the EMT process in glioma cells enhances their migratory capabilities and confers drug resistance [13]. Moreover, the interplay between angiogenesis and EMT has garnered increasing attention, with evidence suggesting that these two processes may interact to promote tumor invasion and metastasis [14]. Additionally, studies have revealed a significant correlation between angiogenic activity and the expression levels of EMT markers in glioma patients, underscoring the importance of considering angiogenesis when investigating the biological characteristics of glioma and EMT [15]. This understanding could provide a theoretical foundation for the development of new treatment strategies.
The utilization of machine learning techniques in the realm of biomedical research has experienced a consistent rise in recent years [16, 17]. The strong capabilities of these methods in data processing and pattern recognition empower researchers to glean essential features from a wide range of gene expression datasets. As a result, leveraging machine learning technology to pinpoint genes linked to angiogenesis and EMT provides an innovative strategy for the early identification of glioma, tracking disease progression, and formulating personalized immunotherapy approaches. In this investigation, we employed a variety of machine learning algorithms to assess the relevance of genes associated with angiogenesis and EMT in the prognosis and treatment of glioma patients. The random forest algorithm underscored the crucial significance of CALU, and further experiments validated its substantial predictive value for glioma prognosis.
Materials and methods
Datasets and patient samples
This research employed the TCGA-GBM + LGG dataset to pinpoint genes linked to angiogenesis and EMT. Furthermore, the analysis incorporated RNA sequencing data along with clinical details derived from the TCGA-GBM + LGG dataset. Prognostic models were constructed and evaluated using data obtained from the TCGA-GBM + LGG, GSE43378, and GSE83300 datasets. The TCGA-GBM + LGG dataset comprised a total of 665 samples, including 153 patients with GBM and 512 patients with LGG. Among these, 247 patients had died, while 418 survived. Additionally, the GSE43378 and GSE83300 datasets each included 50 samples from their respective groups for the study.
WGCNA algorithm identifies metastasis-related genes
Employing the ‘WGCNA’ package, we first evaluated the TCGA-GBM + LGG dataset for any missing data and performed sample clustering to pinpoint outlier samples. We then selected optimal power values to create a proximity matrix, ensuring that the gene distribution based on connectivity conformed to a scale-free network model. Following this, we computed topological overlap matrices, carried out gene clustering, recognized dynamically spliced modules, and combined similar modules, each containing at least 100 genes. In the end, we determined correlation coefficients and p-values for various modules alongside their clinical characteristics, which allowed us to analyze the connections between these modules and their respective genes, identifying those most closely linked to angiogenesis and EMT.
Subgroup analysis
The expression profiles obtained from RNA sequencing, along with relevant clinical data for GBM and LGG, were extracted from the TCGA dataset. A consistency analysis was conducted utilizing the ConsensusClusterPlus R package (version 1.54.0), allowing for a maximum of 6 clusters, and sampling 80% of the complete set of samples across 100 iterations. The clustering technique employed was ‘hc’, using the ‘ward.D2’ linkage function. Clustering heatmaps were created with the pheatmap package in R (version 1.0.12).
Correlation analysis of immune infiltration and immunotherapy
To ensure a reliable evaluation of immune score results, we utilized the immunedeconv R package [18]. Each algorithm within this package has been extensively validated and offers distinct advantages. In this study, we chose the XCELL method because of its capability to assess a wider range of immune cell types.
Building prognostic models
To create a diagnostic model for glioma that is both precise and reliable, we employed a range of machine learning algorithms in various pairings. The training dataset was sourced from TCGA-GBM + LGG, while validation was conducted using the GSE43378 and GSE83300 datasets. Each algorithmic pairing was assessed using the Area Under the Curve (AUC) metric, allowing us to pinpoint the combination with the highest average AUC as the most successful model.
Cell culture and transient transfection
Cell lines HA, U87, and U251 were acquired from Beijing Bena Biotechnology Co. located in Beijing, China. The cells were maintained using DEME F-12 medium with 10% FBS (Gibco, USA). For the negative control (NC) and siRNA targeting CALU or MYC (Sagon, China), transfection into the cells was conducted with Lipofectamine 2000 (Invitrogen, Thermo Fisher, USA). Interference sequences of small interfering RNA can be found in Supplementary Table 1.
Quantitative real-time polymerase chain reaction (qRT-PCR)
Total RNA was extracted from HA, U87, and U251 cell lines using the TRIzol reagent (Thermo Fisher, USA). A cDNA synthesis was performed from 500 ng of RNA with the HiScript II SuperMix (Vazyme, China). The qRT-PCR was conducted on the ABI 7500 System (Thermo Fisher, USA) utilizing SYBR Green Master Mix. The amplification conditions for PCR included 45 cycles set at 94 °C for 10 min, followed by 10 s at 94 °C, and then 45 s at 60 °C. GAPDH served as the internal control. The list of primer pair sequences for the targeted genes can be found in Supplementary Table 2.
Western-blot
Total protein from cells or tissues was extracted using RIPA buffer. After quantification, equal amounts of protein were separated by 10% SDS-PAGE and transferred onto the PVDF membrane. After blocking with 5% skim milk for 2 h, the antibodies was incubated overnight at 4 °C, respectively. Subsequently, the membrane was incubated with a secondary antibody at room temperature for 2 h. Immunoblotting was visualized using an ECL kit (Beyotime, Shanghai) and observed with Chemiluminescent Imaging (Tanon 4600 SF, China). The list of antibodies can be found in Supplementary Table 3.
EdU (5-Ethynyl-2’-deoxyuridine) assay
EdU detection was performed using the Kit (BeyoClick™ EdU-594, Beyotime, China). After washing with PBS, cells were cultured with the EdU solution for 2 h, followed by staining of the cell nuclei with DAPI solution. After washing, cells were observed under an inverted microscope (Lecial, Germany).
Cell counting Kit-8 (CCK-8) assay
Cell viability was measured using the CCK-8 assay (Beyotime, China). Cells were seeded at a density of 1 × 10^4 cells per well in a 96-well plate for different treatments. CCK-8 solution was applied at specified time points. After incubating at 37 °C for 2 h, each well’s optical density (OD) at 450 nm was measured using a microplate reader (Thermofisher, USA).
Tube formation assays
Tube formation assays were performed using Matrigel basement membrane matrix (Corning Incorporated, 356234, USA). First, Matrigel was added to 96-well plates using an ice-cold pipette tip at approximately 40 µL per well and incubated at 37 ℃ to solidify. Then, 1.2 × 10⁴ HUVECs were seeded into the solidified Matrigel. After 3 h versus 12 h of incubation, the cells were photographed using an inverted light microscope (Lecial, Germany).
Statistical analysis
The Wilcoxon rank-sum test was utilized to assess the expression levels of genes linked to angiogenesis and EMT in both glioma tissues and normal tissue samples. For the purpose of evaluating prognosis, the log-rank test was performed. A p-value of less than 0.05 was considered statistically significant.
Result
Identification of key regulatory genes for angiogenesis and EMT in gliomas
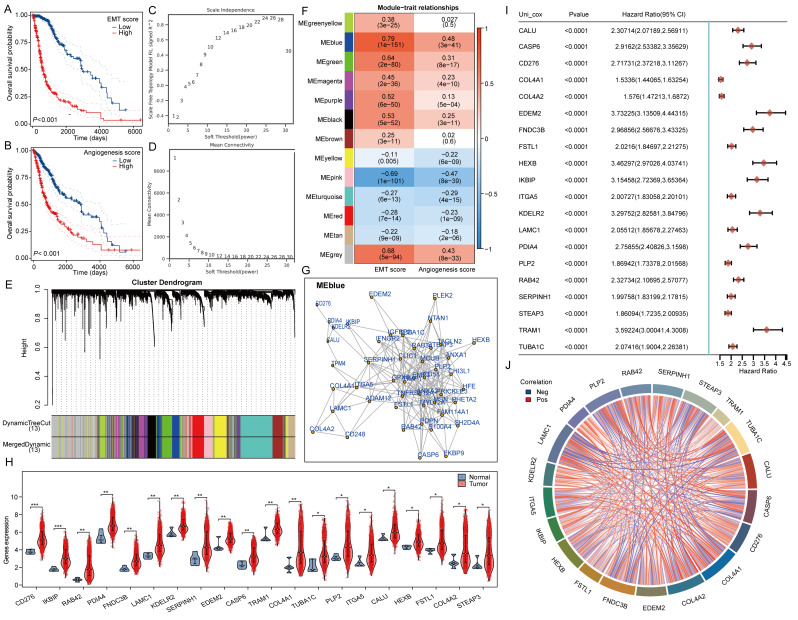
Initially, we calculated the angiogenesis and EMT scores for glioma samples from the TCGA database using the ssGSEA method, subsequently grouping the samples based on the median score. Prognostic analysis revealed that both the high angiogenesis score group and the high EMT score group exhibited poor patient prognosis (Fig. 1A-B). The analysis of gene co-expression networks aims to identify co-expressed gene modules and investigate how gene dynamics correlate with specific phenotypes of interest. The datasets TCGA-GBM and LGG comprise 153 GBM samples and 513 LGG samples, respectively. To ensure adherence to the ideal properties of scale-free network distributions, it is essential to select appropriate parameter values for the adjacency matrix weights, referred to as ‘powers.’ This power value is determined to range from 1 to 30 when calculating the corresponding correlation coefficient and average network connectivity. In this study, a power value of 22 was employed (Fig. 1C-D). To evaluate the correlation coefficients between the characteristic genes and module traits, the Pearson correlation algorithm was utilized. Notably, genes within the blue module demonstrated the strongest correlation with angiogenesis and EMT scores, with correlation coefficients of 0.79 and 0.48, respectively (Fig. 1E-F). Subsequently, we collected the top 50 genes from the blue module for interaction analysis (Fig. 1G). Among these 50 key regulatory genes, 20 were found to be highly expressed in TCGA-GBM and LGG and exhibited predictive value for prognosis (Fig. 1H-I). We also analyzed the correlation among these genes (Fig. 1J).
Fig. 1.
Illustrates the identification of essential regulatory genes using the WGCNA algorithm. (A-B) Assessment of Angiogenesis Score, EMT Score, and Patient Prognosis in Glioma cases. (C-D) Specifications for constructing the WGCNA network. (E) The upper part of the figure displays the gene clustering dendrogram generated from the weighted correlation coefficients, whereas the lower part shows how genes are distributed among different modules. (F) A heatmap depicting relationships between traits and modules. (G) Map of interactions among genes related to angiogenesis and EMT. (H) Comparative analysis of the expression levels of angiogenesis and EMT-associated genes. (I) Forest plot illustrating the prognosis associated with angiogenesis and EMT-related genes. (J) Analysis of correlations among the genes linked to angiogenesis and EMT
Functional analysis of key regulatory genes for angiogenesis and EMT
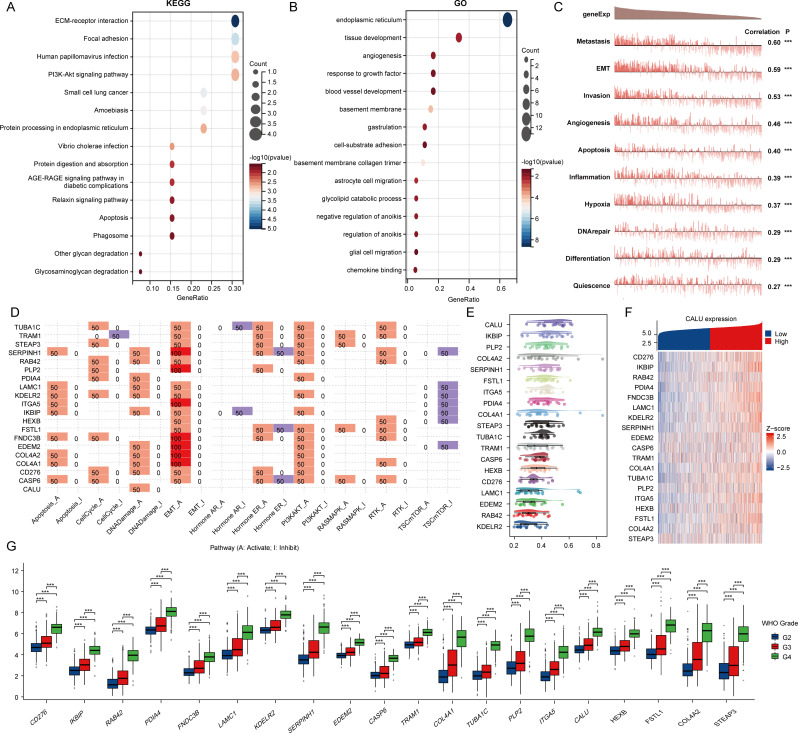
Initially, we utilized KEGG and GO analyses to explore the possible roles of genes that regulate angiogenesis and EMT. The findings from the KEGG analysis showed that these genes were linked to ECM-receptor interactions, focal adhesions, human papillomavirus infections, and the PI3K-Akt signaling pathway. Additionally, the GO enrichment analysis demonstrated that these genes were connected to the endoplasmic reticulum, tissue development, angiogenesis, and the response to growth factors (Fig. 2A-B). The CancerSEA database interprets various functional states of cancer cells at the single-cell level and serves to examine the roles of these 20 genes in gliomas. Our findings indicated that these genes play a role in metastasis, angiogenesis, invasion, and epithelial–mesenchymal transition (EMT) (Fig. 2C). Furthermore, via the GSCA database, we found that these genes were mainly linked to the activation of the PI3K-Akt signaling pathway, processes related to the cell cycle, and EMT (Fig. 2D). The objective of our analysis was to construct gene interaction networks through a friend analysis, applying network topology to evaluate the significance of genes and identify key players. Importantly, CALU was identified as the central gene within this network (Fig. 2E). Subsequently, we constructed a heat map illustrating the co-expression relationships among these genes (Fig. 2F). Finally, we analyzed the expression differences of these 20 genes across various stages. Our results indicated that all genes exhibited significant differences across different grades, with higher expression levels corresponding to higher grades (Fig. 2G).
Fig. 2.
Genes involved in angiogenesis and epithelial-mesenchymal transition (EMT). (A-B) KEGG and GO analyses for genes related to angiogenesis and EMT. (C) Functional assessment of angiogenesis and EMT-associated genes using the CancerSEA database. (D) Functional evaluation of angiogenesis and EMT-associated genes based on the GSCA database. (E) Analysis of key genes in angiogenesis and those associated with EMT through interaction studies. (F) Heatmap illustrating the co-expression of genes linked to angiogenesis and EMT. (G) Comparison of angiogenesis and EMT gene expressions between glioma and normal tissues
Consistent clustering analysis based on angiogenesis and EMT related genes
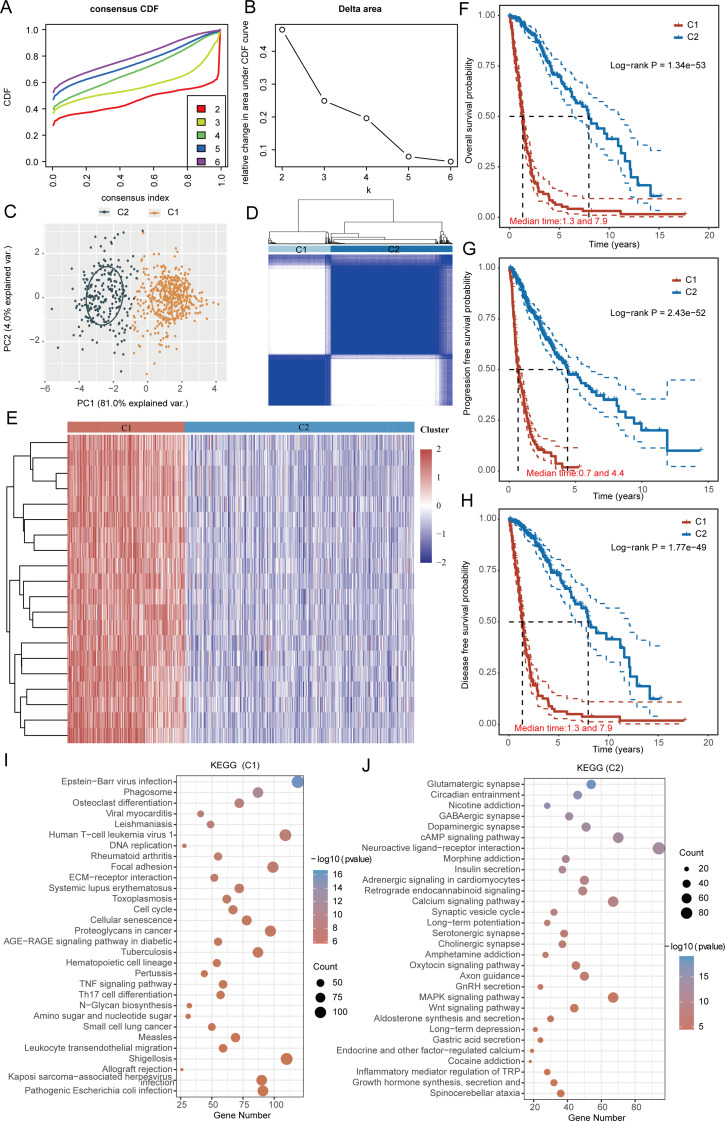
A thorough clustering analysis was conducted to examine the expression levels of genes associated with angiogenesis and EMT within the datasets from TCGA-GBM and LGG. An important technique employed in consensus clustering involves determining the optimal number of clusters, known as the K value. The analysis of the cumulative distribution curve, along with the area under this curve, demonstrates that the internal consistency of the clustering reaches its maximum when K is set to 2. This indicates that the clustering structure is optimally categorized into two groups. In addition, detailed clustering heatmaps were generated for the scenario where K equals 2, which visually represents the relationships and differences in gene expression associated with the two identified clusters (Fig. 3A-D). In this context, samples from TCGA-GBM and LGG were divided into two distinct clusters: cluster 1 comprises 225 samples, whereas cluster 2 consists of 441 samples. Significant differences in the expression levels of all genes associated with angiogenesis and EMT were observed between the two clusters, with every gene exhibiting markedly elevated levels in cluster 1 (Fig. 3E). The occurrence of angiogenesis and EMT is often associated with a worse prognosis for patients. As a result, we conducted an analysis to compare overall survival, progression-free survival, and disease-free survival outcomes between the two groups. Our results indicated that individuals in Group 1 exhibited consistently worse prognoses in terms of overall survival, progression-free survival, and disease-free survival (Fig. 3F–H). In order to explore the fundamental causes and mechanisms that lead to the marked prognostic disparities observed between the two patient groups, we performed KEGG set enrichment analysis. Our results reveal that cluster 1 samples show significant enrichment for Epstein − Barr virus infection, ECM − receptor interaction, and the TNF signaling pathway. Conversely, cluster 2 samples exhibit significant enrichment for Neuroactive ligand − receptor interaction, the Calcium signaling pathway, and the MAPK signaling pathway (Fig. 3I-J). Components in the ECM, such as collagen, fibronectin, and matrix membrane proteins, can bind to surface receptors on endothelial cells and tumor cells, leading to the release of various growth factors that activate signaling pathways and promote blood vessel growth and EMT progression [20, 24]. The activation of the TNF signaling pathway can facilitate both EMT and angiogenesis [21]. For instance, TNF can upregulate transcription factors such as Snail and Twist, which are crucial in the EMT process, resulting in alterations in cell morphology and function. Additionally, TNF can stimulate the proliferation and migration of endothelial cells within the tumor microenvironment, thereby fostering the formation of new blood vessels. In cluster 2, The activation of the MAPK signaling pathway, particularly the ERK pathway, can enhance the proliferation and migration of tumor-associated endothelial cells, thus supporting new blood vessel formation [22]. Moreover, the MAPK signaling pathway, especially the p38 and JNK pathways, plays a significant role in the EMT process by activating transcription factors, which are key regulators of EMT and promote changes in cell morphology [23]. The above conclusions all confirm the potential mechanism by which the relevant signaling pathways in cluster 1 and cluster 2 play an important role.
Fig. 3.
illustrates the classification of angiogenesis and EMT-associated genes in gliomas. (A) A representation of the cumulative distribution curve is shown. (B) The area curve of the CDF Delta is depicted. (C) A distribution map of samples is presented. (D) A heatmap demonstrating clustering is provided. (E) An analysis of the differential expression of angiogenesis and EMT genes across various clusters is performed. (F-H) The overall survival, progression-free survival, and disease-free survival differences among the clusters are assessed. (I-J) A gene enrichment analysis is carried out across the distinct clusters
Correlation analysis of angiogenesis and EMT-related genes with patients’ immunotherapy
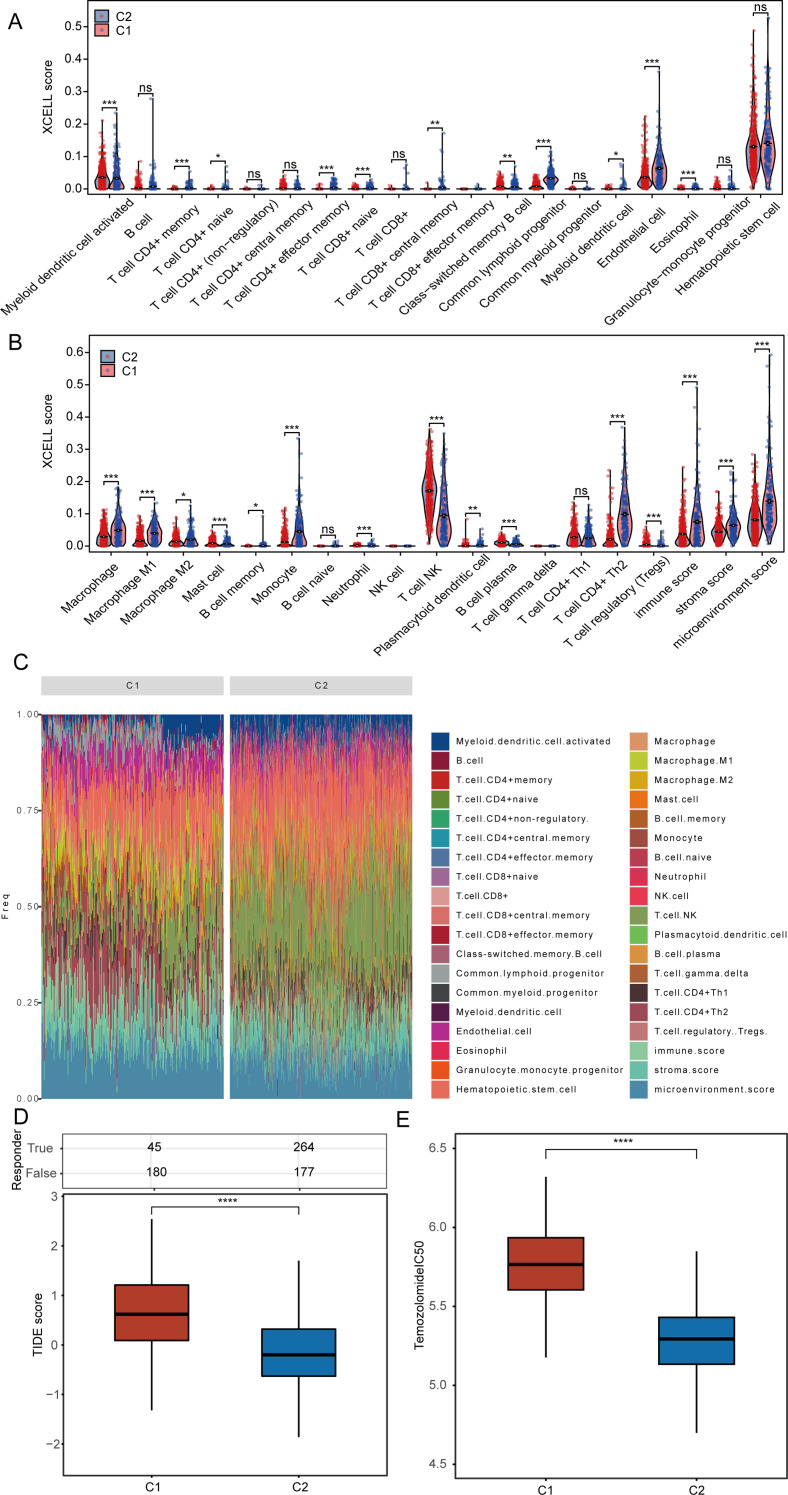
Initially, we assessed the infiltration levels of different immune cell types within the TCGA-GBM and LGG datasets by utilizing the XCELL algorithm. Notably, clusters 1 and 2 exhibited significantly increased infiltration levels of activated myeloid dendritic cells, mast cells, neutrophils, plasma B cells, regulatory T cells (Tregs), and natural killer (NK) T cells in cluster 1 when compared to cluster 2. In contrast, the levels of CD4 + memory T cells, CD4 + naive T cells, CD4 + effector memory T cells, CD8 + naive T cells, CD8 + central memory T cells, class-switched memory B cells, common lymphoid progenitors, myeloid dendritic cells, endothelial cells, eosinophils, M2 macrophages, M1 macrophages, macrophages, monocytes, plasmacytoid dendritic cells, and CD4 + Th2 T cells were found to be heightened in cluster 2 (Fig. 4A-B). Following this, we presented the percentage abundance of tumor-infiltrating immune cells for each sample from the TCGA-GBM and LGG datasets (Fig. 4C). The research results indicate that the immune score in cluster 2 is significantly higher than that in cluster 1. It is well established that a high immune score is typically associated with enhanced tumor immune activity, suggesting the presence of a greater number of anti-tumor immune cells, which can serve as a predictor for improved responses to immunotherapy. This finding also elucidates why patients in cluster 2 exhibit a better prognosis. Cancer immunotherapy encompasses therapeutic approaches that harness the immune system of the body to eradicate cancerous cells. The advent of immune checkpoint blockade (ICB) therapy has transformed cancer treatment. We utilized the Tumor Immune Dysfunction and Exclusion (TIDE) algorithm to identify two distinct subtypes for evaluating the responsiveness to immune checkpoint inhibitors. A high score on the TIDE scale suggests limited effectiveness of ICB therapy and a reduced survival duration after ICB intervention. Our findings reveal that cluster 1 has a TIDE score that is elevated, indicating that individuals within this cluster are likely to have a limited response to ICB (Fig. 4D). In addition, we examined the variations in the IC50 scores of Temozolomide across the different clusters (Fig. 4E).
Fig. 4.
Examines the relationship between angiogenesis, EMT genes, and immunotherapy. (A-B) Evaluation of the differences in immune cell infiltration across different clusters. (C) Percentage of tumor-infiltrating immune cells for each sample. (D) Assessment of patient responses to predicted immune checkpoint inhibitors in various clusters utilizing the TIDE algorithm. (E) Comparison of Temozolomide IC50 scores among clusters
Constructing prognostic models
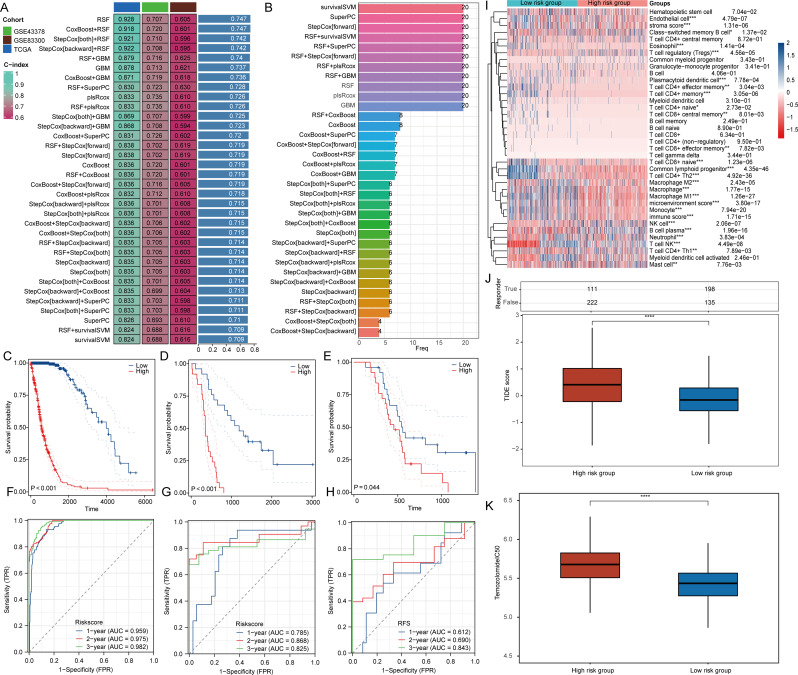
To delve deeper into the prognostic relevance of genes associated with angiogenesis and EMT in individuals diagnosed with GBM and LGG, we included the GSE43378 and GSE83300 datasets in our examination. To improve the accuracy of prognostic predictions for patients with GBM and LGG, we utilized a variety of algorithmic combinations to create prognostic models. Our findings revealed that the model developed through the Random Survival Forest (RSF) algorithm exhibited remarkable predictive performance, attaining an average area under the curve (AUC) of 0.747 across the three datasets (Fig. 5A). We also presented the number of genes included in different machine learning algorithms. The prognostic model developed by the RSF algorithm encompassed all 20 angiogenesis and EMT-related genes (Fig. 5B). Patients were stratified into groups based on the median value of the Riskscore, with those exceeding the median classified as the high-risk group and those below the median as the low-risk group. In the TCGA-GBM + LGG dataset, along with the GSE43378 and GSE83300 datasets, it was consistently observed that the overall survival rates for patients classified in the high-risk category were lower compared to those in the low-risk category (Fig. 5C-E). The predictive relevance of the risk score for patient prognosis at 1, 2, and 3 years was confirmed through Receiver Operating Characteristic (ROC) curves (Fig. 5F-H). Additionally, we examined the variations in immune cell infiltration levels between the high-risk and low-risk groups within the TCGA-GBM + LGG dataset. Our analysis demonstrated notable differences in the infiltration levels of 23 distinct types of immune cells across these groups (Fig. 5I). Moreover, we evaluated the reaction to ICB therapy and the variations in Temozolomide IC50 values between the two groups of patients. Our findings revealed that the TIDE scores, along with the Temozolomide IC50 values, were elevated in the high-risk cohort relative to the low-risk cohort. This suggests a diminished response to ICB therapy in the high-risk group, as well as a lesser sensitivity to Temozolomide when compared with the low-risk group (Fig. 5J-K).
Fig. 5.
depicts the constructed model utilizing the RSF algorithm, recognized as the most efficient prognostic model. (A) Shows AUC values for diagnostic models formulated through various algorithmic combinations. (B) Displays the number of genes included by different algorithms. (C-E) Present analyses of risk scores from two different datasets. (F-H) Investigate the predictive capacity of risk scores concerning the prognosis of glioma patients. (I) Examines the differences in immune cell infiltration levels between high-risk and low-risk cohorts. (J) Forecasts patient responses to anticipated immune checkpoint inhibitors across various clusters using the TIDE algorithm. (F) Compares differences in Temozolomide IC50 values between high-risk and low-risk groups
CALU is a key regulatory gene for angiogenesis and EMT
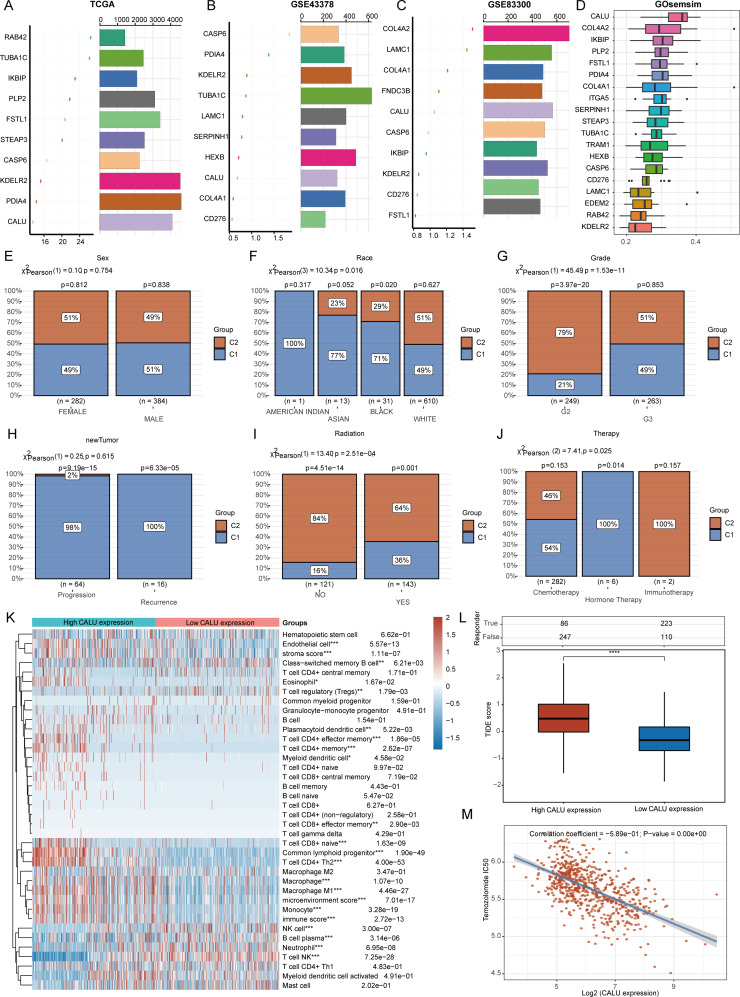
To identify the most critical genes associated with angiogenesis and EMT, we employed the random forest algorithm to determine the top ten key regulatory genes in the TCGA-GBM + LGG, GSE43378, and GSE83300 datasets. Notably, three genes—CALU, CASP6, and KDELR2—were consistently identified among the top ten genes across all three datasets (Fig. 6A-C). We further refined our selection of key genes using GOsemsim, which revealed that CALU emerged as the most significant regulatory gene; thus, we designated it as the primary regulatory gene for angiogenesis and EMT (Fig. 6D). In the TCGA-GBM + LGG dataset, we included variables such as sex, race, grade, therapy, radiation, and new tumor status to analyze CALU expression levels and the distribution of samples at various stages (Fig. 6E-J). Our analysis revealed significant differences in the distribution of individuals across cluster 1 and cluster 2, influenced by factors such as race, grade, radiotherapy status, and various treatment methods. Furthermore, we classified the TCGA-GBM + LGG samples according to the expression levels of CALU—specifically high and low—and explored the variations in the infiltration levels of different types of immune cells. Our findings revealed notable discrepancies in the infiltration levels of 19 distinct immune cell types (Fig. 6K). Furthermore, we confirmed that the CALU high expression group exhibited poorer outcomes following ICB treatment (Fig. 6L). Finally, we assessed the correlation between CALU expression and Temozolomide IC50 scores, revealing a negative correlation between the two (Fig. 6M).
Fig. 6.
illustrates the Random Forest algorithm’s identification of essential genes related to angiogenesis and epithelial-mesenchymal transition (EMT). Panels (A-D) showcase the determination of the most significant angiogenesis and EMT genes across various datasets. Panels (E-J) present a comparison of clinical characteristics distributions among the groups. Panel (K) examines the differences in levels of immune cell infiltration between groups expressing high and low levels of CALU. Panel (L) forecasts patient response to anticipated immune checkpoint inhibitors across different groups by employing the TIDE algorithm. Finally, panel (M) conducts a correlation analysis between CALU expression and the IC50 score of Temozolomide
Functional analysis of CALU in gliomas
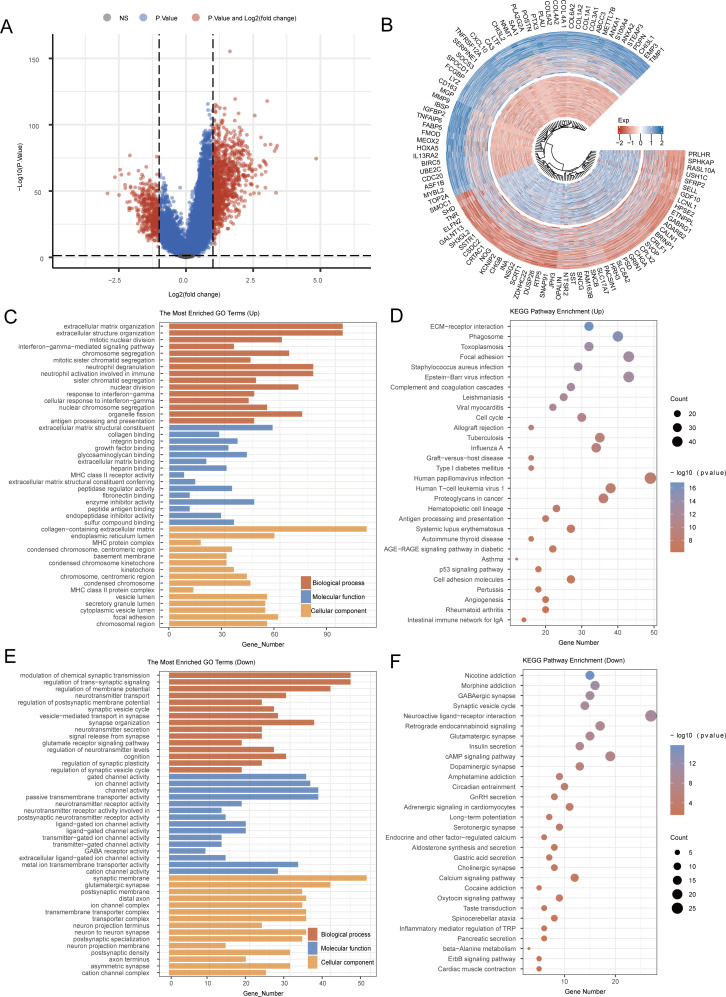
In the TCGA-GBM + LGG dataset, we established the median expression level of CALU as a benchmark. Samples with CALU expression above the median were categorized within the high CALU expression group, whereas those with lower levels were placed in the low CALU expression group (Fig. 7A-B). KEGG analysis showed that the genes with elevated expression were linked to pathways such as Human papillomavirus infection, Focal adhesion, Phagosome, ECM-receptor interaction, Human T-cell leukemia virus 1, Cell cycle, and Angiogenesis. On the other hand, the downregulated genes were associated with pathways including Neuroactive ligand-receptor interaction, cAMP signaling pathway, Retrograde endocannabinoid signaling, Morphine addiction, Calcium signaling pathway, and Oxytocin signaling pathway. GO analysis indicated that the genes that were upregulated participated in processes like extracellular matrix organization, extracellular structure organization, as well as collagen binding, collagen-containing extracellular matrix, and endoplasmic reticulum lumen. Conversely, the genes that showed downregulation were related to the modulation of chemical synaptic transmission, the regulation of membrane potential, gated channel activity, ion channel activity, synaptic membrane, and glutamatergic synapse (Fig. 7C-F). In the results presented above, we have directly enriched the angiogenesis pathway, which reflects the accuracy of our screening for key genes associated with angiogenesis and EMT. Additionally, focal adhesion serves as the connection point between cells and the ECM, playing a crucial role in cell survival, migration, proliferation, and differentiation. During angiogenesis, endothelial cells must migrate to form new blood vessels. Focal adhesion facilitates this migration and alignment of endothelial cells by providing signals that support both cell adhesion and movement. In the context of EMT, epithelial cells lose their capacity to adhere to neighboring cells and the matrix, with the disorganization of focal adhesions representing a key step in this process. This change is achieved through the downregulation of epithelial cell adhesion molecules, such as E-cadherin, and the upregulation of mesenchymal cell characteristics, such as N-cadherin. Among the results from the downregulated gene set analysis, the cAMP signaling pathway emerges as a significant regulator of cellular functions, influencing multiple processes in endothelial cells, including proliferation, migration, and blood vessel formation. An increase in cAMP can occur through various receptors, including β-adrenergic receptors, and their downstream effectors, such as protein kinase A (PKA). Furthermore, the cAMP signaling pathway plays a regulatory role in the EMT process. Studies indicate that elevated cAMP levels can modulate the expression of EMT-related transcription factors by influencing downstream signaling pathways, such as PKA and CREB. These transcription factors are instrumental in promoting the transformation of epithelial cells into mesenchymal cells. In summary, the findings presented above suggest potential mechanisms by which CALU regulates angiogenesis and EMT.
Fig. 7.
Functional analysis of CALU. (A) Heat map of differential gene expression. (B) Differential Gene Expression Circle Map. (C-F) KEGG and GO analyses for CALU
Analysis of the mechanism of action of CALU in gliomas
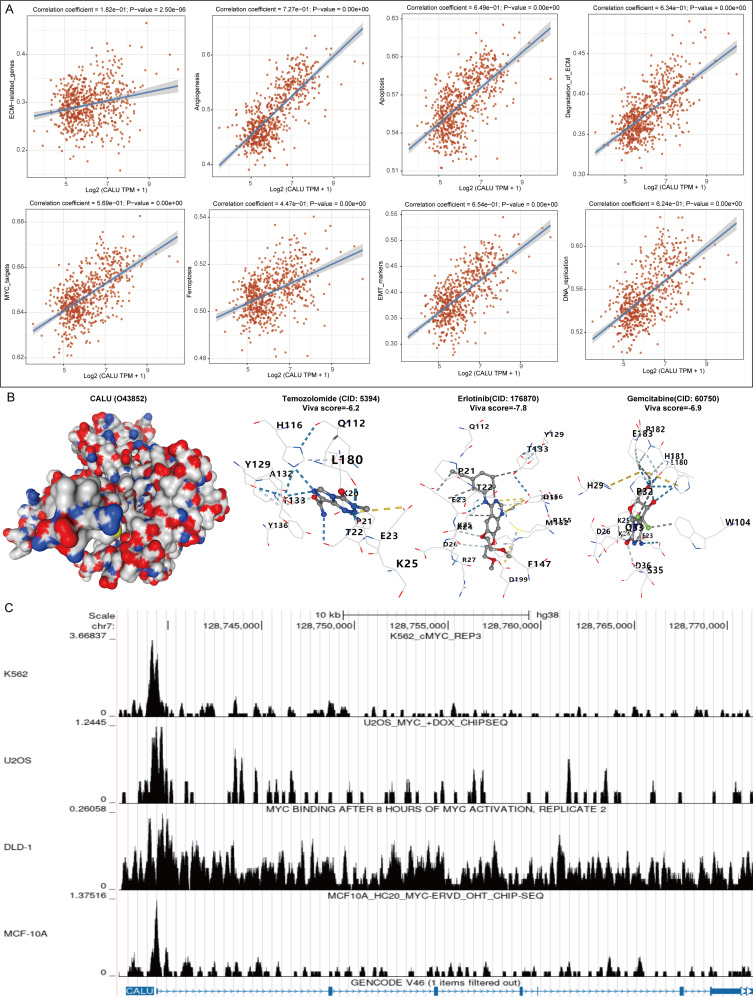
We collected gene sets associated with relevant pathways and sequentially calculated the enrichment score of each sample for each pathway using the ssGSEA algorithm, thereby establishing the connection between samples and pathways. By analyzing the correlation between CALU expression and pathway scores, we elucidated the relationship between CALU and various pathways. Our findings revealed significant connections between CALU and genes related to the extracellular matrix (ECM), angiogenesis, apoptosis, ECM degradation, MYC targets, ferroptosis, EMT markers, and DNA replication, all of which exhibited a positive regulatory relationship (Fig. 8A). To assess the potential of CALU as a drug target for glioma, we conducted molecular docking studies involving glioma therapeutic drugs and CALU to evaluate their binding affinity. We observed that the drugs examined (Temozolomide, Erlotinib, and Gemcitabine) demonstrated a strong binding ability to CALU (Fig. 8B). Based on this analysis, we identified a significant relationship between CALU and MYC, a well-known transcription factor. We further investigated the possibility of a transcriptional regulatory relationship between the two and found that MYC was significantly enriched in the promoter region of CALU (Fig. 8C).
Fig. 8.
Analysis of the mechanisms by which CALU exerts its carcinogenic effects. (A) Related Pathway Analyses for CALU. (B) Molecular docking of CALU with drugs. (C) Analysis of transcriptional regulation of CALU and MYC
Knockdown of CALU inhibits glioma progression
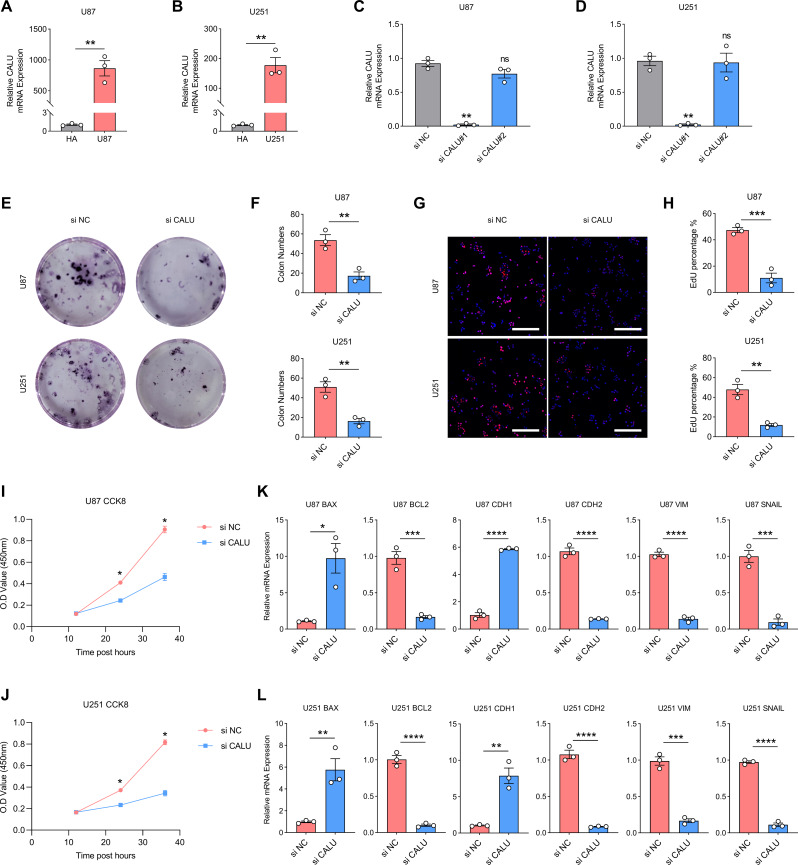
First, we detected CALU transcripts in the normal astrocyte cell line HA compared with glioma cell lines U87 and U251 by PCR. CALU transcripts were significantly upregulated in glioma cell lines (Fig. 9A and B). Based on this finding, we designed two small interfering RNAs (si CALU#1 and si CALU#2) against CALU and verified the interference efficiency in U87 and U251 cell lines. si CALU#1 exhibited the highest CALU inhibition efficiency, and subsequent experiments used si CALU#1 (si CALU) (Fig. 9C and D). Inhibition the transcription of CALU in U87 and U251 resulted in a significant decrease in the number of clones formed and a significant decrease in the percentage of EdU-positive cell counts. CCK8 suggests that cell viability of U87 and U251 was also down-regulated upon CALU inhibition (Fig. 9E and J). Finally, we examined the transcript levels of apoptosis and EMT-related markers in U87 and U251 by PCR after inhibiting CALU transcription. After CALU inhibition, the apoptosis level of glioma cells increased (BAX up-regulated; BCL2 down-regulated), while EMT markers decreased (CDH1 up-regulated; CDH2, VIM and SNAIL down-regulated) (Fig. 9K and L).
Fig. 9.
CALU promotes the progression of gliomas. (A-B) Transcript levels of CALU in HA, U87 and U251. (C-D) Detection of inhibition efficiency of small interfering RNAs. (E-F) The number of clone formation in glioma cell lines decreased after CALU inhibition. (G-H) The percentage of EdU-positive glioma cells decreased after CALU inhibition. (I-J) Cell viability of glioma cell lines decreased after CALU inhibition. (K-L) After CALU inhibition, apoptosis levels in glioma cell lines were upregulated; EMT levels were downregulated
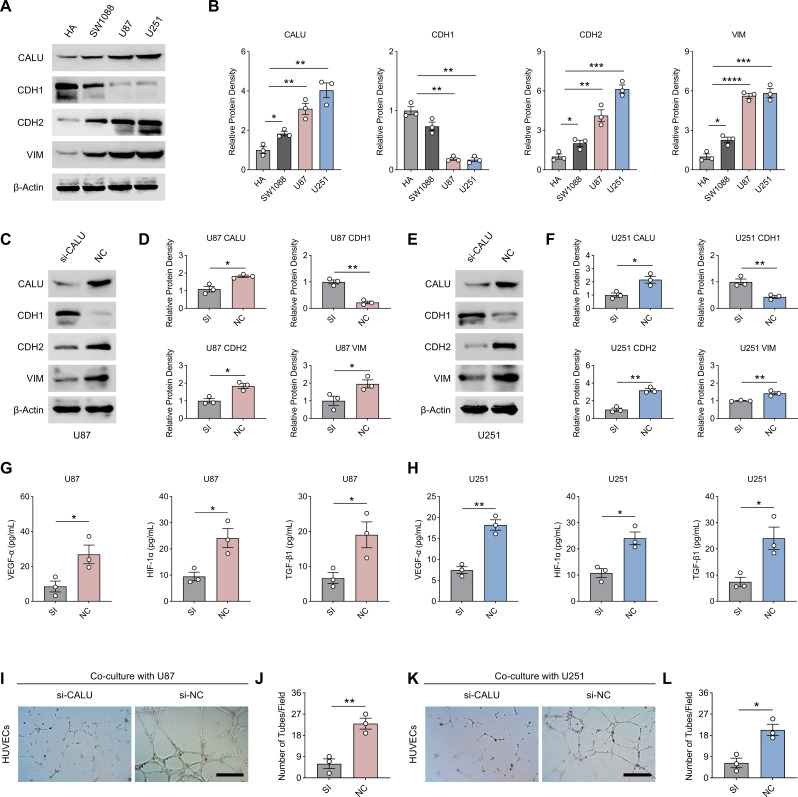
Subsequently, we detected protein concentrations of CALU as well as EMT-related markers in HA, SW1088, U87, and U251 cell lines by western-blot, with SW1088 representing LGG. Concentrations of CALU as well as EMT (decreased CDH1; increased CDH2, VIM) were significantly elevated in glioma cell lines compared to HA. SW1088, as an LGG cell line, showed a decrease in CALU and EMT compared to GBM cell lines (U87 and U251), representing an increase in CALU and EMT with tumor grade (Fig. 10A and B). To investigate whether CALU promotes EMT in glioma cell lines, we inhibited CALU expression in U87 and U251 using small interfering RNA against CALU (si-CALU). The results of Western-blot showed that si-CALU was effective (Fig. 10C and E). Ablation of CALU significantly suppressed EMT in glioma cell lines (U87 and U251) as evidenced by a reversal of CDH1 and a decrease in CDH2 and VIM (Fig. 10C and F). We also examined the concentrations of angiogenesis-related cytokines in the medium supernatants of U87 and U251 after ablation of CALU by ELISA. Ablation of CALU significantly reduced the concentrations of VEGF-α, HIF-1α, and TGF-β1 in the medium supernatants, suggesting a positive effect of CALU on tumour angiogenesis (Fig. 10G and H). The tube-forming ability of HUVECs, an endothelial cell line cultured in vitro, was significantly inhibited after CALU ablation using U87 and U251 conditioned media (Fig. 10I and L). Interestingly, ablation of CALU significantly reduced the transcript levels of CD133 and SOX2 in U87 and U251, even though we did not have glioma stem cell (GCS) validation, which could partly suggest that CALU may promote glioma stemness and recurrence (sFig 1 A-1D).
Fig. 10.
CALU promotes the EMT and angiogenesis of glioma. (A-B) Protein concentrations of CALU, CDH1, CDH2 and VIM in HA, SW1088, U87 and U251 cell lines. (C-D) Protein concentrations of CALU, CDH1, CDH2, and VIM in U87 cells of the si-CALU versus NC group. (E-F) Protein concentrations of CALU, CDH1, CDH2, and VIM in U251 cells of the si-CALU versus NC group. (G-H) Concentrations of VEGF-α, HIF-1α, and TGF-β1 in the supernatants of the culture medium of U87 and U251 cell lines from the si-CALU group versus the NC group. (I-L). The tube-forming ability of culture medium supernatants of U87 and U251 cell lines from the si-CALU group versus the NC group for HUVECs. N = 3, The results are presented as mean ± S.E.M. *≤0.05, **≤0.01, ***≤0.001, ****≤0.0001
Knockdown of CALU increases drug efficacy
To test whether knockdown of CALU can promote the efficacy of drug therapy. We examined cell viability (CCK8) as well as proliferative capacity (EdU) of U87 and U251 cell lines that received different treatments (Con, si-CALU and si-CALU + drugs). The combination of si-CALU with temozolomide, erlotinib and gemcitabine all significantly reduced the cell viability and proliferation of U87 and U251, suggesting that ablation of CALU contributes to the enhancement of drug efficacy (sFig 2 and sFig 3).
MYC regulates CALU to promote glioma progression
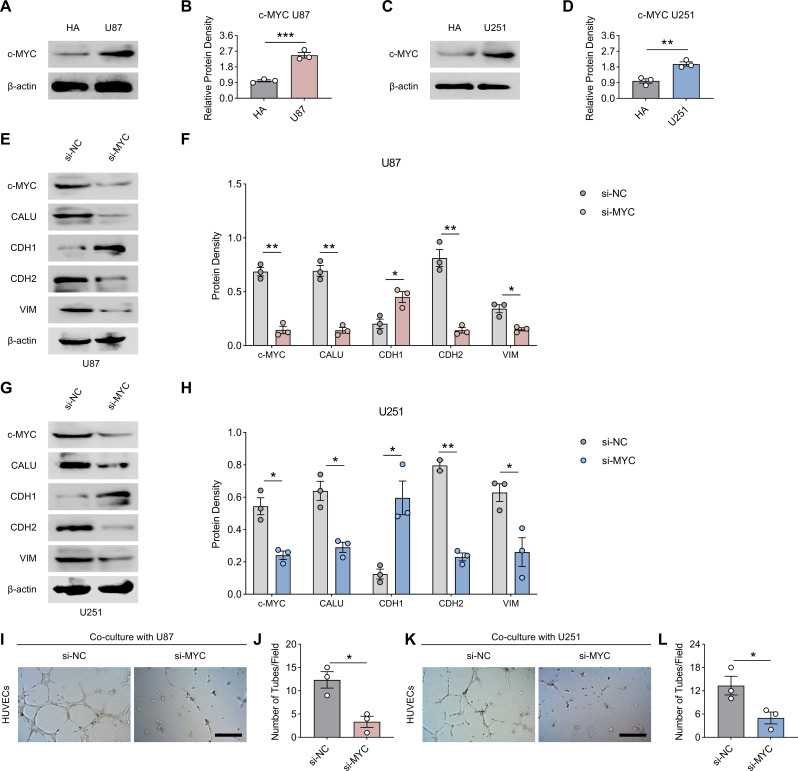
Since the results of bioinformatics suggested that CALU was regulated by c-MYC (MYC), we examined the protein concentration of MYC in U87 and U251 cell lines firstly, and the results of western-blot suggested that the expression of MYC was up-regulated in U87 and U251 compared to HA (Fig. 11A and D). Subsequently, we constructed MYC-knockdown cell lines of U87 and U251. After MYC ablation, protein concentration of CALU decreased significantly and was accompanied by a decrease in EMT (recovery of CDH1, decrease in CDH2 and VIM) in U87 and U251 (Fig. 11E and H). Also, the medium supernatants of U87 and U251 after CALU ablation did not promote the tube-forming ability of HUVECs (Fig. 11I and L).
Fig. 11.
MYC regulates CALU to promote glioma progression. (A-D) Protein concentration of MYC in HA, U87 and U251 cell lines. (E-H) Protein concentrations of MYC, CALU, CDH1, CDH2 and VIM in U87 and U251 cell lines from the si-NC group versus si-CALU group. (I-L) The number of clone formation in glioma cell lines decreased after CALU inhibition. N = 3, The results are presented as mean ± S.E.M. *≤0.05, **≤0.01, ***≤0.001, ****≤0.0001
Discussion
Tumors of the central nervous system most commonly include gliomas, which are marked by their rapid growth and aggressive characteristics [24]. Although there have been improvements in treatment approaches, glioma patients experience notable differences in overall survival rates, largely due to elevated instances of local recurrence and progression of malignancy [20]. Hence, it is essential to discover new and effective molecular biomarkers to improve outcomes for patients.
In our study, we initially employed the ssGSEA algorithm to compute the angiogenesis and EMT scores for each sample in the TCGA-GBM + LGG dataset, subsequently analyzing the correlation between these scores and patient prognosis. Given that both angiogenesis and EMT are processes that facilitate tumor progression, it is consistent that patients exhibiting elevated angiogenesis and EMT scores experience poorer prognoses. Utilizing the WGCNA algorithm, we identified the top 50 genes most closely associated with angiogenesis and EMT. By integrating these identified genes with those linked to prognostic risk in the TCGA-GBM + LGG dataset, we discovered 20 significantly different genes. CancerSEA serves as a specialized database offering insights into the diverse functional states observed in cancer cells at the single-cell level [21]. Utilizing the CancerSEA platform, we examined the potential roles of these 20 genes in relation to glioma. Our results suggest that these genes primarily support processes like EMT, cell proliferation, and invasion in glioma. Earlier research has recognized IKBIP as a new biomarker linked to EMT that forecasts unfavorable survival outcomes in glioma [22]. Additionally, PDIA4 has been shown to be linked with unfavorable outcomes and serves as a potential biomarker for glioma [23]. Taken together, these findings highlight the important contributions of the genes we have identified in glioma. Functional analysis indicated significant connections between genes related to lymph node metastasis and the processes of apoptosis activation and cell cycle regulation. It is well recognized that the cell cycle is vital to tumor development, and many targeted therapies for glioma operate mainly by influencing apoptosis [29]. The results obtained further support the dependability of the angiogenesis and EMT-related genes that we previously detailed. Cluster classification serves as a technique for categorizing similar samples based on the shared features and differences identified within the data, facilitating the division of various samples into distinct clusters that highlight their individual characteristics and connections. This technique is extensively utilized across multiple disciplines, including disease diagnosis, prognosis assessment, gene therapy, epidemiology, and the analysis of medical imagery. In our study, we employed cluster analysis to categorize glioma samples into two distinct groups, with cluster 1 exhibiting a significantly worse prognosis compared to cluster 2. Gene enrichment analysis revealed a significant association between cluster 1 and pathways related to cellular senescence and the cell cycle. Although cellular senescence is often perceived as a mechanism for tumor suppression, it is important to acknowledge that senescent cells can demonstrate heightened invasiveness and enhanced angiogenic properties, which are linked to the development of a senescence-associated secretory phenotype [30]. Recent studies have indicated a connection between cellular senescence and the progression of colorectal cancer to more advanced metastatic stages [31]. In comparison to cluster 2, cluster 1 showed a notably elevated TIDE score, corresponding with the poor prognosis observed in cluster 1.
The field of machine learning offers a robust approach to identifying essential genes, particularly those related to the diagnosis and prediction of tumor outcomes. Prognostic models developed from these genes demonstrated notable accuracy in predictions. Utilizing the random forest algorithm highlighted the critical role of CALU in predicting glioma outcomes. Our experimental results confirmed the considerable predictive importance of CALU in glioma prognosis.
Conclusion
This research employed a range of machine learning techniques to pinpoint essential genes linked to angiogenesis and EMT in glioma. The results support a relationship between these genes and both patient prognosis and the efficacy of immunotherapy in glioma cases. Notably, we recognized CALU as a new prognostic indicator for glioma.
Electronic supplementary material
Below is the link to the electronic supplementary material.
Acknowledgements
N/A.
Author contributions
S.F., L.Z., and Y.Q. contributed equally to this work. S.F., L.Z., and Y.Q. wrote the main manuscript text. K.K. and Y.L. prepared the figures and tables. G.Z. performed the data analysis. Z.W., H.L., and R.S. conceived and designed the study. All authors reviewed and approved the final manuscript.
Funding
This work was funded by General Project of Jiangsu Provincial Health Commission (H2023090), Top Talent Support Program for young and middle-aged people of Wuxi Health Committee (HB2023047) and General Project of Nantong Municipal Health Commission (MS2023081).
Data availability
No datasets were generated or analysed during the current study.
Declarations
Ethics approval and consent to participate
N/A.
Conflict of interest
The authors declare that the research was conducted without any commercial or financial relationships that could be construed as a potential conflict of interest.
Footnotes
Publisher’s note
Springer Nature remains neutral with regard to jurisdictional claims in published maps and institutional affiliations.
Suyin Feng, Long Zhu and Yan Qin contributed equally to this work.
Contributor Information
Ziheng Wang, Email: zihengwang@um.edu.mo.
Hua Lu, Email: luhua1969@hotmail.com.
Runfeng Sun, Email: 13851211100@139.com.
References
- 1.Chen Z, Xie H, Liu J, Zhao J, Huang R, Xiang Y, Wu H, Tian D, Bian E, Xiong Z. Roles of TRPM channels in glioma. Cancer Biol Ther. 2024;25(1):2338955. 10.1080/15384047.2024.2338955. [DOI] [PMC free article] [PubMed] [Google Scholar]
- 2.Dai F, Yuan Y, Hao J, Cheng X, Zhou X, Zhou L, Tian R, Zhao Y, Xiang T. PDCD2 as a prognostic biomarker in glioma correlates with malignant phenotype. Genes Dis. 2023;11(5):101106. 10.1016/j.gendis.2023.101106. [DOI] [PMC free article] [PubMed] [Google Scholar]
- 3.Zhuang J, Miao C, Liu C, Zeng B, Hu L, Peng J, Xia Y, Chen Z. Exploring the impact of ITGB2 on glioma progression and treatment: insights from non-apoptotic cell death and immunotherapy. Environ Toxicol. 2024 Mar;15. 10.1002/tox.24231. [DOI] [PubMed]
- 4.Zhao B, Yao L, Hatami M, Ma W, Skutella T. Vaccine-based immunotherapy and related preclinical models for glioma. Trends Mol Med. 2024 Jul 15:S1471-4914(24)00167-9. 10.1016/j.molmed.2024.06.009 [DOI] [PubMed]
- 5.Ishikawa E, Miyazaki T, Takano S, Akutsu H. Anti-angiogenic and macrophage-based therapeutic strategies for glioma immunotherapy. Brain Tumor Pathol. 2021;38(3):149–55. 10.1007/s10014-021-00402-5. [DOI] [PubMed] [Google Scholar]
- 6.Wang Y, Wang J, Zhang L, He J, Ji B, Wang J, Ding B, Ren M. Unveiling the role of YARS1 in bladder cancer: a prognostic biomarker and therapeutic target. J Cell Mol Med. 2024;28(7):1–20. 10.1111/jcmm.18213. [DOI] [PMC free article] [PubMed] [Google Scholar]
- 7.Li J, Yang J, Jiang S, Tian Y, Zhang Y, Xu L, Hu B, Shi H, Li Z, Ran G, Huang Y, Ruan S. Targeted reprogramming of tumor-associated macrophages for overcoming glioblastoma resistance to chemotherapy and immunotherapy. Biomaterials. 2024;311:122708. 10.1016/j.biomaterials.2024.122708. [DOI] [PubMed] [Google Scholar]
- 8.Wang Y, Wang J, He J, Ji B, Pang Z, Wang J, Liu Y, Ren M. Comprehensive analysis of PRPF19 immune infiltrates, DNA methylation, senescence-associated secretory phenotype and ceRNA network in bladder cancer. Front Immunol. 2023;14:1289198. 10.3389/fimmu.2023.1289198. [DOI] [PMC free article] [PubMed] [Google Scholar]
- 9.Lu J, Huo W, Ma Y, Wang X, Yu J. Suppressive immune microenvironment and CART therapy for glioblastoma: future prospects and challenges. Cancer Lett 2024 Aug 12:217185. 10.1016/j.canlet.2024.217185 [DOI] [PubMed]
- 10.Wang Y, Ji B, Zhang L, Wang J, He J, Ding B, Ren M. Identification of metastasis-related genes for predicting prostate cancer diagnosis, metastasis and immunotherapy drug candidates using machine learning approaches. Biol Direct. 2024;19(1):50. 10.1186/s13062-024-00494-x. [DOI] [PMC free article] [PubMed] [Google Scholar]
- 11.Yu W, Chen D, Ma L, Lin Y, Zheng J, Li X. EIF4A3-Induced Circ_0059914 promoted angiogenesis and EMT of Glioma via the miR-1249/VEGFA pathway. Mol Neurobiol. 2024 Jul;1. 10.1007/s12035-024-04319-w. [DOI] [PubMed]
- 12.Ishikawa E, Miyazaki T. [Benefits and prospects of VEGF-targeted anti-angiogenic therapy and immunotherapy for high-grade Glioma]. No Shinkei Geka. 2021;49(3):597–607. 10.11477/mf.1436204433. Japanese. [DOI] [PubMed] [Google Scholar]
- 13.Lu E, Zhao B, Yuan C, Liang Y, Wang X, Yang G. Novel cancer-fighting role of ticagrelor inhibits GTSE1-induced EMT by regulating PI3K/Akt/NF-κB signaling pathway in malignant glioma. Heliyon. 2024;10(9):e30833. 10.1016/j.heliyon.2024.e30833. [DOI] [PMC free article] [PubMed] [Google Scholar]
- 14.Merk L, Regel K, Eckhardt H, Evers M, El-Ayoubi A, Mittelbronn M, Krüger M, Gérardy JJ, Mack AF, Naumann U. Blocking TGF-β- and epithelial-to-mesenchymal transition (EMT)-mediated activation of vessel-associated mural cells in glioblastoma impacts tumor angiogenesis. Free Neuropathol. 2024;5:5–4. 10.17879/freeneuropathology-2024-5188. [DOI] [PMC free article] [PubMed] [Google Scholar]
- 15.Bi Y, Ji J, Zhou Y. LncRNA-PVT1 indicates a poor prognosis and promotes angiogenesis via activating the HNF1B/EMT axis in glioma. J Cancer. 2021;12(19):5732–44. 10.7150/jca.60257. [DOI] [PMC free article] [PubMed] [Google Scholar]
- 16.Wang Y, Li C, He J, Zhao Q, Zhou Y, Sun H, Zhu H, Ding B, Ren M. Multi-omics analysis and experimental validation of the value of monocyte-associated features in prostate cancer prognosis and immunotherapy. Front Immunol. 2024;15:1426474. 10.3389/fimmu.2024.1426474. [DOI] [PMC free article] [PubMed] [Google Scholar]
- 17.Wang Y, He J, Zhao Q, Bo J, Zhou Y, Sun H, Ding B, Ren M. Evaluating the predictive value of angiogenesis-related genes for prognosis and immunotherapy response in prostate adenocarcinoma using machine learning and experimental approaches. Front Immunol. 2024;15:1416914. 10.3389/fimmu.2024.1416914. [DOI] [PMC free article] [PubMed] [Google Scholar]
- 18.Sturm G, Finotello F, Petitprez F, Zhang JD, Baumbach J, Fridman WH, List M, Aneichyk T. Comprehensive evaluation of transcriptome-based cell-type quantification methods for immuno-oncology. Bioinformatics. 2019;35(14):i436–45. 10.1093/bioinformatics/btz363. [DOI] [PMC free article] [PubMed] [Google Scholar]
- 19.Balcioglu HE, van de Water B, Danen EH. Tumor-induced remote ECM network orientation steers angiogenesis. Sci Rep. 2016;6:22580. 10.1038/srep22580. [DOI] [PMC free article] [PubMed] [Google Scholar]
- 20.Wu Y, Gong Y, Ma Y, Zhao Q, Fu R, Zhang X, Li Y, Zhi X. Effects of vitamin D status on cutaneous wound healing through modulation of EMT and ECM. J Nutr Biochem. 2024;134:109733. 10.1016/j.jnutbio.2024.109733. [DOI] [PubMed] [Google Scholar]
- 21.Liu BX, Xie Y, Zhang J, Zeng S, Li J, Tao Q, Yang J, Chen Y, Zeng C. SERPINB5 promotes colorectal cancer invasion and migration by promoting EMT and angiogenesis via the TNF-α/NF-κB pathway. Int Immunopharmacol. 2024;131:111759. 10.1016/j.intimp.2024.111759. [DOI] [PubMed] [Google Scholar]
- 22.Deng H, Xu Q, Li XT, Huang X, Liu JY, Yan R, Quan ZS, Shen QK, Guo HY. Design, synthesis, and evaluation of antitumor activity in Pseudolaric acid B azole derivatives: Novel and potent angiogenesis inhibitor via regulation of the PI3K/AKT and MAPK mediated HIF-1/VEGF signaling pathway. Eur J Med Chem. 2024;278:116813. 10.1016/j.ejmech.2024.116813. [DOI] [PubMed] [Google Scholar]
- 23.Luo X, Wen S, Zeng J, Liu J, Ye W, Wu J, Huang S, Xie W, Wen H, Sun Y, Cai J, Mo D, Lin Q, Chen M, Xia S, Song Y. AOPPs induces EMT and fibrosis by activating oxidative stress through ERK/p38 MAPK signaling pathway in endometriosis. Reprod Biol. 2024;24(4):100950. 10.1016/j.repbio.2024.100950. [DOI] [PubMed] [Google Scholar]
- 24.Mao F, Wang B, Xiao Q, Cheng F, Lei T, Guo D. LRIG proteins in glioma: functional roles, molecular mechanisms, and potential clinical implications. J Neurol Sci. 2017;383:56–60. 10.1016/j.jns.2017.10.025. [DOI] [PubMed] [Google Scholar]
- 25.Li J, Wang S, Chi X, He Q, Tao C, Ding Y, Wang J, Zhao J, Wang W. Identification of heterogeneous subtypes and a prognostic model for gliomas based on mitochondrial dysfunction and oxidative stress-related genes. Front Immunol. 2023;14:1183475. 10.3389/fimmu.2023.1183475. [DOI] [PMC free article] [PubMed] [Google Scholar]
- 26.Yuan H, Yan M, Zhang G, Liu W, Deng C, Liao G, Xu L, Luo T, Yan H, Long Z, Shi A, Zhao T, Xiao Y, Li X. CancerSEA: a cancer single-cell state atlas. Nucleic Acids Res. 2019;47(D1):D900–8. 10.1093/nar/gky939. [DOI] [PMC free article] [PubMed] [Google Scholar]
- 27.Yang Y, Wang J, Xu S, Lv W, Shi F, Shan A. IKBIP is a novel EMT-related biomarker and predicts poor survival in glioma. Transl Neurosci. 2021;12(1):9–19. 10.1515/tnsci-2021-0002. [DOI] [PMC free article] [PubMed] [Google Scholar]
- 28.Li H, Liu Q, Xiao K, He Z, Wu C, Sun J, Chen X, Chen S, Yang J, Ma Q, Su J. PDIA4 correlates with poor prognosis and is a potential biomarker in Glioma. Onco Targets Ther. 2021;14:125–38. 10.2147/OTT.S287931. [DOI] [PMC free article] [PubMed] [Google Scholar]
- 29.Younis M, Shaikh S, Shahzad KA, Tan F, Wang Z, Lashari MH. Amrubicin encapsulated PLGA NPs inhibits the PI3K/AKT signaling pathway by activating PTEN and inducing apoptosis in TMZ-resistant glioma. Biomed Mater. 2024;19(2). 10.1088/1748-605X/ad1bb2. [DOI] [PubMed]
- 30.Banerjee P, Gaddam N, Pandita TK, Chakraborty S. Cellular Senescence as a Brake or Accelerator for Oncogenic Transformation and Role in Lymphatic Metastasis. Int J Mol Sci. 2023;24(3):2877. 10.3390/ijms24032877. [DOI] [PMC free article] [PubMed] [Google Scholar]
- 31.Park SS, Lee YK, Choi YW, Lim SB, Park SH, Kim HK, Shin JS, Kim YH, Lee DH, Kim JH, Park TJ. Cellular senescence is associated with the spatial evolution toward a higher metastatic phenotype in colorectal cancer. Cell Rep. 2024;43(3):113912. 10.1016/j.celrep.2024.113912. [DOI] [PubMed] [Google Scholar]
Associated Data
This section collects any data citations, data availability statements, or supplementary materials included in this article.
Supplementary Materials
Data Availability Statement
No datasets were generated or analysed during the current study.


