
Figure 4.
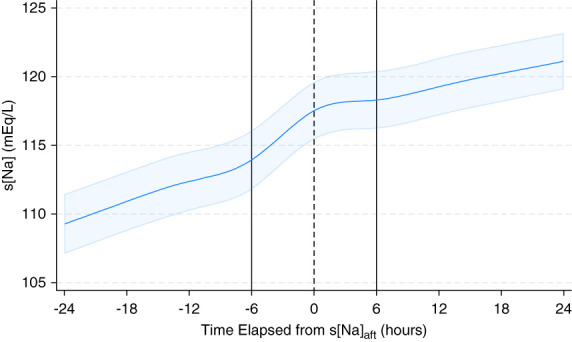
Changes in s[Na] over time after the s[Na]aft measurement. A restricted cubic spline model was used to depict changes in s[Na] levels over time in patients who experienced water diuresis. The solid curve represents the predicted trajectory of s[Na], while the surrounding shaded area indicates its 95% confidence interval. s[Na]aft, serum sodium concentration immediately after manifestation of water diuresis.