

Abstract
Quizartinib prolongs QT interval through inhibition of the slow delayed rectifier potassium current (IKs). We used non‐linear mixed‐effects modeling to explore the relationship between quizartinib and its pharmacologically active metabolite AC886 and the Fridericia‐corrected QT interval (QTcF) in newly diagnosed acute myeloid leukemia (AML) patients. We evaluated linear and non‐linear drug effect models, using triplicate QTcF measurements with available time‐matched pharmacokinetic samples from the Phase 3 QuANTUM‐First trial. The effect of intrinsic and extrinsic factors on model parameters was tested using stepwise covariate model building. Simulations were conducted to predict the change from baseline in QTcF (ΔQTcF) at the maximum concentration at steady‐state (C max,ss) for quizartinib maintenance daily doses of 30 and 60 mg. The concentration‐QTcF (C‐QTcF) relationship was best described by a sigmoidal maximum effect model. After accounting for the effect of quizartinib, including AC886 concentrations did not further explain changes in QTcF. Circadian variations in QTcF were described using an empirical change from baseline based on clock times. Age and hypokalaemia were identified as statistically significant covariates on baseline QTcF; no covariates were found to impact the C‐QTcF relationship. The median model‐predicted ΔQTcF at C max,ss was 18.4 ms (90% confidence interval (CI): 16.3–20.5) at 30 mg and 24.1 ms (90% CI: 21.4–26.6) at 60 mg. In conclusion, in newly diagnosed AML patients, ΔQTcF increased non‐linearly with increasing quizartinib concentrations. The predicted ΔQTcF increase at C max,ss supports the proposed dose adaptation based on observed QTcF and the dose reduction in case of strong cytochrome P450 3A (CYP3A) inhibitors coadministration.
Study Highlights.
WHAT IS THE CURRENT KNOWLEDGE ON THE TOPIC?
The exposure‐response relationship of quizartinib with the Fridericia‐corrected QT (QTcF) was previously described in patients with relapsed/refractory (R/R) acute myeloid leukemia (AML) receiving quizartinib monotherapy based on data from the QuANTUM‐R trial (NCT02039726).
WHAT QUESTION DID THIS STUDY ADDRESS?
What is the exposure‐response relationship of quizartinib with the Fridericia‐corrected QT (QTcF) in newly diagnosed AML patients receiving quizartinib in addition to standard induction and consolidation chemotherapy, and followed by quizartinib maintenance monotherapy?
WHAT DOES THIS STUDY ADD TO OUR KNOWLEDGE?
The concentration‐QTcF relationship for quizartinib was characterized in patients with newly diagnosed AML based on data from the QuANTUM‐First trial (NCT02668653). Using the developed concentration‐QTcF model, the risk of QTcF prolongation at various doses of quizartinib can be predicted in patients with newly diagnosed AML.
HOW MIGHT THIS CHANGE CLINICAL PHARMACOLOGY OR TRANSLATIONAL SCIENCE?
This analysis further supported the dose‐modification algorithm applied in QuANTUM‐First trial, basing dose adjustments on observed QTcF prolongation and/or concomitant administration of strong cytochrome P450 3A (CYP3A) inhibitors.
INTRODUCTION
In acute myeloid leukemia (AML), the Feline McDonough Sarcoma (FMS)‐like receptor tyrosine kinase 3 (FLT3) is frequently activated by mutations or overexpressed, both of which are associated with worse survival outcomes. 1 , 2 , 3 , 4 Quizartinib is an orally‐administered, highly‐potent type II FLT3 inhibitor, indicated for the treatment of AML. 5 Single‐agent quizartinib treatment resulted in improved overall survival (OS) in relapsed/refractory (R/R) FLT3‐Internal‐Tandem Duplaciation (ITD)‐positive AML patients compared to salvage chemotherapy in the Phase 3 QuANTUM‐R clinical trial. 6 The addition of quizartinib to standard induction and consolidation chemotherapy, followed by continuation with quizartinib monotherapy for up to 3 years, also improved OS compared to placebo in newly diagnosed FLT3‐ITD‐positive AML patients in the Phase 3 QuANTUM‐First trial. 7 Quizartinib's main circulating pharmacologically active metabolite, AC886, is also a potent FLT3 inhibitor.
Quizartinib has a generally acceptable safety profile. However, it is known to prolong the QT interval through inhibition of the slowly activating component of delayed rectifier potassium currents (IKs), responsible for ventricular muscle action and cardiac repolarization. 8 , 9 Since QT prolongation is associated with an increased risk of life‐threatening arrhythmias, 10 the QT interval was closely monitored throughout the QuANTUM‐First trial and a dose‐modification algorithm was implemented in case of elevated Fridericia‐corrected QT (QTcF) measurements. By applying these dose modifications and correcting electrolyte atypicalities, most QT prolongation events during the study were clinically manageable. There was only 2% QTcF prolongation >500 ms in the quizartinib group and 1% in the placebo group, no incident of torsade de pointes, and only two patients in the quizartinib group had a cardiac arrest with recorded ventricular fibrillation. 7 Dose reductions were also applied for patients concomitantly receiving strong cytochrome P450 3A (CYP3A) inhibitors, as their use significantly increases quizartinib exposure. 8 , 11
The objective of this analysis was to characterize the concentration‐QTcF (C‐QTcF) relationship for quizartinib and to further assess the dose adjustment strategies tested in the QuANTUM‐First trial.
METHODS
Clinical data
The data used for the C‐QTcF analysis originated from the Phase 3 QuANTUM‐First trial. The study protocol was approved by the institutional review board or ethics committee at each participating site; the study was conducted in accordance with Good Clinical Practice guidelines and adhered to the Declaration of Helsinki. All patients provided written informed consent before enrolment in the study.
Data availability statement
Anonymized individual participant data (IPD) and applicable supporting clinical study documents may be available upon request at https://vivli.org/. In cases where clinical study data and supporting documents are provided pursuant to our company policies and procedures, Daiichi Sankyo Companies will continue to protect the privacy of the company and our clinical study subjects. Details on data sharing criteria and the procedure for requesting access can be found at this web address: https://vivli.org/ourmember/daiichi‐sankyo/.
An overview of the QuANTUM‐First trial design is provided in Figure 1. Overall, 539 newly diagnosed FLT‐ITD‐positive AML patients aged 20–75 years were randomly assigned (1:1) to the quizartinib or the placebo arm. 7 Patients entered the induction phase to receive 40 mg quizartinib/placebo once daily in addition to standard chemotherapy with cytarabine and anthracycline. Patients showing remission could proceed to the consolidation phase, to receive standard high‐dose cytarabine plus 40 mg daily quizartinib/placebo, or allogeneic hematopoietic stem cell transplantation (allo‐HSCT), or both. Following consolidation, patients with blood count recovery could move forward to the continuation phase to receive quizartinib/placebo as monotherapy, starting at 30 mg/day and increasing to 60 mg/day on Day 15 if QTcF was less than or equal to 450 ms. 7
FIGURE 1.
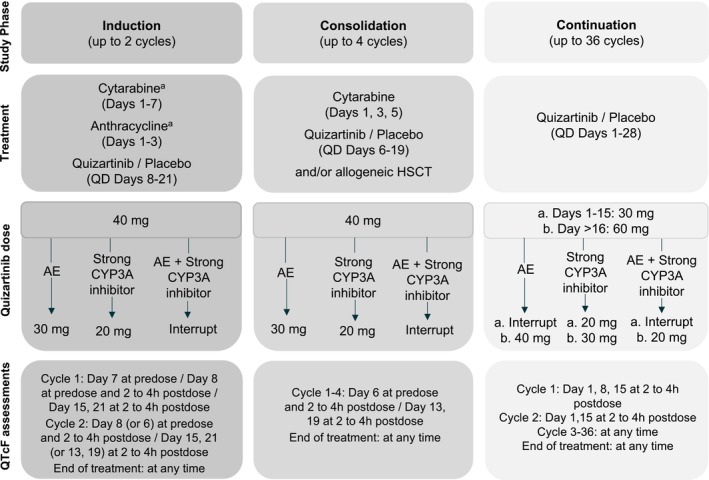
Illustration of the QuANTUM‐First study design, dose‐modification algorithm, and QTcF assessment time points. AE, Adverse event (QTcF prolongation, myelosuppression, or other non‐hematological toxicities); CYP3A, Cytochrome P450 3A; HSCT, Hematopoietic stem cell transplantation; QD, Once daily. aDuring Induction Cycle 2 investigators chose to administer the “7 + 3” chemotherapy regimen, or the “5 + 2” chemotherapy regimen, and quizartinib/placebo started therefore on Day 8 or Day 6, respectively.
QT measurements were obtained from triplicate electrocardiogram (ECG) readouts and were then automatically converted to QTcF using the Fridericia formula (Equation 1). 12
| (1) |
where RR is the interval between two consecutive R waves on the ECG.
As quizartinib does not significantly change heart rate (mean change ≤10 beats per minute; unpublished data), QTcF is usually considered a sufficient correction method for QT. 13
Dose modifications were implemented throughout the trial to ensure patient safety. The dose reduction/interruption algorithm is schematically presented in Figure 1. The dose of quizartinib was reduced to 30 mg in case of adverse events (AEs), that is, QTcF prolongation, myelosuppression, or other non‐hematological toxicities. Also, the dose was reduced to 20 mg in case of concomitant use of strong CYP3A inhibitors. Dose interruptions occurred when both conditions for dose reduction were met, that is, when patients received strong CYP3A inhibitors and experienced one of the specified AEs at the same time.
A specific dose‐modification algorithm was applied in patients who experienced QTcF prolongation >480 ms, based on the mean QTcF value of the triplicate ECG:
If 480 ms < QTcF < 500 ms, then the dose was reduced by one level. The previous (higher) dose could be resumed in the following cycle if QTcF decreased to 30 ms from baseline or <450 ms.
If QTcF >500 ms, then dosing was interrupted for up to 14 days. If QTcF decreased to 30 ms from baseline or <450 ms within the 14 days, patients were allowed to resume quizartinib at a reduced dose level.
If QTcF >500 ms during the induction or consolidation phase, then patients could not be escalated to 60 mg during continuation.
Only if QTcF ≤450 ms on cycle 1, day 15, patients were escalated to 60 mg during continuation. Accordingly, patients treated with strong CYP3A4 inhibitors, who started the continuation phase at 20 mg, could increase their dose to 30 mg if QTcF was ≤450 on cycle 1, day 15. If the dose could not be increased on cycle 1 day 16, it could also be increased on cycle 2 day 2, provided that QTcF ≤450 ms.
If recurrent QTcF >500 ms despite appropriate dose reduction and elimination of other risk factors (e.g., abnormalities in electrolyte levels or concomitant use of other QT‐prolonging drugs), then quizartinib was permanently discontinued.
The C‐QTcF analysis population was defined as all patients who received at least one dose of quizartinib/placebo and had at least one QTcF observation with a time‐matched pharmacokinetic (PK) sample available. The triplicate QTcF measurements were not averaged but used as such in the analysis. Time points for the QTcF assessment in QuANTUM‐First are provided in Figure 1.
In light of the high shrinkage obtained for the absorption‐related parameters in the population PK models of quizartinib and AC886, 11 the C‐QTcF analysis was conducted using observed concentrations rather than model‐predicted ones. QTcF data and concentration records were matched by comparing the actual date/time of each replicate QTcF measurement vs. the date/time of the corresponding concentration measurement. The difference in time between the two measurements was computed and used to determine whether the replicate QTcF measurements met the criteria to be matched with the concentration. A difference of ≤30 min was allowed for all time points except for the predose QTcF measurements, for which a difference of up to 90 min was allowed. After time‐matching of QTcF and PK records, the analysis data set consisted of 22,764 QTcF observations from 531 patients (15,477 observations from 268 patients in the placebo arm; 7287 observations from 263 patients in the quizartinib arm). The QTcF data were graphically explored to guide the C‐QTc model development.
Model development
The C‐QTc analysis used a non‐linear mixed‐effects (NLME) modeling approach. The analysis was carried out in NONMEM version 7.5 (ICON Development Solutions, Ellicott City, Maryland), 14 using the first‐order conditional estimation method with interaction for parameter estimation. Visual predictive checks (VPCs) were generated with the Perl‐speaks‐NONMEM (PsN) toolkit, 15 , 16 , 17 version 5.2.6. Data management and further post‐processing of NONMEM output were carried out in R, version 3.5.3. 18
First, the baseline/circadian variation model was developed based on placebo data only. Afterward, data from the quizartinib arm were included for drug effect model building.
Interindividual variability (IIV) was evaluated on relevant model parameters, included in an exponential (Equation 2) or additive (Equation 3) fashion.
| (2) |
| (3) |
where θ p is the typical value of the parameter θ, θ i is the individual value of the parameter, and η pi is a normally distributed random variable with mean 0 and standard deviation ω.
The model for residual unexplained variability (RUV) was additive with an IIV term to manage between‐subject variability in RUV and/or outliers (Equation 4).
| (4) |
where is the observation from the i th individual at time t, is the corresponding individual model prediction, and is a normally distributed random variable with mean 0 and standard deviation σ.
Covariates were considered on parameters associated with IIV. The covariate analysis was performed using the stepwise covariate modeling (SCM) procedure with adaptive scope reduction. 19 A sequential approach was used whereby covariates were first tested on the baseline parameters, based on placebo data, and then on drug effect parameters, based on the overall data. Baseline descriptive statistics for the continuous and categorical covariates in the analysis data set are summarized in Table 1, alongside the model parameters they were tested on. Baseline values were used for all covariates except hypokalaemia, serum calcium, and magnesium concentrations, as well as concomitant medications, which were evaluated as time‐varying. Continuous covariate‐parameter relationships were implemented as exponential models (Equation 5) and categorical covariate‐parameter relationships as a fractional difference to the reference category (Equation 6).
| (5) |
| (6) |
where is the covariate coefficient for covariate , and is a reference covariate value for covariate , to which the covariate model is normalized (typically the median).
TABLE 1.
Baseline statistics for the continuous and categorical covariates in the analysis and parameters they were tested on.
| Covariate | Categorical N (%) | Continuous median (range) | Model parameter |
|---|---|---|---|
| Age (years) | 56.0 (20.0, 75.0) | Baseline, E max | |
| Body weight (kg) | 70.3 (36.8, 152) | Baseline, E max | |
| Sex | Baseline, E max | ||
| Male | 243 (45.8) | ||
| Female | 288 (54.2) | ||
| Race | Baseline, E max | ||
| White | 316 (59.5) | ||
| Black | 7 (1.3) | ||
| Asian | 156 (29.4) | ||
| American Indian | 1 (0.2) | ||
| Other | 51 (9.6) | ||
| Calcium (mM) | 2.22 (1.00, 2.71) | Baseline, E max | |
| Magnesium (mM) | 0.860 (0.410, 2.08) | Baseline, E max | |
| Hypokalaemia a | Baseline, E max | ||
| No | 474 (89.3) | ||
| Yes | 57 (10.7) | ||
| Concomitant medication | Baseline, E max | ||
| QT‐prolonging drugs | |||
| No | 198 (37.3) | ||
| Yes | 333 (62.7) | ||
| β‐blockers | Baseline, E max | ||
| No | 499 (94.0) | ||
| Weak | 32 (6.0) | ||
| Anthracycline | Baseline, E max | ||
| No | 17 (3.2) | ||
| Idarubicin | 303 (57.1) | ||
| Daunorubicin | 210 (39.5) | ||
| Missing | 1 (0.2) |
Hypokalaemia was tested as the binarized version of serum potassium levels, with a cut‐off level of 3.5 mmol/L.
The total effect of covariates on parameter is the product of the covariate terms (Equation 7).
| (7) |
where is the typical value of the parameter for patient and is the population‐typical parameter value (for a patient with typical or reference covariate values).
Model building was guided by changes in the objective function value, the precision and plausibility of parameter estimates, and the visual inspection of graphical diagnostics, including goodness‐of‐fit (GOF) plots and prediction‐corrected VPCs (pcVPCs). 20 , 21
Model applications
Simulations based on the established C‐QTc model were used to visualize the exposure‐response (ER) relationship as well as to predict the change from baseline in QTcF (ΔQTcF) at maximum concentration at steady‐state (C max,ss) for maintenance daily doses of 30 and 60 mg. The C max,ss value used was that of the typical patient in the study QuANTUM‐First (male, 70.3 kg, 56 years old) and was derived from the population PK model for quizartinib. 11 Simulations were run with uncertainty by drawing 250 samples from the asymptotic variance–covariance matrix of the estimates for the final C‐QTcF model.
Sensitivity analysis
The QTcF‐based dosing algorithm applied in QuANTUM‐First implied that the highest quizartinib exposures were achieved by patients with smaller QTcF prolongation. This may represent a potential confounding factor for the assessment of the ER relationship between quizartinib concentrations and QTcF prolongation. Consequently, a sensitivity analysis was conducted by re‐estimating the final model parameters after selecting only observations that were not affected by dose reductions, that is, at 40 or 60 mg.
RESULTS
Graphical analysis
The graphical exploration confirmed that the Fridericia formula could adequately correct the QT measurements for RR (Figure S1). Plots of ΔQTcF and quizartinib/AC886 concentration showed a non‐linear relationship (Figure 2). Furthermore, no systematic delay between quizartinib PK and QTcF prolongation was observed in individual hysteresis plots (Figure S2), suggesting a direct effect of quizartinib on QTcF. Last, the observed relationship was similar with or without concomitant use of other QT‐prolonging drugs (Figure S3).
FIGURE 2.
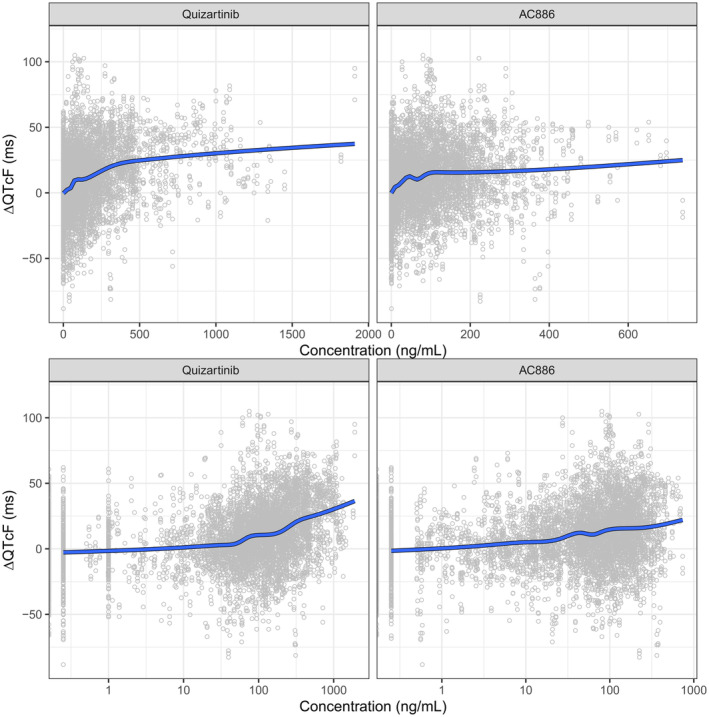
Observed change from baseline in QTcF (ΔQTcF) vs. quizartinib (left panels) and AC886 (right panels) concentrations, on linear (upper panels) and semi‐logarithmic (lower panels) scale. The circles represent individual data and the solid line is a loess smooth.
Model building
The starting point was a linear model with a baseline QTcF parameter and associated IIV, estimated using placebo data only. Given that QT is influenced by circadian variation, 22 a clock time effect was included on the baseline QTcF, based on clock time deciles (Equation 8).
| (8) |
where is the typical value of baseline QTcF at time t, is the typical value of the average baseline QTcF during the day, is the QTcF change from average baseline at time t, and is a binary indicator variable equal to 1 if the condition in brackets is true, that is, if time corresponds to the specific decile , or 0 otherwise.
A first covariate analysis based on data from the placebo arm identified the effect of age and hypokalaemia on baseline QTcF as statistically significant.
The data from the quizartinib arm were then included in the model, and different functional forms of the C‐QTcF relationship were tested using quizartinib concentrations as drivers for the pharmacodynamic effect. The data were best described by a sigmoidal model with additive IIV on the maximum effect (E max). The addition of an AC886 effect did not significantly improve the fit and was therefore not retained in the model.
Covariate effects were then tested on the drug effect parameters associated with IIV (E max). Age, daunorubicin, hypokalaemia, and calcium levels were found to be statistically significant covariates on E max. However, these effects were estimated with high uncertainty and resulted in an increased IIV on E max (data not shown). Besides, the graphical analysis did not suggest the presence of such effects (Figure S4); therefore, they were not retained in the model.
Due to poor precision in parameter estimates of the clock time effects, different attempts were made to refine the model, for example, using quintiles instead of deciles, or by fixing the circadian variation to literature values. 23 All the approaches tested led to similar estimates of the drug effect parameters. Thus, the more parsimonious approach was preferred, where clock time decile effects were sequentially removed until the uncertainty of the remaining ones was not considerably large. This resulted in the effect of the 3rd and 10th decile clock time being retained in the model.
During the model finalization stage, an IIV term was added on EC50 since it meaningfully improved the goodness‐of‐fit.
The final model is described by Equations (9), (10), (11) and the parameter estimates are provided in Table 2. The NONMEM model code is provided in the Supplement.
| (9) |
where,
| (10) |
TABLE 2.
Parameter estimates of the final and the sensitivity analysis C‐QTcF models and their respective model‐predicted ΔQTcF at C max,ss.
| Model parameter | Unit | Final model | Sensitivity analysis | |||
|---|---|---|---|---|---|---|
| Value | RSE (%) | SHR (%) | Value | RSE (%) | ||
| Baseline | ms | 409 | 0.192 | 409 | 0.199 | |
| Fixed time effect for 3rd decile of clock time | ms | −1.68 | 33.9 | −1.68 | 35.4 | |
| Fixed time effect for 10th decile of clock time | ms | −1.18 | 54.7 | −1.91 | 33.9 | |
| E max | ms | 35.2 | 8.56 | 39.4 | 10.1 | |
| EC50 | ng/mL | 260 | 14.2 | 333 | 17.8 | |
| Age effect on Baseline | 1/year | 0.000800 | 17.7 | 0.000814 | 17.9 | |
| Hypokalaemia effect on Baseline | 0.00997 | 21.2 | 0.0108 | 21.4 | ||
| IIV Baseline | (CV) | 0.0410 | 3.34 | 1.22 | 0.0424 | 3.52 |
| IIV EC50 | (CV) | 0.741 | 17.6 | 46.2 | 1.16 | 19.8 |
| IIV E max | ms | 30.7 | 9.77 | 15.9 | 29.9 | 9.78 |
| IIV RUV | (CV) | 0.312 | 4.23 | 4.49 | 0.313 | 4.72 |
| Additive RUV | ms | 13.2 | 1.53 | 0.307 | 12.7 | 1.61 |
| Model‐predicted ΔQTcF | Median | 90% CIs | Median | 90% CIs | ||
| At 30 mg dose (C max,ss = 293 ng/mL) | ms | 18.4 | (16.3–20.5) | 18.2 | (16.0–20.6) | |
| At 60 mg dose (C max,ss = 586 ng/mL) | ms | 24.1 | (21.4–26.6) | 24.9 | (21.8–27.8) | |
Note: The RSE for IIV and RUV parameters are reported on the approximate SD scale. Sensitivity analysis: Re‐estimated model parameters excluding the observations that were affected by dose reductions.
Abbreviations: CIs, confidence intervals; C max,ss, maximum concentration at steady‐state during the continuation phase, calculated for the typical subject in QuANTUM‐First study (male, 70.3 kg, 56 years), and derived from the final population PK quizartinib model 11 ; EC50, concentration at half maximum effect; E max, maximum effect; IIV, interindividual variability; ms: millisecond; ΔQTcF, change from baseline QTcF, predicted from simulations with uncertainty (n = 250); RSE, relative standard error; RUV, residual unexplained variability; SHR, shrinkage.
is the observed quizartinib concentration at time t, and
| (11) |
Drug effect parameters, namely E max and concentration at half maximum effect (EC50), were estimated with good precision (Table 2). The same parameters were characterized by large IIVs: 30.7 ms standard deviation (SD) for E max and 74% coefficient of variation (CV) for EC50 (Table 2). The pcVPCs show that the model was able to adequately describe the median observed QTcF data and associated variability in newly diagnosed AML patients (Figure 3). Additional GOF plots confirming the satisfactory performance of the final model are provided in the supplementary material (Figure S5).
FIGURE 3.
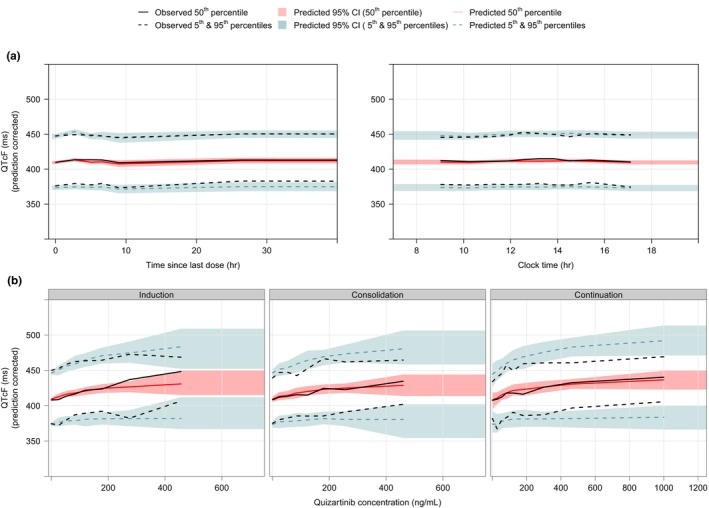
Prediction‐corrected visual predictive checks for the final concentration‐QTcF model (n = 200 simulations). (a) Overall data vs. time since the last dose (left panel, showing data up to 40 h since last dose) and clock time (right panel, showing data between 07:00 and 20:00 o'clock). (b) Prediction‐corrected QTcF vs. quizartinib concentration, stratified by study phase. Data associated with an unknown phase were excluded from panel b.
Model applications
The model‐predicted ΔQTcF vs. quizartinib concentrations across the whole range of QuANTUM‐First doses and study phases is shown in Figure 4. These predictions show that the ΔQTcF response approaches E max at the highest concentrations.
FIGURE 4.
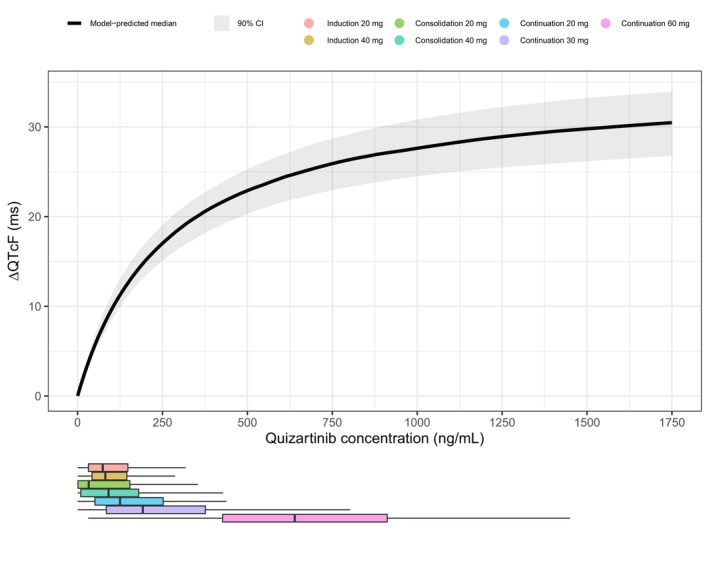
Model‐predicted median change from baseline in QTcF (ΔQTcF) vs. quizartinib concentrations, for the final concentration‐QTcF model in newly diagnosed AML patients. The shaded area represents the 90% CI for the prediction, obtained from simulations with uncertainty (n = 250). The horizontal boxplots depict the distribution of the observed quizartinib concentrations in QuANTUM‐First, colored by dose and treatment phase. Of note, lower doses during the continuation phase led to exposures similar to that observed at higher doses during induction or consolidation due to both drug accumulation and the phase effect on quizartinib PK, as identified in the population PK analysis. 11 Also, the 20 mg doses were only received by patients concomitantly treated with strong CYP3A inhibitors, a factor that significantly increases quizartinib exposure.
The final model predicted a median ΔQTcF of 18.4 ms (90% confidence interval (CI): 16.3–20.5) and 24.1 ms (90% CI: 21.4–26.6) at C max,ss for maintenance daily doses of 30 and 60 mg, respectively (Table 2).
Sensitivity analysis
The data subset used for the sensitivity analysis included observations from the placebo arm plus observations from the quizartinib arm that were collected after 40 mg or 60 mg dosing (20,455 QTcF observations from 531 subjects: 15,477 observations from 268 patients in the placebo arm; 4978 observations from 263 patients in the quizartinib arm), that is, it excluded observations that were influenced by QTcF‐based dose adjustments. The graphical exploration confirmed that the ER relationship was non‐linear (Figure S6). The model‐based sensitivity analysis indicated that the E max was slightly higher than the one estimated by the final model (Table 2); however, there was a substantial overlap between the 90% CI of the ΔQTcF predicted by the two models (Figure 5). The model‐predicted median and 90%CI of ΔQTcF at C max,ss were also similar for the final and the sensitivity analysis models (Table 2).
FIGURE 5.
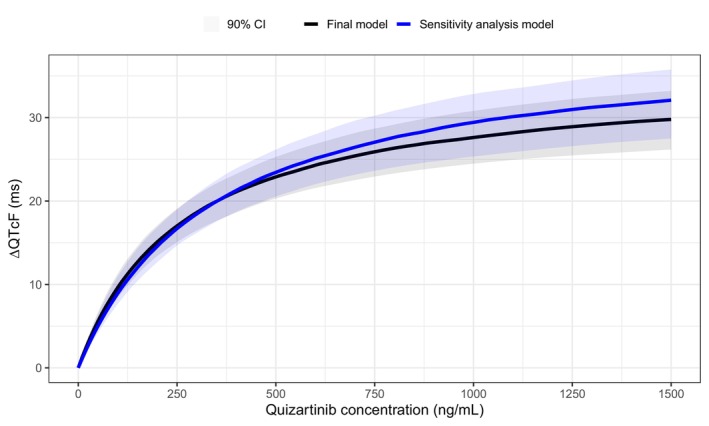
Model‐predicted median change from baseline in QTcF (ΔQTcF) vs. quizartinib concentrations in newly diagnosed AML patients for the final concentration‐QTcF model (black) vs. the sensitivity analysis model (blue). The shaded areas represent the 90% CI for the prediction obtained from simulations with uncertainty (n = 250).
DISCUSSION
The ER relationship between quizartinib plasma concentrations and QTcF was described by a direct response model, where the QTcF prolongation was linked to quizartinib concentrations through a sigmoidal E max function. The model accounted for the effect of circadian variation on the QT interval using an empirical change from baseline QTcF based on clock time deciles. Age and hypokalaemia were found to have a statistically significant effect on baseline QTcF. Conversely, the evaluated intrinsic (e.g., age and sex) and extrinsic (e.g., concomitant administration of QT‐prolonging drugs) factors were not found to impact on the C‐QTcF relationship, consistent with previous findings. 8 More specifically, age, daunorubicin, hypokalaemia, and calcium levels were identified as statistically significant covariates on E max, but their effects were estimated with high uncertainty and led to increased IIV on E max. Moreover, the graphical exploration did not support the existence of such effects. Thus, these factors were not retained in the model.
Adding the effect of AC886 on top of that of quizartinib concentrations did not result in a significant improvement of the model fit, suggesting that AC886 concentrations do not further explain the variability in the C‐QTcF relationship. Although both quizartinib and AC886 concentrations were included in a previous quizartinib C‐QTcF model developed for R/R AML patients, 8 the predictions of ΔQTcF using the two models indicated that the ER relationship in R/R and newly diagnosed AML patients was largely similar (Figure S7).
The C‐QTcF relationship was found to be highly variable among patients. In addition, quizartinib exposure varied substantially as a consequence of concomitant administrations of strong CYP3A inhibitors. Altogether, this resulted in wide between‐patient differences in the QTcF response following quizartinib administration. These findings further supported the dose adjustments based on QTcF and comedication with strong CYP3A inhibitors applied in the QuANTUM‐First study.
The QTcF‐driven dose modifications represented a potential confounding factor for the assessment of the C‐QTcF relationship, since only patients who did not experience a QTcF prolongation were eligible to proceed with the dose escalation, thereby reaching the highest quizartinib exposures. This potential bias could lead to an underestimation of E max and/or to a misspecification of the drug effect model. The risk of confounding was partly mitigated by adopting a NLME approach, which has shown to be a robust method for the analysis of data obtained under dose titration. 24 To further evaluate this risk, a sensitivity analysis was performed, where the final C‐QTcF model was re‐estimated selecting only observations collected after doses that were not subject to QTcF‐based modifications. The sensitivity analysis indicated that the potential confounding had no impact on the overall conclusion of the C‐QTcF analysis (Figure 5, Table 2). Moreover, the graphical exploration of the data included in the sensitivity analysis showed that the ER relationship was consistently non‐linear (Figure S1), supporting the adequacy of a sigmoidal E max model.
The main limitation of the present work resides in the nature of the study used in the analysis. QuANTUM‐First was a large, multi‐center Phase 3 efficacy and safety study and, as such, suffers from known factors that can affect the evaluation of QT prolongation, e.g., uncontrolled food status with differences between active and placebo, large variability in patient population, and, in general, additional noise typical of Phase 3 settings as opposed to the well‐control healthy subject studies. This limitation prevented, for example, the use of physiological models accounting for the circadian variation of the QT interval, which instead had to be described by an empirical stepwise model based on clock time cutoff values.
In conclusion, the present C‐QTcF analysis successfully characterized the ER relationship between quizartinib and QTcF in newly diagnosed AML patients. No factors other than quizartinib concentrations were found to be predictors of ΔQTcF. Overall, the analysis supported the proposed dose adaptation in newly diagnosed AML patients based on the observed QTcF and the dose reduction in case of concomitant treatment with strong CYP3A inhibitors.
AUTHOR CONTRIBUTIONS
P.V., G.S., S.N., H.I., A.K., M.A., and M.Z. wrote the manuscript. M.A. and M.Z. designed the research. S.N., H.I., M.A., and M.Z. performed the research. P.V., G.S., S.N., H.I., A.K., M.A., and M.Z. analyzed the data.
FUNDING INFORMATION
This work was supported by Daiichi Sankyo, Inc.
CONFLICT OF INTEREST STATEMENT
Giovanni Smania is an employee of Pharmetheus AB. Abhinav Kurumaddali, Malaz Abutarif, and Ming Zheng are employees of Daiichi Sankyo, Inc., Basking Ridge, NJ, USA. Pavan Vaddady was an employee of Daiichi Sankyo, Inc., Basking Ridge, NJ, USA during the time of the study. Shintaro Nakayama, and Hiroyuki Inoue are employees of Daiichi Sankyo Co, Ltd. Tokyo, Japan.
Supporting information
Data S1:
Data S2:
ACKNOWLEDGMENTS
The authors thank Martin Bergstrand, PhD of Pharmetheus, Uppsala, Sweden, for the fruitful discussions during the model‐building stage. The authors thank Christina Pentafragka, PhD of Pharmetheus, Uppsala, Sweden for providing medical writing support, which was funded by Daiichi Sankyo, Inc. in accordance with Good Publication Practice guidelines (https://www.ismpp.org/gpp‐2022).
Vaddady P, Smania G, Nakayama S, et al. Concentration‐QTcF analysis of quizartinib in patients with newly diagnosed FLT3‐internal‐tandem‐duplication‐positive acute myeloid leukemia. Clin Transl Sci. 2024;17:e70065. doi: 10.1111/cts.70065
REFERENCES
- 1. Jabbour E, Daver N, Schlenk RF, Schlenk RF, Russell NH, Levis MJ. Targeting FLT3 mutations in AML: review of current knowledge and evidence. Leukemia. 2019;33(2):299‐312. doi: 10.1038/s41375-018-0357-9 [DOI] [PMC free article] [PubMed] [Google Scholar]
- 2. Levis MJ. FLT3 mutations in acute myeloid leukemia: what is the best approach in 2013? Hematology. 2013;2013(1):220‐226. doi: 10.1182/asheducation-2013.1.220 [DOI] [PMC free article] [PubMed] [Google Scholar]
- 3. Fröhling S, Fröhling S, Schlenk RF, et al. Prognostic significance of activating FLT3 mutations in younger adults (16 to 60 years) with acute myeloid leukemia and normal cytogenetics: a study of the AML study group Ulm. Blood. 2002;100(13):4372‐4380. doi: 10.1182/blood-2002-05-1440 [DOI] [PubMed] [Google Scholar]
- 4. Rosenberg M, Watanabe‐Smith K, Tyner JW, et al. Genomic markers of midostaurin drug sensitivity in FLT3 mutated and FLT3 wild‐type acute myeloid leukemia patients. Oncotarget. 2020;11(29):2807‐2818. doi: 10.18632/oncotarget.27656 [DOI] [PMC free article] [PubMed] [Google Scholar]
- 5. Kiyoi H, Kawashima N, Ishikawa Y, Ishikawa Y, Ishikawa Y. FLT3 mutations in acute myeloid leukemia: therapeutic paradigm beyond inhibitor development. Cancer Sci. 2020;111(2):312‐322. doi: 10.1111/cas.14274 [DOI] [PMC free article] [PubMed] [Google Scholar]
- 6. Cortes JE, Khaled S, Martinelli G, et al. Quizartinib versus salvage chemotherapy in relapsed or refractory FLT3‐ITD acute myeloid leukaemia (QuANTUM‐R): a multicentre, randomised, controlled, open‐label, phase 3 trial. Lancet Oncol. 2019;20(7):984‐997. doi: 10.1016/S1470-2045(19)30150-0 [DOI] [PubMed] [Google Scholar]
- 7. Erba HP, Montesinos P, Kim HJ, et al. Quizartinib plus chemotherapy in newly diagnosed patients with FLT3‐internal‐tandem‐duplication‐positive acute myeloid leukaemia (QuANTUM‐first): a randomised, double‐blind, placebo‐controlled, phase 3 trial. Lancet. 2023;401(10388):1571‐1583. doi: 10.1016/S0140-6736(23)00464-6 [DOI] [PubMed] [Google Scholar]
- 8. Kang D, Ludwig E, Jaworowicz D, et al. Concentration–QTc analysis of quizartinib in patients with relapsed/refractory acute myeloid leukemia. Cancer Chemother Pharmacol. 2021;87(4):513‐523. doi: 10.1007/s00280-020-04204-y [DOI] [PMC free article] [PubMed] [Google Scholar]
- 9. Jost N, Papp JG, Varró A. Slow delayed rectifier potassium current (IKs) and the repolarization reserve. Annals Noninvasive Electrocardiol. 2007;12:64‐78. doi: 10.1111/j.1542-474X.2007.00140.x [DOI] [PMC free article] [PubMed] [Google Scholar]
- 10. Yap YG, Camm AJ. Drug induced QT prolongation and torsades de pointes. Heart. 2003;89(11):1363‐1372. [DOI] [PMC free article] [PubMed] [Google Scholar]
- 11. Vaddady P, Glatard A, Smania G, et al. Population Pharmacokinetic Analysis of Quizartinib in Patients with Newly Diagnosed FLT3‐internal‐tandem‐duplication‐positive Acute Myeloid Leukemia. (in press).
- 12. Fridericia LS. The duration of systole in an electrocardiogram in Normal humans and in patients with heart disease. Ann Noninvasive Electrocardiol. 2003;8(4):343‐351. doi: 10.1046/j.1542-474X.2003.08413.x [DOI] [PMC free article] [PubMed] [Google Scholar]
- 13. Garnett C, Bonate PL, Dang Q, et al. Scientific white paper on concentration‐QTc modeling. J Pharmacokinet Pharmacodyn. 2017;45(3):383‐397. doi: 10.1007/s10928-017-9558-5 [DOI] [PubMed] [Google Scholar]
- 14. Beal S, Sheiner LB, Boeckmann A, Bauer RJ. NONMEM User's guides (1989‐2010). Icon Development Solutions; 2010. [Google Scholar]
- 15. Lindbom L, Ribbing J, Jonsson EN. Perl‐speaks‐NONMEM (PsN)—a Perl module for NONMEM related programming. Comput Methods Prog Biomed. 2004;75(2):85‐94. doi: 10.1016/j.cmpb.2003.11.003 [DOI] [PubMed] [Google Scholar]
- 16. Lindbom L, Pihlgren P, Jonsson E, Jonsson N. PsN‐toolkit – a collection of computer intensive statistical methods for non‐linear mixed effect modeling using NONMEM. Comput Methods Prog Biomed. 2005;79:241‐257. doi: 10.1016/j.cmpb.2005.04.005 [DOI] [PubMed] [Google Scholar]
- 17. Harling K, Hooker AC, Ueckert S, Jonsson EN, Karlsson MO. Perl speaks NONMEM (PsN) and Xpose. Population Approach Group Europe (PAGE) 2010 Abstr 1842. Accessed October 30, 2024. http://www.page‐meeting.org/?abstract=1842
- 18. R Core Team . R: A language and environment for statistical computing. R Foundation for Statistical Computing; 2019. Accessed October 30, 2024. http://www.R‐project.org [Google Scholar]
- 19. Svensson RJ, Jonsson EN. Efficient and relevant stepwise covariate model building for pharmacometrics. CPT Pharm Syst Pharmacol. 2022;11(9):1210‐1222. doi: 10.1002/psp4.12838 [DOI] [PMC free article] [PubMed] [Google Scholar]
- 20. Karlsson MO, Holford N. A tutorial on visual predictive checks. Population Approach Group Europe (PAGE); 2008. [Google Scholar]
- 21. Bergstrand M, Hooker AC, Wallin JE, Karlsson MO. Prediction‐corrected visual predictive checks for diagnosing nonlinear mixed‐effects models. AAPS J. 2011;13(2):143‐151. doi: 10.1208/s12248-011-9255-z [DOI] [PMC free article] [PubMed] [Google Scholar]
- 22. Piotrovsky V. Pharmacokinetic‐pharmacodynamic modeling in the data analysis and interpretation of drug‐induced QT/QTc prolongation. AAPS J. 2005;7(3):E609‐E624. doi: 10.1208/aapsj070363 [DOI] [PMC free article] [PubMed] [Google Scholar]
- 23. Minocha M, Li H, Chiu YL, Carter D, Othman AA. Models of variability and circadian rhythm in heart rate, blood pressure, and QT interval for healthy subjects who received placebo in phase I trials. Clin Transl Sci. 2019;12(5):470‐480. doi: 10.1111/cts.12640 [DOI] [PMC free article] [PubMed] [Google Scholar]
- 24. Kristensen NR, Agersø H. Dose/exposure–response modeling in dose titration trials: overcoming the titration paradox. CPT Pharmacometrics Syst Pharmacol. 2022;11(12):1592‐1603. doi: 10.1002/psp4.12863 [DOI] [PMC free article] [PubMed] [Google Scholar]
Associated Data
This section collects any data citations, data availability statements, or supplementary materials included in this article.
Supplementary Materials
Data S1:
Data S2:
Data Availability Statement
Anonymized individual participant data (IPD) and applicable supporting clinical study documents may be available upon request at https://vivli.org/. In cases where clinical study data and supporting documents are provided pursuant to our company policies and procedures, Daiichi Sankyo Companies will continue to protect the privacy of the company and our clinical study subjects. Details on data sharing criteria and the procedure for requesting access can be found at this web address: https://vivli.org/ourmember/daiichi‐sankyo/.
An overview of the QuANTUM‐First trial design is provided in Figure 1. Overall, 539 newly diagnosed FLT‐ITD‐positive AML patients aged 20–75 years were randomly assigned (1:1) to the quizartinib or the placebo arm. 7 Patients entered the induction phase to receive 40 mg quizartinib/placebo once daily in addition to standard chemotherapy with cytarabine and anthracycline. Patients showing remission could proceed to the consolidation phase, to receive standard high‐dose cytarabine plus 40 mg daily quizartinib/placebo, or allogeneic hematopoietic stem cell transplantation (allo‐HSCT), or both. Following consolidation, patients with blood count recovery could move forward to the continuation phase to receive quizartinib/placebo as monotherapy, starting at 30 mg/day and increasing to 60 mg/day on Day 15 if QTcF was less than or equal to 450 ms. 7
FIGURE 1.
Illustration of the QuANTUM‐First study design, dose‐modification algorithm, and QTcF assessment time points. AE, Adverse event (QTcF prolongation, myelosuppression, or other non‐hematological toxicities); CYP3A, Cytochrome P450 3A; HSCT, Hematopoietic stem cell transplantation; QD, Once daily. aDuring Induction Cycle 2 investigators chose to administer the “7 + 3” chemotherapy regimen, or the “5 + 2” chemotherapy regimen, and quizartinib/placebo started therefore on Day 8 or Day 6, respectively.
QT measurements were obtained from triplicate electrocardiogram (ECG) readouts and were then automatically converted to QTcF using the Fridericia formula (Equation 1). 12
| (1) |
where RR is the interval between two consecutive R waves on the ECG.
As quizartinib does not significantly change heart rate (mean change ≤10 beats per minute; unpublished data), QTcF is usually considered a sufficient correction method for QT. 13
Dose modifications were implemented throughout the trial to ensure patient safety. The dose reduction/interruption algorithm is schematically presented in Figure 1. The dose of quizartinib was reduced to 30 mg in case of adverse events (AEs), that is, QTcF prolongation, myelosuppression, or other non‐hematological toxicities. Also, the dose was reduced to 20 mg in case of concomitant use of strong CYP3A inhibitors. Dose interruptions occurred when both conditions for dose reduction were met, that is, when patients received strong CYP3A inhibitors and experienced one of the specified AEs at the same time.
A specific dose‐modification algorithm was applied in patients who experienced QTcF prolongation >480 ms, based on the mean QTcF value of the triplicate ECG:
If 480 ms < QTcF < 500 ms, then the dose was reduced by one level. The previous (higher) dose could be resumed in the following cycle if QTcF decreased to 30 ms from baseline or <450 ms.
If QTcF >500 ms, then dosing was interrupted for up to 14 days. If QTcF decreased to 30 ms from baseline or <450 ms within the 14 days, patients were allowed to resume quizartinib at a reduced dose level.
If QTcF >500 ms during the induction or consolidation phase, then patients could not be escalated to 60 mg during continuation.
Only if QTcF ≤450 ms on cycle 1, day 15, patients were escalated to 60 mg during continuation. Accordingly, patients treated with strong CYP3A4 inhibitors, who started the continuation phase at 20 mg, could increase their dose to 30 mg if QTcF was ≤450 on cycle 1, day 15. If the dose could not be increased on cycle 1 day 16, it could also be increased on cycle 2 day 2, provided that QTcF ≤450 ms.
If recurrent QTcF >500 ms despite appropriate dose reduction and elimination of other risk factors (e.g., abnormalities in electrolyte levels or concomitant use of other QT‐prolonging drugs), then quizartinib was permanently discontinued.
The C‐QTcF analysis population was defined as all patients who received at least one dose of quizartinib/placebo and had at least one QTcF observation with a time‐matched pharmacokinetic (PK) sample available. The triplicate QTcF measurements were not averaged but used as such in the analysis. Time points for the QTcF assessment in QuANTUM‐First are provided in Figure 1.
In light of the high shrinkage obtained for the absorption‐related parameters in the population PK models of quizartinib and AC886, 11 the C‐QTcF analysis was conducted using observed concentrations rather than model‐predicted ones. QTcF data and concentration records were matched by comparing the actual date/time of each replicate QTcF measurement vs. the date/time of the corresponding concentration measurement. The difference in time between the two measurements was computed and used to determine whether the replicate QTcF measurements met the criteria to be matched with the concentration. A difference of ≤30 min was allowed for all time points except for the predose QTcF measurements, for which a difference of up to 90 min was allowed. After time‐matching of QTcF and PK records, the analysis data set consisted of 22,764 QTcF observations from 531 patients (15,477 observations from 268 patients in the placebo arm; 7287 observations from 263 patients in the quizartinib arm). The QTcF data were graphically explored to guide the C‐QTc model development.