

Abstract
Gastrointestinal (GI) B cells and plasma cells (PCs) are critical to mucosal homeostasis and the host response to HIV-1 infection. Here, high-resolution mapping of human B cells and PCs sampled from the colon and ileum during both viremic and suppressed HIV-1 infection identified a reduction in germinal center (GC) B cells and follicular dendritic cells (FDCs) during HIV-1 viremia. Immunoglobulin A–positive (IgA+) PCs are the major cellular output of intestinal GCs and were significantly reduced during viremic HIV-1 infection. PC-associated transcriptional perturbations, including type I interferon signaling, persisted in antiretroviral therapy (ART)–treated individuals, suggesting ongoing disruption of the intestinal immune milieu during ART. GI humoral immune perturbations were associated with changes in the intestinal microbiome composition and systemic inflammation. These findings highlight a key immune defect in the GI mucosa due to HIV-1 viremia.
INTRODUCTION
Neutralizing antibodies (NAbs) play a critical role in host protection against invading pathogens such as HIV-1 (1). There is a relative lack of understanding of the humoral immune dynamics in gut-associated lymphoid tissue (GALT), a site where viral replication is concentrated during HIV-1 infection (2–4) concomitant with a profound CD4+ T cell depletion within this site (5–8). GALT-associated HIV-1 replication is associated with seeding of HIV-1 reservoirs (9–11), disruption of mucosal barrier integrity, and systemic inflammation (12–17). Therefore, a detailed examination of the humoral immune system of the GALT is important to understand HIV-1 pathogenesis and to inform HIV-1 cure efforts.
The cellular output of GALT is dominated by secretory immunoglobulin A (SIgA) that regulates barrier integrity (18–21) and mediates mucosal homeostasis (22). The generation of IgA requires B cell–T cell interactions within the highly organized microenvironment of germinal centers (GCs) (22–24). Within the GCs, specialized stromal cells called follicular dendritic cells (FDCs) are crucial to the maturation of the B cell response through affinity-based selection of B cells that drive the production of highly specific antibodies (25). B cells egress from the GC as memory B cells or as plasma cells (PCs), which then migrate to effector sites such as the intestinal lamina propria or to the bone marrow for long-term survival (25–28).
Intimate bidirectional cross-talk exists between SIgA and intestinal bacteria. Intestinal dysbiosis is recognized in HIV-1 infection (29–36); however, the impact of humoral perturbations on microbiota alterations is not well elucidated in persons with HIV-1 infection (PWH). In addition, although a number of gut barrier–associated homeostatic mechanisms have been shown to be disrupted by HIV-1 infection (17, 37–39), B cells and PCs, key regulators of the gut barrier, remain understudied in PWH.
RESULTS
Viremic HIV-1 infection is associated with a major depletion of GC B cells in the GI tract
To dissect the dynamics of intestinal B cells and PCs, we performed single-cell RNA sequencing (scRNA-seq) in nine PWH [four people with viremic HIV (PWVH) with plasma HIV-RNA > 20 copies/ml off ART and five people with suppressed HIV (PWSH) on ART with plasma HIV-RNA < 20 copies/ml for at least 12 months] and nine HIV-negative controls (NCs) (tables S1 and S2). Immune cell analyses were conducted independently for the colon and ileum to reflect potential differences in the immune effector (colon) and inductive (ileum) sites, respectively (40). Unsupervised cell clustering of 62,365 cells with an average of 9016 unique molecular identifiers (UMIs) per cell from the colon generated 23 cell clusters (Fig. 1, A and B; fig. S1A; and table S3), whereas 43,291 cells with an average of 6292 UMIs per cell from the ileum mapped to 26 cell clusters (Fig. 1, C and D; fig. S1B; and table S3). On the basis of canonical gene expression, we identified clusters representing epithelial (KRT8, SLC25A5, and CA2), endothelial (PLVAP and PECAM), stromal (PDGFRB, CXCL14, CALD1, and PMP22), and immune cell lineages that included PCs (JCHAIN, MZB1, and XBP1), B cells (CD79A and BANK1), CD4+ T cells (CD3D, CD4, and TRAC), CD8+ T cells (CD3D, CD8, and TRAC), myeloid cells (CD14, CD68, and MNDA), innate lymphoid cells (IL7R, KIT, and IL23R), and mast cells (TPS and KIT) both in the colon and in the ileum (Fig. 1, E and F, and tables S4 to S7). Cell-type frequencies across groups are quantified in Fig. 1 (G and H), fig. S1 (C and D), and table S8.
Fig. 1. scRNA sequencing–based identification of major immune cell types in the intestinal lamina propria during HIV infection.
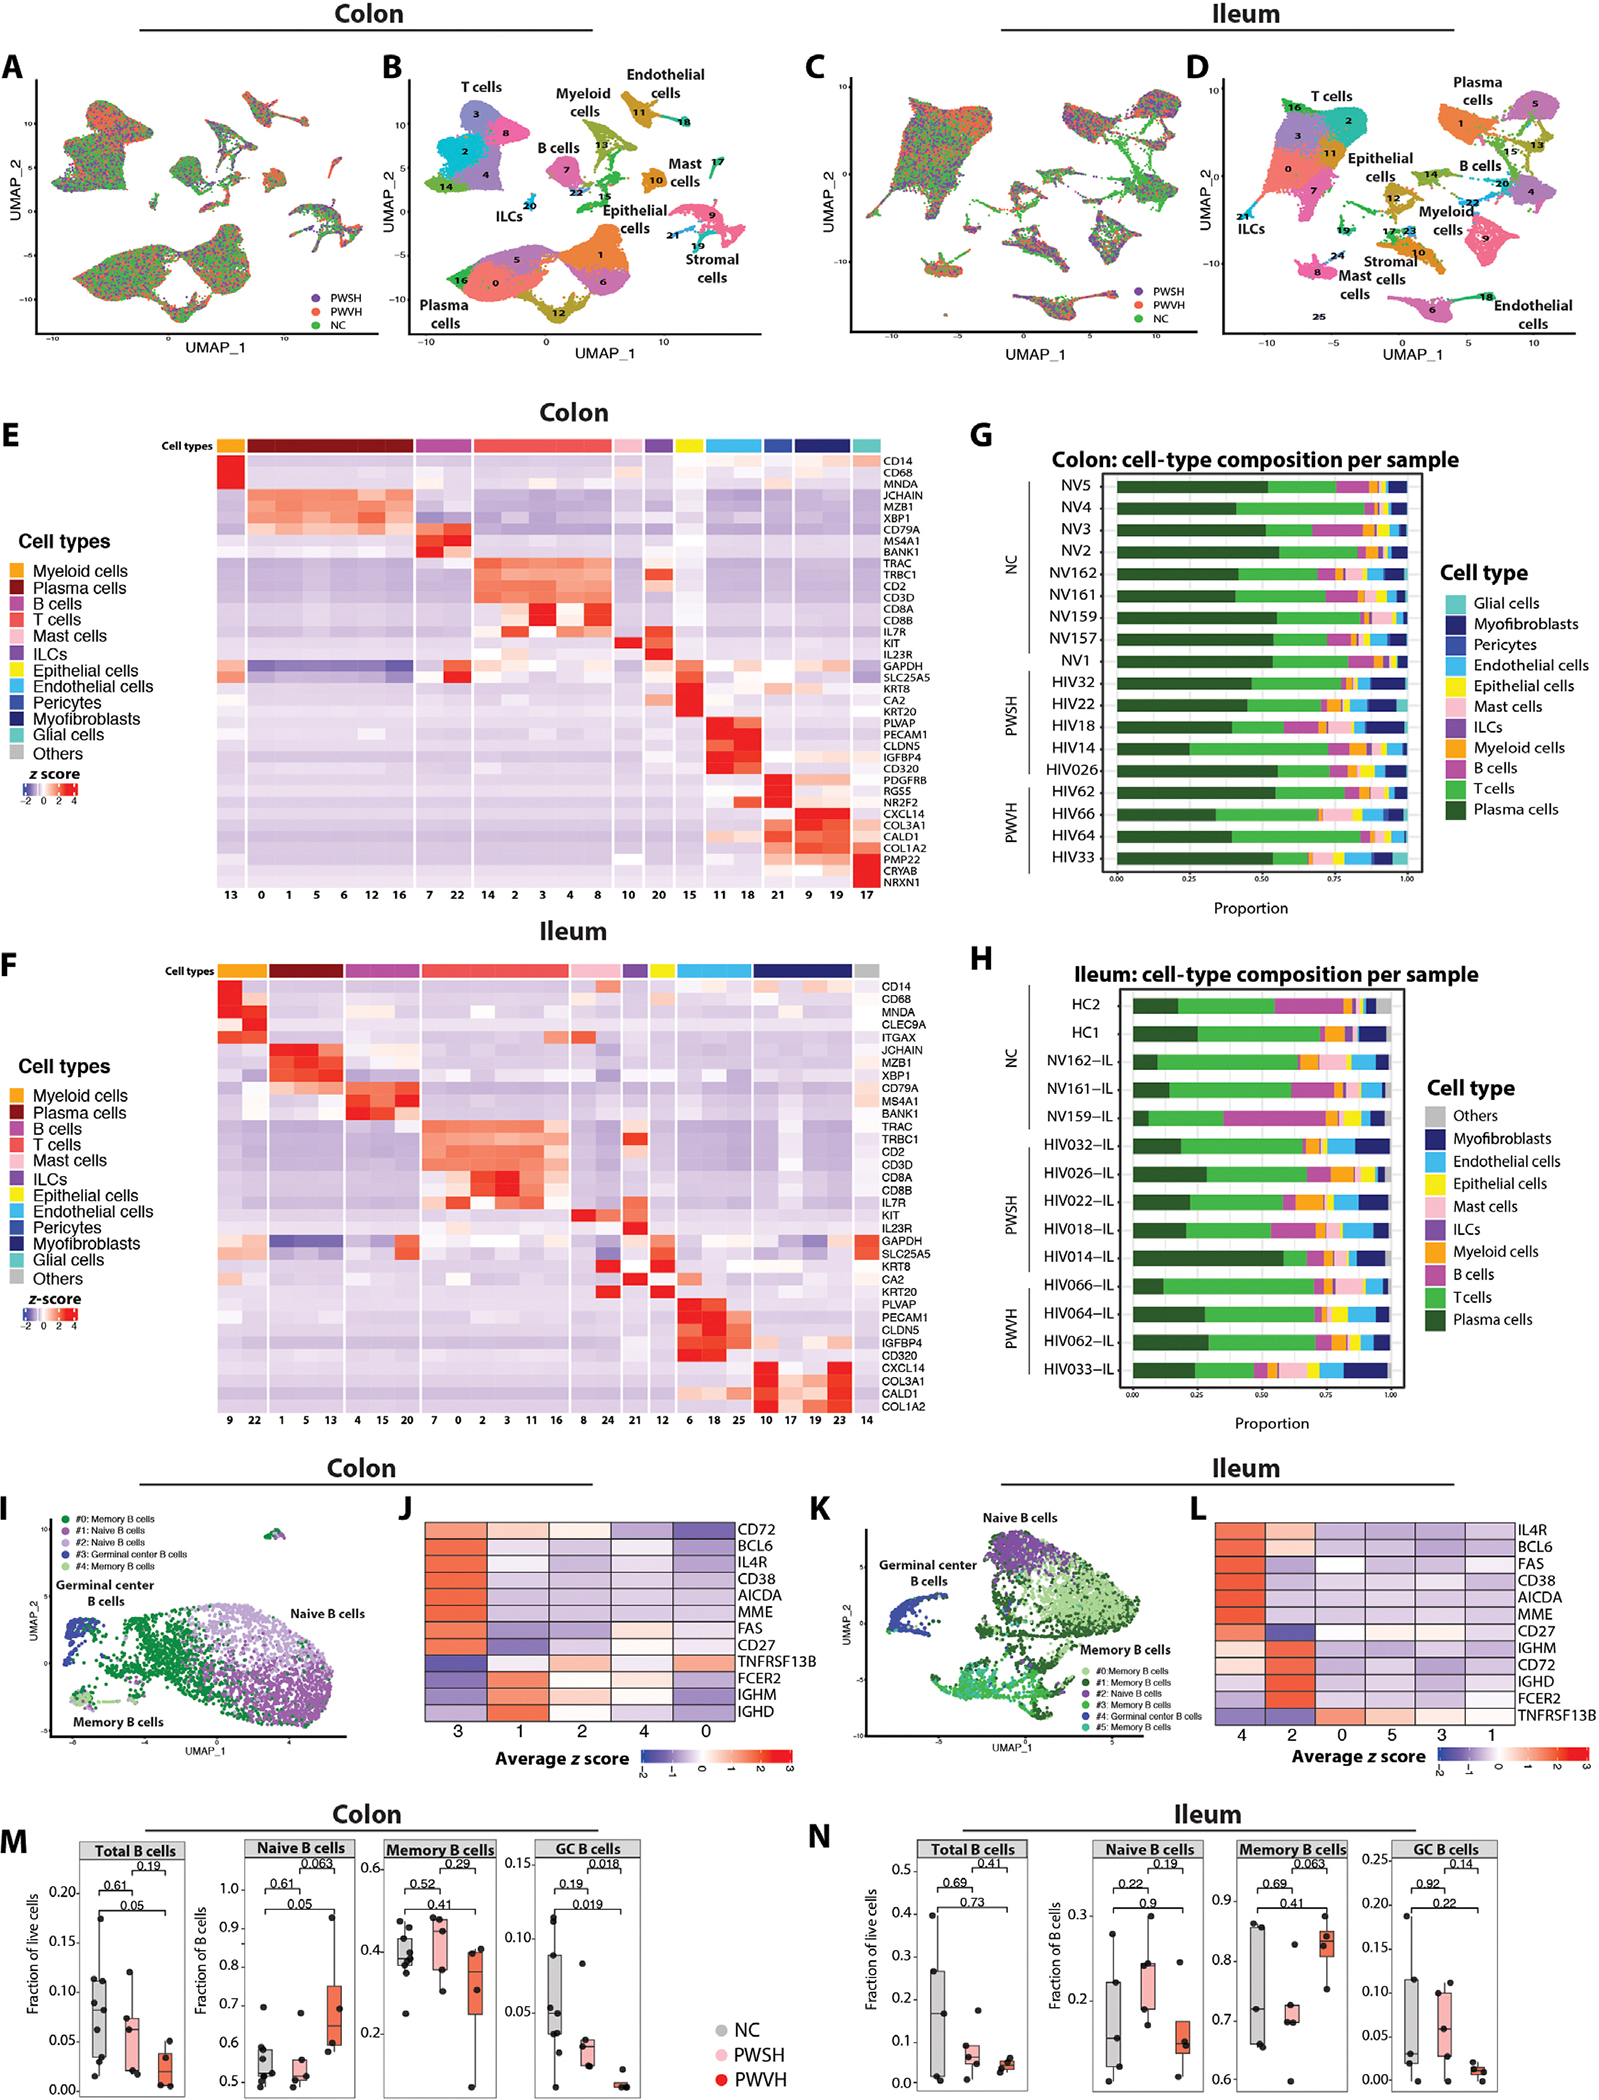
(A) UMAP of scRNA-seq data from colonic lamina propria with representation of sample distribution across the groups (NCs, n = 9, green; PWSH, n = 5, orange; PWVH, n = 4, purple). (B) UMAP representing cell-type annotated clusters derived from the colonic lamina propria. (C) UMAP of ileal lamina propria–derived samples with representation of sample distribution across the groups (NCs, n = 5, green; PWSH, n = 5, orange; PWVH, n = 4, purple). (D) UMAP representing cell-type annotated clusters derived from the ileal lamina propria. (E and F) Heatmap showing the average z score–normalized log expression of canonical cell-type markers across different colonic (E) and ileum-derived (F) cell clusters. (G and H) Bar plots showing cell-type distribution within each individual for colon-derived (G) and ileum-derived (H) samples. (I) UMAPs showing reclustered, colon-derived B cell clusters using scRNA-seq. (J) Heatmap showing the average normalized log expression z score of canonical B cell markers across different colon-derived B cell subclusters. (K) UMAPs showing reclustered, ileum-derived B cell clusters using scRNA-seq. (L) Heatmap showing the average z score normalized log expression of canonical B cell markers across different ileum-derived B cell subclusters. (M and N) scRNA-seq data demonstrating the frequency of B cell subclusters derived from the colon (M) and ileum (N) across the three groups (NCs, n = 9 for colon and n = 5 for ileum; PWSH, n = 5 for both colon and ileum; PWVH, n = 4 for both colon and ileum). Bars represent median values. P values from Wilcoxon signed-rank sum test are reported.
Next, we reclustered B cells using an unsupervised clustering algorithm (41). In the colon, 3382 B cells yielded five clusters, whereas in the ileum, 5095 B cells yielded six clusters (Fig. 1, I and K, and table S9). We annotated naïve B cells (IGHM, IGHD, FCER2, no CD27; colon cluster no. 1; ileum cluster no. 2), memory B cells (TNFRSF13B, CD27, no IGHM, IGHD; colon cluster nos. 0 and 2; ileum cluster nos. 0, 1, 3, and 5), and GC B cells (AICDA, BCL6, CD38, MME; colon cluster no. 3; ileum cluster no. 4) (Fig. 1, J and L, and tables S10 to S13). Notably, Ig genes and gene fragments were considered and retained in the subclustering algorithm, because they are critical for cell state definition (specifically IGHM and IGHD for naïve versus memory B cells) and otherwise did not contribute to the determination of the clusters (Materials and Methods). We examined the frequency of total, naïve, memory, and GC B cells across groups. GC B cells showed a −4.255 log2 fold change in the colon and a −2.622 log2 fold change in the ileum in PWVH compared with NCs and a −3.517 log2 fold change in the colon and a −2.380 log2 fold change in the ileum compared with PWSH (Fig. 1, M and N, and table S14).
To validate scRNA-seq data in a larger cohort, we examined B cell subsets using multiparameter flow cytometry (FC) in 18 PWVH, 49 PWSH, and 87 NCs (tables S1, S2, S15, and S17). Consistent with the scRNA-seq data, GC B cells (CD45+CD3−CD19+CD38+IgD−; fig. S2A) showed a −1.6 log2 fold change in the colon (P = 0.0027, Cohen’s d effect size: 0.829) and a −2.4 log2 fold change in the ileum (P = 0.0058, Cohen’s d effect size: 0.698) in PWVH compared with both PWSH and NCs (Fig. 2, A and B, and tables S17 and S18).
Fig. 2. Depletion of intestinal GC B cells during viremic HIV-1 infection.
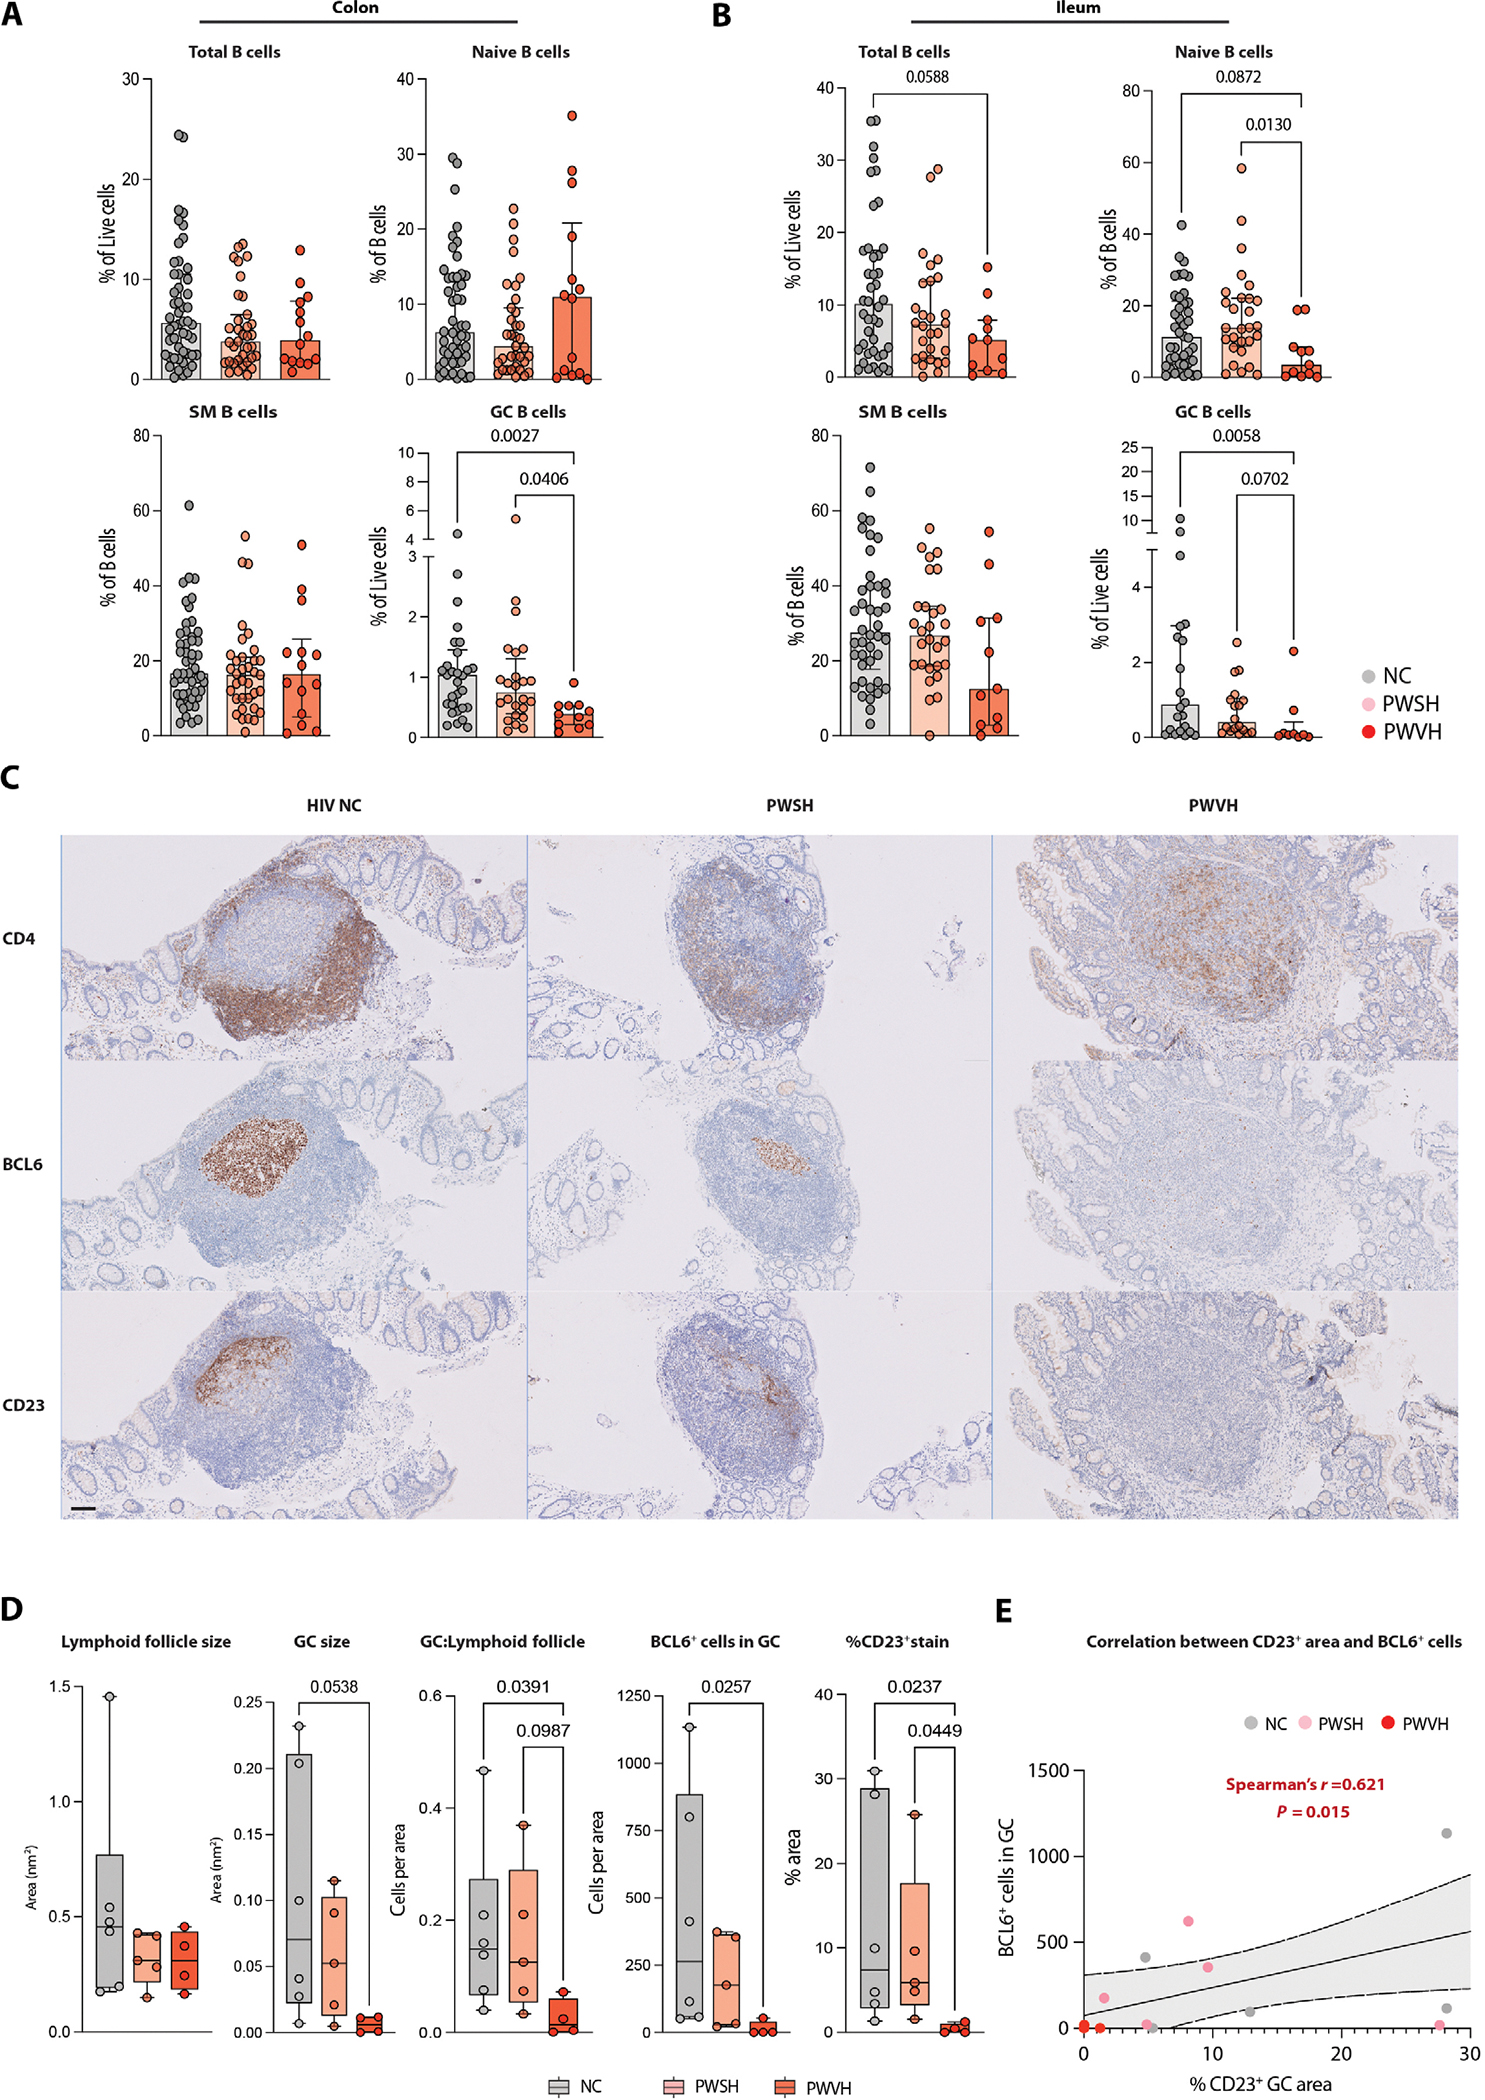
(A and B) Flow cytometric data quantifying colon-derived (A) and ileum-derived (B) total B cells and B cell subsets. Comparisons between groups performed with one-way ANOVA with Dunn’s correction for multiple comparisons, and P values are as indicated. (C) Representative IHC images of intestinal lymphoid follicles for each of the three groups showing staining for CD4 (top), BCL6 (middle), and CD23 (bottom). Scale bar represents 100 μm. (D) Summary data for IHC (NCs, n = 6; PWSH, n = 5; PWVH, n = 4), quantifying lymphoid follicle size, GC size, the ratio between GC and lymphoid follicle size, the number of BCL6+ cells in each GC, and the % area positive for CD23 staining within each GC. (E) Correlation analysis between the area with positive CD23 staining and the number of BCL6+ cells within each GC. Comparisons between groups were performed using Kruskal-Wallis test with Dunn’s correction for multiple comparisons. Median and interquartile range were used to plot summary data, and P values <0.1 are shown as indicated (P values >0.1 are not shown). Correlation was obtained using Spearman’s r correlation coefficient, and P values are as indicated.
To further confirm our findings, we performed immunohistochemistry (IHC) on intestinal biopsy tissues where a lymphoid follicle was identified (tables S2 and S16 and figs. S3 to S5). The size of GCs was on average 16 times smaller (P = 0.0538) in PWVH compared with NCs despite overall comparable lymphoid follicle size (Fig. 2, C and D). We used BCL6 as a marker of putative GC B cells and found a 31-fold reduction of CD4−BCL6+ cells within the GC in PWVH when compared with NCs (Fig. 2, C and D, and table S16). In addition, we examined FDCs, given their importance in maintaining the GC response (25), using CD23 staining (42). CD23 expression was ninefold lower in PWVH compared with NCs (Fig. 2, C and D; fig. S6; and table S16) and correlated with BCL6 expression (Fig. 2E and fig. S7). Together, on the basis of scRNA-seq, FC, and IHC, we identified a significant loss of GC B cells in the gastrointestinal (GI) tracts of PWVH that is accompanied by disruption of the FDC network.
Total PCs and IgA+ PCs are decreased in the colon during viremic HIV-1 infection and demonstrate an altered transcriptional profile
We next examined whether PC changes accompany the loss of GC B cells in PWVH. Using multiparametric FC, we defined intestinal PCs (fig. S2A) and observed a −0.9 and −1.7 log2 fold change in the frequency of colonic PCs (live CD27+CD38hicells) in PWVH when compared with PWSH and NCs, respectively (Fig. 3, A and B, and tables S17 and S18). Among the PC isotypes, the frequency of IgA+ PCs was 1.1 times lower in PWVH [median (interquartile range, IQR): 82 (61 to 91)%] compared with NCs [92 (87 to 95)%, P = 0.005, Cohen’s d effect size: 1.251] (Fig. 3, C and D, and tables S17 and S18). Concomitantly, the frequencies of immunoglobulin G–positive (IgG+) [6.2 (2.9 to 13)%] and IgM+ [4.7 (2.5 to 7.9)%] PCs were higher in PWVH when compared with NCs [3.8 (2.2 to 7.4)%, P = 0.289, Cohen’s d effect size: 0.857 for IgG+ and 2.3 (1.4 to 3.9)%, P = 0.0132, Cohen’s d effect size: 0.958 for IgM+] (Fig. 3, C and D, and tables S17 and S18). PC-related changes in the ileum were less notable than those observed in the colon (fig. S8, A and B, and table S17).
Fig. 3. Colonic PCs are decreased during untreated HIV infection and show a switch in isotype expression.
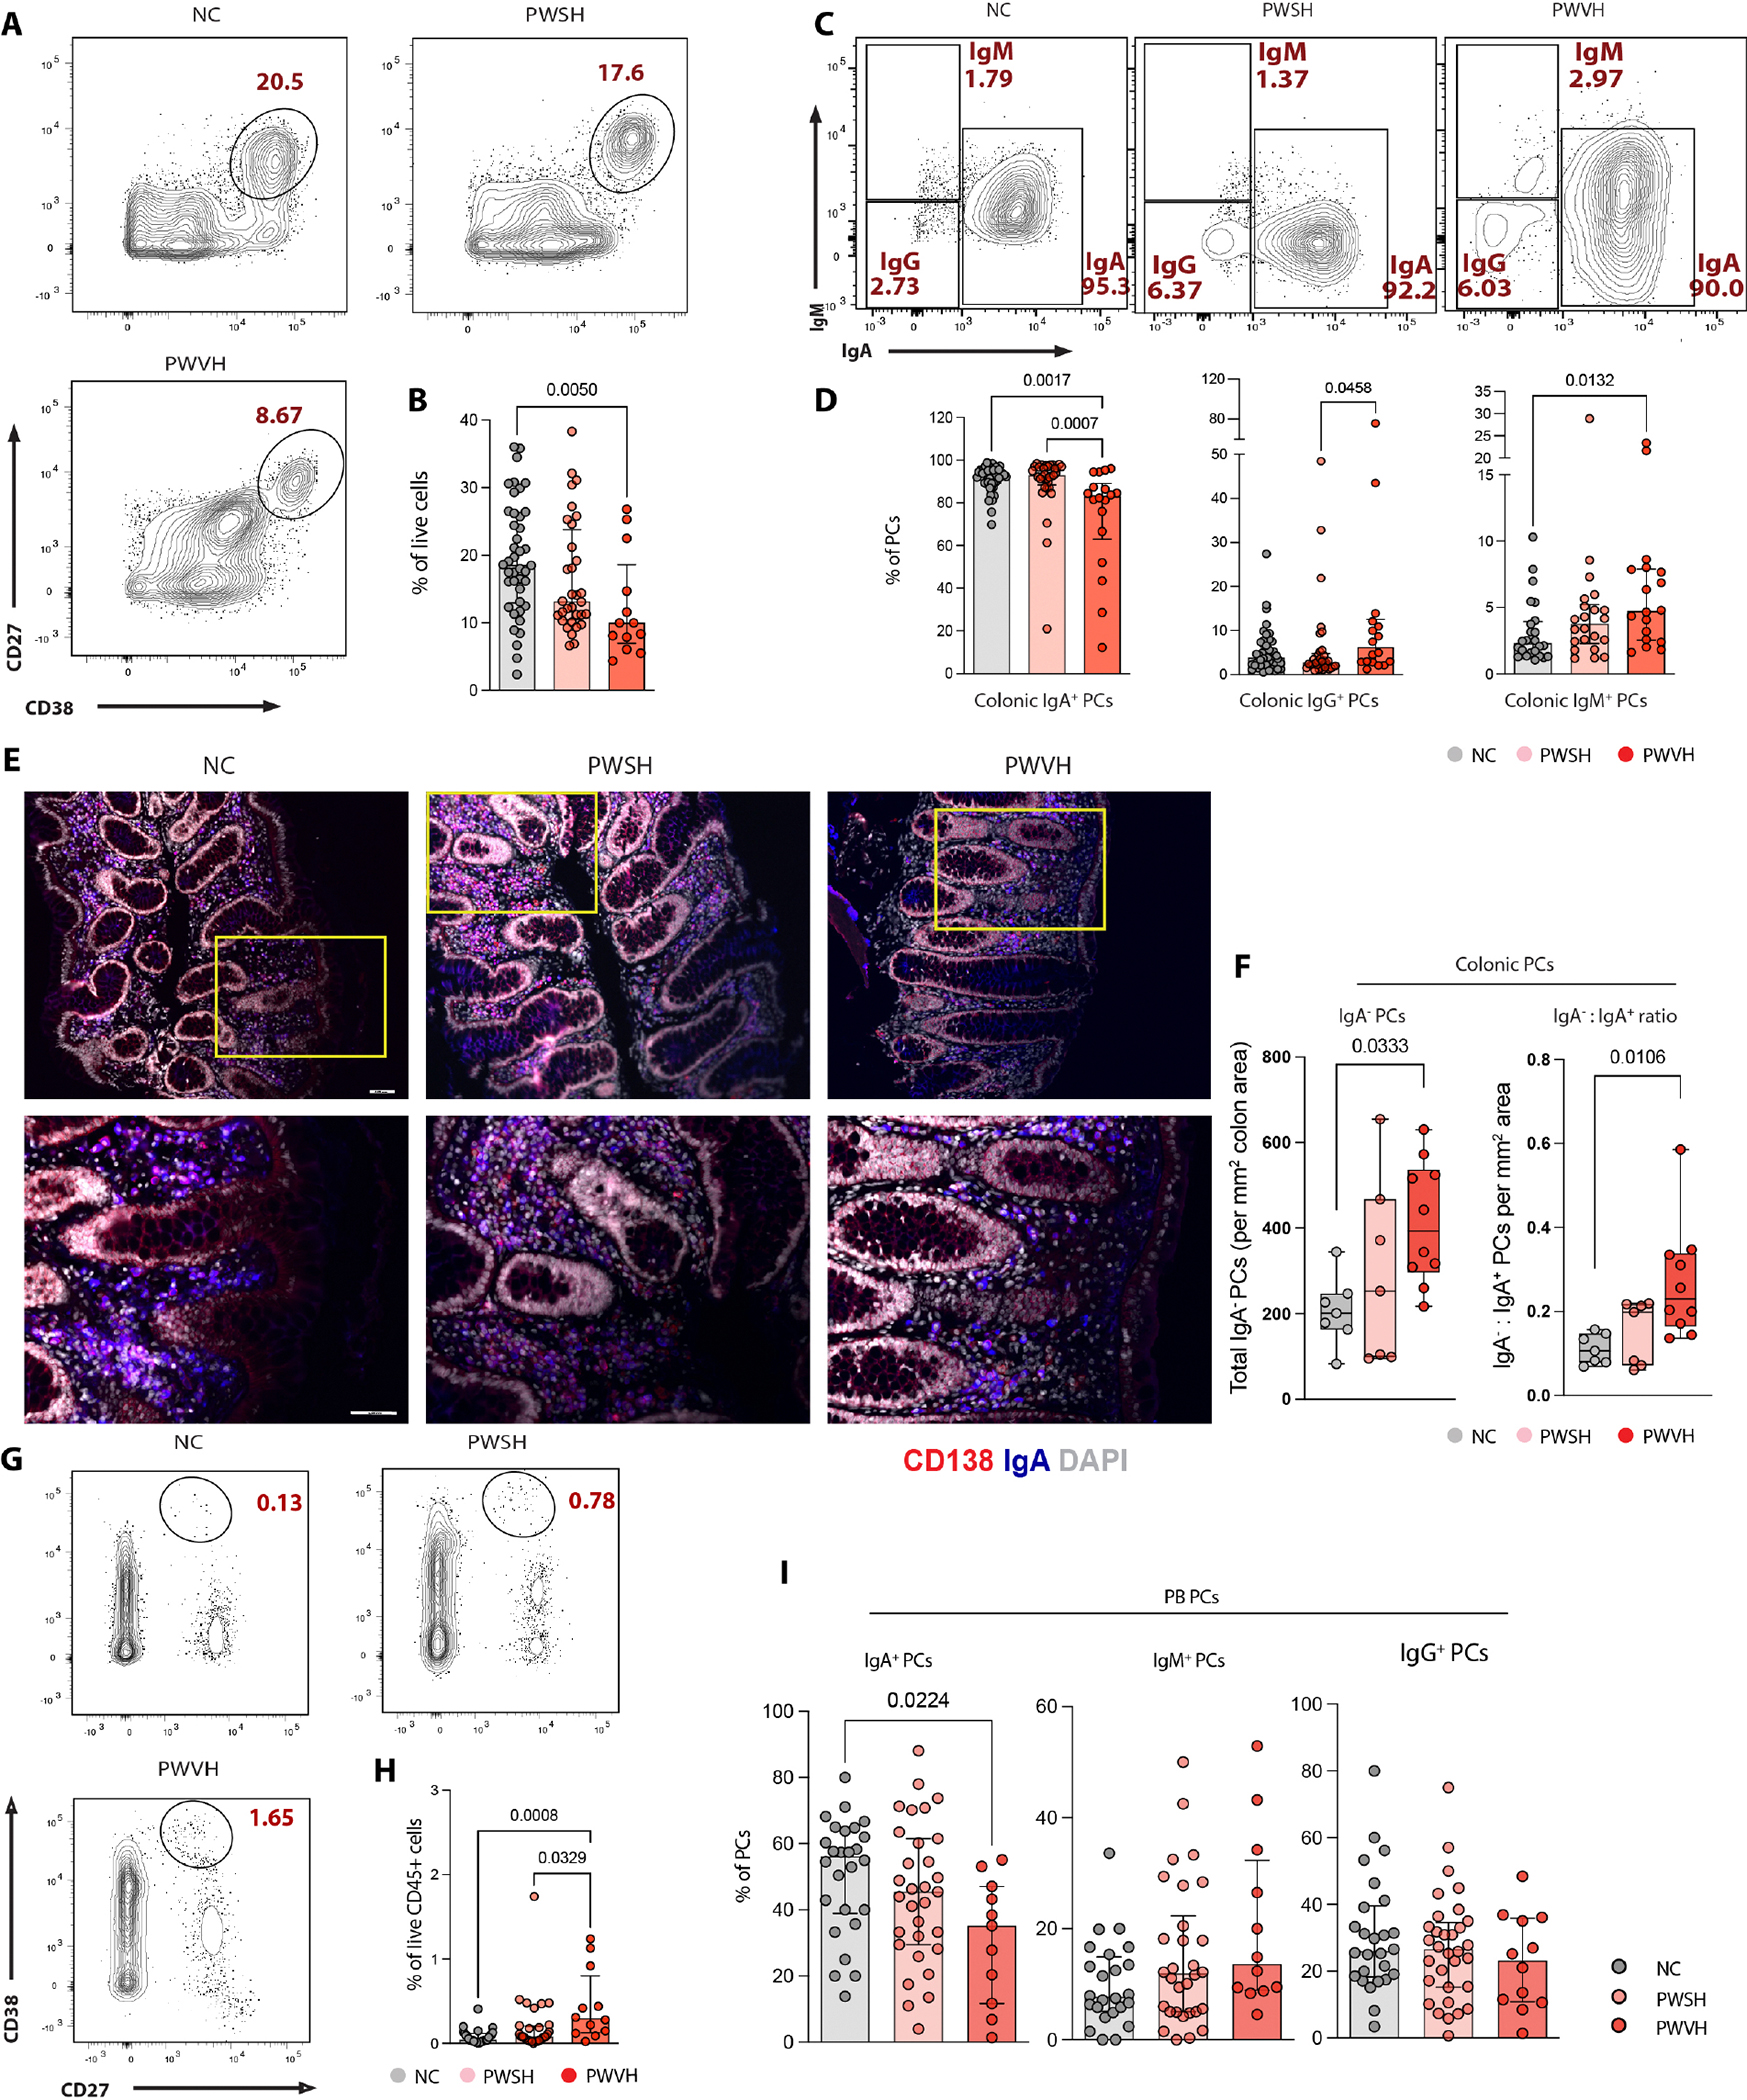
(A) Representative flow cytometry plots of PCs (live CD27+CD38hicells) derived from NCs, n = 51; PWSH, n = 35; PWVH, n = 16. (B) Summary data quantifying colonic PCs for each of the three groups. (C) Representative flow cytometry plots demonstrating PC isotype expression. (D) Summary data quantifying colonic IgA+, IgG+, and IgM+ PCs. (E) Representative immunofluorescence (IF) images showing the expression of CD138 (red), IgA (blue), and DAPI (4′,6-diamidino-2-phenylindole) (gray). Top panels (10× magnification) with yellow inset are shown in the bottom panels (20× magnification). Red cells indicate IgA− PCs, blue cells indicate IgA+ cells, and purple cells (merge) indicate IgA+ PCs. (F) Summary IF data showing total IgA− PCs per square millimeter area (left) and ratio of IgA−:IgA+ PCs per square millimeter area (right). (G) Representative flow cytometry plots of PB-derived PCs (live CD45+CD27+IgD−CD38hicells) for each of the three groups. (H) Summary data quantifying PB PCs. (I) Summary data quantifying PB-derived IgA+, IgM+, and IgG+ PCs. Comparisons between groups were performed using Kruskal-Wallis test with Dunn’s correction for multiple comparisons. Median and interquartile range was used to plot summary data, and P values <0.1 are shown as indicated (P values >0.1 are not shown).
Next, we quantified the absolute numbers of IgA+ and IgA− PCs and noted that PWVH showed a twofold increase in IgA− PCs (P = 0.0333) and IgA−:IgA+ PC ratio (P = 0.0106) compared with NCs (Fig. 3, E and F, and table S19). Using the criteria defined by Landsverk et al. (43), we characterized changes in short-lived (SL; live, CD27+ CD38hiCD45+CD19+ cells), long-lived (LL; live, CD27+CD38hi CD45+CD19− cells), and very long-lived (VLL; live, CD27+CD38hi CD45−CD19− cells) (fig. S2A and table S17) PCs and noted trends similar to those observed in the overall PCs in the colon (fig. S8C and table S17). In the ileum, a higher frequency of LL PCs was noted for PWVH compared with NCs (fig. S8D and table S17). Again, isotype expression across PC subclasses showed trends similar to those observed for the overall PCs (fig. S8, E and F, and table S17).
In contrast with the intestinal mucosa and similar to prior reports (44, 45), an increased frequency of PCs was observed in the peripheral blood (PB) in PWVH compared with the other two groups (Fig. 3, G and H, and table S17). Similar to what was observed in the colonic LP, a reduced frequency of IgA+ PCs was noted in the PB of PWVH compared with NCs (Fig. 3I and table S17).
Together, these data show a correlation between the perturbed GC output and the reduction in mucosal antibody-secreting PCs. Further, there is a switch in the PC isotype expression from the homeostatic IgA+ PCs to potentially proinflammatory non-IgA+ PC subsets. Functional studies will be needed to establish a causal relationship between reduced GC B cells and changes in PC frequency and subsets.
To further define intestinal PCs in PWH, we performed scRNA-seq on isolated mononuclear cells from the intestinal LP and bulk RNA sequencing (RNA-seq) of fluorescence-activated cell sorting (FACS)–isolated colonic PCs. scRNA-seq–based subclustering of the PCs (Fig. 4A) revealed 12 (colon) and 8 (ileum) PC subclusters (table S20). On the basis of immunoglobulin gene expression, PCs were grouped into IgA (colon cluster nos. 0, 1, 2, 3, 4, 5, 7, 8, and 9 and ileum cluster nos. 1, 2, 5, and 6), IgM [colon cluster no. 11 and ileum cluster nos. 0 and 3 (mixed IgM and IgA PCs clusters)], and IgG (colon cluster nos. 6 and 10 and ileum cluster nos. 4 and 7) (Fig. 4A; fig. S9, A and B; and tables S21 to 24). We investigated differentially expressed pathways for each PC isotype (FDR < 0.1; Fig. 4B and tables S25 to S27). In colonic PCs, enrichments in interferon (IFN) response (IRF7, ISG15, IFI6, STAT1, IRF9, IRF2, OAS2, IFNAR1, and STAT2), cell cycle regulation (NUMA1, TUBGCP2, and RAD21), apoptosis and cell fate (CFLAR, CASP8, FADD, and TNFRSF10), antigen presentation (HLA-DR, TAPBP, and AP1G1), and antiviral response (PSMA7, PSMC1, and APOBEC3G) pathways were noted, especially for IgA+ PCs, in PWVH. In PWSH, differences in IFN response, cell cycle, apoptosis, and cell metabolism persisted, especially in IgA+ and IgG+ PCs. Furthermore, respiratory chain pathways (SDHA, HADHB, IDH2, and FH) were specifically up-regulated in PWSH, suggesting an altered metabolic state. Pathway dysregulation was less notable in ileum PCs (table S28).
Fig. 4. Plasma cell transcriptional profile is altered during HIV-1 infection.
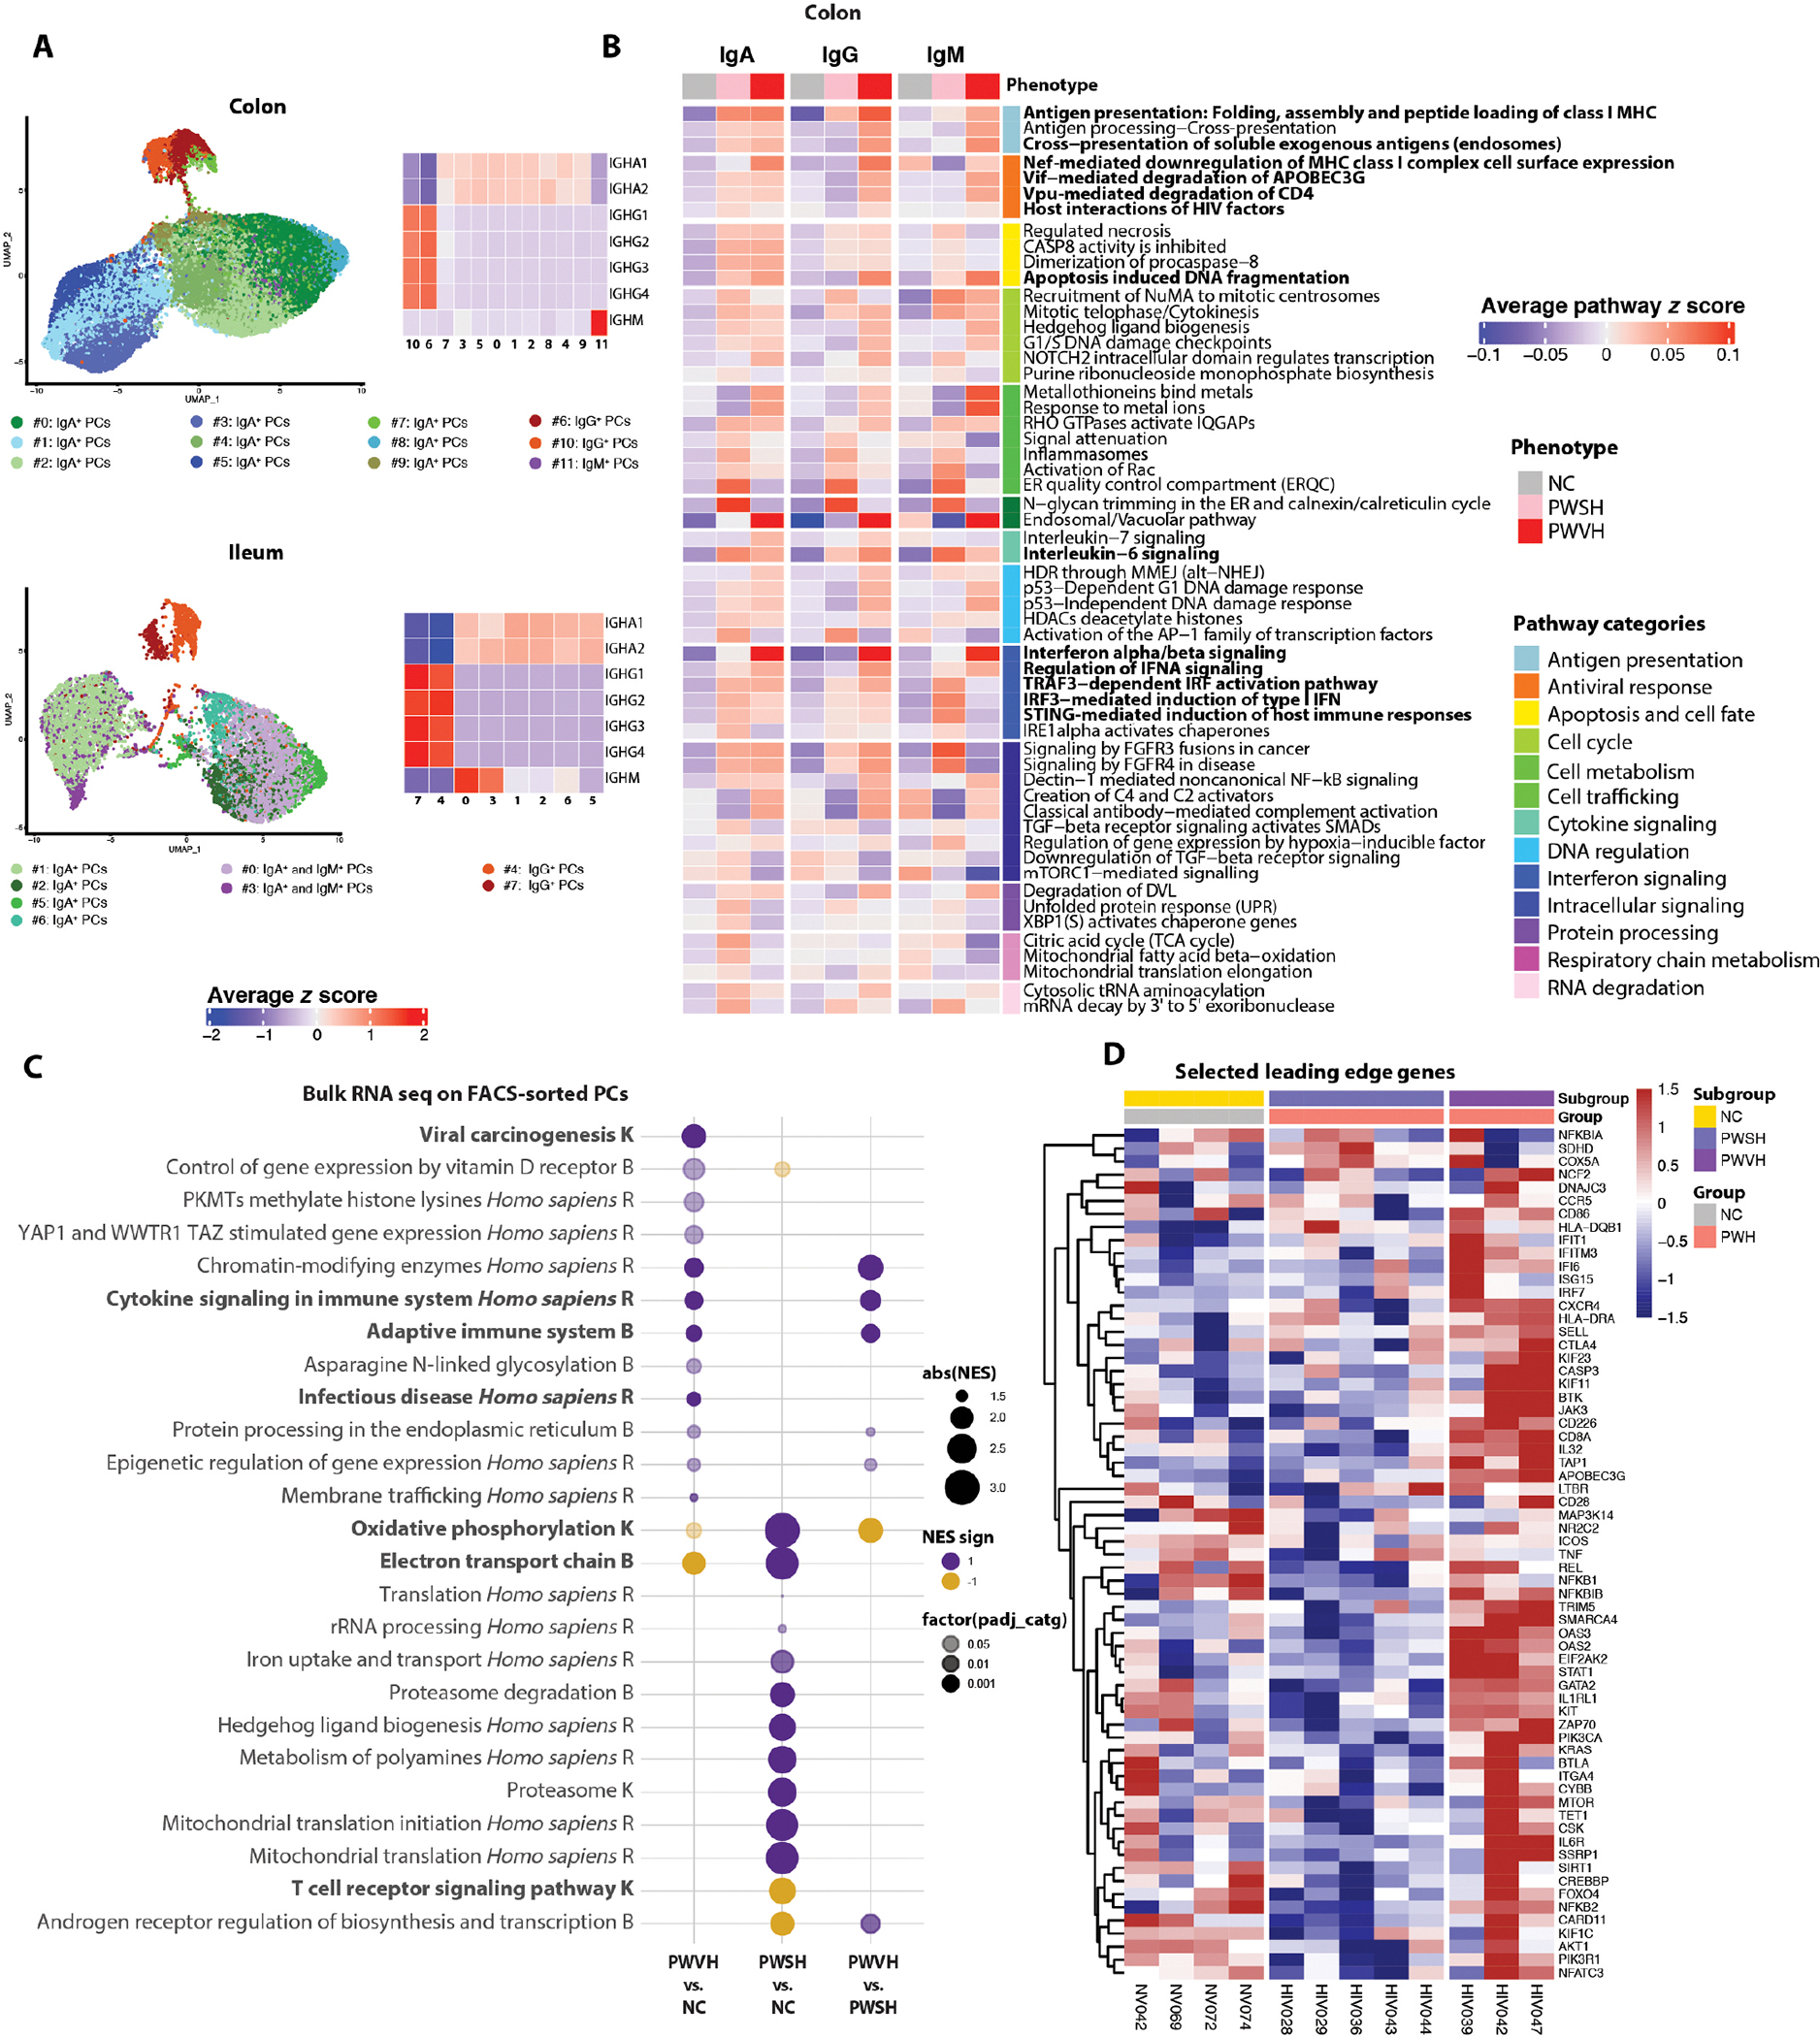
(A) UMAPs (left) showing reclustered and PC clusters using scRNA-seq data and heatmaps (right) showing the average normalized log expression z score of immunoglobulin genes across different colon (top) and ileum (bottom) PC subclusters. (B) Heatmaps showing the mean pathway z score for each colon-derived PC isotype, across the three groups (NCs, n = 9 for colon and n = 5 for ileum; PWSH, n = 5 for both colon and ileum; PWVH, n = 4 for both colon and ileum). (C) Bubble plot showing the Normalized Enrichment Score (NES) of selected pathways of interest derived from the top five pathways identified with Sumer analysis (Materials and Methods) in FACS-sorted colonic PCs of each of the three groups (NCs, n = 4; PWSH, n = 5; PWVH, n = 3). The bubble size represents the NES, and the color represents the direction of the change (purple = increased, yellow = decreased). Color intensity indicates statistical significance levels, with lighter colors indicating P < 0.05, darker colors denoting P < 0.01, and the darkest colors indicating P < 0.001. Pathway names ending with “K” are from the KEGG database, “B” represents Bioplanet, and “R” stands for the Reactome database. (D) Heatmap showing the expression of selected leading edge genes (LEGs) from pathways in (C) for each participant across the three groups.
To further validate these findings, we FACS-isolated colonic PCs and examined their transcriptional profile using bulk RNA-seq from 12 study participants (PWVH, n = 3; PWSH, n = 5; NCs, n = 4, table S29). Because of the small sample size, the analysis was underpowered for detection of differentially expressed genes (at adjusted P < 0.05). However, gene set enrichment analysis (GSEA) leveraging different databases [i.e., Kyoto Encyclopedia of Genes and Genomes (KEGG), Reactome, and Bioplanet] indicated dysregulation of multiple pathways (table S30). To reduce redundancy of pathway information, we performed a Sumer analysis (46) that uses a weighted set cover algorithm to select the fewest number of gene sets that cover all genes associated with the enriched sets (tables S31 to S36). In alignment with the scRNA-seq dataset, PCs from PWVH were enriched in cell cycle (CHAF1A, SETD1A, and CREBBP), IFN signaling (IFI6, IRF7, STAT1, ISG15, OAS2, and OAS3), and innate and adaptive immune pathways (HLA-DRA, HLA-DQB1, CD226, and KIF11) (Fig. 4, C and D, and tables S31 to S36), indicating a proinflammatory response in PWVH. On the other hand, PCs from PWSH showed up-regulation in protein degradation (PSMB and PSMD) and mitochondrial metabolism pathways (ATP6, COX5A, and SDHD) (Fig. 4, C and D, and tables S31 to S36), again demonstrating an altered metabolic state of PCs in PWSH during effective ART. Given the intrinsic methodological differences in the analysis performed via scRNA-seq and bulk RNA-seq, we performed a comparative analysis of the differentially expressed pathways for each of the groups and observed an enrichment in pathways that were shared between the two methodologies across comparisons, especially in the comparisons between PWSH and NCs and PWVH and PWSH (fig. S9C and table S37).
Together, these data demonstrate major perturbations in the number and transcriptional profile of intestinal PCs that accompany the disrupted GC dynamics during HIV-1 viremia. In addition, the transcriptional profile of intestinal PCs remains abnormal during ART, with persistent IFN signaling and an altered metabolic profile, further indicating that the mucosal milieu remains dysfunctional despite suppression of HIV-1 viremia.
HIV-1–induced intestinal T cell disruption associates with PC and B cell abnormalities
Next, we studied the association of HIV-1–induced T cell changes with alterations in intestinal B cells and PCs. Using scRNA-seq, we annotated 18,204 T cells in colon and 17,676 T cells in ileum and identified nine colonic T cell clusters and 10 ileal T cell clusters (Fig. 5, A and B, and table S38). T cell clusters mapped to CD8+ cytotoxic T lymphocytes (CTLs; CD8, GZMM GZMA, GZMB, and IFNG; colon cluster nos. 0, 2, and 7; and ileum cluster nos. 0 and 7), naïve and central memory T cells (CCR7 and CD27, colon cluster no. 3, and ileum cluster no. 4), and effector memory T cells (CD27 and ICOS, colon cluster nos. 1, 4, and 8; and ileum cluster nos. 1, 2, 3, 6, and 9) (Fig. 5, C and D, and tables S39 to S42). In addition, we identified regulatory T cells (Tregs; FOXP3 and MAF) in the colon (cluster no. 5) and ileum (cluster no. 8) as well as a T follicular helper cell (TFH)–like cluster (CD40L and BCL6) in the colon (cluster no. 6) and ileum (cluster no. 5). In PWH, the fraction of CD4+ T cells was decreased and the fraction of CD8+ T cells was increased compared with that in NCs (Fig. 5, E and F, and table S43). We observed a decrease in naïve and central memory T cells and an increase in effector memory T cells in PWVH in both colon and ileum as well as a nonsignificant decrease in the fraction of Tregs in the colon (Fig. 5, E and F, and table S43).
Fig. 5. Viremic HIV-1 infection is associated with perturbations in T cell subsets including TFH-like cells.
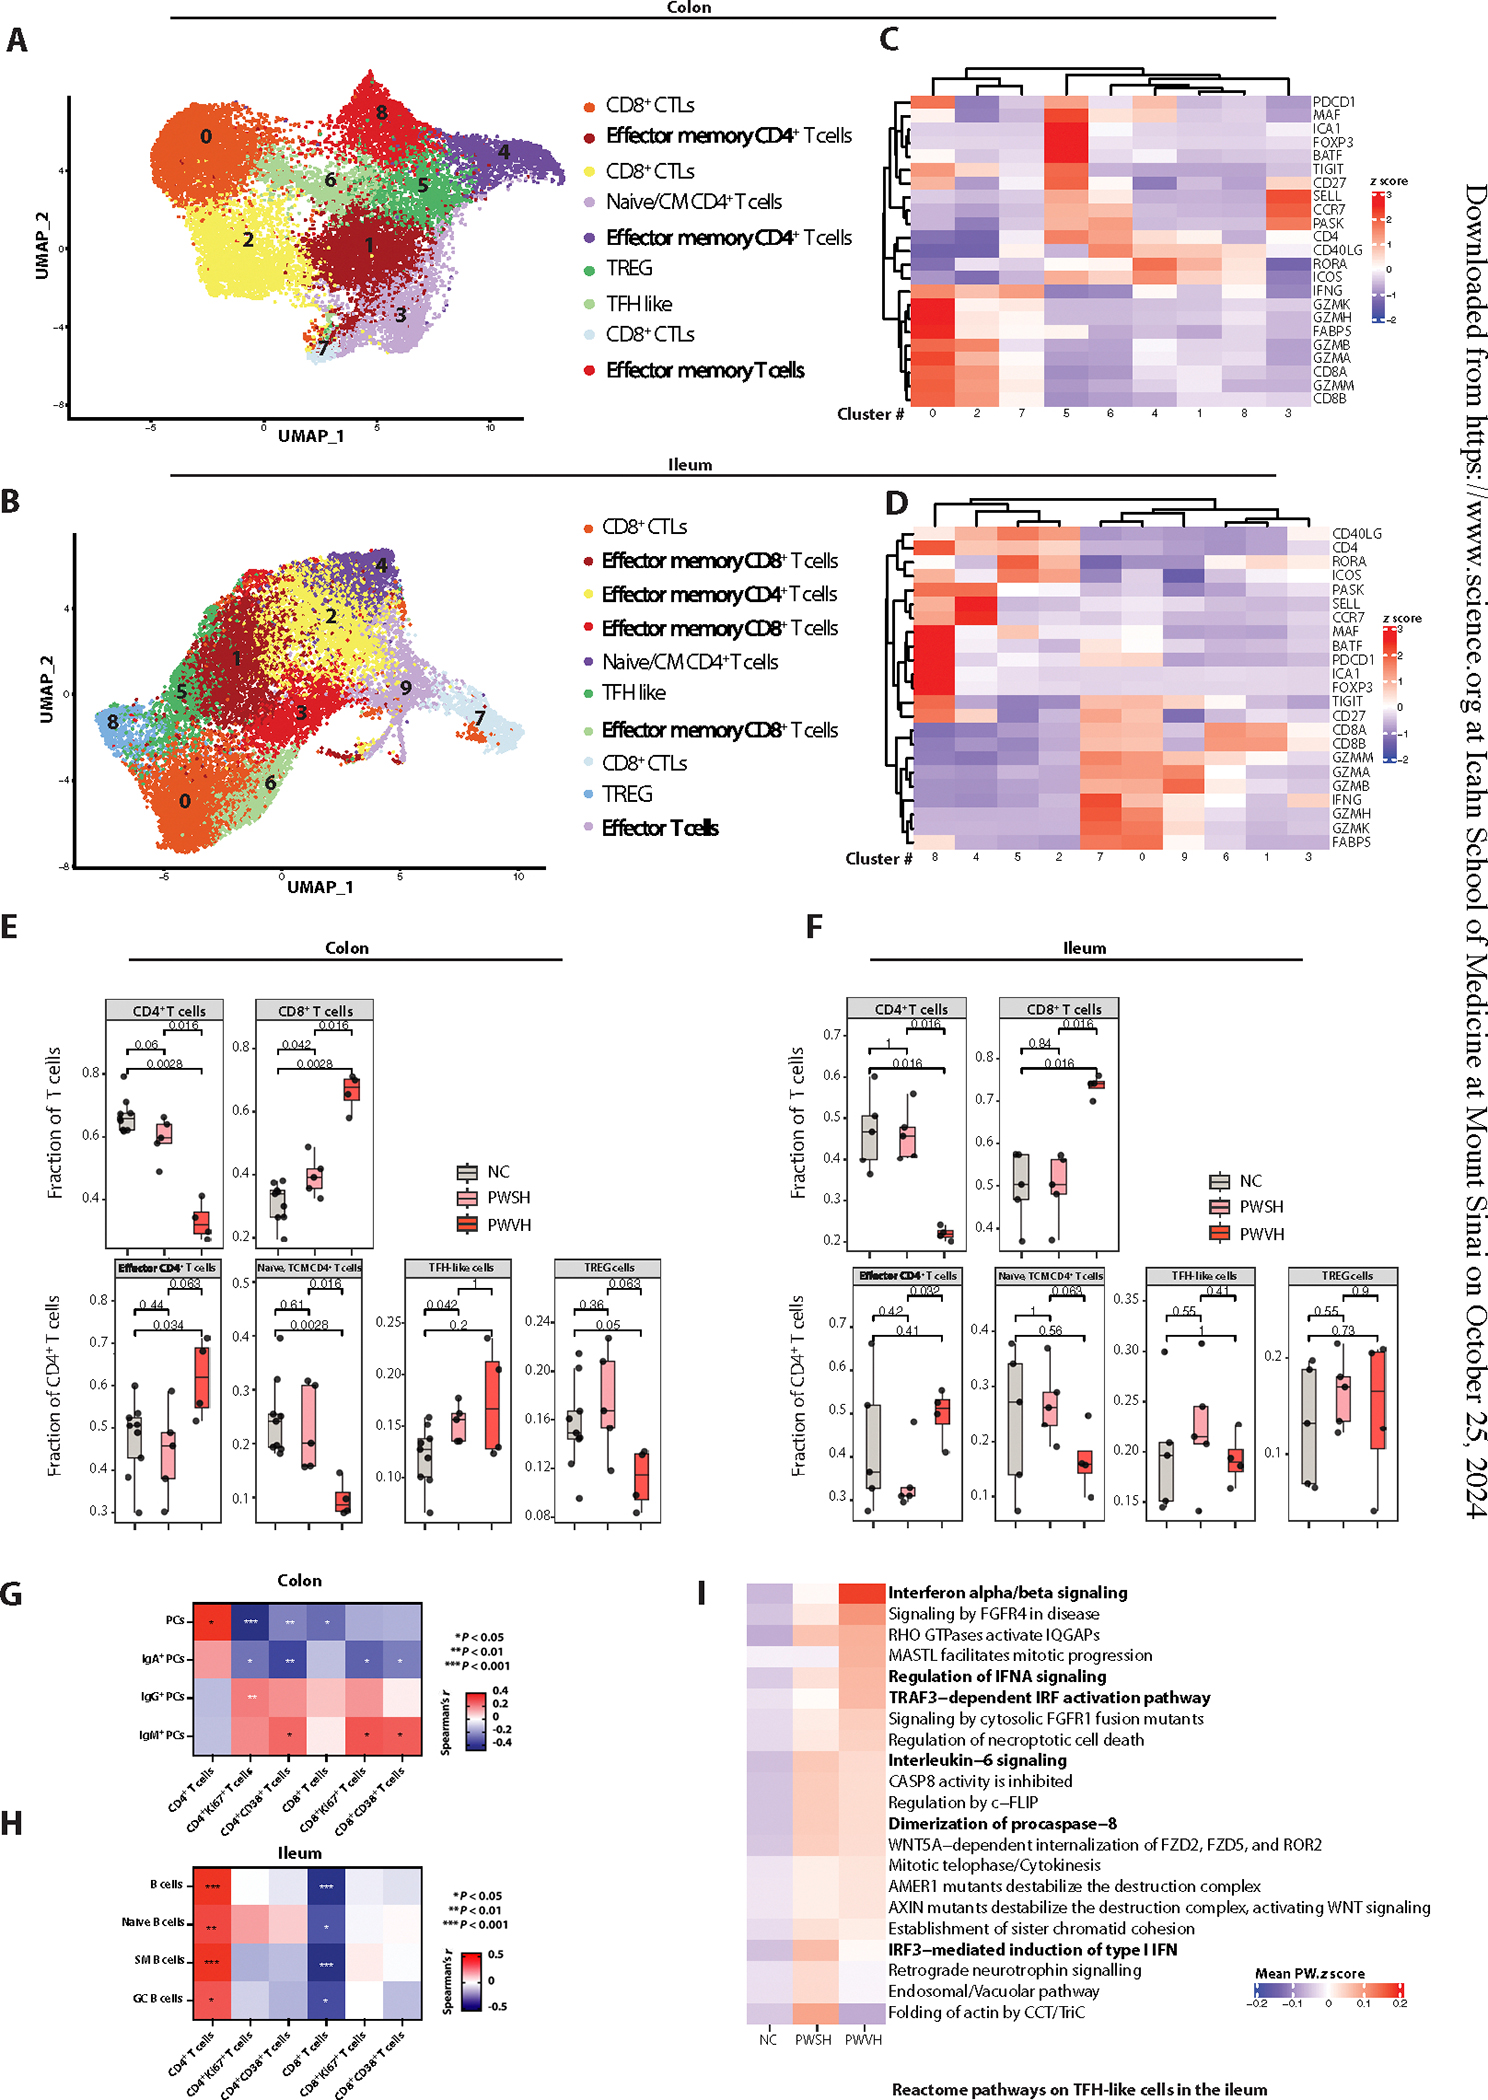
(A and B) UMAPs showing reclustered, colon (A)– and ileum (B)–derived T cell clusters using scRNA-seq. (C and D) Heatmaps showing the average z score–normalized log expression of T cell–related genes across different colon-derived (C) and ileum-derived (D) T cell subclusters. (E and F) Boxplots showing the scRNA-seq–derived frequencies of colon-derived (E) and ileum-derived (F) CD4+ and CD8+ T cells as a fraction of all T cells (top), across the three groups (NCs, n = 9 for colon and n = 5 for ileum; PWSH, n = 5 for both colon and ileum; PWVH, n = 4 for both colon and ileum). In (E) and (F), bottom boxplots show the scRNA-seq–derived frequencies of colon-derived (E) and ileum-derived (F) subtypes of CD4+ T cells, across the three groups. In (E) and (F), comparisons were performed with Wilcoxon test; P values are as indicated. (G) Correlation matrix showing relationships between frequencies of colonic PCs and PC isotypes and frequency of colonic T cell subsets. (H) Correlation matrix showing relationships between frequencies of ileum-derived B cells and frequency of ileal T cell subsets. (G) and (H) represent data derived from the flow cytometric dataset (NCs, n = 51; PWSH, n = 35; PWVH, n = 16). (I) Heatmap representing the mean z score enrichment for selected pathways within the ileum-derived TFH-like T cell subcluster.
We confirmed a significant depletion of CD4+ T cells in the intestinal mucosa in PWVH compared with NCs by FC, which did not normalize in PWSH (fig. S10, A and B, and table S17). We also detected increased frequencies of activated (CD38+) and cycling (Ki67+) CD4+ and CD8+ T cells in PWVH compared with NCs (figs. S2C and S10, C to F, and table S17). Next, we assessed the association between intestinal T cells and intestinal PCs. We found an inverse correlation between the frequency of colonic PCs and colonic IgA+ PCs and activated and cycling T cells (Fig. 5G; fig. S10, H and I; table S17). Conversely, a direct correlation was found between the frequency of colonic IgM+ (and to a lesser extent IgG+) PCs and activated and cycling T cell subsets (Fig. 5G, fig. S10J, and table S17), suggesting an association between the local inflammatory milieu and decreased PC frequency with a shift of PC isotype to non-IgA+ PCs. In the ileum, a direct correlation between total B cells, naïve B cells, switched memory (SM) B cells, and GC B cells was observed with CD4+ T cells. An inverse correlation was detected between CD8+ T cells and total B cells, naïve B cells, SM B cells, and GC B cells (Fig. 5H, fig. S10K, and table S17).
Next, we examined the contribution of TFH cells in the perturbed GC dynamics. In the scRNA-seq dataset, a higher proportion of colonic CD4+ T cells mapping to the TFH-like cluster was noted in PWSH compared with NCs. A similar, although nonsignificant, trend was also noted for PWVH in the colon as well as for PWH in the ileum (Fig. 5, E and F). Because functional abnormalities within TFH cells are reported in PWH (47, 48), we examined the transcriptional profile of TFH cells using scRNA-seq and observed increased activation of type I IFN, IFN response, cell division, and apoptosis pathways in PWVH in both the ileum and the colon (Fig. 5I, fig. S10L, and tables S44 and S45). Similar changes were seen in the TFH-like cell clusters of PWSH, suggesting that despite no detectable change in the relative frequency of TFH-like cells, the transcriptional profile of this population is altered during HIV-1 infection.
Changes in intestinal PCs are associated with systemic inflammation
To determine whether the observed perturbations in intestinal PCs affected the systemic immune milieu, we examined soluble and cell-associated inflammatory parameters in the circulation of the study participants. As reported previously (49–51), we confirmed a higher frequency of PB-activated T cells (CD38+CD4+ and CD38+CD8+ T cells) in PWVH and, to a lesser extent in PWSH, compared with NCs (Fig. 6, A and B, and table S17). PWVH also had an increased frequency of cycling (Ki67+CD4+ and Ki67+CD8+) T cells compared with NCs (Fig. 6, C and D, and table S17). Colonic IgA+ PCs inversely correlated with the frequency of activated and cycling CD4+ and CD8+ T cells in circulation. Conversely, colonic IgM+ PCs were directly correlated with both activated and cycling CD4+ and CD8+ T cells in circulation (Fig. 6E and table S17).
Fig. 6. Altered frequency and isotype expression of colonic PCs contribute to persistent systemic inflammation and immune activation during HIV infection.
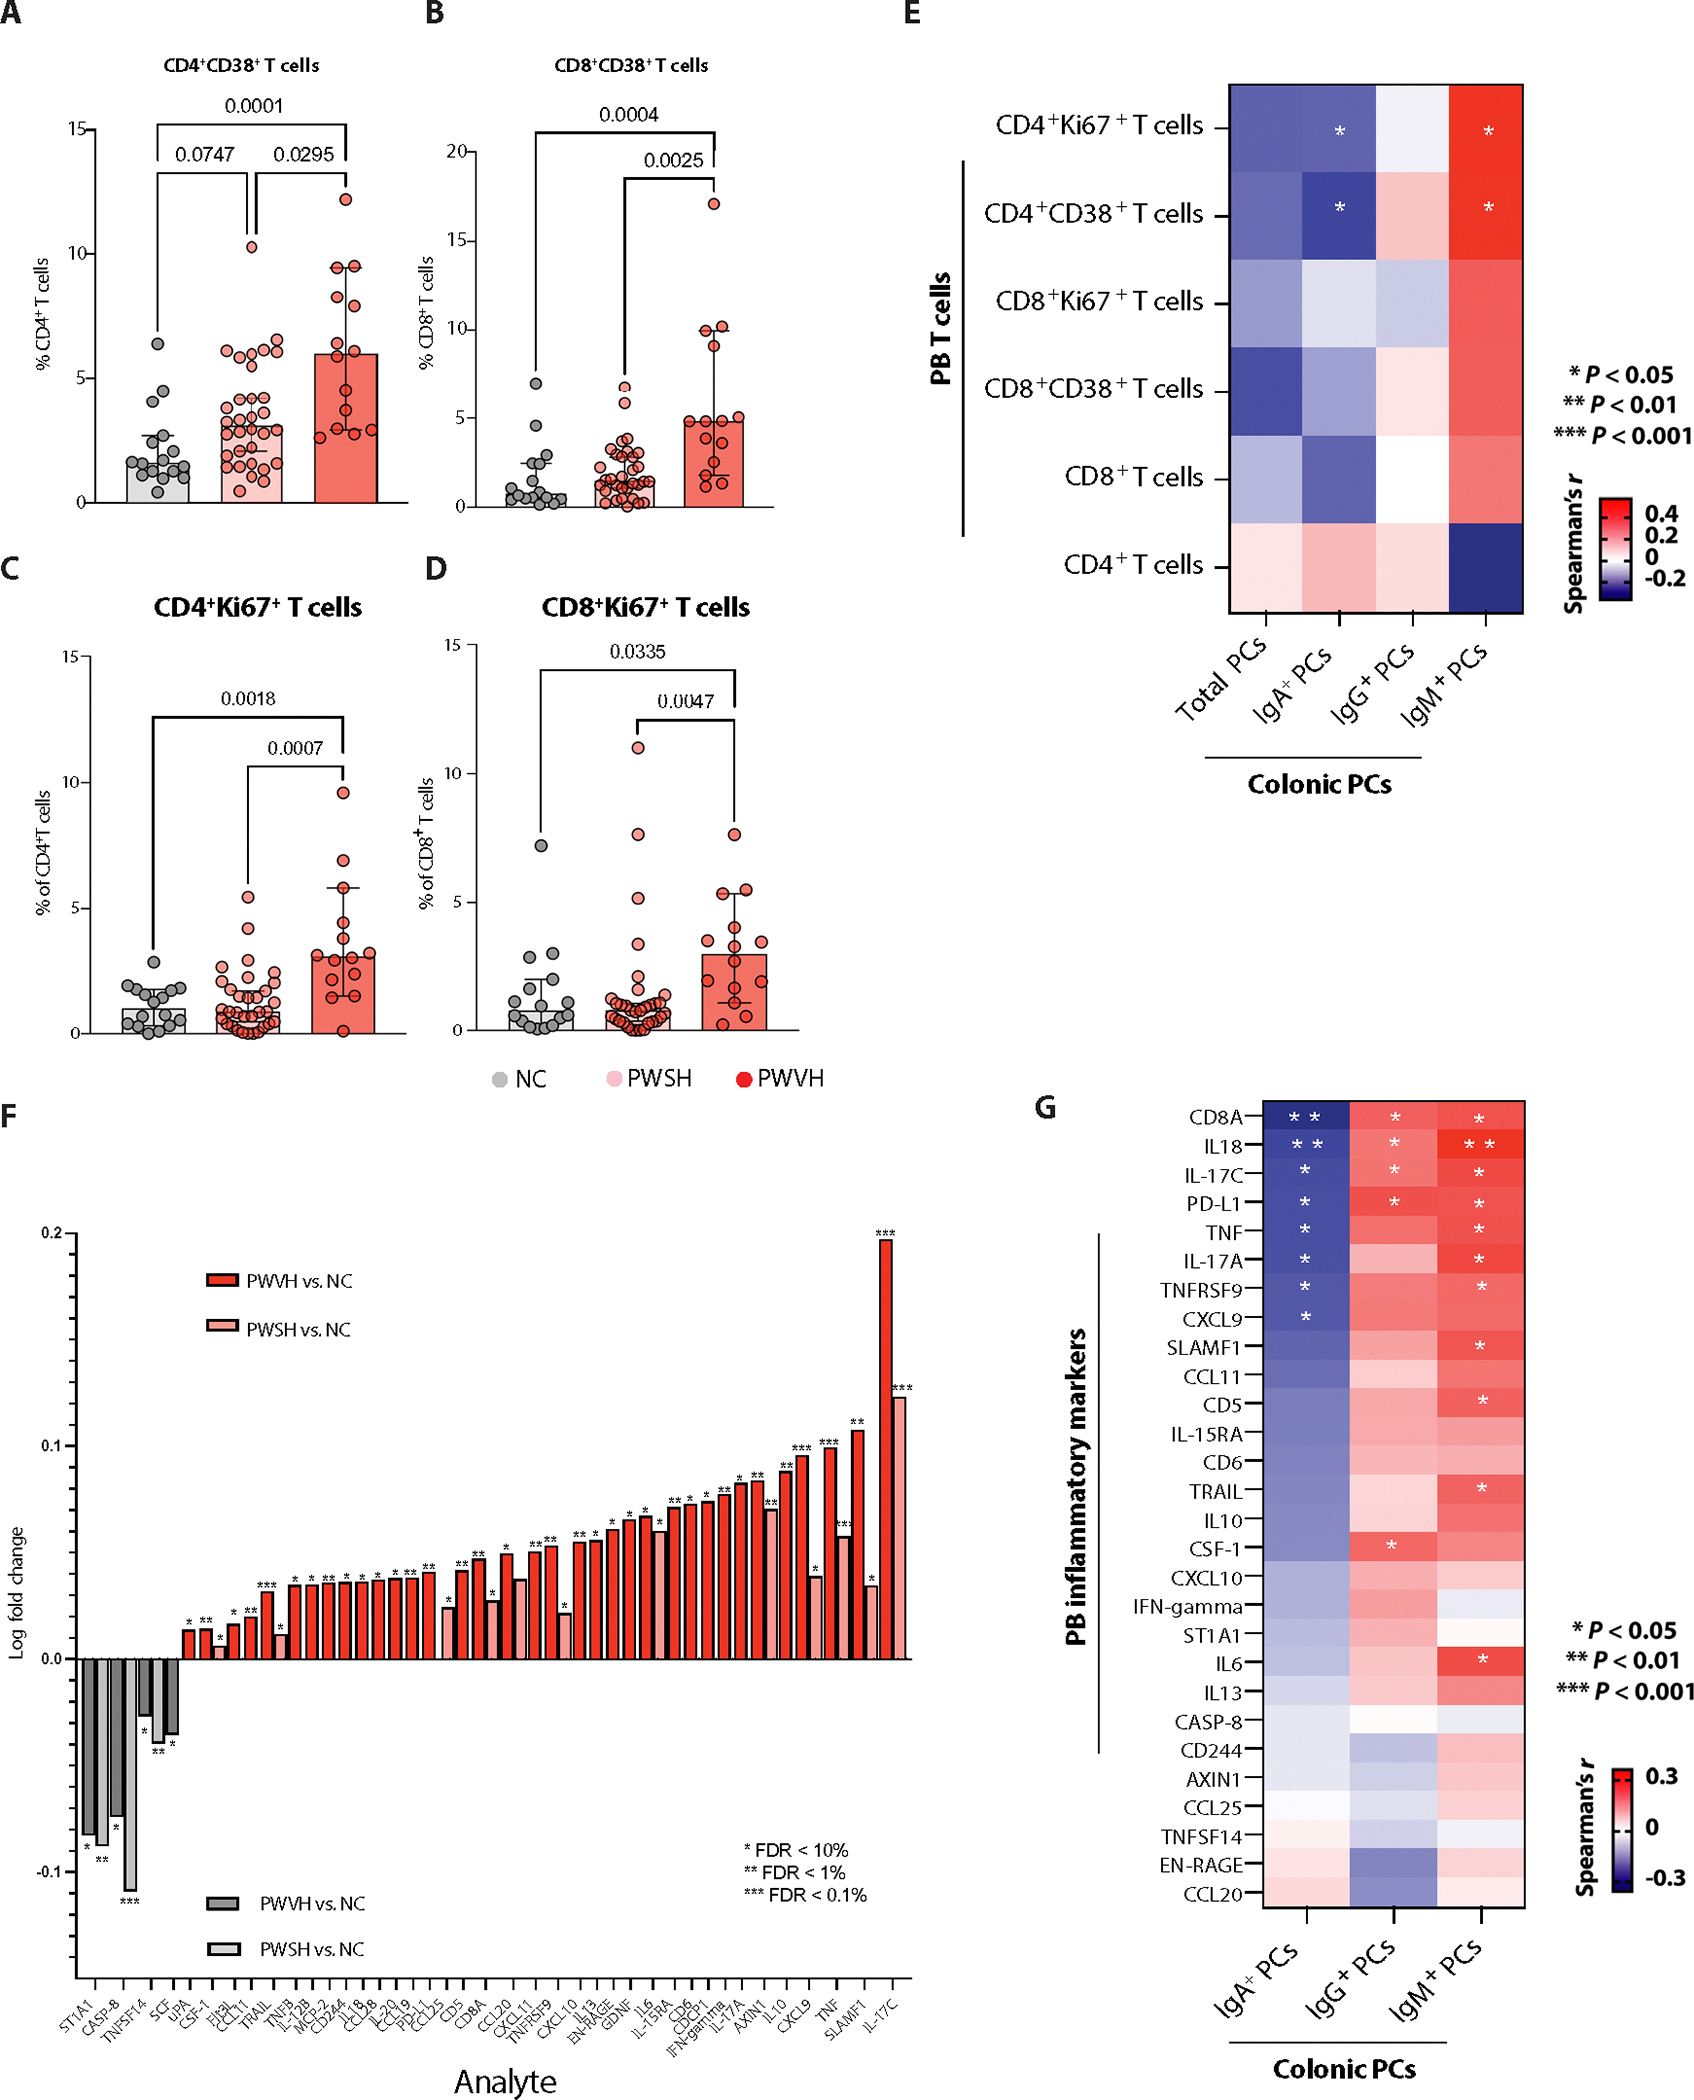
(A and B) Frequency of PB-derived, activated (CD38+) CD4 T cells (A) and CD8+ T cells (B) obtained via flow cytometry, across the three groups of study participants (NCs, n = 33; PWSH, n = 32; PWVH, n = 12). (C and D) Frequency of PB-derived cycling (Ki67+) CD4+ T cells (C) and CD8+ T cells (D) across the three groups of study participants. For (A) to (D), comparisons between groups were performed using Kruskal-Wallis test with Dunn’s correction for multiple comparisons. Median and interquartile range were used to plot summary data; P values <0.1 are shown as indicated (P values >0.1 are not shown). (E) Correlation matrix showing the correlation between colonic PCs and PC isotypes and PB-derived activated and cycling T cell subsets using flow cytometry data, and correlation was obtained using Spearman’s r correlation coefficient; P values are as indicated. (F) Bar plot showing systemic inflammatory markers in PWVH compared with NCs (dark red) and in PWSH versus NCs (light red). Dark gray bars represent systemic inflammatory markers found to be significantly higher in NCs compared with PWVH, and light gray bars indicate systemic inflammatory markers found to be significantly higher in NCs compared with PWSH. Comparisons were performed by Student’s t test with Benjamini-Hochberg correction for multiple comparisons; P values are as indicated. (G) Correlation matrix showing the relationship between flow cytometry–derived colonic PCs as well as PC isotypes and systemic inflammatory markers noted to be elevated in PWH compared with NCs. Correlation was obtained using Spearman’s r correlation coefficient; P values are as indicated.
We then examined a panel of soluble circulating inflammatory parameters using a multiplexed proteomic assay in all study participants [n = 86; PWVH, n = 13; PWSH, n = 39; NCs, n = 34 (table S46)] for whom plasma samples were available. After correcting for multiple comparisons, 34 analytes were found to be significantly increased during HIV-1 infection. PWVH showed higher concentration of analytes relating to T cell activation (IL-17C, SLAMF1, IL10, IFN-γ, CD6, IL-15RA, IL6, EN-RAGE, IL-13, CCL20, CD8A, PD-L1, IL-20, CD244, TNFB, CCL11, and FLT3L), myeloid cell activation (SLAMF1, TNF, CXCL9, IL6, EN-RAGE, CXCL10, TNFRSF9, CXCL11, CCL20, PD-L1, CCL19, IL-20, CD244, and IL-12B), B cell activation (SLAMF1, CD6, CD5, PD-L1, and IL-20), and NK cell activation (IFN-γ, IL-20, IL-18, CD244, TRAIL, and FLT3L). Of these analytes, 17 remained increased in PWSH, including markers of T cell activation (IL-17C, SLMAF1, CD6, IL-15RA, IL6, CCL20, and CD8A), myeloid cell activation (SLAMF1, TNF, CXCL9, CCL20, and IL-20), B cell activation (SLAMF1), and NK cell activation (TRAIL) (Fig. 6F and table S46). NCs, on the other hand, had increased concentrations of analytes involved in stem cell activation (SCF), T cell and dendritic cell proliferation (TNFSF14), and cell apoptosis (CASP-8). We found an inverse association of colonic IgA+ PCs and a direct association of IgG+ and IgM+ with most of the analytes that were increased during HIV infection (Fig. 6G). Together, these results demonstrate perturbed T cell dynamics in the GI tracts of PWH, with T cell activation associated with a decrease in colonic PCs, a shift toward nonhomeostatic PC isotypes, and an inverse correlation between IgA+ PCs and markers of systemic inflammation during HIV-1 infection.
Discrete intestinal microbiome changes associate with distinct colonic PCs isotypes
Given the intimate, bidirectional communication of the intestinal microbiota with the mucosal immune system (52–56), we examined the relationship between reduced IgA+ PCs and the microbiota by sorting IgA-bound and unbound bacteria from stool suspensions (Materials and Methods) in a subset of study participants (7 PWVH, 18 PWSH, and 16 NCs). The frequency of IgA-bound bacteria trended lower in PWVH compared with both PWSH and NCs (Fig. 7, A and B, and table S47). Similar findings were observed in a validation cohort [Consortium for the Evaluation and Performance of HIV Incidence Assays (CEPHIA) of the University of California, San Francisco; Materials and Methods] where IgA binding of stool bacteria was analyzed for 5 PWVH, 13 PWSH, and 12 NCs (fig. S11A and table S47). To delineate bacterial species targeted by IgA-mediated host immune response, we performed IgA-seq analysis of sorted IgA-bound versus unbound bacteria in each of the three groups and calculated the log ratio of bound to unbound bacteria at the genus level (57). The IgA log Palm score for Actinomyces (R = 0.44, P = 0.049) and Eubacterium (R = 0.52, P = 0.015) correlated with the log abundance of IgA+ PCs within each individual, and the IgA log Palm score for Eubacterium inversely correlated with the log abundance of IgG+ PCs (Fig. 7C and table S48), suggesting an additional homeostatic role for this genus, which has previously been shown in the context of healthy gut microbiome (58–60).
Fig. 7. Distinct intestinal microbiota changes and targeting by secretory IgAs during HIV infection relate to altered colonic PC isotype expression.
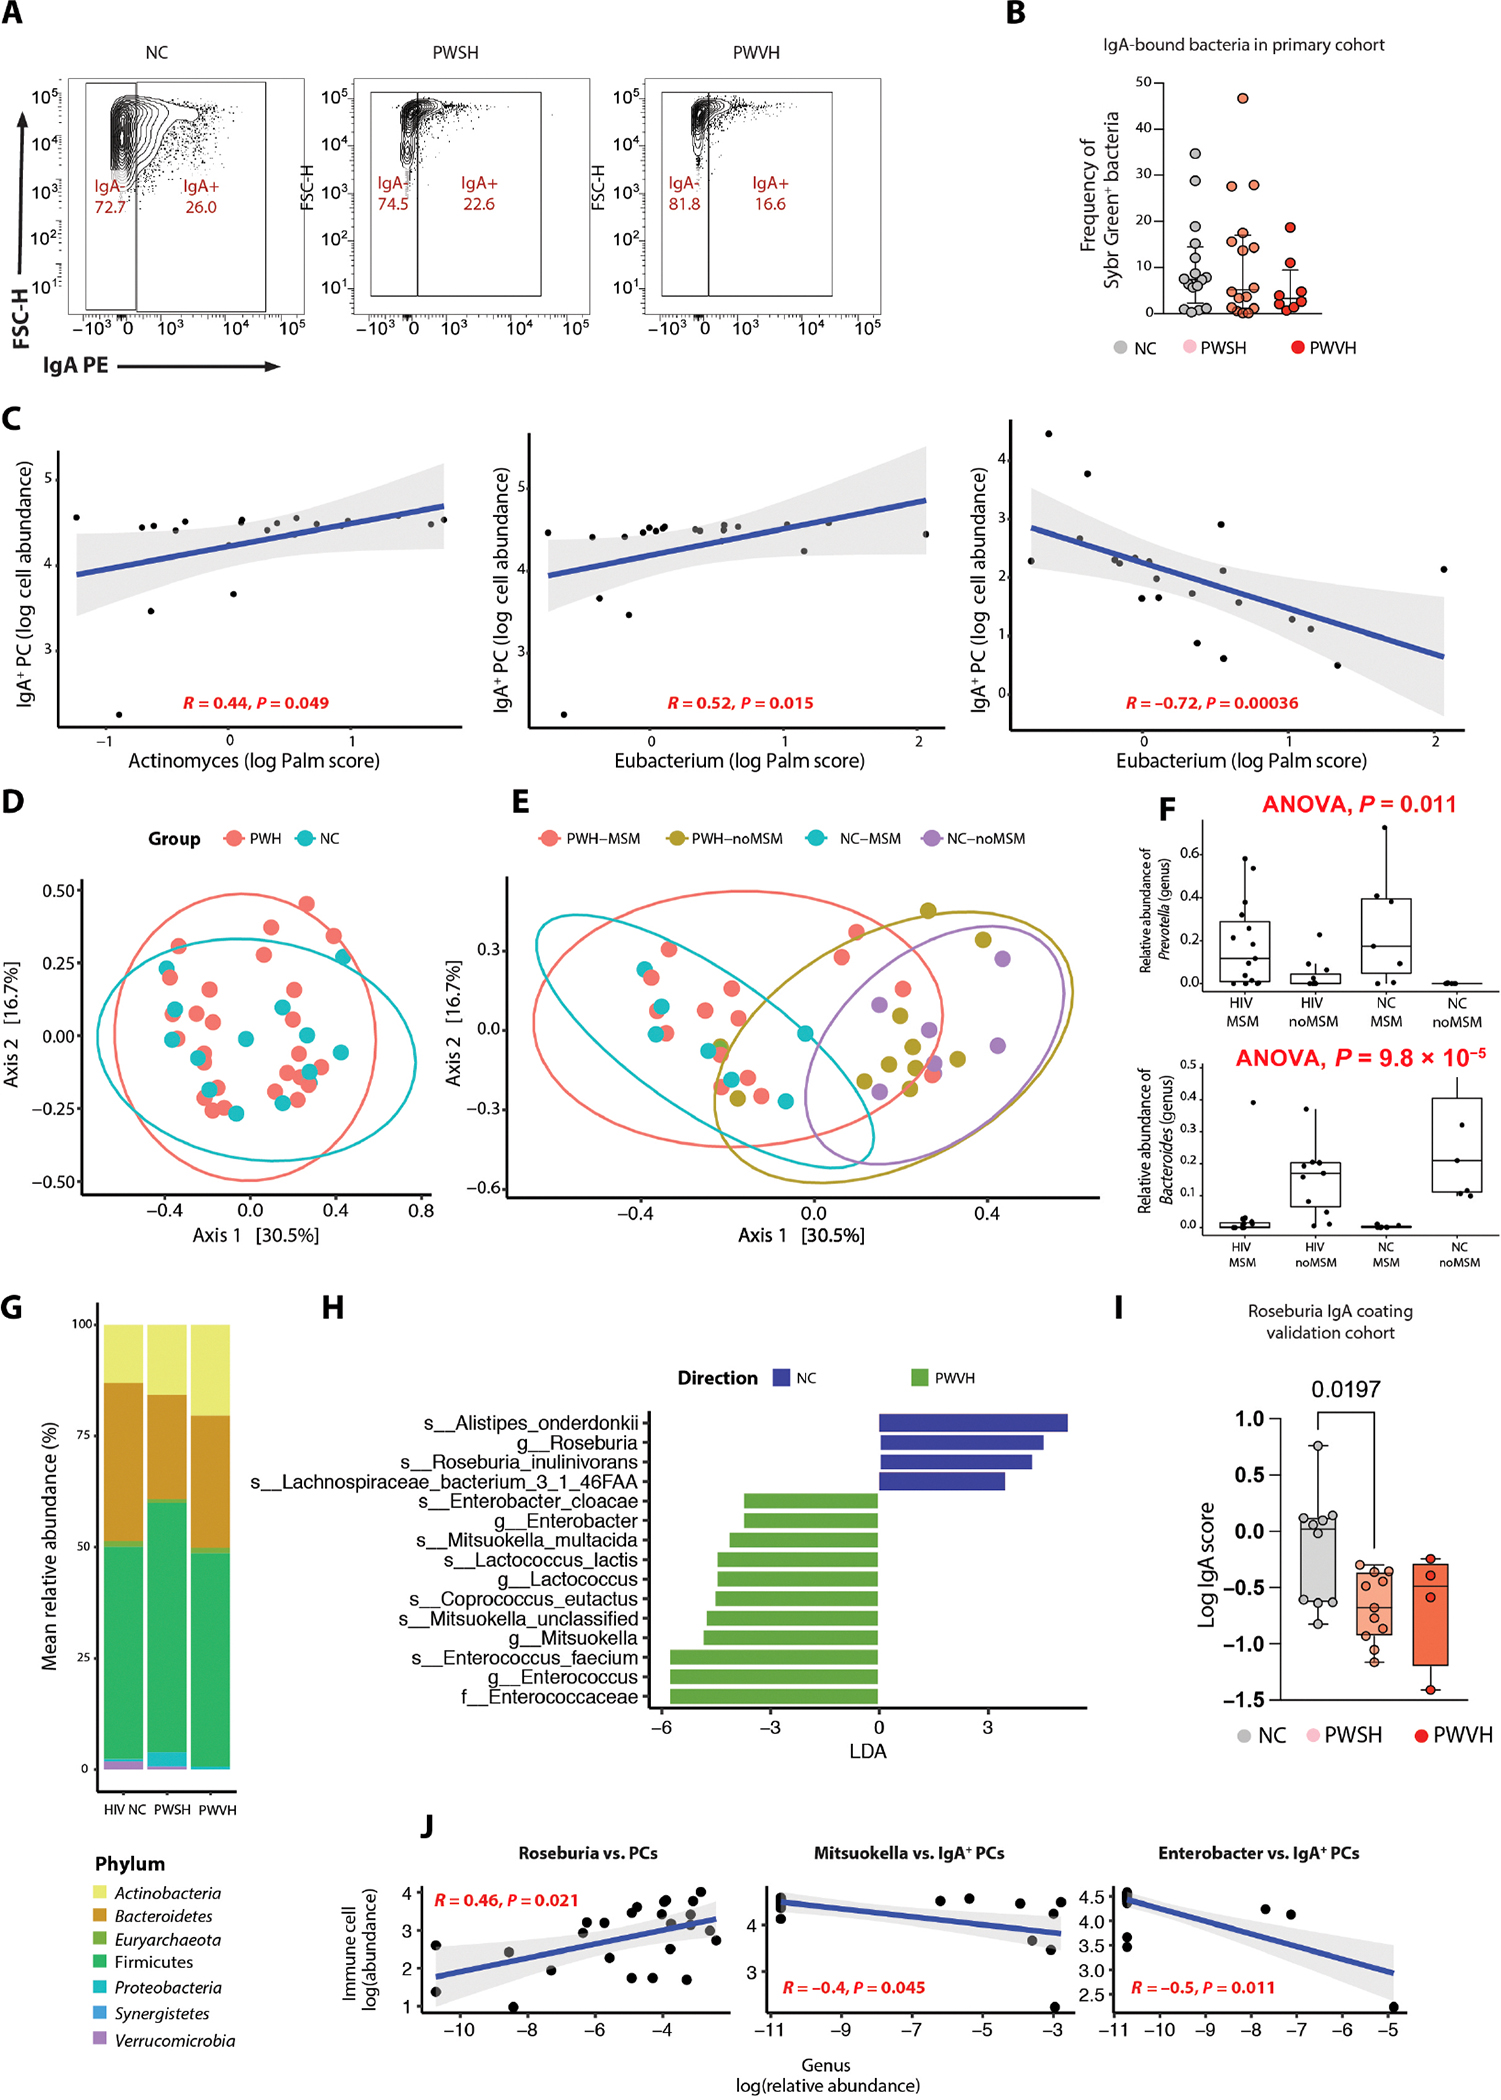
(A) Representative flow plots showing IgA-bound and unbound stool bacteria across the three groups (NCs, PWSH, and PWVH). (B) Summary data representing the frequency of IgA-bound bacteria across the three groups where stool samples were available for stool bacteria sorting in the primary cohort (NCs, n = 16; PWSH, n = 18; PWVH, n = 7). Bar represents median and IQR values. Statistical comparisons were performed with Mann-Whitney test; P values are as indicated. (C) Correlation plots between log Palm score and log cell abundance of IgA+ or IgG+ colonic PCs for bacteria where a significant correlation was found. (D) PCoA plot showing beta diversity (using Bray-Curtis distances) between PWH and NCs. (E) PCoA plot showing beta diversity (using Bray-Curtis distances) across PWH who are MSM or not and NCs who are MSM or not. (F) Box plots showing the relative abundance of Prevotella (top) and Bacteroides (bottom) across PWH and NCs who are MSM or not. (G) Bar plot showing the distribution of bacterial phyla across the three groups. (H) LEfSe performed on all operational taxonomic units (OTUs) comparing PWVH and NCs. (I) Log IgA score for Roseburia in the validation cohort. Bar represents median and IQR values. Statistical comparisons performed with Mann-Whitney test; P values are as indicated. (J) Correlation plots between the relative abundance of selected bacterial genera and the frequency of colonic PCs or IgA PCs.
To define the impact of the altered host immune landscape on the overall composition of the intestinal microbiota, we examined the stool metagenome of PWVH (n = 7), PWSH (n = 18), and NCs (n = 16). Among the 25 PWH for whom stool microbiota was analyzed, 15 participants identified as men who have sex with men (MSM) (table S1). Because sexual practices may affect the intestinal microbiome (31, 61–63), we specifically recruited HIV-negative study participants who identified as MSM (n = 8, 50% of NCs). Beta diversity clustering by principal coordinate analysis (PCoA) revealed similar compositions between PWH and NCs (Fig. 7D). Notably, microbiota from MSM participants clustered together and were distinct from the microbiota from non-MSM participants regardless of HIV infection status and microbiome distribution of HIV-infected non-MSM participants, spanned across all other participant groups (Fig. 7E). Consistent with previous reports (61–63), a higher relative abundance of Prevotella and lower relative abundance of Bacteroides was noted in MSM participants, regardless of their HIV status (Fig. 7F).
When examined across all three groups, the major bacterial phyla were represented by Firmicutes, Bacteroidetes, and Actinobacteria, with marginal differences in their relative abundance across the three groups (Fig. 7G). No major differences across the three groups were noted in the relative abundance of different bacteria genera (fig. S11B). Nonetheless, linear discriminant analysis effect size (LEfSe) revealed enrichment of Enterococci and Mitsuokella in PWH and enrichment of Roseburia and Alistipes in NCs (Fig. 7H and fig. S11C). In the validation cohort, Roseburia was found to be less IgA-coated in PWH compared with NCs as well (Fig. 7I).
Last, we explored the relationship between mucosal PC frequency and the intestinal microbiota at the genus level. Frequency of colonic PCs was directly related to several microbial genera (fig. S11D and table S48), including Roseburia (Fig. 7J), which was found to be enriched in the NCs in the LEfSe analysis and more IgA-coated in our validation cohort. Similarly, IgA+ PCs were directly associated with the relative abundance of Bilophila, Parabacteroides, Odoribacter, and Streptococcus (fig. S11D and table S49) and inversely associated with the relative abundance of Enterobacter and Mitsukella (Fig. 7J), both enriched in PWVH. Together, these results demonstrate reduced bacterial targeting by IgAs during viremic HIV infection and alterations in the relative abundance of specific bacteria, despite the lack of major changes in the overall microbiome composition in PWH.
DISCUSSION
NAb production is a highly coordinated process involving antigen-directed participation of TFH cells, GC B cells, and FDCs (64–67), and GC B cell frequency relates to the magnitude of NAb titers (68). A majority of the identified broadly neutralizing anti–HIV-1 antibodies are highly mutated (69), emphasizing a pivotal role of GC B cells in the NAb response. Trama et al. have demonstrated that the GALT-generated responses to HIV-1 are limited and predominantly comprise microbiome-directed B cells (70). In addition, Planchais et al. (71) have reported that intestinal B cell–derived antibodies are largely polyreactive, with low affinity to HIV-1 envelope glycoproteins. Our report highlights a fundamental injury to the high-affinity NAb-generating apparatus in the GI tract and provides mechanistic insights regarding an impaired GALT antibody response in HIV. We posit that the loss of intestinal GC response likely contributes to a failure of virologic control, resulting in the establishment of viral sanctuaries in the intestines. This represents an HIV-specific phenomenon, given that most infections and vaccinations induce a GC response (72–76).
HIV-1–associated GC dysfunction is likely multifactorial, including Nef-mediated perturbations of B cell function (77); disruption of cognate interactions at T cell–B cell immune synapses (78); and Vpr- and Vpu-mediated reduced B cell class switching (79) and antigen presentation, respectively (80). Chronic antigen persistence within GCs is associated with IL-6–enriched, cytokine-driven expansion of TFH cells (81). Yet, as shown by our data and from prior reports (47, 48, 82), TFH cells remain functionally altered in PWH and likely provide poor support to the GC reaction. In addition, GC infiltration by CD8+ T cells and NK cells (83) and loss or fibrosis of the stromal network of the GALT likely contribute to altered GC dynamics in HIV-1 (84). Herein, we also identify a reduction of GALT FDCs, reminiscent of degenerative changes in the FDC network in peripheral lymph nodes in patients with advanced HIV-1 disease (85, 86). Direct infection of FDCs by HIV-1 remains unproven (87), whereas targeted killing by cytotoxic CD8+ T cells and NK cells, given high HIV-1 loads within FDCs, is a favored hypothesis (88).
IgA is the predominant antibody to emerge from intestinal GCs (89, 90), making it the most abundant immunoglobulin in the intestines (91, 92). Inflammatory stimuli, in particular TH1 cytokines such as IFN-γ, redirect immunoglobulin class switching toward IgG (93). Here, we describe an increase in intestinal IgG and IgM response during viremic HIV infection that is somewhat in contrast with the response induced by most intestinal parasitic, bacterial, and viral pathogens given that IgA remains the mainstay of protection against Giardia (94), Salmonella (95), Enterococcus (75), Vibrio cholerae (76), as well as rotavirus infection (96) and vaccination (97, 98). Further, we observe that suppression of plasma HIV VL results in “normalization” of intestinal IgA responses, consistent with a prior report by Zaunders et al. (99) but in contrast with Planchais et al.’s findings (100). Notably, in the latter study, participants who had started treatment during acute HIV infection showed normalization of IgA+ B cells and PCs, suggesting that timing of initiating of ART may influence immune reconstitution (101).
In addition to altered PC frequency and isotypes, we have also identified altered transcriptional states of intestinal PCs, including upregulation of IFN responses; antigen presentation; and altered intracellular and cytokine signaling in PWVH. The transcriptome of intestinal PCs remains perturbed in PWSH even after 5 years of fully suppressive ART, with an increase in mRNA transcripts encoding for oxidative phosphorylation and mitochondrial metabolism. These data emphasize that mucosal dynamics remain perturbed even after years of apparently “well-controlled” HIV-1 infection.
In our data, consistent with previous reports (61–63), sexual practices appeared to be a driver of dysbiosis. In addition, we have observed that the microbiome in PWVH lacked bacterial genera and species known to be producers of butyrate (Lachnospiraceae and Ruminococcaceae), a short-chain fatty acid important for mucosal integrity and health (102–104), while enriched for Mitsoukella (30), a bacterium associated with increased concentration of proinflammatory metabolites (105–107). Furthermore, we observed Mitsoukella to be inversely associated with colonic PC frequency. Conversely, other butyrate-producing bacteria of the Odoribacter genus were positively associated with the frequency of the homeostatic IgA+ PCs and inversely with the frequency of potentially proinflammatory IgG+ PCs, suggesting a contribution by Odoribacter to mucosal homeostasis in patients with HIV-1 infection, as in other inflammatory diseases (108–110). Roseburia, a genus that is positively associated with general health (111, 112), was depleted in individuals with HIV-1 viremia in our cohort, consistent with prior reports (33, 34, 113, 114), and was directly related to the frequency of colonic PCs. In validation of our findings, samples from the CEPHIA cohort (115) demonstrated significantly lower IgA binding of Roseburia in PWH as compared with NCs. In addition, we observed a trend toward lower IgA-bound bacteria in PWVH and a higher abundance of IgA-bound Actinomyces and Eubacterium. IgA-bound Eubacteria were inversely correlated with the abundance of IgG+ PCs, highlighting the homeostatic properties of this genus (58–60). These data in aggregate demonstrate a bidirectional relationship between mucosal PCs and homeostatic microbiota in health that is disrupted in PWH.
Last, we examined the associations between mucosal PCs and measures of systemic inflammation during HIV-1 infection. Consistent with prior reports (51), we confirmed heightened systemic inflammation and its persistence despite effective ART. The frequency of mucosal IgA+ PCs was inversely associated with most proinflammatory parameters analyzed. The opposite was true for IgG+ and IgM+ PCs, demonstrating an association between the mucosal humoral compartment and control of systemic inflammation in HIV-1 infection during ART.
As potential caveats and limitations, it is important to highlight the heterogeneity of the human GALT and PC frequencies across its length and across age (116–118), which could potentially affect the interpretation of our findings. The frequency of IgM+ PCs is lower in the present study when compared with a previous report by Magri et al. (119), which could be related to a combination of factors that include differences in biological specimens, processing protocols, variable distribution of IgM+ PCs across the GI tract, and interindividual variability. Lastly, functional studies will be necessary to prove a causal effect of the perturbed GC dynamics and the observed alterations in PC frequency and isotype composition.
In summary, the present report details previously underappreciated disruptions in intestinal B cell and PC compartments during HIV-1 infection. Significant reduction in intestinal GC B cells during viremic infection may underlie the key changes in PC frequency. Further, alterations in the frequency, isotype expression, and transcriptional profile of PCs and their association with the local and systemic inflammatory environment emphasize potential contributions of the intestinal humoral response to chronic morbidity associated with HIV even during effective ART.
MATERIALS AND METHODS
Study design and ethical considerations
This is a prospective observational study with the objective of studying the changes in the humoral immune responses in the GALT in PWH. Participants were recruited from the Icahn School of Medicine at Mount Sinai. Informed consent was obtained from all study participants. The study protocol was approved by the Mount Sinai institutional review board (HS no. 16–00512/GCO no. 16–0583). We enrolled PWVH who were ART naive or within 10 days of starting antiretroviral treatment or who self-discontinued ART and had HIV RNA > 1000 copies/ml at the time of enrollment. We also enrolled PWSH who had well-suppressed HIV-1 RNA (<20 copies/ml) for >3 months while receiving ART. Isolated viral “blips” (one-time HIV RNA > 20 copies/ml but <1000 copies/ml) were allowed. In addition, we enrolled HIV-negative controls (table S1). We excluded participants who were pregnant or had a concomitant intestinal infection. All data points obtained were used for analysis.
Ileocolonoscopy, biopsy processing, and lamina propria isolation
Mucosal biopsies were obtained using standard large cup biopsy forceps (n = 30, limiting the effect of variability in sampling), transported in Roswell Park Memorial Institute medium (RPMI, GIBCO catalog no. 11875085) on ice, and processed within 2 hours of collection. Similarly, PB samples were obtained at the time of ileocolonoscopic procedure and processed within 2 hours of collection to isolate peripheral blood mononuclear cells (PBMCs) via Ficoll-based separation as previously described (120). All samples (including the PB) were processed fresh (to avoid the effect of cryopreservation on PC viability).
Intestinal mononuclear cells were obtained as previously described (120). Briefly, two 20-min rounds of dissociation to remove the epithelial layer [dissociation medium: 10 ml of Hanks’ balanced salt solution (free of calcium and magnesium), EDTA (0.5 M, pH 8, Invitrogen), and Hepes (1 M, Lonza)] were followed by a 40-min round of digestion at 37°C using gentle agitation (180 rpm) [digestion solution (10 ml per sample) containing RPMI, fetal bovine serum (FBS) (Corning 35–010-CV), 0.005 g of type IV collagenase (Sigma-Aldrich, catalog no. C5138–1G), and DNase I (Sigma-Aldrich Fine Chemicals Biosciences catalog no. 10104159001)]. The digested tissue was mechanically disrupted by syringe aspiration and sequential filtering through a 100-μm and a 40-μm cell strainer and washed with RPMI twice. All experiments were performed once per study participant.
Multiparameter FC
Intestinal lamina propria cells and PBMCs were stained with cell type–specific antibody panels (table S15). The cell suspension was fixed using either 2% formaldehyde (for extracellular markers staining only) or fixation/permeabilization buffer (Invitrogen no. 00–5523-00) for intracellular staining. Samples were acquired using an LSR Fortessa (BD). Each intestinal lamina propria cell suspension was acquired in its entirety, and a minimum of 500,000 PBMCs were acquired [median (IQR) of PBMCs acquired: 927,000 (513,000 to 1,070,000) for the entire cohort] given the low frequencies of PCs in circulation during health. The gating strategies for annotating B cell subsets, PC subsets, and activated T cell subsets are shown in fig. S2. Data were analyzed using FlowJo v10 (Tree Star). Dead cells and doublets were excluded from all analyses. Statistical analysis was performed using Prism GraphPad software by Dotmatics. Comparison across groups was done with one-way analysis of variance (ANOVA) for nonparametric variables (Kruskal-Wallis tests) with Dunn’s correction for multiple comparisons. Median and IQR were used to plot summary data.
Immunofluorescent microscopy
Immunofluorescence microscopy staining was performed on biopsies from NCs (n = 7), PWSH (n = 7), and PWVH (n = 10). Formalin-fixed, paraffin-embedded intestinal biopsy tissue was cut in 5-μm sections. Tissue was dewaxed in xylene and rehydrated in graded alcohol and phosphate-buffered saline (PBS). Heat-induced epitope retrieval (HIER) was performed on sections submerged in target retrieval solution (Dako, S1699) in a pressure cooker. Non-specific binding was blocked with 10% goat serum for 1 hour at room temperature. Tissue was then incubated in primary antibodies (table S15) diluted in 10% goat serum overnight at 4°C. Slides were then washed and incubated in secondary antibody (table S16) and 4′,6-diamidino-2-phenylindole (1 μg/ml) for 1 hour at room temperature. Sections were mounted with Fluoromount-G (Electron microscopy sciences, no. 1798425). Controls included no primary controls and isotype controls. Sections were imaged using a Nikon Eclipse Ni microscope and digital SLR camera (Nikon, DS-Qi2).
Image analysis was done in ImageJ/Fiji. IgA+ PCs (IgA+CD138+) and IgA− PCs (CD138+IgA−) were quantified per area of lamina propria (median area = 0.62 mm2, range = 0.21 to 1.48 mm2). CD138+ cells were only counted in the lamina propria. Statistical analysis was performed using Prism GraphPad software by Dotmatics. The frequencies of cells per unit area were compared using one-way ANOVA for nonparametric variables (Kruskal-Wallis test) with Dunn’s correction for multiple comparisons. Median and IQR were used to plot summary data.
IHC staining
Of 154 participant samples, 152 were available for analysis. All samples were reviewed by a clinical GI pathologist, and in 15 samples, a lymphoid follicle with a GC was identified. This included 4 of 18 (22%) PWVH, 5 of 49 (10%) PWSH, and 6 of 87 (6.9%) NCs. All of the samples where a lymphoid follicle with GC was detected were used for the analysis. Slides were baked at 70°C for 60 min and then loaded onto an automated stainer (Leica Bond III) for CD4 staining and Dako Omnis (Dako /Agilent) for BCL6 staining. HIER was achieved with Epitope Retrieval Solution 2 for 30 min at 100°C (CD4 staining) Envision Flex TRS High Solution for 30 min at 97°C (BCL6 staining). Ready to Use Antibody reagent was added as marker and incubated for 15 min (CD4: Leica Biosystems, clone 4B12; BCL6: Dako/Agilent, Clone PG-B6p). Detection was achieved using a Leica DAB Detection Kit (Bond Polymer Refine Detection) for CD4 and Envision FLEX DAB+ (Diaminobenzidine) (Dako Omnis) for BCL6. Slides were dehydrated and mounted. Positive and internal negative controls were used. Lymphoid aggregates and GCs were demarcated by a pathologist on hematoxylin and eosin (H&E)–stained sections, and BCL6+ cells were counted manually within the GCs on IHC slides. CD23 staining within the GC was measured via the thresholder function in QuPath. After color deconvolution, a threshold of 0.25 was set for positive staining. The area of positive staining was calculated as % of GC area. Statistical analysis was performed using Prism GraphPad software by Dotmatics. Comparison across groups was performed by Kruskal-Wallis test with Dunn’s correction for multiple comparisons. Median and IQR were used to plot summary data.
Lamina propria cell sorting and mRNA extraction
Twelve study participants (PWVH, n = 3; PWSH, n = 5; NCs, n = 4, table S29) had colonic samples analyzed via bulk RNA-seq of flow-sorted PCs. Lamina propria single-cell suspensions were obtained as described above, stained with a dedicated Ab cocktail for B cell and PC lineage (live CD45+CD38hiCD27+CD19+ cells), and sorted using the BD FACS Aria II system. Sorted cells were then pelleted, and RNA was isolated using the RNeasy Plus Micro Extraction Kit (Qiagen # 74034) as per the manufacturer’s instructions. RNA libraries were prepared using either SMART-Seq v4 Ultra Low Input Nextera XT or SureSelect XT RNA Direct v6 (table S29).
Bulk RNA-seq analysis of flow-sorted PCs
The mean (±SD) depth of sequencing was 76.2 ± 12.5 million, for a total of 990.6 million reads for the bulk RNA-seq dataset. Preprocessing was done as previously reported (121). Features with fewer than four normalized counts across all samples were filtered out. The counts were normalized using voom (122). Normalized log counts per million and associated precision weights were then entered into the limma analysis pipeline (123–125). RNA-seq data were adjusted for RIN score using a linear model (124–126). Expression profiles were modeled using linear mixed-effects models including age and group variable (NCs, PWSH, and PWVH) as fixed effects and a random intercept for each individual. GSEA was performed using the clusterProfiler R package to identify the enriched terms (adjusted P < 0.05) in KEGG, Reactome, and Bioplanet for the comparison of the three groups. GSEA resulted in numerous enrichments indicating dysregulation of a large number of pathways: 659 for suppressed versus control, 320 for PWVH versus NCs, and 640 for PWVH versus PWSH (table S30). To summarize and consolidate GSEA results, pathways with adjusted P values <0.05 were selected from each database into the Sumer R package (46), which was used to select the most representative pathways. This process reduced the number of pathway terms organized to various clusters as follows: for PWVH versus NCs, five clusters of 87 pathways; for PWSH versus NCs, eight clusters of 143 pathways; and for PWVH versus PWSH, four clusters of 67 pathways (tables S31 to S36). The top five pathways (by adjusted P value) per cluster were subselected for further analysis. Gene set variance analysis (GSVA) (z score method) was performed on the HIV gene expression data (RIN adjusted) to generate a pathway score with the core enriched genes for each pathway selected by the Sumer package. A bubble plot of net expression score (NES) of selected pathway scores across groups was constructed. The expression (RIN adjusted) levels of selected leading edge genes (LEGs) across each sample of each group are displayed in a summary heatmap. The color of the heatmap in each row is based on the i score values calculated by centering and scaling the data by SD using the formula (X ~ m)/SD, where X is an individual value and m is the mean of the row.
Lamina propria processing for scRNA-seq
Samples from 18 study participants (PWVH, n = 4; PWSH, n = 5; NCs, n = 9; table S2) underwent scRNA-seq analysis. LP mononuclear cell suspensions were obtained from freshly processed intestinal biopsies as detailed above, and dead cells were removed using dead cell removal by magnetic binding (Miltenyi Biotec no. 130–090-101) as per the manufacturer’s instructions. Cells were loaded in one lane of the 10X Genomics NextGem 3’v3.1 assay as per the manufacturer’s protocol with a targeted cell recovery of 8000 cells. Gene expression libraries were prepared as per the 10X Genomics protocol (127). Libraries were quantified via an Agilent 2100 hsDNA bioanalyzer and a KAPA library quantification kit (Roche catalog no. 0796014001) and sequenced at a targeted depth of 25,000 reads per cell. Libraries were pooled in equimolar concentration and sequenced on the Illumina NovaSeq 100 cycle kit with run parameters set to 28×8×0×60.
Single-cell RNA data processing and analysis
Filtering, normalization, and batch correction
Only cells with total UMI counts greater than 1000 and mitochondria gene fraction less than 10% were considered for the analysis. The analysis of scRNA-seq data, including data normalization and batch effect correction, was performed via the Seurat package (41, 128). First, each cell was normalized independently using the function NormalizeData, which divides feature counts for each cell by the total counts for that cell. Data were then natural log–transformed. Next, variable features were found using the function FindVariableFeatures (41, 128). This function first fits a line to the relationship of log(variance) and log(mean) using local polynomial regression, then standardizes the feature values using the observed mean and expected variance (given by the fitted line). Feature variance was then calculated on the basis of the standardized values. Last, features that were repeatedly variable across datasets were selected for integration via the function SelectIntegrationFeatures (41, 128). Anchors were then identified using the FindIntegrationAnchors function, which takes a list of Seurat objects as input and uses these anchors to integrate different datasets together via the IntegrateData function (41, 128). Dimensionality reduction was performed using reciprocal principal components analysis. For visualization, the dimensionality of each dataset was further reduced using Uniform Manifold Approximation and Projection (UMAP) implemented with Seurat functions RunUMAP. The PCs used to calculate the embedding were the same as those used for clustering.
Clustering
Clustering was performed via the function Find.Cluster in Seurat, with resolution parameter r = 0.5. We identified cluster-specific markers using the function FindMarkers in Seurat (41, 128). Markers were ranked on the basis of the area under the receiver operating characteristic curve. On the basis of the cluster-specific markers and leveraging existing signatures from the literature (129–134), clusters were annotated into nine cell types for the ileum and the colon. Because clustering of scRNA-seq data cells may be potentially influenced by the use of BCR and TCR gene segments, we verified the similarity of the subclustering structure when removing segments of BCR and TCR genes that undergo V(D)J recombination [specifically IG(HKL)V, IG(KL)J and IG(KL)C, and TR(ABDG)(VJC)]. We chose to retain the IGH(ADEGM) genes because they are relevant in determining cell identity and function (i.e., naïve and memory B cells). With this approach, 84 to 97% of individual cell pairs retained the same coclassification status [quantified by the Rand index (RI)] (135), corresponding to the adjusted Rand index (ARI) of 0.61 to 0.89 (ARI ranges between −1 and 1, with 0 being the expected value for unrelated classifications). We thus elected to retain BCR and TCR gene segments in our subclustering of B cells, PCs, and T cells.
Cell-type signatures
We considered the lineage cell-type categories to obtain gene signatures from the scRNA-seq data. Mitochondrial and ribosomal protein genes were removed in the final list of genes because they were found expressed in multiple cell types (41).
Reclustering of B cells, PCs, and T cells
B cells, PCs, and T cells were reclustered as smaller individual subsets using the same nearest neighborhood clustering algorithm (41). The resolution parameters used in reclustering were 0.5 for PCs and T cells and 0.4 for B cells. After identifying markers for each of the subclusters, we could assign them to specific subtypes of each cell type: naïve B cells; memory B cells; GC B cells; and IgA, IgM, and IgG isotypes for PCs.
Quantification of cell-type fractions
Cell types from primary clusters were quantified as a fraction of total cells in each sample. Cell types from subclusters were quantified as a fraction of the corresponding primary cell type in each sample unless otherwise specified. Comparisons across groups were performed using Mann-Whitney U test.
Pathway enrichment analysis
For each cell-type compartment (i.e., B cells and PCs), the log fold change was computed between the average gene expression in cells derived from PWVH, PWSH, and NCs. Enrichment scores and adjusted P values (FDR) were derived via gene set enrichment analysis (136) for PWVH versus NCs and PWSH versus NCs separately. Specifically, genes were ordered in decreasing order of fold change, and a Kolmogorov-Smirnov statistic was used to find pathways enriched at the top of the list. A permutation-based strategy was used to derive P values and FDR for different pathways (136). Molecular pathway gene sets used in this analysis were from the Reactome database (137). The transcriptome of PCs is enriched in Ig genes (138, 139), and accordingly, in our dataset, Ig-encoding genes comprised 58% ± 13% of all UMIs in PCs in colon and 57% ± 17% in ileum, with a mean (SD) UMI number per PC of 15,195 ± 11,807 in the colon and 17,264 ± 12,189 in the ileum.
Stool metagenomics
Stool metagenomics was performed on all participants for whom stools were available (7 PWVH, 18 PWSH, and 16 NCs; table S2). Stool samples were collected from study participants before or at least 2 weeks after colonoscopy. Fresh samples were frozen at −80°C and mechanically pulverized. Fecal DNA for metagenomic sequencing was extracted as previously described (140). DNA was quantified using the Broad Range or High Sensitivity Quant-IT dsDNA Assay kit (Thermo Fisher Scientific, Q32853 and Q33130) with a BioTek Synergy HTX Multi-Mode Reader. Using the NEBNext Ultra II DNA Library Prep Kit, metagenomic libraries were prepared. DNA that was fragmented by a Diagenode Bioruptor Pico sonicator was subjected to end repair, Illumina adaptor ligation, and purification with Beckman Coulter SPRI beads. NEBNext Ultra Q5 Master Mix was used to amplify ligated product using custom i5 and i7 index primers, and Beckman Coulter AMPure XP beads quantified the final product. Samples were sequenced with an Illumina HiSeq (paired-end 150 bp).
Computational analysis of metagenomic profiles
MetaPhlAn2 was used for whole-metagenome shotgun sequencing (141). Any sample with fewer than 100,000 reads was filtered out. Uncharacterized phylae and taxa that did not meet the minimum prevalence threshold of 3% of all samples were also filtered out. LEfSe was implemented to estimate bacterial candidates associated with study participant groups with a logarithmic LDA cutoff ≥2.0 (142), using the R package microbial. Beta diversity (using Bray-Curtis distances) was calculated and visualized with a PCoA plot. Distance and diversity index calculations were performed using phyloseq (143). Spearman correlation was performed on bacterial genus relative abundances and immune cell abundances. Given the exploratory nature of this study, reported P values are unadjusted.
IgA-bound and unbound stool bacteria sorting
Fifty milligrams of frozen stool samples was resuspended in PBS (10× stool weight) and pelleted. The supernatant was filtered through a 40-nm cell strainer. One hundred microliters of suspension was blocked for nonspecific staining using anti-mouse serum, stained for IgA (PE Miltenyi Biotec, catalog no. 130–113-476), washed thrice, and stained for DNA (SYBRGreen Applied Biosciences). IgA-bound (SYBRGreen+, IgA+) and IgA-unbound (SYBRGreen+, IgA−) stool bacteria were sorted and pelleted, and DNA was extracted using the QIAamp UCP Pathogen Mini Kit (Qiagen catalog no. 50214). Staining was directed toward total IgAs and not specifically toward SIgAs, potentially capturing infiltration from monomeric serum IgAs in the stools. Comparison across groups was done with one-way ANOVA for nonparametric variables (Kruskal-Wallis tests) with Dunn’s correction for multiple comparisons. Median and IQR were used to plot summary data.
16S rRNA sequencing and IgA-seq
For DNA extraction, we used a phenol:chloroform method on 50 to 200 mg of fecal specimen as previously described (144). We adjusted DNA templates to a concentration of 2 ng/ml. After this, the V4 variable region of the 16S rRNA gene underwent PCR amplification using indexed primers, adopting the methodology outlined in (145). The resultant 16S rRNA V4 amplicons were merged and subsequently purified using AMPure XP beads (Beckman Coulter, A63880) at a bead-to-PCR ratio of 1:1. Gel electrophoresis was used to confirm the accurate amplicon size and to ensure the nonpresence of primer dimers. The consolidated samples were then sequenced on an Illumina MiSeq platform, producing paired-end reads of 250 bp each. To process and denoise paired-end sequence data, the DADA2 algorithm available within the QIIME2 pipeline was used. The Greengenes sequences database was used as a reference for paired-end reads merge and alignment.
We removed samples with fewer than 1000 reads. Ambiguously annotated phylum-level taxonomic features (e.g. “NA”) and low-prevalence ASVs were removed. In addition, ASVs with a relative abundance less than 0.01% in both the IgA-bound and unbound dataset were filtered out. A pseudocount of minimum (relative abundance of genus)/2 was computed to entries with exact 0 relative abundance entries in ASV tables. Log Palm score was calculated (57) to quantify IgA binding. Spearman correlation was calculated on immune cell abundances and log Palm score of bacterial genus.
A validation cohort (CEPHIA of the University of California, San Francisco) was also included to confirm the IgA-seq results. Samples were processed as previously described (115). To obtain genus-level IgA scores for all taxa, the DADA2 pipeline was applied, and taxonomy was assigned on resulting amplicon sequence variants (ASVs) using the SILVA database (v138.1, nr99). ASVs belonging to the same genus were summed, and a pseudocount of 1 was applied. The IgA score was computed as a natural log of the ratio of each genus in the IgA-positive fraction over the IgA-negative fraction.
Multiplexed proteomic assay (Olink)
Circulating inflammatory cytokines were quantified in all the study participants for whom plasma was available (total = 86; PWVH, n = 13; PWSH, n = 39; NCs, n = 34; table S46) using a multiplexed proteomic inflammation panel (Olink) that simultaneously quantifies 92 inflammation-related proteins. The concentration of each biomarker was compared between PWVH and NCs as well as between PWSH and NCs using Student’s t test. The Benjamini-Hochberg procedure for multiple comparisons was used to adjust the resulting P value. Correlation with LP cell-type frequencies and circulating inflammation-related proteins was obtained by Spearman’s rho correlation coefficient.
Supplementary Material
Acknowledgments:
We acknowledge the support of the Human Immune Monitoring Core, the Flow Cytometry Core, and the computational and data resources and staff expertise provided by Scientific Computing at the Icahn School of Medicine at Mount Sinai. We thank CEPHIA.
Funding:
This work was supported by R01 DK123749 (S.M., J.J.F., and A.C.) and R01 DK112296 (S.M.) and by 1KL2TR004421–01 (F.C.) and by DP1HL174182 (I.V.-C.). CEPHIA is supported by the Bill and Melinda Gates Foundation (OPP1017716, OPP1062806, and OPP1115799); the NIH (P01 AI071713, R01 HD074511, P30 AI027763, R24 AI067039, U01 AI043638, P01 AI074621, and R24 AI106039); the HIV Prevention Trials Network (HPTN) sponsored by the NIAID, National Institutes of Child Health and Human Development (NICH/HD), National Institute on Drug Abuse, National Institute of Mental Health, and Office of AIDS Research of the NIH, DHHS (UM1 AI068613 and R01 AI095068); the California HIV-1 Research Program (RN07-SD-702); the Brazilian Program for STD and AIDS, Ministry of Health (914/BRA/3014-UNESCO); and the São Paulo City Health Department (2004–0.168.922–7).
Footnotes
Competing interests: The authors declare that they have no competing interests.
Data and materials availability:
Sequencing data for bulk RNA-seq and scRNA-seq have been deposited to the GEO database (GSE272807). All source data needed to evaluate the conclusions in the paper are present in the paper or the Supplementary Materials. Materials used to conduct this study will be made available upon request.
REFERENCES AND NOTES
- 1.Corti D, Lanzavecchia A, Broadly neutralizing antiviral antibodies. Annu. Rev. Immunol. 31, 705–742 (2013). [DOI] [PubMed] [Google Scholar]
- 2.Guadalupe M, Reay E, Sankaran S, Prindiville T, Flamm J, McNeil A, Dandekar S, Severe CD4+ T-cell depletion in gut lymphoid tissue during primary human immunodeficiency virus type 1 infection and substantial delay in restoration following highly active antiretroviral therapy. J. Virol. 77, 11708–11717 (2003). [DOI] [PMC free article] [PubMed] [Google Scholar]
- 3.Li Q, Duan L, Estes JD, Ma ZM, Rourke T, Wang Y, Reilly C, Carlis J, Miller CJ, Haase AT, Peak SIV replication in resting memory CD4+ T cells depletes gut lamina propria CD4+ T cells. Nature 434, 1148–1152 (2005). [DOI] [PubMed] [Google Scholar]
- 4.Veazey RS, DeMaria M, Chalifoux LV, Shvetz DE, Pauley DR, Knight HL, Rosenzweig M, Johnson RP, Desrosiers RC, Lackner AA, Gastrointestinal tract as a major site of CD4+ T cell depletion and viral replication in SIV infection. Science 280, 427–431 (1998). [DOI] [PubMed] [Google Scholar]
- 5.Brenchley JM, Hill BJ, Ambrozak DR, Price DA, Guenaga FJ, Casazza JP, Kuruppu J, Yazdani J, Migueles SA, Connors M, Roederer M, Douek DC, Koup RA, T-cell subsets that harbor human immunodeficiency virus (HIV) in vivo: Implications for HIV pathogenesis. J. Virol. 78, 1160–1168 (2004). [DOI] [PMC free article] [PubMed] [Google Scholar]
- 6.Mattapallil JJ, Douek DC, Hill B, Nishimura Y, Martin M, Roederer M, Massive infection and loss of memory CD4+ T cells in multiple tissues during acute SIV infection. Nature 434, 1093–1097 (2005). [DOI] [PubMed] [Google Scholar]
- 7.Mehandru S, Poles MA, Tenner-Racz K, Horowitz A, Hurley A, Hogan C, Boden D, Racz P, Markowitz M, Primary HIV-1 infection is associated with preferential depletion of CD4+ T lymphocytes from effector sites in the gastrointestinal tract. J. Exp. Med. 200, 761–770 (2004). [DOI] [PMC free article] [PubMed] [Google Scholar]
- 8.Mehandru S, Poles MA, Tenner-Racz K, Jean-Pierre P, Manuelli V, Lopez P, Shet A, Low A, Mohri H, Boden D, Racz P, Markowitz M, Lack of mucosal immune reconstitution during prolonged treatment of acute and early HIV-1 infection. PLOS Med. 3, e484 (2006). [DOI] [PMC free article] [PubMed] [Google Scholar]
- 9.Chaillon A, Gianella S, Dellicour S, Rawlings SA, Schlub TE, De Oliveira MF, Ignacio C, Porrachia M, Vrancken B, Smith DM, HIV persists throughout deep tissues with repopulation from multiple anatomical sources. J. Clin. Invest. 130, 1699–1712 (2020). [DOI] [PMC free article] [PubMed] [Google Scholar]
- 10.Estes JD, Kityo C, Ssali F, Swainson L, Makamdop KN, Del Prete GQ, Deeks SG, Luciw PA, Chipman JG, Beilman GJ, Hoskuldsson T, Khoruts A, Anderson J, Deleage C, Jasurda J, Schmidt TE, Hafertepe M, Callisto SP, Pearson H, Reimann T, Schuster J, Schoephoerster J, Southern P, Perkey K, Shang L, Wietgrefe SW, Fletcher CV, Lifson JD, Douek DC, McCune JM, Haase AT, Schacker TW, Defining total-body AIDS-virus burden with implications for curative strategies. Nat. Med. 23, 1271–1276 (2017). [DOI] [PMC free article] [PubMed] [Google Scholar]
- 11.Yukl SA, Gianella S, Sinclair E, Epling L, Li Q, Duan L, Choi ALM, Girling V, Ho T, Li P, Fujimoto K, Lampiris H, Hare CB, Pandori M, Haase AT, Günthard HF, Fischer M, Shergill AK, McQuaid K, Havlir DV, Wong JK, Differences in HIV burden and immune activation within the gut of HIV-positive patients receiving suppressive antiretroviral therapy. J. Infect. Dis. 202, 1553–1561 (2010). [DOI] [PMC free article] [PubMed] [Google Scholar]
- 12.Brenchley JM, Price DA, Schacker TW, Asher TE, Silvestri G, Rao S, Kazzaz Z, Bornstein E, Lambotte O, Altmann D, Blazar BR, Rodriguez B, Teixeira-Johnson L, Landay A, Martin JN, Hecht FM, Picker LJ, Lederman MM, Deeks SG, Douek DC, Microbial translocation is a cause of systemic immune activation in chronic HIV infection. Nat. Med. 12, 1365–1371 (2006). [DOI] [PubMed] [Google Scholar]
- 13.Steele AK, Lee EJ, Vestal B, Hecht D, Dong Z, Rapaport E, Koeppe J, Campbell TB, Wilson CC, Contribution of intestinal barrier damage, microbial translocation and HIV-1 infection status to an inflammaging signature. PLOS ONE 9, e97171 (2014). [DOI] [PMC free article] [PubMed] [Google Scholar]
- 14.Zevin AS, McKinnon L, Burgener A, Klatt NR, Microbial translocation and microbiome dysbiosis in HIV-associated immune activation. Curr. Opin. HIV AIDS 11, 182–190 (2016). [DOI] [PMC free article] [PubMed] [Google Scholar]
- 15.Ancona G, Merlini E, Tincati C, Barassi A, Calcagno A, Augello M, Bono V, Bai F, Cannizzo ES, d'Arminio Monforte A, Marchetti G, Long-term suppressive cART is not sufficient to restore intestinal permeability and gut microbiota compositional changes. Front. Immunol. 12, 639291 (2021). [DOI] [PMC free article] [PubMed] [Google Scholar]
- 16.Estes JD, Harris LD, Klatt NR, Tabb B, Pittaluga S, Paiardini M, Barclay GR, Smedley J, Pung R, Oliveira KM, Hirsch VM, Silvestri G, Douek DC, Miller CJ, Haase AT, Lifson J, Brenchley JM, Damaged intestinal epithelial integrity linked to microbial translocation in pathogenic simian immunodeficiency virus infections. PLOS Pathog. 6, e1001052 (2010). [DOI] [PMC free article] [PubMed] [Google Scholar]
- 17.Somsouk M, Estes JD, Deleage C, Dunham RM, Albright R, Inadomi JM, Martin JN, Deeks SG, McCune JM, Hunt PW, Gut epithelial barrier and systemic inflammation during chronic HIV infection. AIDS 29, 43–51 (2015). [DOI] [PMC free article] [PubMed] [Google Scholar]
- 18.Macpherson AJ, McCoy KD, Johansen FE, Brandtzaeg P, The immune geography of IgA induction and function. Mucosal Immunol. 1, 11–22 (2008). [DOI] [PubMed] [Google Scholar]
- 19.McGuckin MA, Linden SK, Sutton P, Florin TH, Mucin dynamics and enteric pathogens. Nat. Rev. Microbiol. 9, 265–278 (2011). [DOI] [PubMed] [Google Scholar]
- 20.Corthésy B, Multi-faceted functions of secretory IgA at mucosal surfaces. Front. Immunol. 4, 185 (2013). [DOI] [PMC free article] [PubMed] [Google Scholar]
- 21.Pietrzak B, Tomela K, Olejnik-Schmidt A, Mackiewicz A, Schmidt M, Secretory IgA in intestinal mucosal secretions as an adaptive barrier against microbial cells. Int. J. Mol. Sci. 21, 9254 (2020). [DOI] [PMC free article] [PubMed] [Google Scholar]
- 22.Kabbert J, Benckert J, Rollenske T, Hitch TCA, Clavel T, Cerovic V, Wardemann H, Pabst O, High microbiota reactivity of adult human intestinal IgA requires somatic mutations. J. Exp. Med. 217, e20200275 (2020). [DOI] [PMC free article] [PubMed] [Google Scholar]
- 23.Elgueta R, Benson MJ, de Vries VC, Wasiuk A, Guo Y, Noelle RJ, Molecular mechanism and function of CD40/CD40L engagement in the immune system. Immunol. Rev. 229, 152–172 (2009). [DOI] [PMC free article] [PubMed] [Google Scholar]
- 24.Reboldi A, Arnon TI, Rodda LB, Atakilit A, Sheppard D, Cyster JG, IgA production requires B cell interaction with subepithelial dendritic cells in Peyer's patches. Science 352, aaf4822 (2016). [DOI] [PMC free article] [PubMed] [Google Scholar]
- 25.Victora GD, Nussenzweig MC, Germinal centers. Annu. Rev. Immunol. 40, 413–442 (2022). [DOI] [PubMed] [Google Scholar]
- 26.Pereira JP, Kelly LM, Cyster JG, Finding the right niche: B-cell migration in the early phases of T-dependent antibody responses. Int. Immunol. 22, 413–419 (2010). [DOI] [PMC free article] [PubMed] [Google Scholar]
- 27.Schwickert TA, Victora GD, Fooksman DR, Kamphorst AO, Mugnier MR, Gitlin AD, Dustin ML, Nussenzweig MC, A dynamic T cell-limited checkpoint regulates affinity-dependent B cell entry into the germinal center. J. Exp. Med. 208, 1243–1252 (2011). [DOI] [PMC free article] [PubMed] [Google Scholar]
- 28.Cyster JG, Allen CDC, B cell responses: Cell interaction dynamics and decisions. Cell 177, 524–540 (2019). [DOI] [PMC free article] [PubMed] [Google Scholar]
- 29.Dillon SM, Lee EJ, Kotter CV, Austin GL, Dong Z, Hecht DK, Gianella S, Siewe B, Smith DM, Landay AL, Robertson CE, Frank DN, Wilson CC, An altered intestinal mucosal microbiome in HIV-1 infection is associated with mucosal and systemic immune activation and endotoxemia. Mucosal Immunol. 7, 983–994 (2014). [DOI] [PMC free article] [PubMed] [Google Scholar]
- 30.Lozupone CA, Li M, Campbell TB, Flores SC, Linderman D, Gebert MJ, Knight R, Fontenot AP, Palmer BE, Alterations in the gut microbiota associated with HIV-1 infection. Cell Host Microbe 14, 329–339 (2013). [DOI] [PMC free article] [PubMed] [Google Scholar]
- 31.Vujkovic-Cvijin I, Dunham RM, Iwai S, Maher MC, Albright RG, Broadhurst MJ, Hernandez RD, Lederman MM, Huang Y, Somsouk M, Deeks SG, Hunt PW, Lynch SV, McCune JM, Dysbiosis of the gut microbiota is associated with HIV disease progression and tryptophan catabolism. Sci. Transl. Med. 5, 193ra191 (2013). [DOI] [PMC free article] [PubMed] [Google Scholar]
- 32.Dinh DM, Volpe GE, Duffalo C, Bhalchandra S, Tai AK, Kane AV, Wanke CA, Ward HD, Intestinal microbiota, microbial translocation, and systemic inflammation in chronic HIV infection. J. Infect. Dis. 211, 19–27 (2015). [DOI] [PMC free article] [PubMed] [Google Scholar]
- 33.Vazquez-Castellanos JF, Serrano-Villar S, Latorre A, Artacho A, Ferrus ML, Madrid N, Vallejo A, Sainz T, Martinez-Botas J, Ferrando-Martinez S, Vera M, Dronda F, Leal M, Del Romero J, Moreno S, Estrada V, Gosalbes MJ, Moya A, Altered metabolism of gut microbiota contributes to chronic immune activation in HIV-infected individuals. Mucosal Immunol. 8, 760–772 (2015). [DOI] [PubMed] [Google Scholar]
- 34.Mutlu EA, Keshavarzian A, Losurdo J, Swanson G, Siewe B, Forsyth C, French A, Demarais P, Sun Y, Koenig L, Cox S, Engen P, Chakradeo P, Abbasi R, Gorenz A, Burns C, Landay A, A compositional look at the human gastrointestinal microbiome and immune activation parameters in HIV infected subjects. PLOS Pathog. 10, e1003829 (2014). [DOI] [PMC free article] [PubMed] [Google Scholar]
- 35.Monaco CL, Gootenberg DB, Zhao G, Handley SA, Ghebremichael MS, Lim ES, Lankowski A, Baldridge MT, Wilen CB, Flagg M, Norman JM, Keller BC, Luevano JM, Wang D, Boum Y, Martin JN, Hunt PW, Bangsberg DR, Siedner MJ, Kwon DS, Virgin HW, Altered virome and bacterial microbiome in human immunodeficiency virus-associated acquired immunodeficiency syndrome. Cell Host Microbe 19, 311–322 (2016). [DOI] [PMC free article] [PubMed] [Google Scholar]
- 36.Lu W, Feng Y, Jing F, Han Y, Lyu N, Liu F, Li J, Song X, Xie J, Qiu Z, Zhu T, Routy B, Routy JP, Li T, Zhu B, Association between gut microbiota and CD4 recovery in HIV-1 infected patients. Front. Microbiol. 9, 1451 (2018). [DOI] [PMC free article] [PubMed] [Google Scholar]
- 37.Brenchley JM, Paiardini M, Knox KS, Asher AI, Cervasi B, Asher TE, Scheinberg P, Price DA, Hage CA, Kholi LM, Khoruts A, Frank I, Else J, Schacker T, Silvestri G, Douek DC, Differential Th17 CD4 T-cell depletion in pathogenic and nonpathogenic lentiviral infections. Blood 112, 2826–2835 (2008). [DOI] [PMC free article] [PubMed] [Google Scholar]
- 38.Cecchinato V, Trindade CJ, Laurence A, Heraud JM, Brenchley JM, Ferrari MG, Zaffiri L, Tryniszewska E, Tsai WP, Vaccari M, Parks RW, Venzon D, Douek DC, O'Shea JJ, Franchini G, Altered balance between Th17 and Th1 cells at mucosal sites predicts AIDS progression in simian immunodeficiency virus-infected macaques. Mucosal Immunol. 1, 279–288 (2008). [DOI] [PMC free article] [PubMed] [Google Scholar]
- 39.Tugizov SM, Herrera R, Chin-Hong P, Veluppillai P, Greenspan D, Michael Berry J, Pilcher CD, Shiboski CH, Jay N, Rubin M, Chein A, Palefsky JM, HIV-associated disruption of mucosal epithelium facilitates paracellular penetration by human papillomavirus. Virology 446, 378–388 (2013). [DOI] [PMC free article] [PubMed] [Google Scholar]
- 40.Brandtzaeg P, Kiyono H, Pabst R, Russell MW, Terminology: Nomenclature of mucosa-associated lymphoid tissue. Mucosal Immunol. 1, 31–37 (2008). [DOI] [PubMed] [Google Scholar]
- 41.Stuart T, Butler A, Hoffman P, Hafemeister C, Papalexi E, Mauck III WM, Hao Y, Stoeckius M, Smibert P, Satija R, Comprehensive integration of single-cell data. Cell 177, 1888–1902.e21 (2019). [DOI] [PMC free article] [PubMed] [Google Scholar]
- 42.Heesters BA, van Megesen K, Tomris I, de Vries RP, Magri G, Spits H, Characterization of human FDCs reveals regulation of T cells and antigen presentation to B cells. J. Exp. Med. 218, e20210790 (2021). [DOI] [PMC free article] [PubMed] [Google Scholar]
- 43.Landsverk OJB, Snir O, Casado RB, Richter L, Mold JE, Réu P, Horneland R, Paulsen V, Yaqub S, Aandahl EM, Øyen OM, Thorarensen HS, Salehpour M, Possnert G, Frisén J, Sollid LM, Baekkevold ES, Jahnsen FL, Antibody-secreting plasma cells persist for decades in human intestine. J. Exp. Med. 214, 309–317 (2017). [DOI] [PMC free article] [PubMed] [Google Scholar]
- 44.Buckner CM, Moir S, Ho J, Wang W, Posada JG, Kardava L, Funk EK, Nelson AK, Li Y, Chun TW, Fauci AS, Characterization of plasmablasts in the blood of HIV-infected viremic individuals: Evidence for nonspecific immune activation. J. Virol. 87, 5800–5811 (2013). [DOI] [PMC free article] [PubMed] [Google Scholar]
- 45.Mei HE, Yoshida T, Sime W, Hiepe F, Thiele K, Manz RA, Radbruch A, Dorner T, Blood-borne human plasma cells in steady state are derived from mucosal immune responses. Blood 113, 2461–2469 (2009). [DOI] [PubMed] [Google Scholar]
- 46.S. R. Savage, Z. Shi, Y. Liao, B. Zhang, Graph algorithms for condensing and consolidating gene set analysis results. Mol. Cell. Proteomics 18, S141–S152 (2019). [DOI] [PMC free article] [PubMed] [Google Scholar]
- 47.Perreau M, Savoye AL, De Crignis E, Corpataux JM, Cubas R, Haddad EK, De Leval L, Graziosi C, Pantaleo G, Follicular helper T cells serve as the major CD4 T cell compartment for HIV-1 infection, replication, and production. J. Exp. Med. 210, 143–156 (2013). [DOI] [PMC free article] [PubMed] [Google Scholar]
- 48.Moysi E, Pallikkuth S, De Armas LR, Gonzalez LE, Ambrozak D, George V, Huddleston D, Pahwa R, Koup RA, Petrovas C, Pahwa S, Altered immune cell follicular dynamics in HIV infection following influenza vaccination. J. Clin. Invest. 128, 3171–3185 (2018). [DOI] [PMC free article] [PubMed] [Google Scholar]
- 49.Liu Z, Cumberland WG, Hultin LE, Kaplan AH, Detels R, Giorgi JV, CD8+ T-lymphocyte activation in HIV-1 disease reflects an aspect of pathogenesis distinct from viral burden and immunodeficiency. J. Acquir. Immune Defic. Syndr. Hum. Retrovirol. 18, 332–340 (1998). [DOI] [PubMed] [Google Scholar]
- 50.Giorgi JV, Hultin LE, McKeating JA, Johnson TD, Owens B, Jacobson LP, Shih R, Lewis J, Wiley DJ, Phair JP, Wolinsky SM, Detels R, Shorter survival in advanced human immunodeficiency virus type 1 infection is more closely associated with T lymphocyte activation than with plasma virus burden or virus chemokine coreceptor usage. J. Infect. Dis. 179, 859–870 (1999). [DOI] [PubMed] [Google Scholar]
- 51.Sereti I, Altfeld M, Immune activation and HIV: An enduring relationship. Curr. Opin. HIV AIDS 11, 129–130 (2016). [DOI] [PMC free article] [PubMed] [Google Scholar]
- 52.van der Waaij LA, Limburg PC, Mesander G, van der Waaij D, In vivo IgA coating of anaerobic bacteria in human faeces. Gut 38, 348–354 (1996). [DOI] [PMC free article] [PubMed] [Google Scholar]
- 53.Suzuki K, Meek B, Doi Y, Muramatsu M, Chiba T, Honjo T, Fagarasan S, Aberrant expansion of segmented filamentous bacteria in IgA-deficient gut. Proc. Natl. Acad. Sci. U.S.A. 101, 1981–1986 (2004). [DOI] [PMC free article] [PubMed] [Google Scholar]
- 54.Gutzeit C, Magri G, Cerutti A, Intestinal IgA production and its role in host-microbe interaction. Immunol. Rev. 260, 76–85 (2014). [DOI] [PMC free article] [PubMed] [Google Scholar]
- 55.Nakajima A, Vogelzang A, Maruya M, Miyajima M, Murata M, Son A, Kuwahara T, Tsuruyama T, Yamada S, Matsuura M, Nakase H, Peterson DA, Fagarasan S, Suzuki K, IgA regulates the composition and metabolic function of gut microbiota by promoting symbiosis between bacteria. J. Exp. Med. 215, 2019–2034 (2018). [DOI] [PMC free article] [PubMed] [Google Scholar]
- 56.Pabst O, Slack E, IgA and the intestinal microbiota: The importance of being specific. Mucosal Immunol. 13, 12–21 (2020). [DOI] [PMC free article] [PubMed] [Google Scholar]
- 57.Palm NW, de Zoete MR, Cullen TW, Barry NA, Stefanowski J, Hao L, Degnan PH, Hu J, Peter I, Zhang W, Ruggiero E, Cho JH, Goodman AL, Flavell RA, Immunoglobulin A coating identifies colitogenic bacteria in inflammatory bowel disease. Cell 158, 1000–1010 (2014). [DOI] [PMC free article] [PubMed] [Google Scholar]
- 58.Duncan SH, Belenguer A, Holtrop G, Johnstone AM, Flint HJ, Lobley GE, Reduced dietary intake of carbohydrates by obese subjects results in decreased concentrations of butyrate and butyrate-producing bacteria in feces. Appl. Environ. Microbiol. 73, 1073–1078 (2007). [DOI] [PMC free article] [PubMed] [Google Scholar]
- 59.Ghosh TS, Rampelli S, Jeffery IB, Santoro A, Neto M, Capri M, Giampieri E, Jennings A, Candela M, Turroni S, Zoetendal EG, Hermes GDA, Elodie C, Meunier N, Brugere CM, Pujos-Guillot E, Berendsen AM, De Groot LCPGM, Feskins EJM, Kaluza J, Pietruszka B, Bielak MJ, Comte B, Maijo-Ferre M, Nicoletti C, De Vos WM, Fairweather-Tait S, Cassidy A, Brigidi P, Franceschi C, O'Toole PW, Mediterranean diet intervention alters the gut microbiome in older people reducing frailty and improving health status: The NU-AGE 1-year dietary intervention across five European countries. Gut 69, 1218–1228 (2020). [DOI] [PMC free article] [PubMed] [Google Scholar]
- 60.Jakobsdottir G, Xu J, Molin G, Ahrne S, Nyman M, High-fat diet reduces the formation of butyrate, but increases succinate, inflammation, liver fat and cholesterol in rats, while dietary fibre counteracts these effects. PLOS ONE 8, e80476 (2013). [DOI] [PMC free article] [PubMed] [Google Scholar]
- 61.Noguera-Julian M, Rocafort M, Guillén Y, Rivera J, Casadella M, Nowak P, Hildebrand F, Zeller G, Parera M, Bellido R, Rodríguez C, Carrillo J, Mothe B, Coll J, Bravo I, Estany C, Herrero C, Saz J, Sirera G, Torrelai A, Navarroi J, Crespoi M, Brandera C, Negredo E, Blanco J, Guarnerk F, Calle ML, Borke P, Sönnerborgd A, Clotet B, Paredes R, Gut microbiota linked to sexual preference and HIV infection. EBioMedicine 5, 135–146 (2016). [DOI] [PMC free article] [PubMed] [Google Scholar]
- 62.Kelley CF, Kraft CS, de Man TJ, Duphare C, Lee HW, Yang J, Easley KA, Tharp GK, Mulligan MJ, Sullivan PS, Bosinger SE, Amara RR, The rectal mucosa and condomless receptive anal intercourse in HIV-negative MSM: Implications for HIV transmission and prevention. Mucosal Immunol. 10, 996–1007 (2017). [DOI] [PMC free article] [PubMed] [Google Scholar]
- 63.Armstrong AJS, Shaffer M, Nusbacher NM, Griesmer C, Fiorillo S, Schneider JM, Preston Neff C, Li SX, Fontenot AP, Campbell T, Palmer BE, Lozupone CA, An exploration of Prevotella-rich microbiomes in HIV and men who have sex with men. Microbiome 6, 198 (2018). [DOI] [PMC free article] [PubMed] [Google Scholar]
- 64.Gitlin AD, Shulman Z, Nussenzweig MC, Clonal selection in the germinal centre by regulated proliferation and hypermutation. Nature 509, 637–640 (2014). [DOI] [PMC free article] [PubMed] [Google Scholar]
- 65.Gitlin AD, von Boehmer L, Gazumyan A, Shulman Z, Oliveira TY, Nussenzweig MC, Independent roles of switching and hypermutation in the development and persistence of B lymphocyte memory. Immunity 44, 769–781 (2016). [DOI] [PMC free article] [PubMed] [Google Scholar]
- 66.Tas JMJ, Mesin L, Pasqual G, Targ S, Jacobsen JT, Mano YM, Chen CS, Weill J-C, Reynaud C-A, Browne EP, Meyer-Hermann M, Victora GD, Visualizing antibody affinity maturation in germinal centers. Science 351, 1048–1054 (2016). [DOI] [PMC free article] [PubMed] [Google Scholar]
- 67.Ersching J, Efeyan A, Mesin L, Jacobsen JT, Pasqual G, Grabiner BC, Dominguez-Sola D, Sabatini DM, Victora GD, Germinal center selection and affinity maturation require dynamic regulation of mTORC1 kinase. Immunity 46, 1045–1058.e6 (2017). [DOI] [PMC free article] [PubMed] [Google Scholar]
- 68.Pauthner M, Havenar-Daughton C, Sok D, Nkolola JP, Bastidas R, Boopathy AV, Carnathan DG, Chandrashekar A, Cirelli KM, Cottrell CA, Eroshkin AM, Guenaga J, Kaushik K, Kulp DW, Liu J, McCoy LE, Oom AL, Ozorowski G, Post KW, Sharma SK, Steichen JM, de Taeye SW, Tokatlian T, de la Peña AT, Butera ST, La Branche CC, Montefiori DC, Silvestri G, Wilson IA, Irvine DJ, Sanders RW, Schief WR, Ward AB, Wyatt RT, Barouch DH, Crotty S, Burton DR, Elicitation of robust tier 2 neutralizing antibody responses in nonhuman primates by HIV envelope trimer immunization using optimized approaches. Immunity 46, 1073–1088.e6 (2017). [DOI] [PMC free article] [PubMed] [Google Scholar]
- 69.Haynes BF, Wiehe K, Borrow P, Saunders KO, Korber B, Wagh K, McMichael AJ, Kelsoe G, Hahn BH, Alt F, Shaw GM, Strategies for HIV-1 vaccines that induce broadly neutralizing antibodies. Nat. Rev. Immunol. 23, 142–158 (2023). [DOI] [PMC free article] [PubMed] [Google Scholar]
- 70.Trama AM, Moody MA, Alam SM, Jaeger FH, Lockwood B, Parks R, Lloyd KE, Stolarchuk C, Scearce R, Foulger A, Marshall DJ, Whitesides JF, Jeffries TL Jr., Wiehe K, Morris L, Lambson B, Soderberg K, Hwang K-K, Tomaras GD, Vandergrift N, Jackson KJL, Roskin KM, Boyd SD, Kepler TB, Liao H-X, Haynes BF, HIV-1 envelope gp41 antibodies can originate from terminal ileum B cells that share cross-reactivity with commensal bacteria. Cell Host Microbe 16, 215–226 (2014). [DOI] [PMC free article] [PubMed] [Google Scholar]
- 71.Planchais C, Kok A, Kanyavuz A, Lorin V, Bruel T, Guivel-Benhassine F, Rollenske T, Prigent J, Hieu T, Prazuck T, Lefrou L, Wardemann H, Schwartz O, Dimitrov JD, Hocqueloux L, Mouquet H, HIV-1 envelope recognition by polyreactive and cross-reactive intestinal B cells. Cell Rep. 27, 572–585.e7 (2019). [DOI] [PMC free article] [PubMed] [Google Scholar]
- 72.Clare S, John V, Walker AW, Hill JL, Abreu-Goodger C, Hale C, Goulding D, Lawley TD, Mastroeni P, Frankel G, Enright AJ, Vigorito E, Dougan G, Enhanced susceptibility to Citrobacter rodentium infection in microRNA-155-deficient mice. Infect. Immun. 81, 723–732 (2013). [DOI] [PMC free article] [PubMed] [Google Scholar]
- 73.Yewdell WT, Smolkin RM, Belcheva KT, Mendoza A, Michaels AJ, Cols M, Angeletti D, Yewdell JW, Chaudhuri J, Temporal dynamics of persistent germinal centers and memory B cell differentiation following respiratory virus infection. Cell Rep. 37, 109961 (2021). [DOI] [PMC free article] [PubMed] [Google Scholar]
- 74.Hagglof T, Cipolla M, Loewe M, Chen ST, Kara EE, Mesin L, Hartweger H, ElTanbouly MA, Cho A, Gazumyan A, Ramos V, Stamatatos L, Oliveira TY, Nussenzweig MC, Viant C, Continuous germinal center invasion contributes to the diversity of the immune response. Cell 186, 147–161.e15 (2023). [DOI] [PMC free article] [PubMed] [Google Scholar]
- 75.Hendrickx AP, Top J, Bayjanov JR, Kemperman H, Rogers MR, Paganelli FL, Bonten MJ, Willems RJ, Antibiotic-driven dysbiosis mediates intraluminal agglutination and alternative segregation of Enterococcus faecium from the intestinal epithelium. MBio 6, e01346–15 (2015). [DOI] [PMC free article] [PubMed] [Google Scholar]
- 76.Levinson KJ, De Jesus M, Mantis NJ, Rapid effects of a protective O-polysaccharide-specific monoclonal IgA on Vibrio cholerae agglutination, motility, and surface morphology. Infect. Immun. 83, 1674–1683 (2015). [DOI] [PMC free article] [PubMed] [Google Scholar]
- 77.Xu W, Santini PA, Sullivan JS, He B, Shan M, Ball SC, Dyer WB, Ketas TJ, Chadburn A, Cohen-Gould L, Knowles DM, Chiu A, Sanders RW, Chen K, Cerutti A, HIV-1 evades virus-specific IgG2 and IgA responses by targeting systemic and intestinal B cells via long-range intercellular conduits. Nat. Immunol. 10, 1008–1017 (2009). [DOI] [PMC free article] [PubMed] [Google Scholar]
- 78.Kaw S, Ananth S, Tsopoulidis N, Morath K, Coban BM, Hohenberger R, Bulut OC, Klein F, Stolp B, Fackler OT, HIV-1 infection of CD4 T cells impairs antigen-specific B cell function. EMBO J. 39, e105594 (2020). [DOI] [PMC free article] [PubMed] [Google Scholar]
- 79.Eldin P, Peron S, Galashevskaya A, Denis-Lagache N, Cogne M, Slupphaug G, Briant L, Impact of HIV-1 Vpr manipulation of the DNA repair enzyme UNG2 on B lymphocyte class switch recombination. J. Transl. Med. 18, 310 (2020). [DOI] [PMC free article] [PubMed] [Google Scholar]
- 80.Manganaro L, de Castro E, Maestre AM, Olivieri K, Garcia-Sastre A, Fernandez-Sesma A, Simon V, HIV Vpu interferes with NF-κB activity but not with interferon regulatory factor 3. J. Virol. 89, 9781–9790 (2015). [DOI] [PMC free article] [PubMed] [Google Scholar]
- 81.Lindqvist M, van Lunzen J, Soghoian DZ, Kuhl BD, Ranasinghe S, Kranias G, Flanders MD, Cutler S, Yudanin N, Muller MI, Davis I, Farber D, Hartjen P, Haag F, Alter G, zur Wiesch JS, Streeck H, Expansion of HIV-specific T follicular helper cells in chronic HIV infection. J. Clin. Invest. 122, 3271–3280 (2012). [DOI] [PMC free article] [PubMed] [Google Scholar]
- 82.Cubas RA, Mudd JC, Savoye AL, Perreau M, van Grevenynghe J, Metcalf T, Connick E, Meditz A, Freeman GJ, Abesada-Terk G Jr., Jacobson JM, Brooks AD, Crotty S, Estes JD, Pantaleo G, Lederman MM, Haddad EK, Inadequate T follicular cell help impairs B cell immunity during HIV infection. Nat. Med. 19, 494–499 (2013). [DOI] [PMC free article] [PubMed] [Google Scholar]
- 83.Levesque MC, Moody MA, Hwang KK, Marshall DJ, Whitesides JF, Amos JD, Gurley TC, Allgood S, Haynes BB, Vandergrift NA, Plonk S, Parker DC, Cohen MS, Tomaras GD, Goepfert PA, Shaw GM, Schmitz JE, Eron JJ, Shaheen NJ, Hicks CB, Liao H-X, Markowitz M, Kelsoe G, Margolis DM, Haynes BF, Polyclonal B cell differentiation and loss of gastrointestinal tract germinal centers in the earliest stages of HIV-1 infection. PLOS Med. 6, e1000107 (2009). [DOI] [PMC free article] [PubMed] [Google Scholar]
- 84.Estes JD, Pathobiology of HIV/SIV-associated changes in secondary lymphoid tissues. Immunol. Rev. 254, 65–77 (2013). [DOI] [PMC free article] [PubMed] [Google Scholar]
- 85.Piris MA, Rivas C, Morente M, Rubio C, Martin C, Olivia H, Persistent and generalized lymphadenopathy: A lesion of follicular dendritic cells? An immunohistologic and ultrastructural study. Am. J. Clin. Pathol. 87, 716–724 (1987). [DOI] [PubMed] [Google Scholar]
- 86.Tenner-Racz K, Human immunodeficiency virus associated changes in germinal centers of lymph nodes and relevance to impaired B-cell function. Lymphology 21, 36–43 (1988). [PubMed] [Google Scholar]
- 87.Schmitz J, van Lunzen J, Tenner-Racz K, Grossschupff G, Racz P, Schmitz H, Dietrich M, Hufert FT, Follicular dendritic cells retain HIV-1 particles on their plasma membrane, but are not productively infected in asymptomatic patients with follicular hyperplasia. J. Immunol. 153, 1352–1359 (1994). [PubMed] [Google Scholar]
- 88.Devergne O, Peuchmaur M, Crevon MC, Trapani JA, Maillot MC, Galanaud P, Emilie D, Activation of cytotoxic cells in hyperplastic lymph nodes from HIV-infected patients. AIDS 5, 1071–1080 (1991). [DOI] [PubMed] [Google Scholar]
- 89.Craig SW, Cebra JJ, Peyer's patches: An enriched source of precursors for IgA-producing immunocytes in the rabbit. J. Exp. Med. 134, 188–200 (1971). [DOI] [PMC free article] [PubMed] [Google Scholar]
- 90.Brandtzaeg P, Presence of J chain in human immunocytes containing various immunoglobulin classes. Nature 252, 418–420 (1974). [DOI] [PubMed] [Google Scholar]
- 91.Cerutti A, Chen K, Chorny A, Immunoglobulin responses at the mucosal interface. Annu. Rev. Immunol. 29, 273–293 (2011). [DOI] [PMC free article] [PubMed] [Google Scholar]
- 92.Lycke NY, Bemark M, The regulation of gut mucosal IgA B-cell responses: Recent developments. Mucosal Immunol. 10, 1361–1374 (2017). [DOI] [PubMed] [Google Scholar]
- 93.Snapper CM, Paul WE, Interferon-gamma and B cell stimulatory factor-1 reciprocally regulate Ig isotype production. Science 236, 944–947 (1987). [DOI] [PubMed] [Google Scholar]
- 94.Langford TD, Housley MP, Boes M, Chen J, Kagnoff MF, Gillin FD, Eckmann L, Central importance of immunoglobulin A in host defense against Giardia spp. Infect. Immun. 70, 11–18 (2002). [DOI] [PMC free article] [PubMed] [Google Scholar]
- 95.Endt K, Stecher B, Chaffron S, Slack E, Tchitchek N, Benecke A, Van Maele L, Sirard JC, Mueller AJ, Heikenwalder M, Macpherson AJ, Strugnell R, von Mering C, Hardt WD, The microbiota mediates pathogen clearance from the gut lumen after non-typhoidal Salmonella diarrhea. PLOS Pathog. 6, e1001097 (2010). [DOI] [PMC free article] [PubMed] [Google Scholar]
- 96.Matson DO, O'Ryan ML, Herrera I, Pickering LK, Estes MK, Fecal antibody responses to symptomatic and asymptomatic rotavirus infections. J. Infect. Dis. 167, 577–583 (1993). [DOI] [PubMed] [Google Scholar]
- 97.Feng N, Burns JW, Bracy L, Greenberg HB, Comparison of mucosal and systemic humoral immune responses and subsequent protection in mice orally inoculated with a homologous or a heterologous rotavirus. J. Virol. 68, 7766–7773 (1994). [DOI] [PMC free article] [PubMed] [Google Scholar]
- 98.Blutt SE, Conner ME, The gastrointestinal frontier: IgA and viruses. Front. Immunol. 4, 402 (2013). [DOI] [PMC free article] [PubMed] [Google Scholar]
- 99.Zaunders J, Danta M, Bailey M, Mak G, Marks K, Seddiki N, Xu Y, Templeton DJ, Cooper DA, Boyd MA, Kelleher AD, Koelsch KK, CD4+ T follicular helper and IgA+ B cell numbers in gut biopsies from HIV-infected subjects on antiretroviral therapy are similar to HIV-uninfected individuals. Front. Immunol. 7, 438 (2016). [DOI] [PMC free article] [PubMed] [Google Scholar]
- 100.Planchais C, Hocqueloux L, Ibanez C, Gallien S, Copie C, Surenaud M, Kok A, Lorin V, Fusaro M, Delfau-Larue MH, Lefrou L, Prazuck T, Levy M, Seddiki N, Lelievre JD, Mouquet H, Levy Y, Hue S, Early antiretroviral therapy preserves functional follicular helper T and HIV-specific B cells in the gut mucosa of HIV-1-infected individuals. J. Immunol. 200, 3519–3529 (2018). [DOI] [PubMed] [Google Scholar]
- 101.Kok A, Hocqueloux L, Hocini H, Carriere M, Lefrou L, Guguin A, Tisserand P, Bonnabau H, Avettand-Fenoel V, Prazuck T, Katsahian S, Gaulard P, Thiebaut R, Levy Y, Hue S, Early initiation of combined antiretroviral therapy preserves immune function in the gut of HIV-infected patients. Mucosal Immunol. 8, 127–140 (2015). [DOI] [PubMed] [Google Scholar]
- 102.Morrison DJ, Preston T, Formation of short chain fatty acids by the gut microbiota and their impact on human metabolism. Gut Microbes 7, 189–200 (2016). [DOI] [PMC free article] [PubMed] [Google Scholar]
- 103.Singh V, Lee G, Son H, Koh H, Kim ES, Unno T, Shin JH, Butyrate producers, “The Sentinel of Gut”: Their intestinal significance with and beyond butyrate, and prospective use as microbial therapeutics. Front. Microbiol. 13, 1103836 (2022). [DOI] [PMC free article] [PubMed] [Google Scholar]
- 104.Fagundes RR, Belt SC, Bakker BM, Dijkstra G, Harmsen HJM, Faber KN, Beyond butyrate: Microbial fiber metabolism supporting colonic epithelial homeostasis. Trends Microbiol. 32, 178–189 (2024). [DOI] [PubMed] [Google Scholar]
- 105.Seldin MM, Meng Y, Qi H, Zhu W, Wang Z, Hazen SL, Lusis AJ, Shih DM, Trimethylamine N-oxide promotes vascular inflammation through signaling of mitogen-activated protein kinase and nuclear factor-κB. J. Am. Heart Assoc. 5, e002767 (2016). [DOI] [PMC free article] [PubMed] [Google Scholar]
- 106.Fu BC, Hullar MAJ, Randolph TW, Franke AA, Monroe KR, Cheng I, Wilkens LR, Shepherd JA, Madeleine MM, Le Marchand L, Lim U, Lampe JW, Associations of plasma trimethylamine N-oxide, choline, carnitine, and betaine with inflammatory and cardiometabolic risk biomarkers and the fecal microbiome in the Multiethnic Cohort Adiposity Phenotype Study. Am. J. Clin. Nutr. 111, 1226–1234 (2020). [DOI] [PMC free article] [PubMed] [Google Scholar]
- 107.Liu X, Shao Y, Tu J, Sun J, Li L, Tao J, Chen J, Trimethylamine-N-oxide-stimulated hepatocyte-derived exosomes promote inflammation and endothelial dysfunction through nuclear factor-kappa B signaling. Ann. Transl. Med. 9, 1670 (2021). [DOI] [PMC free article] [PubMed] [Google Scholar]
- 108.Lima SF, Gogokhia L, Viladomiu M, Chou L, Putzel G, Jin WB, Pires S, Guo CJ, Gerardin Y, Crawford CV, Jacob V, Scherl E, Brown SE, Hambor J, Longman RS, Transferable immunoglobulin A-coated Odoribacter splanchnicus in responders to fecal microbiota transplantation for ulcerative colitis limits colonic inflammation. Gastroenterology 162, 166–178 (2022). [DOI] [PMC free article] [PubMed] [Google Scholar]
- 109.Osawa M, Handa O, Fukushima S, Matsumoto H, Umegaki E, Inoue R, Naito Y, Shiotani A, Reduced abundance of butyric acid-producing bacteria in the ileal mucosa-associated microbiota of ulcerative colitis patients. J. Clin. Biochem. Nutr. 73, 77–83 (2023). [DOI] [PMC free article] [PubMed] [Google Scholar]
- 110.Wang T, Sternes PR, Guo XK, Zhao H, Xu C, Xu H, Autoimmune diseases exhibit shared alterations in the gut microbiota. Rheumatology 63, 856–865 (2023). [DOI] [PMC free article] [PubMed] [Google Scholar]
- 111.Asnicar F, Berry SE, Valdes AM, Nguyen LH, Piccinno G, Drew DA, Leeming E, Gibson R, Le Roy C, Khatib HA, Francis L, Mazidi M, Mompeo O, Valles-Colomer M, Tett A, Beghini F, Dubois L, Bazzani D, Thomas AM, Mirzayi C, Khleborodova A, Oh S, Hine R, Bonnett C, Capdevila J, Danzanvilliers S, Giordano F, Geistlinger L, Waldron L, Davies R, Hadjigeorgiou G, Wolf J, Ordovás JM, Gardner C, Franks PW, Chan AT, Huttenhower C, Spector TD, Segata N, Microbiome connections with host metabolism and habitual diet from 1,098 deeply phenotyped individuals. Nat. Med. 27, 321–332 (2021). [DOI] [PMC free article] [PubMed] [Google Scholar]
- 112.Gacesa R, Kurilshikov A, Vila AV, Sinha T, Klaassen MAY, Bolte LA, Andreu-Sanchez S, Chen L, Collij V, Hu S, Dekens JAM, Lenters VC, Bjork JR, Swarte JC, Swertz MA, Jansen BH, Gelderloos-Arends J, Jankipersadsing S, Hofker M, Vermeulen RCH, Sanna S, Harmsen HJM, Wijmenga C, Fu J, Zhernakova A, Weersma RK, Environmental factors shaping the gut microbiome in a Dutch population. Nature 604, 732–739 (2022). [DOI] [PubMed] [Google Scholar]
- 113.McHardy IH, Li X, Tong M, Ruegger P, Jacobs J, Borneman J, Anton P, Braun J, HIV Infection is associated with compositional and functional shifts in the rectal mucosal microbiota. Microbiome 1, 26 (2013). [DOI] [PMC free article] [PubMed] [Google Scholar]
- 114.Vujkovic-Cvijin I, Sortino O, Verheij E, Sklar J, Wit FW, Kootstra NA, Sellers B, Brenchley JM, Ananworanich J, van der Loeff MS, Belkaid Y, Reiss P, Sereti I, HIV-associated gut dysbiosis is independent of sexual practice and correlates with noncommunicable diseases. Nat. Commun. 11, 2448 (2020). [DOI] [PMC free article] [PubMed] [Google Scholar]
- 115.Vujkovic-Cvijin I, Welles HC, Ha CWY, Huq L, Mistry S, Brenchley JM, Trinchieri G, Devkota S, Belkaid Y, The systemic anti-microbiota IgG repertoire can identify gut bacteria that translocate across gut barrier surfaces. Sci. Transl. Med. 14, eabl3927 (2022). [DOI] [PMC free article] [PubMed] [Google Scholar]
- 116.Senda T, Dogra P, Granot T, Furuhashi K, Snyder ME, Carpenter DJ, Szabo PA, Thapa P, Miron M, Farber DL, Microanatomical dissection of human intestinal T-cell immunity reveals site-specific changes in gut-associated lymphoid tissues over life. Mucosal Immunol. 12, 378–389 (2019). [DOI] [PMC free article] [PubMed] [Google Scholar]
- 117.Spencer J, Siu JHY, Montorsi L, Human intestinal lymphoid tissue in time and space. Mucosal Immunol. 12, 296–298 (2019). [DOI] [PubMed] [Google Scholar]
- 118.Fenton TM, Jørgensen PB, Niss K, Rubin SJS, Mörbe UM, Riis LB, Da Silva C, Plumb A, Vandamme J, Jakobsen HL, Brunak S, Habtezion A, Nielsen OH, Johansson-Lindbom B, Agace WW, Immune profiling of human gut-associated lymphoid tissue identifies a role for isolated lymphoid follicles in priming of region-specific immunity. Immunity 52, 557–570.e6 (2020). [DOI] [PMC free article] [PubMed] [Google Scholar]
- 119.Magri G, Comerma L, Pybus M, Sintes J, Llige D, Segura-Garzon D, Bascones S, Yeste A, Grasset EK, Gutzeit C, Uzzan M, Ramanujam M, van Zelm MC, Albero-Gonzalez R, Vazquez I, Iglesias M, Serrano S, Marquez L, Mercade E, Mehandru S, Cerutti A, Human secretory IgM emerges from plasma cells clonally related to gut memory B cells and targets highly diverse commensals. Immunity 47, 118–134.e8 (2017). [DOI] [PMC free article] [PubMed] [Google Scholar]
- 120.Uzzan M, Tokuyama M, Rosenstein AK, Tomescu C, SahBandar IN, Ko HM, Leyre L, Chokola A, Kaplan-Lewis E, Rodriguez G, Seki A, Corley MJ, Aberg J, La Porte A, Park E-Y, Ueno H, Oikonomou I, Doron I, Iliev ID, Chen BK, Lui J, Schacker TW, Furtado GC, Lira SA, Colombel J-F, Horowitz A, Lim JK, Chomont N, Rahman AH, Montaner LJ, Ndhlovu LC, Mehandru S, Anti-α4β7 therapy targets lymphoid aggregates in the gastrointestinal tract of HIV-1-infected individuals. Sci. Transl. Med. 10, eaau4711 (2018). [DOI] [PMC free article] [PubMed] [Google Scholar]
- 121.Canales-Herrerias P, Uzzan M, Seki A, Czepielewski RS, Verstockt B, Livanos A, Raso F, Dunn A, Dai D, Wang A, Al-Taie Z, Martin J, Ko HM, Tokuyama M, Tankelevich M, Meringer H, Cossarini F, Jha D, Krek A, Paulsen JD, Nakadar MZ, Wong J, Erlich EC, Onufer EJ, Helmink BA, Sharma K, Rosenstein A, Chung G, Dawson T, Juarez J, Yajnik V, Cerutti A, Faith J, Suarez-Farinas M, Argmann C, Petralia F, Randolph GJ, Polydorides AD, Reboldi A, Colombel JF, Mehandru S, Gut-associated lymphoid tissue attrition associates with response to anti-alpha4beta7 therapy in ulcerative colitis. bioRxiv 524731 [Preprint] (2023). 10.1101/2023.01.19.524731. [DOI] [PMC free article] [PubMed] [Google Scholar]
- 122.Law CW, Chen Y, Shi W, Smyth GK, voom: Precision weights unlock linear model analysis tools for RNA-seq read counts. Genome Biol. 15, R29 (2014). [DOI] [PMC free article] [PubMed] [Google Scholar]
- 123.Law CW, Alhamdoosh M, Su S, Dong X, Tian L, Smyth GK, Ritchie ME, RNA-seq analysis is easy as 1–2-3 with limma, Glimma and edgeR. F1000Res. 5, 1408 (2016). [DOI] [PMC free article] [PubMed] [Google Scholar]
- 124.Ritchie ME, Phipson B, Wu D, Hu Y, Law CW, Shi W, Smyth GK, limma powers differential expression analyses for RNA-sequencing and microarray studies. Nucleic Acids Res. 43, e47 (2015). [DOI] [PMC free article] [PubMed] [Google Scholar]
- 125.Phipson B, Lee S, Majewski IJ, Alexander WS, Smyth GK, Robust hyperparameter estimation protects against hypervariable genes and improves power to detect differential expression. Ann. Appl. Stat. 10, 946–963 (2016). [DOI] [PMC free article] [PubMed] [Google Scholar]
- 126.Smyth GK, Linear models and empirical bayes methods for assessing differential expression in microarray experiments. Stat. Appl. Genet. Mol. Biol. 3, 1–25 (2004). [DOI] [PubMed] [Google Scholar]
- 127.10xgenomics; https://www.10xgenomics.com/support/single-cell-gene-expression/documentation/steps/library-prep/chromium-single-cell-3-reagent-kits-user-guide-v-3-1-chemistry-dual-index.
- 128.Hao Y, Hao S, Andersen-Nissen E, Mauck III WM, Zheng S, Butler A, Lee MJ, Wilk AJ, Darby C, Zager M, Hoffman P, Stoeckius M, Papalexi E, Mimitou EP, Jain J, Srivastava A, Stuart T, Fleming LM, Yeung B, Rogers AJ, McElrath JM, Blish CA, Gottardo R, Smibert P, Satija R, Integrated analysis of multimodal single-cell data. Cell 184, 3573–3587.E29 (2021). [DOI] [PMC free article] [PubMed] [Google Scholar]
- 129.Weinstein JS, Lezon-Geyda K, Maksimova Y, Craft S, Zhang Y, Su M, Schulz VP, Craft J, Gallagher PG, Global transcriptome analysis and enhancer landscape of human primary T follicular helper and T effector lymphocytes. Blood 124, 3719–3729 (2014). [DOI] [PMC free article] [PubMed] [Google Scholar]
- 130.Szabo PA, Levitin HM, Miron M, Snyder ME, Senda T, Yuan J, Cheng YL, Bush EC, Dogra P, Thapa P, Farber DL, Sims PA, Single-cell transcriptomics of human T cells reveals tissue and activation signatures in health and disease. Nat. Commun. 10, 4706 (2019). [DOI] [PMC free article] [PubMed] [Google Scholar]
- 131.Holmes AB, Corinaldesi C, Shen Q, Kumar R, Compagno N, Wang Z, Nitzan M, Grunstein E, Pasqualucci L, Dalla-Favera R, Basso K, Single-cell analysis of germinal-center B cells informs on lymphoma cell of origin and outcome. J. Exp. Med. 217, e20200483 (2020). [DOI] [PMC free article] [PubMed] [Google Scholar]
- 132.Kazer SW, Aicher TP, Muema DM, Carroll SL, Ordovas-Montanes J, Miao VN, Tu AA, Ziegler CGK, Nyquist SK, Wong EB, Ismail N, Dong M, Moodley A, Berger B, Love JC, Dong KL, Leslie A, Ndhlovu ZM, Ndung'u T, Walker BD, Shalek AK, Integrated single-cell analysis of multicellular immune dynamics during hyperacute HIV-1 infection. Nat. Med. 26, 511–518 (2020). [DOI] [PMC free article] [PubMed] [Google Scholar]
- 133.King HW, Orban N, Riches JC, Clear AJ, Warnes G, Teichmann SA, James LK, Single-cell analysis of human B cell maturation predicts how antibody class switching shapes selection dynamics. Sci. Immunol. 6, eabe6291 (2021). [DOI] [PubMed] [Google Scholar]
- 134.Uzzan M, Martin JC, Mesin L, Livanos AE, Castro-Dopico T, Huang R, Petralia F, Magri G, Kumar S, Zhao Q, Rosenstein AK, Tokuyama M, Sharma K, Ungaro R, Kosoy R, Jha D, Fischer J, Singh H, Keir ME, Ramamoorthi N, O’Gorman WE, Cohen BL, Rahman A, Cossarini F, Seki A, Leyre L, Vaquero ST, Gurunathan S, Grasset EK, Losic B, Dubinsky M, Greenstein AJ, Gottlieb Z, Legnani P, George J, Irizar H, Stojmirovic A, Brodmerkel C, Kasarkis A, Sands BE, Furtado G, Lira SA, Tuong ZK, Ko HM, Cerutti A, Elson CO, Clatworthy MR, Merad M, Suárez-Fariñas M, Argmann C, Hackney JA, Victora GD, Randolph GJ, Kenigsberg E, Colombel JF, Mehandru S, Ulcerative colitis is characterized by a plasmablast-skewed humoral response associated with disease activity. Nat. Med. 28, 766–779 (2022). [DOI] [PMC free article] [PubMed] [Google Scholar]
- 135.Santos J, Embrechts M, O n the use of the adjusted Rand index as a metric for evaluating supervised classification, in Artificial Neural Networks—ICANN 2009 19th International Conference, Limassol, Cyprus, September 14–17, 2009, Proceedings, Part II, Alippi C, Polycarpou M, Panayiotou C, Ellina G, Eds., vol. 5769 of Lecture Notes in Computer Science (Springer, 2009), pp. 175–184. [Google Scholar]
- 136.Subramanian A, Tamayo P, Mootha VK, Mukherjee S, Ebert BL, Gillette MA, Paulovich A, Pomeroy SL, Golub TR, Lander ES, Mesirov JP, Gene set enrichment analysis: A knowledge-based approach for interpreting genome-wide expression profiles. Proc. Natl. Acad. Sci. U.S.A. 102, 15545–15550 (2005). [DOI] [PMC free article] [PubMed] [Google Scholar]
- 137.Croft D, O'Kelly G, Wu G, Haw R, Gillespie M, Matthews L, Caudy M, Garapati P, Gopinath G, Jassal B, Jupe S, Kalatskaya I, Mahajan S, May B, Ndegwa N, Schmidt E, Shamovsky V, Yung C, Birney E, Hermjakob H, D’Eustachio P, Stein L, Reactome: A database of reactions, pathways and biological processes. Nucleic Acids Res. 39, D691–D697 (2011). [DOI] [PMC free article] [PubMed] [Google Scholar]
- 138.Shi W, Liao Y, Willis SN, Taubenheim N, Inouye M, Tarlinton DM, Smyth GK, Hodgkin PD, Nutt SL, Corcoran LM, Transcriptional profiling of mouse B cell terminal differentiation defines a signature for antibody-secreting plasma cells. Nat. Immunol. 16, 663–673 (2015). [DOI] [PubMed] [Google Scholar]
- 139.Snir O, Kanduri C, Lundin KEA, Sandve GK, Sollid LM, Transcriptional profiling of human intestinal plasma cells reveals effector functions beyond antibody production. United European Gastroenterol. J. 7, 1399–1407 (2019). [DOI] [PMC free article] [PubMed] [Google Scholar]
- 140.Reyes A, Wu M, McNulty NP, Rohwer FL, Gordon JI, Gnotobiotic mouse model of phage-bacterial host dynamics in the human gut. Proc. Natl. Acad. Sci. U.S.A. 110, 20236–20241 (2013). [DOI] [PMC free article] [PubMed] [Google Scholar]
- 141.Truong DT, Franzosa EA, Tickle TL, Scholz M, Weingart G, Pasolli E, Tett A, Huttenhower C, Segata N, MetaPhlAn2 for enhanced metagenomic taxonomic profiling. Nat. Methods 12, 902–903 (2015). [DOI] [PubMed] [Google Scholar]
- 142.Segata N, Izard J, Waldron L, Gevers D, Miropolsky L, Garrett WS, Huttenhower C, Metagenomic biomarker discovery and explanation. Genome Biol. 12, R60 (2011). [DOI] [PMC free article] [PubMed] [Google Scholar]
- 143.McMurdie PJ, Holmes S, phyloseq: An R package for reproducible interactive analysis and graphics of microbiome census data. PLOS ONE 8, e61217 (2013). [DOI] [PMC free article] [PubMed] [Google Scholar]
- 144.Contijoch EJ, Britton GJ, Yang C, Mogno I, Li Z, Ng R, Llewellyn SR, Hira S, Johnson C, Rabinowitz KM, Barkan R, Dotan I, Hirten RP, Fu SC, Luo Y, Yang N, Luong T, Labrias PR, Lira S, Peter I, Grinspan A, Clemente JC, Kosoy R, Kim-Schulze S, Qin X, Castillo A, Hurley A, Atreja A, Rogers J, Fasihuddin F, Saliaj M, Nolan A, Reyes-Mercedes P, Rodriguez C, Aly S, Santa-Cruz K, Peters L, Suárez-Fariñas M, Huang R, Hao K, Zhu J, Zhang B, Losic B, Irizar H, Song W-M, Narzo AD, Wang W, Cohen BL, Maio CD, Greenwald D, Itzkowitz S, Lucas A, Marion J, Maser E, Ungaro R, Naymagon S, Novak J, Shah B, Ullman T, Rubin P, George J, Legnani P, Telesco SE, Friedman JR, Brodmerkel C, Plevy S, Cho JH, Colombel J-F, Schadt EE, Argmann C, Dubinsky M, Kasarskis A, Sands B, Faith JJ, Gut microbiota density influences host physiology and is shaped by host and microbial factors. eLife 8, e40553 (2019). [DOI] [PMC free article] [PubMed] [Google Scholar]
- 145.Faith JJ, Guruge JL, Charbonneau M, Subramanian S, Seedorf H, Goodman AL, Clemente JC, Knight R, Heath AC, Leibel RL, Rosenbaum M, Gordon JI, The long-term stability of the human gut microbiota. Science 341, 1237439 (2013). [DOI] [PMC free article] [PubMed] [Google Scholar]
Associated Data
This section collects any data citations, data availability statements, or supplementary materials included in this article.
Supplementary Materials
Data Availability Statement
Sequencing data for bulk RNA-seq and scRNA-seq have been deposited to the GEO database (GSE272807). All source data needed to evaluate the conclusions in the paper are present in the paper or the Supplementary Materials. Materials used to conduct this study will be made available upon request.