Abstract
Objective: To explore the predictive value of high-resolution computed tomography (CT) parameters and inflammatory markers for spread through air spaces (STAS) in lung cancer patients. Methods: A retrospective analysis was conducted on 72 lung cancer patients with STAS and 128 STAS-negative patients treated during the same period. Differences in high-resolution CT indicators and inflammatory markers between the two groups were assessed. Binary logistic regression was used to analyze the relationship between these indicators and STAS positivity. Receiver operating characteristic (ROC) curve analysis was performed to assess the predictive efficacy of these indicators for STAS positivity. Results: Patients in the STAS-positive group exhibited a higher prevalence of leaf signs, pleural traction signs, and blurred tumor-lung boundaries than the STAS-negative group (P<0.05). Additionally, the STAS-positive group had elevated levels of the neutrophil-to-lymphocyte ratio (NLR), platelet-to-lymphocyte ratio (PLR), systemic immune-inflammation index (SII), interleukin-6 (IL-6), and C-reactive protein (CRP), alongside a lower lymphocyte-to-monocyte ratio (LMR) (P<0.05). The combined predictive model incorporating pleural traction sign, LMR, NLR, PLR, SII, IL-6, and CRP yielded an area under the curve (AUC) of 0.977, with a sensitivity of 94.4% and a specificity of 90.8%. Conclusion: The integration of high-resolution CT parameters with inflammatory markers demonstrates significant value in predicting STAS positivity in lung cancer patients, with the combined predictive model showing superior performance.
Keywords: Lung cancer, airway spread, high-resolution CT, inflammatory markers, predictive value
Introduction
Lung cancer is among the most prevalent malignant tumors worldwide and remains a leading cause of cancer-related morbidity and mortality [1]. Spread through air spaces (STAS), defined as the dissemination of lung cancer cells along the airways to distant sites, is a critical pathway for the progression and metastasis of lung cancer [2,3]. Early prediction and intervention for STAS in lung cancer patients are crucial for improving prognosis [4].
Recent advancements have highlighted the potential of high-resolution computed tomography (CT) and inflammatory markers in predicting STAS in lung cancer patients [5,6]. High-resolution CT allows for detailed evaluation of tumor morphology, offering insights into the biological behavior of the cancer, while inflammatory markers reflect the inflammatory response, which is closely related to the development and metastasis of lung cancer [7].
Despite these advancements, previous studies investigating the predictive value of imaging and inflammatory markers for STAS have been limited by small sample sizes. For instance, de Margerie-Mellon et al. [8] analyzed 80 subsolid nodules (40 STAS-positive and 40 STAS-negative) from a radiologic-pathologic repository of 203 resected pulmonary adenocarcinomas. They found that the total average diameter, the average and long-axis diameters of the solid component, as well as a high proportion of the solid component diameter relative to the total average diameter represent the CT manifestations of subsolid pulmonary adenocarcinomas exhibiting STAS. In contrast, our study included a larger cohort of 200 patients, with 72 STAS-positive and 128 STAS-negative cases, thereby providing a more comprehensive evaluation of these predictors.
This study aimed to explore the application value of high-resolution CT parameters and inflammatory markers in predicting STAS in lung cancer, thereby offering valuable insights for clinical treatment and prognosis evaluation.
Materials and methods
Study population
This retrospective study analyzed data from lung cancer patients admitted to the Second Affiliated Hospital, Hengyang Medical School, University of South China, from January 2021 to December 2023. A total of 72 patients with STAS-positive lung cancer were included in the study group, while another 128 STAS-negative patients treated during the same period were selected as the control group. Patients were included if they: (1) were diagnosed with lung cancer confirmed by surgical pathology, including those with confirmed spread through airway spaces (STAS); (2) were aged between 18 and 75 years; and (3) had complete clinical data, including demographic information, imaging, and laboratory results. Patients were excluded if they met any of the following criteria: (1) had received neoadjuvant chemoradiotherapy or targeted therapy; (2) had autoimmune diseases, primary mental illness, consciousness disorders, or cognitive impairments; or (3) had other chronic or acute inflammation, blood diseases, or other malignant tumors.
The study was approved by the Ethics Committee of The Second Affiliated Hospital, Hengyang Medical School, University of South China.
Data collection
High-resolution CT data were analyzed by experienced imaging specialists using RadiAnt DICOM Viewer (Medixant, Poland). The following indicators were evaluated: maximum tumor diameter, lobulation sign, spiculation sign, pleural traction sign, microvascular perforation, blurred tumor-lung boundary, vacuole sign, air-bronchial sign, bronchial truncation, vascular convergence sign, presence of mediastinal lymph nodes, pleural effusion, and crescent sign. To ensure data reliability, images were independently reviewed by a second radiologist, with discrepancies resolved by consensus.
Postoperative pathological specimens were classified according to the 2015 World Health Organization (WHO) classification criteria for lung cancer [9]. The presence of STAS was defined by the observation of tumor cells within air spaces in the lung parenchyma beyond the boundary of the primary tumor. Blood samples were collected within one week before surgery to determine the levels of inflammatory markers, including neutrophil-to-lymphocyte ratio (NLR), lymphocyte-to-monocyte ratio (LMR), platelet-to-lymphocyte ratio (PLR), systemic immune-inflammation index (SII, calculated as platelet count × NLR), interleukin-6 (IL-6) (measured using an ELISA kit, Cat. No. ELH-IL6, RayBiotech, USA), and C-reactive protein (CRP) (measured using an immunoturbidimetric assay kit, Cat. No. 05172373 190, Roche Diagnostics, Germany).
Clinical data were retrieved from the hospital’s electronic medical record system. Data collection was performed by two independent researchers using a standardized form. Any discrepancies in the collected data were resolved through discussion with a third researcher.
Statistical analysis
Data analysis was conducted using SPSS 22.0 (IBM Corp., Armonk, NY, USA). Continuous variables were expressed as mean ± standard deviation (SD) and compared using the independent samples t-test. Categorical variables were presented as counts and percentages and were compared using the chi-square test. Univariable and multivariable logistic regression analyses were performed to identify factors associated with STAS positivity. Receiver operating characteristic (ROC) curve analysis was conducted to evaluate the predictive performance of various indicators, and the area under the curve (AUC) values were compared using the DeLong test. A nomogram was subsequently constructed based on the logistic regression model. Statistical significance was defined as P<0.05.
Results
Baseline characteristics
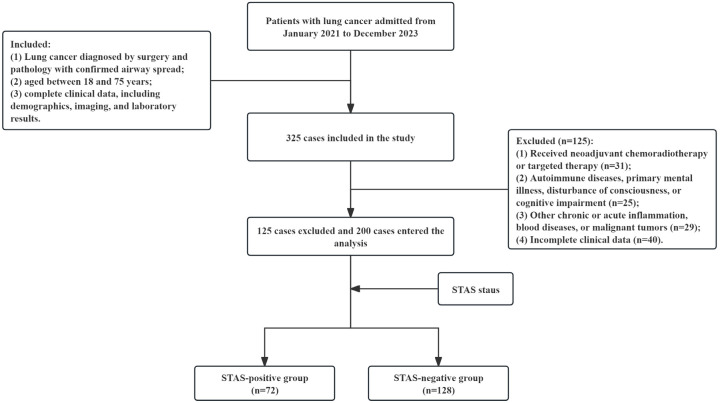
Out of 325 lung cancer patients screened for eligibility, 85 were excluded for not meeting the inclusion criteria and 40 for incomplete data, resulting in a final cohort of 200 patients (Figure 1). Among them, 72 patients were identified as STAS-positive and 128 as STAS-negative. There were no significant differences in age, gender, tumor location, or histological type between the two groups (P>0.05) (Table 1).
Figure 1.
Flow chart of the study.
Table 1.
Baseline characteristics of the study population
| Characteristic | STAS-positive group (n=72) | STAS-negative group (n=128) | χ2/t | P value |
|---|---|---|---|---|
| Age (years), mean ± SD | 62.64±8.03 | 61.53±7.42 | 0.983 | 0.327 |
| Gender, n (%) | 0.129 | 0.719 | ||
| Male | 46 (63.9) | 85 (66.4) | ||
| Female | 26 (36.1) | 43 (33.6) | ||
| Tumor location, n (%) | 0.295 | 0.587 | ||
| Left lung | 32 (44.4) | 62 (48.4) | ||
| Right lung | 40 (55.6) | 66 (51.6) | ||
| Histological type, n (%) | 0.259 | 0.878 | ||
| Squamous cell carcinoma | 9 (12.5) | 14 (10.9) | ||
| Adenocarcinoma | 57 (79.2) | 101 (78.9) | ||
| Other | 6 (8.3) | 13 (10.2) |
STAS, spread through air spaces; SD, standard deviation.
High-resolution CT indicators
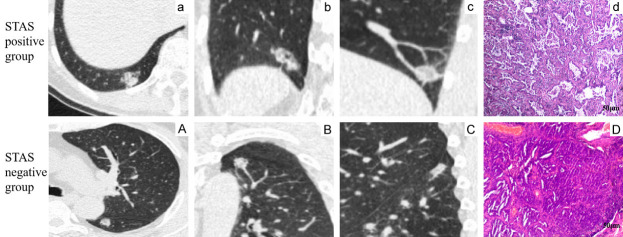
The STAS-positive group demonstrated a significantly higher incidence of the leaf sign (100% vs. 45.3%), pleural traction sign (90.3% vs. 45.3%), and blurred tumor-lung boundary (81.9% vs. 52.3%) compared to the STAS-negative group (all P<0.001). No significant differences were observed in other CT indicators (P>0.05) (Table 2). Representative CT images are shown in Figure 2.
Table 2.
Comparison of high-resolution CT parameters between the two groups
| Parameter | STAS-positive group (n=72) | STAS-negative group (n=128) | χ2/t | P value |
|---|---|---|---|---|
| Maximum diameter (mm), mean ± SD | 21.94±7.34 | 20.93±7.47 | 0.928 | 0.355 |
| Leaf sign, n (%) | 72 (100) | 58 (45.3) | 60.581 | <0.001 |
| Spiculation sign, n (%) | 66 (91.7) | 106 (82.8) | 3.000 | 0.083 |
| Pleural traction sign, n (%) | 65 (90.3) | 58 (45.3) | 39.351 | <0.001 |
| Microvascular perforation, n (%) | 46 (63.9) | 68 (53.1) | 2.178 | 0.140 |
| Tumor-lung boundary blurring, n (%) | 59 (81.9) | 67 (52.3) | 17.321 | <0.001 |
| Vacuole sign, n (%) | 31 (43.1) | 45 (35.2) | 1.220 | 0.269 |
| Air-bronchial sign, n (%) | 29 (40.3) | 43 (33.6) | 0.280 | 0.597 |
| Bronchial truncation, n (%) | 57 (79.2) | 91 (71.1) | 1.561 | 0.212 |
| Vascular convergence sign, n (%) | 9 (12.5) | 7 (5.5) | 3.095 | 0.079 |
| Mediastinal lymph nodes, n (%) | 9 (12.5) | 7 (5.5) | 3.095 | 0.079 |
| Pleural effusion, n (%) | 9 (12.5) | 7 (5.5) | 3.095 | 0.079 |
| Crescent sign, n (%) | 9 (12.5) | 9 (7.0) | 1.683 | 0.195 |
STAS, spread through air spaces; CT, computed tomography; SD, standard deviation.
Figure 2.
Representative high-resolution CT images of STAS-positive (a-d) and STAS-negative (A-D) lung cancer. (A, a) Lung window axial view; (B, b) Lung window coronal view; (C, c) Lung window sagittal view; (D, d) Hematoxylin and eosin staining (400×). Scale bar =50 μm.
Inflammatory markers
The STAS-positive group exhibited significantly higher levels of NLR (2.74±0.77 vs. 1.97±0.55), PLR (145.06±22.80 vs. 123.57±23.48), SII (606.76±169.29 vs. 456.83±122.08), IL-6 (9.04±2.22 vs. 6.88±1.93 ng/mL), and CRP (116.99±30.27 vs. 93.20±25.22 mg/L), and lower level of LMR (3.84±0.62 vs. 4.91±1.18) compared to the STAS-negative group (all P<0.001) (Table 3).
Table 3.
Comparison of inflammatory markers between the two groups
| Marker | STAS-positive group (n=72) | STAS-negative group (n=128) | t | P value |
|---|---|---|---|---|
| NLR, mean ± SD | 2.74±0.77 | 1.97±0.55 | 8.173 | <0.001 |
| LMR, mean ± SD | 3.84±0.62 | 4.91±1.18 | 7.141 | <0.001 |
| PLR, mean ± SD | 145.06±22.80 | 123.57±23.48 | 6.280 | <0.001 |
| SII, mean ± SD | 606.76±169.29 | 456.83±122.08 | 7.227 | <0.001 |
| IL-6 (ng/mL), mean ± SD | 9.04±2.22 | 6.88±1.93 | 7.199 | <0.001 |
| CRP (mg/L), mean ± SD | 116.99±30.27 | 93.20±25.22 | 5.950 | <0.001 |
STAS, spread through air spaces; NLR, neutrophil-to-lymphocyte ratio; LMR, lymphocyte-to-monocyte ratio; PLR, platelet-to-lymphocyte ratio; SII, systemic immune-inflammation index; IL-6, interleukin-6; CRP, C-reactive protein; SD, standard deviation.
Factors associated with STAS positivity
Multivariable logistic regression analysis was performed using variables with significant differences between the groups. The analysis identified pleural traction sign (OR=8.427, 95% CI: 1.359-52.256), NLR (OR=10.998, 95% CI: 2.829-42.763), LMR (OR=0.437, 95% CI: 0.194-0.983), PLR (OR=1.058, 95% CI: 1.022-1.095), SII (OR=1.008, 95% CI: 1.002-1.014), IL-6 (OR=2.035, 95% CI: 1.325-3.126), and CRP (OR=1.029, 95% CI: 1.001-1.057) as independent predictors of STAS positivity (all P<0.001) (Table 4).
Table 4.
Logistic regression analyses of factors associated with STAS positivity
| Variables | β | S.E | Wald | P | OR | 95% CI |
|---|---|---|---|---|---|---|
| Leaf sign | 20.090 | 3665.02 | 0.000 | 0.996 | 531009851.633 | 0.000- |
| Pleural traction sign | 2.131 | 0.931 | 5.242 | 0.022 | 8.427 | 1.359-52.256 |
| Tumor-lung boundary blurring | 1.479 | 0.819 | 3.257 | 0.071 | 4.388 | 0.880-21.864 |
| NLR | 2.398 | 0.693 | 11.976 | 0.001 | 10.998 | 2.829-42.763 |
| LMR | -0.828 | 0.414 | 4.005 | 0.045 | 0.437 | 0.194-0.983 |
| PLR | 0.056 | 0.018 | 9.998 | 0.002 | 1.058 | 1.022-1.095 |
| SII | 0.008 | 0.003 | 7.006 | 0.008 | 1.008 | 1.002-1.014 |
| IL-6 | 0.710 | 0.219 | 10.522 | 0.001 | 2.035 | 1.325-3.126 |
| CRP | 0.028 | 0.014 | 4.114 | 0.043 | 1.029 | 1.001-1.057 |
| Constant | -45.032 | 3.665.026 | 0.000 | 0.990 | 0.000 | - |
S.E, standard error; OR, odds ratio; CI, confidence interval; NLR, neutrophil-to-lymphocyte ratio; LMR, lymphocyte-to-monocyte ratio; PLR, platelet-to-lymphocyte ratio; SII, systemic immune-inflammation index; IL-6, interleukin-6; CRP, C-reactive protein.
Predictive efficacy of the indicators
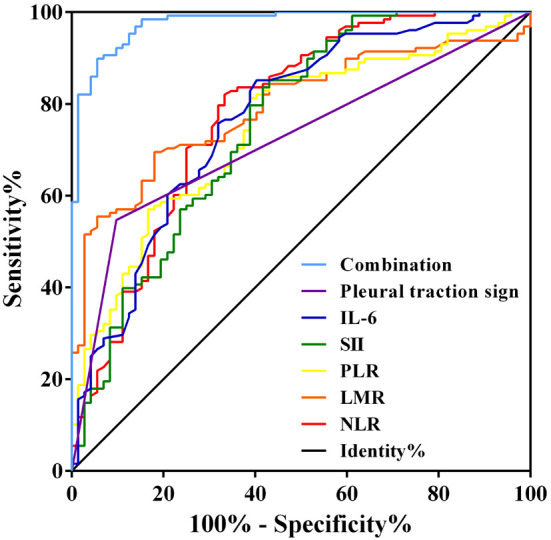
ROC curve analysis showed that pleural traction sign, LMR, NLR, PLR, SII, IL-6, and CRP had AUCs of 0.725, 0.793, 0.782, 0.749, 0.754, 0.769, and 0.729, respectively, for predicting STAS positivity. The combined predictive model, which incorporated these indicators, yielded an AUC of 0.977 (95% CI: 0.960-0.994), with a sensitivity of 94.4% and a specificity of 90.8% (Figure 3; Table 5). The DeLong test revealed that the AUC of the combined model was significantly higher than those of the individual indicators (all P<0.05). Continuous variables were converted to categorical or ordinal data for logistic regression analysis, with cut-off values determined using ROC curve analysis (Table 6).
Figure 3.

Receiver operating characteristic curves of the indicators for predicting STAS positivity in lung cancer patients. LMR, lymphocyte-to-monocyte ratio; NLR, neutrophil-to-lymphocyte ratio; PLR, platelet-to-lymphocyte ratio.
Table 5.
Predictive efficacy of the indicators for STAS positivity in lung cancer patients
| Indicator | AUC (95% CI) | P value | Cut-off value | Sensitivity (%) | Specificity (%) |
|---|---|---|---|---|---|
| Pleural traction sign | 0.725 (0.654-0.795) | <0.001 | - | 90.3 | 54.7 |
| LMR | 0.793 (0.731-0.854) | <0.001 | 4.265 | 69.5 | 71.9 |
| NLR | 0.782 (0.711-0.852) | <0.001 | 2.445 | 66.7 | 82.0 |
| PLR | 0.749 (0.680-0.818) | <0.001 | 141.995 | 61.1 | 81.2 |
| SII | 0.754 (0.681-0.828) | <0.001 | 588.00 | 56.9 | 85.2 |
| IL-6 | 0.769 (0.699-0.839) | <0.001 | 8.85 | 59.7 | 85.2 |
| CRP | 0.729 (0.654-0.804) | <0.001 | 106.20 | 66.7 | 71.1 |
| Combined model | 0.977 (0.960-0.994) | <0.001 | - | 94.4 | 90.8 |
PLR, platelet-to-lymphocyte ratio; IL-6, interleukin-6; CRP, C-reactive protein; NLR, neutrophil-to-lymphocyte ratio; LMR, lymphocyte-to-monocyte ratio; SII, systemic immune-inflammation index.
Table 6.
Cut-off values for converting continuous variables to categorical or ordinal data
| Variable | Cut-off value |
|---|---|
| PLR | ≥141.995 |
| IL-6 (ng/mL) | ≥8.85 |
| CRP (mg/L) | ≥106.20 |
| NLR | ≥2.445 |
| LMR | ≤4.265 |
| SII | ≥588.00 |
PLR, platelet-to-lymphocyte ratio; IL-6, interleukin-6; CRP, C-reactive protein; NLR, neutrophil-to-lymphocyte ratio; LMR, lymphocyte-to-monocyte ratio; SII, systemic immune-inflammation index; STAS, spread through air spaces; AUC, area under the curve; CI, confidence interval; LMR, lymphocyte-to-monocyte ratio; NLR, neutrophil-to-lymphocyte ratio; PLR, platelet-to-lymphocyte ratio; SII, systemic immune-inflammation index; IL-6, interleukin-6; CRP, C-reactive protein.
Nomogram
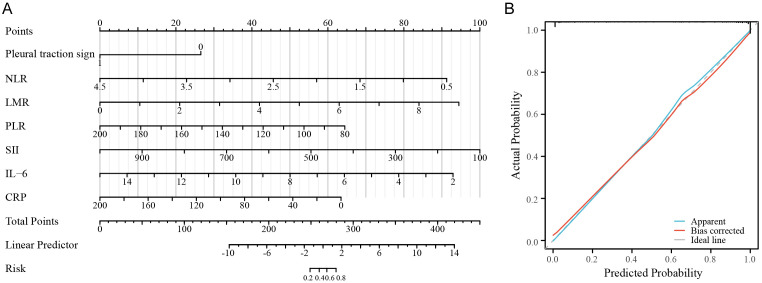
A nomogram based on the logistic regression model was developed to facilitate the prediction of STAS positivity in lung cancer patients (Figure 4A). The calibration curve for the nomogram demonstrated good agreement between predicted and observed outcomes (Figure 4B).
Figure 4.
Nomogram based on the logistic regression model. A. Nomogram; B. Calibration curve of the nomogram.
Discussion
This study evaluated the predictive value of combining high-resolution CT parameters and inflammatory markers for STAS in lung cancer patients. The results showed that the leaf sign, pleural traction sign, tumor-lung boundary-blurring, NLR, PLR, SII, IL-6, and CRP were significantly elevated while LMR was reduced in the STAS-positive group. These indicators were identified as independent predictors of STAS positivity, and a combined model incorporating these variables demonstrated robust predictive performance.
The formation of lobulation on high-resolution CT is related to the heterogeneity and growth rate of tumor cells [10]. The spread of tumor cells along the airways could lead to differential growth rates and invasive characteristics across various tumor regions, resulting in a lobulated appearance [11]. Additionally, pleural traction and blurred tumor-lung boundaries may also be attributed to tumor spread and invasion into adjacent structures [12].
In patients with STAS-positive lung cancer, the metastasis of cancer cells within the airways may provoke airway inflammation and subsequent infection, which in turn can trigger inflammatory response [13,14]. Biomarkers such as NLR, PLR, SII, IL-6, and CRP are all related to the inflammatory response and have been reported to be associated with both the progression and prognosis of lung cancer [15,16]. The observed decrease in LMR may reflect a reduction in lymphocytes, which is crucial for maintaining anti-tumor immunity [17].
Our findings are consistent with previous studies that have highlighted the potential of imaging and inflammatory markers as predictors of STAS in lung cancer [18,19]. However, this study offers several advantages over prior work, including a larger sample size, a more comprehensive analysis that integrates both imaging and inflammatory parameters, and the development of a combined predictive model and nomogram.
The nomogram based on the logistic regression model allows for individualized predictions of STAS positivity in lung cancer patients. By inputting the values of the relevant indicators, clinicians can easily calculate the probability of STAS positivity, thereby informing treatment decisions and prognosis evaluation.
Despite its contributions, this study has some limitations. First, it is a single-center retrospective study, which may limit the generalizability of the findings. Validation in larger, multicenter, prospective studies is necessary. Second, the mechanisms underlying the associations between the identified indicators and STAS positivity were not investigated. Future research should explore the biological basis of this relationship.
In conclusion, high-resolution CT parameters and inflammatory markers, including pleural traction sign, NLR, LMR, PLR, SII, IL-6, and CRP, are valuable predictors of STAS positivity in lung cancer patients. The combined predictive model that incorporates these indicators shows good performance, and the nomogram developed from this model can facilitate individualized risk prediction. These findings may assist in treatment planning and prognosis evaluation for lung cancer patients.
Disclosure of conflict of interest
None.
References
- 1.Sung H, Ferlay J, Siegel RL, Laversanne M, Soerjomataram I, Jemal A, Bray F. Global cancer statistics 2020: GLOBOCAN estimates of incidence and mortality worldwide for 36 cancers in 185 countries. CA Cancer J Clin. 2021;71:209–249. doi: 10.3322/caac.21660. [DOI] [PubMed] [Google Scholar]
- 2.Kadota K, Nitadori JI, Sima CS, Ujiie H, Rizk NP, Jones DR, Adusumilli PS, Travis WD. Tumor spread through air spaces is an important pattern of invasion and impacts the frequency and location of recurrences after limited resection for small stage I lung adenocarcinomas. J Thorac Oncol. 2015;10:806–814. doi: 10.1097/JTO.0000000000000486. [DOI] [PMC free article] [PubMed] [Google Scholar]
- 3.Han YB, Kim H, Mino-Kenudson M, Cho S, Kwon HJ, Lee KR, Kwon S, Lee J, Kim K, Jheon S, Lee CT, Lee JS, Kook W, Chung JH. Tumor spread through air spaces (STAS): prognostic significance of grading in non-small cell lung cancer. Mod Pathol. 2021;34:549–561. doi: 10.1038/s41379-020-00709-2. [DOI] [PubMed] [Google Scholar]
- 4.Dai C, Xie H, Su H, She Y, Zhu E, Fan Z, Zhou F, Ren Y, Xie D, Zheng H, Kadeer X, Chen D, Zhang L, Jiang G, Wu C, Chen C. Tumor spread through air spaces affects the recurrence and overall survival in patients with lung adenocarcinoma >2 to 3 cm. J Thorac Oncol. 2017;12:1052–1060. doi: 10.1016/j.jtho.2017.03.020. [DOI] [PubMed] [Google Scholar]
- 5.Koezuka S, Mikami T, Tochigi N, Sano A, Azuma Y, Makino T, Otsuka H, Matsumoto K, Shiraga N, Iyoda A. Toward improving prognosis prediction in patients undergoing small lung adenocarcinoma resection: Radiological and pathological assessment of diversity and intratumor heterogeneity. Lung Cancer. 2019;135:40–46. doi: 10.1016/j.lungcan.2019.06.023. [DOI] [PubMed] [Google Scholar]
- 6.Nishihara K, Suekane S, Ueda K, Nakiri M, Matsuo M, Igawa T. High postoperative neutrophil-to-lymphocyte ratio as a poor prognostic marker in patients with upper tract urothelial carcinoma. Oncol Lett. 2019;17:5241–5250. doi: 10.3892/ol.2019.10178. [DOI] [PMC free article] [PubMed] [Google Scholar]
- 7.Grivennikov SI, Greten FR, Karin M. Immunity, inflammation, and cancer. Cell. 2010;140:883–899. doi: 10.1016/j.cell.2010.01.025. [DOI] [PMC free article] [PubMed] [Google Scholar]
- 8.de Margerie-Mellon C, Onken A, Heidinger BH, VanderLaan PA, Bankier AA. CT manifestations of tumor spread through airspaces in pulmonary adenocarcinomas presenting as subsolid nodules. J Thorac Imaging. 2018;33:402–408. doi: 10.1097/RTI.0000000000000344. [DOI] [PubMed] [Google Scholar]
- 9.Travis WD, Brambilla E, Nicholson AG, Yatabe Y, Austin JHM, Beasley MB, Chirieac LR, Dacic S, Duhig E, Flieder DB, Geisinger K, Hirsch FR, Ishikawa Y, Kerr KM, Noguchi M, Pelosi G, Powell CA, Tsao MS, Wistuba I WHO Panel. The 2015 World Health Organization Classification of lung tumors: impact of genetic, clinical and radiologic advances since the 2004 classification. J Thorac Oncol. 2015;10:1243–1260. doi: 10.1097/JTO.0000000000000630. [DOI] [PubMed] [Google Scholar]
- 10.Dong H, Yin LK, Qiu YG, Wang XB, Yang JJ, Lou CC, Ye XD. Prediction of high-grade patterns of stage IA lung invasive adenocarcinoma based on high-resolution CT features: a bicentric study. Eur Radiol. 2023;33:3931–3940. doi: 10.1007/s00330-022-09379-x. [DOI] [PubMed] [Google Scholar]
- 11.Cha MJ, Lee HY, Lee KS, Jeong JY, Han J, Shim YM, Hwang HS. Micropapillary and solid subtypes of invasive lung adenocarcinoma: clinical predictors of histopathology and outcome. J Thorac Cardiovasc Surg. 2014;147:921–928. e2. doi: 10.1016/j.jtcvs.2013.09.045. [DOI] [PubMed] [Google Scholar]
- 12.Fu F, Zhang Y, Wen Z, Zheng D, Gao Z, Han H, Deng L, Wang S, Liu Q, Li Y, Shen L, Shen X, Zhao Y, Zhao Z, Ye T, Xiang J, Zhang Y, Sun Y, Hu H, Chen H. Distinct prognostic factors in patients with stage I non-small cell lung cancer with radiologic part-solid or solid lesions. J Thorac Oncol. 2019;14:2133–2142. doi: 10.1016/j.jtho.2019.08.002. [DOI] [PubMed] [Google Scholar]
- 13.Kim M, Chung YS, Kim KA, Shim HS. Prognostic factors of acinar- or papillary-predominant adenocarcinoma of the lung. Lung Cancer. 2019;137:129–135. doi: 10.1016/j.lungcan.2019.09.026. [DOI] [PubMed] [Google Scholar]
- 14.Yanagawa N, Shiono S, Endo M, Ogata SY. Tumor spread through air spaces is a useful predictor of recurrence and prognosis in stage I lung squamous cell carcinoma, but not in stage II and III. Lung Cancer. 2018;120:14–21. doi: 10.1016/j.lungcan.2018.03.018. [DOI] [PubMed] [Google Scholar]
- 15.Jiang T, Bai Y, Zhou F, Li W, Gao G, Su C, Ren S, Chen X, Zhou C. Clinical value of neutrophil-to-lymphocyte ratio in patients with non-small-cell lung cancer treated with PD-1/PD-L1 inhibitors. Lung Cancer. 2019;130:76–83. doi: 10.1016/j.lungcan.2019.02.009. [DOI] [PubMed] [Google Scholar]
- 16.Wang Z, Zhan P, Lv Y, Shen K, Wei Y, Liu H, Song Y. Prognostic role of pretreatment neutrophil-to-lymphocyte ratio in non-small cell lung cancer patients treated with systemic therapy: a meta-analysis. Transl Lung Cancer Res. 2019;8:214–226. doi: 10.21037/tlcr.2019.06.10. [DOI] [PMC free article] [PubMed] [Google Scholar]
- 17.Tao H, Mimura Y, Aoe K, Kobayashi S, Yamamoto H, Matsuda E, Okabe K, Matsumoto T, Sugi K, Ueoka H. Prognostic potential of FOXP3 expression in non-small cell lung cancer cells combined with tumor-infiltrating regulatory T cells. Lung Cancer. 2012;75:95–101. doi: 10.1016/j.lungcan.2011.06.002. [DOI] [PubMed] [Google Scholar]
- 18.Eguchi T, Kameda K, Lu S, Bott MJ, Tan KS, Montecalvo J, Chang JC, Rekhtman N, Jones DR, Travis WD, Adusumilli PS. Lobectomy is associated with better outcomes than sublobar resection in spread through air spaces (STAS)-positive T1 lung adenocarcinoma: a propensity score-matched analysis. J Thorac Oncol. 2019;14:87–98. doi: 10.1016/j.jtho.2018.09.005. [DOI] [PMC free article] [PubMed] [Google Scholar]
- 19.Warth A, Muley T, Kossakowski CA, Goeppert B, Schirmacher P, Dienemann H, Weichert W. Prognostic impact of intra-alveolar tumor spread in pulmonary adenocarcinoma. Am J Surg Pathol. 2015;39:793–801. doi: 10.1097/PAS.0000000000000409. [DOI] [PubMed] [Google Scholar]


