Abstract
Myasthenia gravis (MG) is an acquired autoimmune disease diagnosed based on clinical manifestations, muscle fatigue tests, prostigmin tests, serum antibody tests, and neuroelectrophysiological examination. This study conducted a comprehensive search of PubMed, Web of Science, Scopus, Ovid, Embase, Cochrane Library, China National Knowledge Infrastructure, WanFang, Chinese Periodical Database, Chinese Bio-Medicine Database, VIP, and DuXiu Database to identify relevant studies on the accuracy of prostigmin tests for diagnosing MG, covering publications from 1941 to 2021. Ten studies met the inclusion criteria and were included in the meta-analysis. The analysis found no heterogeneity caused by threshold effects but identified heterogeneity due to non-threshold effects. The combined sensitivity was 0.861 (95% CI: 0.831-0.888), and the combined specificity was 0.844 (95% CI: 0.816-0.870). The combined positive likelihood ratio was 5.496 (95% CI: 1.454-20.77), and the combined negative likelihood ratio was 0.237 (95% CI: 0.123-0.455). The area under the curve for diagnostic accuracy was 0.88 (95% CI: 0.84-0.90), with Q* = 0.8520. The combined diagnostic odds ratio was 19.344 (95% CI: 4.327-86.488). In conclusion, the prostigmin test demonstrated good diagnostic value for MG.
Keywords: Myasthenia gravis, prostigmin tests, diagnostic meta-analysis
Introduction
Myasthenia gravis (MG) is an acquired autoimmune disease characterized by the involvement of antibodies against the acetylcholine receptor (AChR) located in the postsynaptic membrane of the neuromuscular junction. This antibody-mediated response, which relies on cellular immunity and involves complement activation, leads to transmission disorders and muscle weakness. It is important to note that the AChR antibody is not a single monoclonal antibody [1].
MG is often suspected in patients presenting with a typical pattern of fatigable muscle weakness. Because symptoms and signs may become apparent only after exertion, maneuvers that fatigue specific muscle groups can be useful. Testing should include facial, ocular, oropharyngeal, axial, and limb muscles. Tendon reflexes are usually normal, and pain and autonomic signs are absent. The clinical diagnosis of MG is confirmed through electromyography (EMG) studies, pharmacologic testing, and serum antibody assays. Positive EMG results confirm a postsynaptic defect of the neuromuscular transmission (NMT). A clinical response to cholinesterase inhibitors (ChE-Is) supports the diagnosis of MG, and the detection of specific antibodies not only confirms MG but also identifies antibody-related subgroups. For patients lacking AChR or MuSK antibodies in standard assays, EMG confirmation is essential [2].
Acetylcholinesterase inhibitors (AchEI), such as prostigmin, can be used as auxiliary diagnostic tools for MG. These tests are simple to perform and suitable for widespread clinical use. A positive clinical response indicates a potential benefit of long-term treatment, but the diagnostic value of AchEI is limited due to issues with objectivity and the possibility of false positives. While both prostigmin and tensilon are cholinesterase inhibitors, tensilon is rarely used in clinical practice in China, making prostigmin the preferred choice for diagnosis of MG. Factors influencing the sensitivity of the prostigmin test and leading to false negatives include AChR subtype, muscle selectivity, antibody specificity, drug dosage, the setting of negative controls, quantification of outcome judgment, and disease course [3,4]. False positives in the prostigmin test may occur in non-MG patients with similar symptoms, categorized into two types: (1) other neuromuscular junction diseases, such as Lambert-Eaton syndrome, botulism, congenital myasthenic syndrome, and snake venom poisoning, where symptoms of acute organophosphorus poisoning may worsen after AchEI injection; (2) diseases related to lower motor neuron injury, such as motor neuron disease with bulbar paralysis, which can show positive tensilon tests. Other rare causes of false positives include brainstem glioma, multiple sclerosis, pituitary or parasellar tumors, orbital apex metastasis, aneurysms, Guillain-Barre syndrome, end-stage renal disease, diabetes-associated abducens nerve palsy, inflammatory myopathy, and genetic metabolic myopathy [5,6].
This study aims to retrieve literature on the use of the prostigmin test for diagnosing MG and perform a quantitative analysis through meta-analysis to provide a basis for clinical diagnosis of the disease.
Materials and methods
Registry number
This meta-analysis was performed according to the prespecified criteria outlined by the PRISMA guidelines. The study protocol was registered in the PROSPERO database (CRD42022299793).
Search strategy
Relevant studies reporting the diagnostic value of the prostigmin test for MG were identified by searching PubMed, Web of Science, Scopus, Ovid, Embase, Cochrane Library, China National Knowledge Infrastructure, WanFang Data, VIP, Chinese Bio-Medicine Database, and DuXiu databases. There were no restrictions on date, age, sex, or language. The search ended on December 14, 2021. The search strategy consisted of three core components linked using the AND operator: “MG”, AND “prostigmine test” AND “diagnosis”. The search was conducted using a combination of subject-specific terms and free-text words linked with the OR operator.
Inclusion and exclusion criteria
Inclusion criteria: (1) Chinese and English studies evaluating or exploring the diagnostic efficacy of the neostigmine test for MG; (2) Studies from which true positive (TP), true negative (TN), false positive (FP), and false negative (FN) values for the neostigmine test could be directly or indirectly obtained.
Exclusion criteria: (1) Non-diagnostic experimental studies; (2) Studies from which the required data and information could not be extracted.
Data extraction
A customized data extraction table was used to collect data, including study source, doses, number of MG patients, number of controls, and the positive rate in the disease group and negative rate in the control group.
Assessment of risk of bias of the included studies
The quality of diagnostic accuracy tests was evaluated using the QUADAS-2 tool [7]. Researchers independently screened the literature, extracted data, and assessed the risk of bias in the included studies. Differences of opinion were resolved through consultation or discussion with a third party.
Data analysis
GraphPad Prism 8 was used to create the literature screening flow chart, RevMan 5.3 for the literature quality bias risk assessment map, and STATA 15.1 and Meta-Disc 1.4 for statistical analysis. The summary receiver operator characteristic (SROC) curve and AUC were calculated, with an AUC closer to 1 indicating higher diagnostic accuracy. A funnel plot was drawn using STATA 15.1 to assess publication bias.
Results
Description of included literature
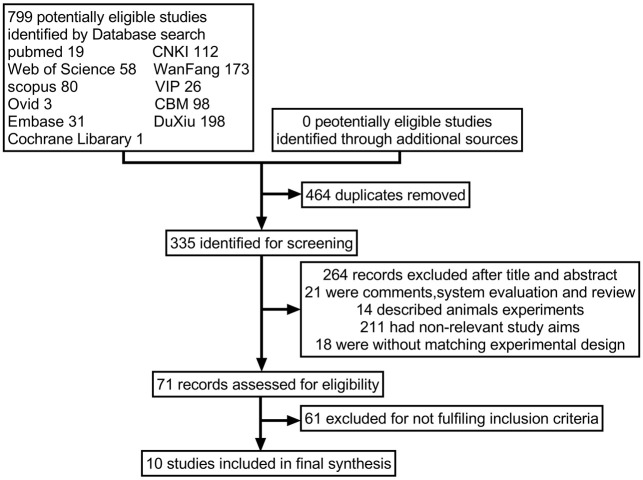
Ten studies met the inclusion criteria and were included in the meta-analysis, as shown in Figure 1. These studies used a combination of clinical skeletal muscle fatigue, cholinesterase inhibitor test, electromyography, and serological antibody test as the gold standard for diagnosing MG. The clinical absolute score and relative score of MG patients were used to assess patients across eight aspects (e.g., upper eyelid weakness, limb fatigue, and respiratory muscle function) before and after the prostigmin test. The most significant improvement in clinical symptoms was observed within 20-40 minutes after injection [8,9]. The single absolute score at the time of peak improvement was recorded, and the relative score, representing the best relative improvement, was calculated to interpret the test results. A relative score > 60% was defined as positive, 25%-60% as suspicious for positive, and < 25% as negative. The basic information of the included studies is shown in Table 1, and the diagnostic parameters are detailed in Table 2.
Figure 1.
Flow chart of article screening and selection process. CBM, Chinese Bio-Medicine Database; CNKI, China National Knowledge Infrastructure.
Table 1.
Characteristics of 10 studies included in the meta-analysis
| Studies | Case | Control | Case n = 593 | Control n = 723 | Prostigmine* | Period | Population |
|---|---|---|---|---|---|---|---|
| Mustare, V.K 2019 [10] | d-OMG | Non-OMG | 60 | 36 | 0.03-0.4 mg/Kg | 2000-2014 | NA |
| Liang, F.R 2016 [11] | OMG | GMG | 21 | 60 | 1.50 mg + atropine 1.0 mg | 2011-2015 | Chinese Inner Mongolia |
| Patil, S.A 2016 [12] | OMG | GMG | 184 | 283 | 30 ug/kg | 2003-2013 | Indian Bangalore |
| Li, W.Y 2014 [13] | JMG | Non-MG | 29 | 6 | 1.5 mg (0.02 mg/kg) | 2013-2014 | Chinese Shanghai |
| Peng, D.T 2014 [14] | MG | Normal | 102 | 97 | 1.5 mg + atropine 1.0 mg (0.01-0.015) | NA | Chinese Beijing |
| Roh, H.S 2011 [15] | OMG | GMG | 14 | 57 | NA | 1995-2007 | Korean Seoul |
| Zhu, Z.F 2020 [2] | MG | Non-MG | 20 | 20 | 0.02 mg/kg + atropine 0.01 mg/kg | 2015.12-2018.3 | Chinese Jiangyin |
| Li, J 2020 [7] | OMG | Non-OMG | 63 | 131 | 0.02 mg/kg | 2018.02.01-07.31 | Chinese Xian |
| Zhang, Y.F 2016 [8] | OMG | Normal | 32 | 10 | 1-1.5 mg + atropine 0.5 mg | 2012.06-2016.01 | Chinese Guiyang |
| Peng, D.T 2007 [9] | MG | Normal | 68 | 23 | 1.5 mg+ atropine 1.0 mg | NA | Chinese Beijing |
Note: MG is myasthenia gravis. OMG is ocular myasthenia gravis. GMG is generalized myasthenia gravis. d-OMG is definite OMG. JMG is juvenile myasthenia gravis. Normal is normal control groups. NA is not available.
Children aged 10-16, < 2/3 adult dosage, < 1 mg, 0.02-0.03 mg/kg.
Table 2.
Characteristics of 10 studies included in the meta-analysis
| Study | TP/n | FP/n | FN/n | TN/n | Sen/% | Spe/% | PLR/% | NLR% | DOR |
|---|---|---|---|---|---|---|---|---|---|
| Mustare, V.K 2019 [10] | 50 | 1 | 10 | 35 | 0.83 | 0.97 | 27.78 | 0.17 | 161.6 |
| Liang, F.R 2016 [11] | 19 | 9 | 2 | 51 | 0.90 | 0.85 | 6.03 | 0.11 | 53.9 |
| Patil, S.A 2016 [12] | 184 | 6 | 13 | 283 | 0.93 | 0.98 | 44.99 | 0.07 | 667.5 |
| Li, W 2014 [13] | 27 | 0 | 2 | 6 | 0.93 | 1.00 | 0.00 | 0.07 | 0.00 |
| Peng, D.T 2014 [14] | 90 | 11 | 12 | 86 | 0.88 | 0.89 | 8.00 | 0.13 | 59.3 |
| Roh, H.S 2011 [15] | 11 | 52 | 3 | 1 | 0.79 | 0.02 | 0.81 | 10.50 | 0.1 |
| Zhu, Z.F 2020 [2] | 16 | 14 | 4 | 6 | 0.80 | 0.30 | 1.14 | 0.67 | 1.7 |
| Li, J 2020 [7] | 39 | 7 | 24 | 124 | 0.62 | 0.95 | 11.59 | 0.40 | 28.8 |
| Zhang, Y.F 2016 [8] | 26 | 10 | 6 | 0 | 0.81 | 0.00 | 0.81 | 0.00 | 0.00 |
| Peng, D.T 2007 [9] | 60 | 3 | 8 | 20 | 0.88 | 0.87 | 6.76 | 0.14 | 50.0 |
Note: TP is true positive. FP is false positive. TN is true negative. FN is false negative. Sen means sensitivity. Spe means specificity. PLR means positive likelihood ratio. NLR means negative likelihood ratio. DOR means diagnostic odds ratio.
Risk of bias assessment
Figure 2 presents the risk of bias assessment for the included studies. All studies were deemed to have a low risk of bias overall. However, 2 out of 10 studies had a high risk of bias in patient selection and reference standards, while all studies had a low risk of bias concerning the index test. For flow and timing, 5 out of 10 studies were at high risk of bias.
Figure 2.
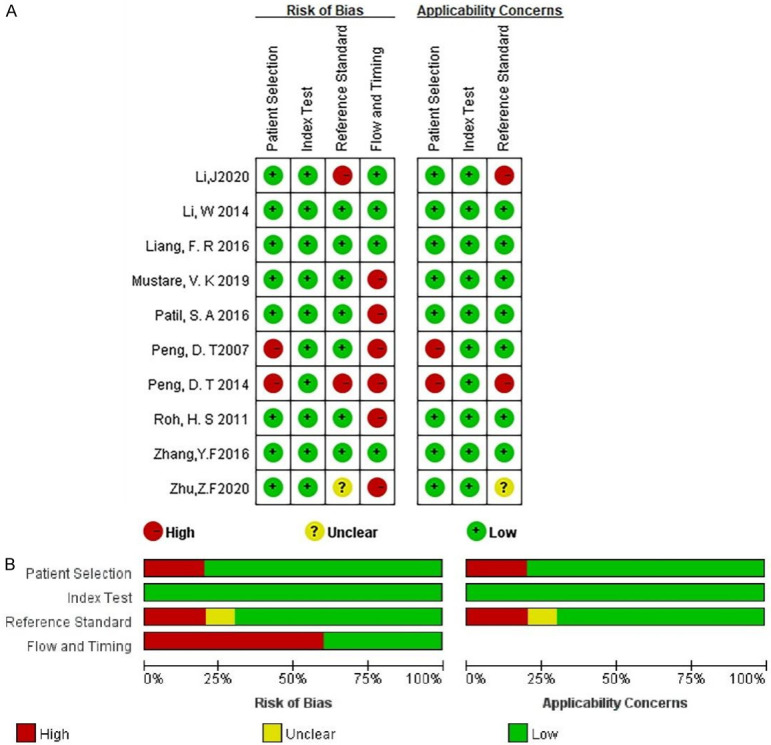
Assessment of bias risk. A. An analysis of bias risk trends in the included literature over time, stratified by year; B. A comprehensive assessment of bias risk in the selected literature, categorized by distinct risk levels.
Heterogeneity analysis
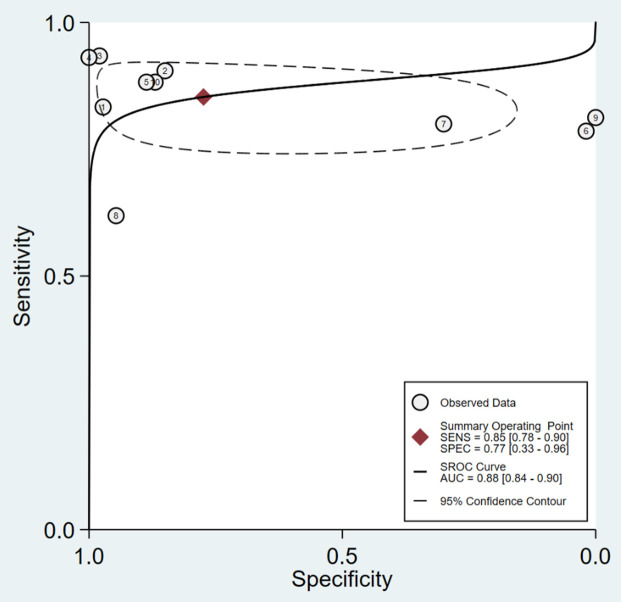
The asymmetric SROC curve of prostigmin’s diagnostic value is shown in Figure 3. The AUC of the SROC curve was 0.88 (95% CI: 0.84-0.90), indicating high diagnostic accuracy. The Spearman correlation coefficient between the logarithms of sensitivity and (1-specificity) is was -0.438 (P = 0.206), suggesting no heterogeneity caused by threshold effects. Additionally, the absence of a “shoulder-arm” shape in the SROC curve further indicates no threshold effect in this study.
Figure 3.
Asymmetric summary receiver operator characteristic curve analysis of prostigmin’s diagnostic value across the included literature in a meta-analysis framework (AUC = 0.88 [95% CI: 0.84-0.90]).
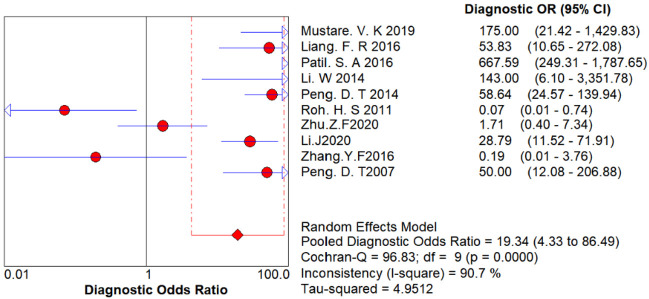
Figure 4 displays the results of the Cochrane-Q test for the diagnostic odds ratio (DOR) to detect non-threshold effect heterogeneity. The Cochrane-Q test for DOR showed Q = 96.83, P < 0.001, indicating heterogeneity due to non-threshold effects.
Figure 4.
Cochrane-Q test of the diagnostic odds ratio to detect non-threshold effect heterogeneity.
Evaluation indicators for diagnostic tests
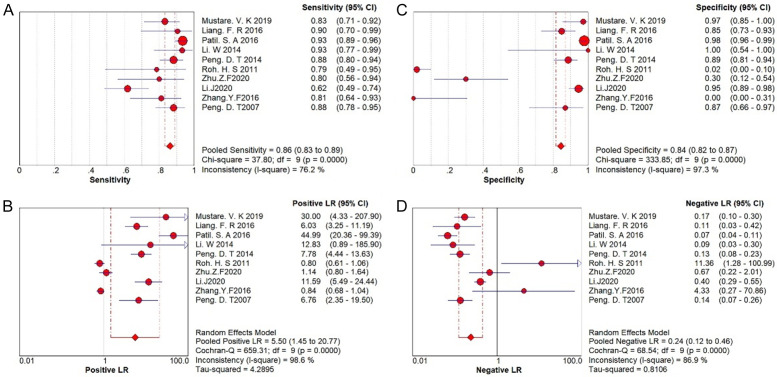
The forest plot of diagnostic tests is shown in Figure 5. The combined sensitivity was 0.861 (95% CI: 0.831-0.888), and the combined specificity was 0.844 (95% CI: 0.816-0.870). The combined positive likelihood ratio was 5.496 (95% CI: 1.454-20.77), and the combined negative likelihood ratio was 0.237 (95% CI: 0.123-0.455). The combined AUC (diagnostic accuracy) was 0.88 (95% CI: 0.84-0.90), Q* = 0.8520, and the combined DOR was 19.344 (95% CI: 4.327-86.488). The I2 for sensitivity, specificity, positive likelihood ratio, negative likelihood ratio, and DOR was greater than 50%, indicating substantial heterogeneity and justifying the use of a random-effects model.
Figure 5.
Forest plot of diagnostic tests of prostigmin. A. Pooled sensitivity; B. Pooled specificity; C. Pooled positive likelihood ratio; D. Pooled negative likelihood ratio.
Sensitivity analysis
Figure 6 shows the sensitivity analysis. It reveals that one of the original studies had a stronger influence on sensitivity, while the other studies did not significantly impact the sensitivity of the results. Overall, the results of this study are relatively stable.
Figure 6.
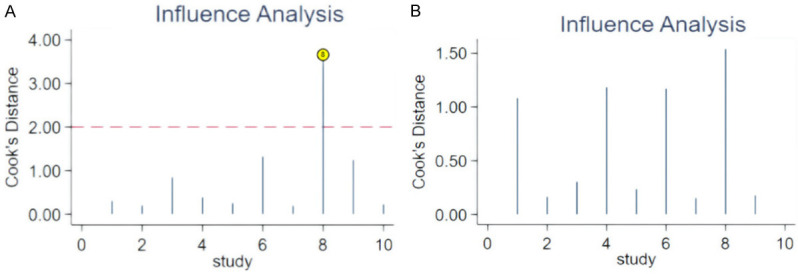
Sensitivity analysis of diagnostic test. A. Cook’s Sensitive Analysis; B. After adjusting the order of literature, repeat of Cook’s Sensitive Analysis
Publishing bias analysis
As shown in Figure 7, the funnel plot indicated a P-value of 0.013 (P < 0.05), suggesting the presence of publication bias in this meta-analysis.
Figure 7.
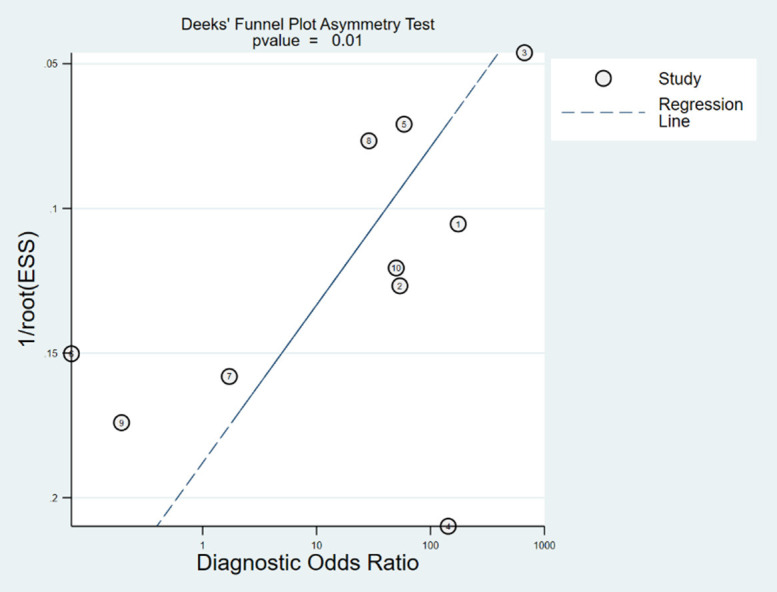
Publication bias funnel plot of diagnostic test (P = 0.010).
Discussion
The clinical diagnosis of MG relies on a combination of clinical manifestations, muscle fatigue tests, prostigmin test, serum antibody tests, and neuroelectrophysiological examinations. The prostigmin test is quick, easy to perform, and carries minimal risk. Clinically, it should be considered first for patients experiencing fluctuating muscle weakness, particularly those with symptoms varying between morning and evening. To enhance the diagnostic efficacy of the prostigmin test, some Chinese researchers have proposed standardizing drug dosage, utilizing absolute and relative scores for clinical symptoms, establishing standardized outcome evaluations, and focusing on specific muscle groups [16-18]. In this study, a meta-analysis was conducted on 10 selected studies to assess the diagnostic accuracy of the prostigmin test. The analysis examined heterogeneity caused by both threshold and non-threshold effects by combining diagnostic effect sizes and fitting the SROC curve. This approach helped identify sources of heterogeneity affecting study outcomes. Effect sizes were combined to determine the overall diagnostic efficacy of the neostigmine test. Finally, the reliability of this meta-analysis was assessed through sensitivity analysis and publication bias detection.
Understanding heterogeneity is crucial for identifying factors that may influence diagnostic accuracy and for statistically combining results from different studies. In diagnostic tests, heterogeneity can arise from threshold and non-threshold effects. In this study, the Spearman correlation coefficient for diagnostic threshold analysis was -0.438 (P = 0.206 > 0.05), indicating no significant threshold effect, allowing for the combination of diagnostic indicators. The difference between beta and zero (P = 0.0016 < 0.05) was significant, indicating an asymmetric SROC curve. The SROC curve had an AUC of 0.88 (95% CI: 0.84-0.90), which is close to 1, and a Q* index of 0.8520, indicating a high diagnostic accuracy of 88% (95% CI: 84-90%). The Cochrane-Q test for the DOR showed Cochrane-Q = 96.83, P = 0.0000 < 0.001, indicating heterogeneity due to non-threshold effects [19]. Sources of heterogeneity include patient population (e.g., disease severity and comorbidities), trial conditions (e.g., different techniques, tests, operators), and standard trial protocols.
The combined DOR in this study was 19.344 (95% CI: 4.237-86.488), indicating a strong discriminative ability of the prostigmin test. High values of DOR suggest better diagnostic performance. In this study, the sensitivity I2 was 76.2%, specificity I2 was 97.3%, positive likelihood ratio I2 was 98.6%, negative likelihood ratio I2 was 86.9%, and DOR I2 was 90.7%, all exceeding 50%, indicating high heterogeneity. Therefore, a random-effects model was used to combine these effect values. The pooled sensitivity was 86.1% (95% CI: 83.1-88.8%), with a missed diagnosis rate of 13.9%. The pooled specificity was 84.4% (95% CI: 81.6-87.0%), with a misdiagnosis rate of 15.6%. The prostigmin test’s limitations include difficulty detecting improvements in lower limb muscle strength, ocular muscle function, and respiratory muscles, which can reduce sensitivity. False negatives may occur due to variations in receptor subtypes and receptor types in different muscle groups and their sensitivity to prostigmin [12,13,20]. Given the misdiagnosis rate of the prostigmin test, it is recommended to combine it with neuroelectrophysiology and serum antibody detection to exclude non-MG conditions.
Guidelines for interpreting likelihood ratios suggest that a positive likelihood ratio (PLR) greater than 10 significantly increases the probability of disease after a positive test, while a negative likelihood ratio (NLR) less than 0.1 significantly reduces disease probability after a negative test. However, these general rules have been criticized because the effectiveness of these ratios can vary with disease prevalence. For rare diseases, a large PLR is needed to meaningfully increase disease probability after a positive test. Conversely, for common diseases, a small NLR is necessary to effectively reduce disease probability after a negative test. In this study, the pooled PLR was 5.496 (95% CI: 1.454-20.77), which is less than 10, indicating that a positive neostigmine test alone may not conclusively diagnose MG and should be combined with other diagnostic methods. The pooled NLR was 0.237 (95% CI: 0.123-0.455), greater than 0.1, suggesting that a negative prostigmin test does not entirely rule out MG [14].
Sensitivity analysis was performed by excluding studies of lower quality or those that used different efficacy evaluation criteria or inclusion criteria, followed by a pooled analysis. The results were then compared to the combined effect size before the exclusions to assess the influence of the excluded studies on the overall effect size. Sensitivity analysis focused on comparing the combined effect size from repeated meta-analyses with the original effect size. If the combined effect size did not change significantly after excluding certain studies, it indicated that the meta-analysis results were relatively stable. Conversely, if large differences or contradictory conclusions emerged, it suggested poor stability of the meta-analysis results, warranting cautious interpretation of the findings and conclusions. In this study, sensitivity analysis and outlier detection revealed that certain studies impacted the final meta-analysis results. Removing these studies initially caused the model to become unstable; however, after adjusting the order of references, the model regained stability [15].
This study has several limitations. A substantial sample size gap (ranging from 6 to 283 cases) may have affected the statistical power of the diagnostic accuracy tests. Improving the efficiency of statistical tests could be achieved by standardizing the minimum sample size and ensuring a balanced sample size between the disease and control groups. Additionally, symptom scoring before and after the prostigmin test was subjective, as a possible measurement bias. Future studies should aim to develop scoring methods that are more accurate, simple, practical, and suitable for widespread use. The wide age range of cases included in the literature also suggests that further research is needed to clarify the diagnostic value of the prostigmin test across different age groups [11]. The funnel plot indicated that references 3 (from the Indian population) and 8 (from the Chinese population) fell outside the 95% confidence interval, suggesting the presence of publication bias. This bias could be related to the sample size discrepancies in these studies [4,18]. Other factors, such as non-random patient selection and the absence of blinding, may have contributed to bias.
The prostigmin test is frequently used to assist in the clinical diagnosis of MG and demonstrates high diagnostic value.
Acknowledgements
The work was supported by the Capital clinical characteristic application research, “The application of AQP4 antibody level and MRI image in NMOSD cognitive impairment” (No. Z181100001718040).
Disclosure of conflict of interest
None.
References
- 1.Kang SY, Oh JH, Song SK, Lee JS, Choi JC, Kang JH. Both binding and blocking antibodies correlate with disease severity in myasthenia gravis. Neurol Sci. 2015;36:1167–1171. doi: 10.1007/s10072-015-2236-8. [DOI] [PubMed] [Google Scholar]
- 2.Zhu ZF, Yang JS, Lu MR. Value of orbital ice test in early diagnosis of myasthenia gravis. Jiangsu Med. 2020;46:407–408. [Google Scholar]
- 3.Hendricks TM, Bhatti MT, Hodge DO, Chen JJ. Incidence, epidemiology, and transformation of ocular myasthenia gravis: a population-based study. Am J Ophthalmol. 2019;205:99–105. doi: 10.1016/j.ajo.2019.04.017. [DOI] [PMC free article] [PubMed] [Google Scholar]
- 4.Shin HY, Park HJ, Lee HE, Choi YC, Kim SM. Clinical and electrophysiologic responses to acetylcholinesterase inhibitors in MuSK-antibody-positive myasthenia gravis: evidence for cholinergic neuromuscular hyperactivity. J Clin Neurol. 2014;10:119–124. doi: 10.3988/jcn.2014.10.2.119. [DOI] [PMC free article] [PubMed] [Google Scholar]
- 5.Evoli A, Antonini G, Antozzi C, DiMuzio A, Habetswallner F, Iani C, Inghilleri M, Liguori R, Mantegazza R, Massa R, Pegoraro E, Ricciardi R, Rodolico C. Italian recommendations for the diagnosis and treatment of myasthenia gravis. Neurol Sci. 2019;40:1111–1124. doi: 10.1007/s10072-019-03746-1. [DOI] [PubMed] [Google Scholar]
- 6.Zeng L, Xu LJ. Progress in the detection of ocular myasthenia gravis. J Nanchang Univ Med Sci. 2019;59:91–95. [Google Scholar]
- 7.Li J, Lei T, Zhang LL, Wang HY, Guo G. Comparison of diagnostic efficacy of different test methods in myasthenia gravis of ocular type. Southwest Def Med. 2020;30:322–324. [Google Scholar]
- 8.Zhang YF, Chu L, Li Y, Xia C, Gao J, Dai QQ, Kuang SX. Judgment and study of modified neostigmine test in patients with myasthenia gravis with diplopia as the first symptom. J Apoplexy Nerv Dis. 2016;33:738–740. [Google Scholar]
- 9.Peng DT, Xu XH, She ZY. Study on revise criteria for neostigmine test. Chin J Neuroimmunol Neurol. 2007;14:1–3. [Google Scholar]
- 10.Mustare VK, Navalli D, Krishnan A, Subasree R. Ann Indian Acad Neurol. 2019;22(Suppl 1):S2–S32. [Google Scholar]
- 11.Liang FR, Zhang TY, Yao GJ, Jia YH, Li J, Liu GR. Comparative study on the value of accessory examinations in the diagnosis of ocular myasthenia gravis. Chin J Contemp Neurol Neurosurg. 2016;16:684–688. [Google Scholar]
- 12.Patil SA, Bokoliya SC, Nagappa M, Taly AB. Diagnosis of myasthenia gravis: comparison of anti-nicotinic acetyl choline receptor antibodies, repetitive nerve stimulation and Neostigmine tests at a tertiary neuro care centre in India, a ten year study. J Neuroimmunol. 2016;292:81–84. doi: 10.1016/j.jneuroim.2016.01.006. [DOI] [PubMed] [Google Scholar]
- 13.Li WY, Chai YM, Zhou SZ, Zhang LZ, Zhang X, Wang SY. Study on the diagnostic accuracy of palpebral fissure width in ice pack test to juvenile myasthenia gravis patients. Chin J Evidence Based Pediatr. 2014;9:328–332. [Google Scholar]
- 14.Peng DT, Wang ZH, Zhang XH, Xu XH. Revised assessment criteria for prostigmine test of myasthenia gravis. J Am Geriatr Soc. 2014;62:S377. [Google Scholar]
- 15.Roh HS, Lee SY, Yoon JS. Comparison of clinical manifestations between patients with ocular myasthenia gravis and generalized myasthenia gravis. Korean J Ophthalmol. 2011;25:1–7. doi: 10.3341/kjo.2011.25.1.1. [DOI] [PMC free article] [PubMed] [Google Scholar]
- 16.Dirr LY, Donofrio PD, Patton JF, Troost BT. A false-positive edrophonium test in a patient with a brainstem glioma. Neurology. 1989;39:865–867. doi: 10.1212/wnl.39.6.865. [DOI] [PubMed] [Google Scholar]
- 17.Gao G, Cao L, Du X, Xu B, Zhang P, Zhang X, Wang R, Quan Z. Comparison of minimally invasive surgery transforaminal lumbar interbody fusion and TLIF for treatment of lumbar spine stenosis. J Healthc Eng. 2022;2022:9389239. doi: 10.1155/2022/9389239. [DOI] [PMC free article] [PubMed] [Google Scholar]
- 18.Booth A. PROSPERO’s progress and activities 2012/13. Syst Rev. 2013;2:111. doi: 10.1186/2046-4053-2-111. [DOI] [PMC free article] [PubMed] [Google Scholar]
- 19.Whiting PF, Rutjes AW, Westwood ME, Mallett S, Deeks JJ, Reitsma JB, Leeflang MM, Sterne JA, Bossuyt PM QUADAS-2 Group. QUADAS-2: a revised tool for the quality assessment of diagnostic accuracy studies. Ann Intern Med. 2011;155:529–536. doi: 10.7326/0003-4819-155-8-201110180-00009. [DOI] [PubMed] [Google Scholar]
- 20.Zhang P, Zhang H, Li YF, Chen W, Zhang XY, Li HJ. Improved LHS based cumulant method for probabilistic load flow calculation. Acta Energ Sol Sin. 2021;42:14–20. [Google Scholar]


