

Abstract
Objective: Hypertensive intracerebral hemorrhage (HICH) is frequently associated with high disability, high mortality, and poor prognosis. The present study aimed to identify genes associated with HICH to construct prognostic models to improve accuracy in predicting HICH prognosis. Methods: Hub genes were identified by screening out differentially expressed genes from data in the Gene Expression Omnibus database and conducting weighted gene co-expression network analysis. 68 patients with HICH were recruited and categorized based on prognosis. The univariate logistic, least absolute shrinkage and selection operator, and multivariate logistic regression models were then established based on clinical data and the identified hub genes. A prognostic model was constructed based on the nomogram score. The model was validated using receiver operating characteristic curve, C-index, calibration plots, and decision curve analysis. It was also compared to a prognostic model constructed based on clinical data alone. The prognostic value of the nomogram score was assessed in different subgroups. Results: Three hub genes: pro-platelet basic protein (PPBP), PDZ and LIM domain protein 1 (PDLIM1), and metalloproteinase 1 (TIMP1) were identified as significantly correlated to adverse outcomes in HICH. These hub genes, in combination with the clinical data, were used to construct a nomogram score system, which exhibited strong predictive power, excellent consistency between actual outcomes and predictions, and a higher net clinical benefit. HICH patients with high scores presented significantly worse outcome. Importantly, the developed nomogram score system was superior to the use of clinicopathological features in predicting HICH prognosis. The nomogram score system exhibited adequate predictive performance in different subgroups as well. Conclusion: The nomogram score system based on PPBP, PDLIM1, and TIMP1 genes, along with clinical data, exhibited superior performance in predicting adverse outcome in HICH patients. This system could, therefore, be useful for guiding clinical decisions and providing valuable insight for designing individualized treatments for HICH patients.
Keywords: Hypertensive intracerebral hemorrhage, pro-platelet basic protein (PPBP), PDZ and LIM domain protein 1 (PDLIM1), metalloproteinase 1 (TIMP1), prognosis
Introduction
Hypertensive intra-cerebral hemorrhage (HICH) is considered the most severe complication of hypertension in the field of neurosurgery and has a significant impact on the physical abilities and overall quality of life of the affected individuals [1]. The prevalence of HICH is more pronounced among the elderly, slightly more common in males than females, and the incidence of HICH continues to escalate with the progressive aging of society [2]. The conventional treatment for HICH is surgical craniotomy, which renders patients susceptible to postoperative complications such as infection and rebleeding, leading to suboptimal treatment outcome and prognoses [3,4]. Therefore, the effective prevention of HICH and improvement of treatment efficacy, and accurate prognosis evaluation remain key unresolved challenges in clinical practice [5].
The fields of genomics and bioinformatics have seen significant advancement in recent years, leading to the exploration of prognostic markers for diseases using high-throughput sequencing and gene chip technology [6]. This research direction holds immense value as it facilitates the identification of key genes for accurately predicting adverse prognosis in hypertensive intracerebral hemorrhage. In particular, the weighted gene co-expression network analysis (WGCNA) plays a critical role in achieving this objective [7].
Pro-platelet basic protein (PPBP), PDZ and LIM domain protein 1 (PDLIM1), and metalloproteinase 1 (TIMP1) were identified as important hub genes related to HICH in the bioinformatics analysis conducted in the present study. The PPBP gene is a member of the CXC chemokine family of genes. CXC chemokine is secreted by platelets and functions as a potent chemotactic factor and activator for neutrophils. In addition, this chemokine possesses antimicrobial properties and exhibits bactericidal and antifungal activities [8]. PDLIM1 is an actin stress fiber-associated cytoskeletal protein, expressed widely in various tissues, including the heart, gastrointestinal tract, and muscle tissues [9]. TIMP1 is an important member of the tissue metalloproteinase inhibitor family and serves as a natural specific inhibitor of matrix metalloproteinases (MMPs) [10]. In normal brain tissue, a balanced interaction between MMPs and TIMPs is maintained [11]. However, under pathologic conditions, an imbalance occurs between MMPs and TIMPs, which facilitates the development of vasogenic brain edema and secondary brain damage. However, the precise role and predictive value of these three genes in patients with HICH remain uncertain to date.
Methods
Data source and patient selection
The flowchart for this study is shown in Figure 1. The data for this study were obtained from the Gene Expression Omnibus (GEO) database (https://www.ncbi.nlm.nih.gov/geo/). Data on HICH and transcriptome sequencing (RNAseq) were obtained through a thorough search using certain keywords within the GEO database. The screening criteria were as follows: (1) cases of acute primary cerebral hemorrhage were included; (2) cases involving human subjects were included; (3) cases with interventions such as drug administration or surgical procedures were excluded. The study protocols and enrollment conditions were carefully reviewed to gather relevant data, the datasets GSE24265 and GSE125512 were chosen for analysis (Supplementary Table 1).
Figure 1.

Flowchart of this study.
Between October 2021 and June 2023, 75 patients diagnosed with HICH and treated at our hospital were selected to participated in the present study. The patients diagnosed with HICH who were enrolled in the present study met the criteria for HICH outlined in the 2022 Guideline for the Management of Patients with Spontaneous Intracerebral Hemorrhage and required minimally invasive hematoma evacuation [12]. Exclusion criteria for study participation included: (1) secondary intracerebral hemorrhage from arteriovenous malformation, intracranial aneurysm rupture, traumatic brain injury, brain tumor, or hemorrhagic infarction; (2) primary intraventricular hemorrhage; (3) anticoagulant-related intracerebral hemorrhage; (4) refusal to follow-up for clinical assessment. All selected patients received oxygen inhalation, antihypertensive drugs, and other standard therapies. The puncture site on the skull was determined through imaging examinations for each patient. A drainage channel was established by skull puncture, and the intracranial hematoma was gradually aspirated. Some patients received a hematoma liquefier based on their condition. Regular postoperative computed tomography exams were conducted to monitor hematoma removal progress through the drainage tube. All patients received standard blood pressure management and participated in rehabilitation training [13]. The study protocols were approved by the ethical committee of the Qingyang People’s Hospital. Written informed consent was obtained from the guardians of each patient.
Bioinformatic analysis methods
Identification of differentially expressed genes (DEGs)
The LIMMA software package was applied for data normalization and the screening out of DEGs. The accurate identification of DEGs was ensured by establishing the screening criteria of p-value less than 0.05 and |log2FC| exceeding or equal to 1 (where FC denotes the fold change). The identified genes were then visualized in volcano maps and heat maps generated using the R software package.
WGCNA module construction and visualization
The “WGCNA” package was employed to analysis of gene expression patterns in the GSE125512 dataset. Firstly, genes with limited expression dispersion, with a standard deviation (sd) value of less than or equal to 0.7, were removed from the dataset. Subsequently, the “goodsamplegenes” function was applied to reveal any missing values. The pickSoftThreshold function was applied to assess the co-expression networks and obtain the soft thresholds. Importantly, the soft threshold was determined to be 4, and this value represented a greater proximity to a scale-free network. A detailed investigation was then conducted through hierarchical clustering, considering the dissimilarity of TOM. Further, the clinical characteristic data were aligned to the identified modules, and the inherent significance of the genes within these modules was revealed by generating scatter plots illustrating module identity and gene significance. Next, the hub genes were screened through a cross-analysis of the differentially expressed genes obtained from the GSE24265 dataset and the WGCNA analysis results from the GSE125512 dataset.
Modified Rankin scale (mRS) score
The patient’s status was assessed using mRS, which reflects the degree of disability as follows [14]. The mRS scores range from 0 to 5. According to the mRS scores, the patients were divided into two groups: the good prognosis group (mRS ≤ 2) and the poor prognosis group (mRS > 2).
Clinical data of patients
Clinical datasets contain immense clinical information of great value, including details about patient demographics, lifestyle factors, medical history, and specific characteristics related to the cerebral hemorrhage of interest, such as the volume of bleeding, the anatomical location of the hemorrhage, and the admission status of the patient. The data mentioned above were collected within 24 h of disease onset. In the meantime, blood loss was measured through brain computed tomography and magnetic resonance imaging scans, which were also conducted within 24 h of disease onset and then repeated at 4 weeks after treatment.
Neurocognitive function was assessed using the National Institute of Health Stroke Scale (NIHSS) and Glasgow Coma Scale (GCS) within 24 h of disease onset and then at 4 weeks after the treatment [15,16]. The scores on this scale range from 0 to 42, with higher scores indicating further severe nerve damage. The highest GCS score on this scale is 15, indicating clear consciousness, while a score of 8 or less represents a coma. The lowest score on the scale is 3.
Total RNA extraction and qPCR analysis
A total of 68 serum samples (5 mL each) were collected from patients with HICH within 24 h of disease onset. Each serum sample underwent a two-step centrifugation protocol (1,600 g for 10 min at 4°C followed by 16,000 g for 10 min at 4°C). Total RNA was extracted using the RNeasyPlus Mini Kit and 2× SYBR MasterMix in accordance with the instructions provided with the commercial kit. The gene expression levels were determined through a quantitative real-time polymerase chain reaction (qRT-PCR), with glyceraldehyde-3-phosphate dehydrogenase (GAPDH) as the internal control for normalization of the 2-ΔΔCt values [17]. The primers used in the PCR are listed in Supplementary Table 2.
Statistical methods
The R statistical software (version 4.0.5) and Statistical Package for the Social Sciences software (version 23.0; Chicago, IL, USA) were employed for statistical analyses and modeling. Data normality was assessed using the S-W method. Normally distributed data were expressed as mean ± standard deviation. Differences between groups were determined using independent sample t test. Mann-Whitney U test or Wilcoxon signed rank test was conducted for data that did not conform to a normal distribution. The counted data were expressed as numbers (n) and percentages (%). The χ2 test or Fisher’s precision probability test was conducted to compare variables across different groups. The independent risk factors associated with the prognosis of patients were determined through univariate logistic regression, least absolute shrinkage and selection operator (LASSO) regression, and multivariate logistic regression analyses. The rms package was used for the construction of the nomogram model. The accuracy of the nomogram score was assessed through various statistical tools, including the receiver operating characteristic curve (ROC), calibration plot, Harrell’s concordance index (C-index), and Decision curve analysis (DCA). Statistical significance was set at P < 0.05.
Results
Hub gene screening based on the GEO dataset
In GSE24265, 69 DEGs were identified, including 61 upregulated genes and 8 downregulated genes (Figure 2A). In GSE125512, 126 DEGs were identified, including 88 upregulated genes and 37 downregulated genes (Figure 2B). WGCNA requires the selection of a soft-threshold power. Therefore, in this study, the analysis of network topology was conducted for various soft threshold powers using the GSE125512 dataset. As depicted in Figure 2C and 2D, the lowest power at which the scale-free topology fit index reached a value of 0.95 was 16, which was then used for constructing a hierarchical clustering tree. Interestingly, a total of 19 non-grey modules were obtained. We found that the MEpurple module exhibited the strongest correlation to the treatment group (R2q0.43) (Figure 2E-H). Accordingly, the MEpurple module, comprising 484 genes, was selected for further analysis. Three hub genes, namely PPBP, PDLIM1, and TIMP1, were screened out through a cross-analysis of the differentially expressed genes from the GSE24265 dataset and the WGCNA of the GSE125512 dataset (Figure 3A).
Figure 2.

Hub gene screening based on the differentially expressed genes and weighted gene co-expression network analysis of the Gene Expression Omnibus dataset. A: Volcano plot of the differentially expressed genes screened out from the GSE24265 dataset. B: Heatmap of the differentially expressed genes screened out from the GSE125512 dataset. C: Analysis of the mean connectivity for various soft threshold powers. D: Analysis of the scale-free fit index for various soft threshold powers. E: Clustering dendrogram of the genes related to hypertensive intracerebral hemorrhage (HICH). F: Heatmap illustrating the correlation between different modules and HICH (the correlation coefficient and the p-value are presented in each cell). G: Sample clustering performed using the average linkage method and Pearson’s correlation. H: Gene significance for HICH in the purple module.
Figure 3.

Levels of hub genes in hypertensive intracerebral hemorrhage (HICH) patients with different prognoses. A: Hub genes obtained through a co-screening based on differentially expressed genes and weighted gene co-expression network analysis. B-D: The transcription levels of hub genes in HICH patients with different prognoses. vs well prognosis, **P < 0.01, ***P < 0.001. PPBP, Pro-platelet basic protein; PDLIM1, PDZ and LIM domain protein 1; TIMP1, Metalloproteinase 1.
Differences in the expression levels of hub genes among HICH patients with different prognosis
A total of 74 patients diagnosed with HICH were recruited for the study. Among these, 3 patients were excluded from the analysis due to primary ventricular hemorrhage, while three others were excluded because they did not attend follow-up visits at the hospital. Finally, 68 patients with HICH were included in the present study, including 44 males and 24 females. Among them, 51 patients had a history of smoking, 30 patients had diabetes, 27 patients had heart disease, and 41 patients had a history of drinking. The average age of these patients was 63.66±5.47. According to the mRS score, the included HICH patients were divided into the good prognosis group (mRS score = 0, 1, or 2; N = 36) and the poor prognosis group (mRS score = 3, 4, or 5; N = 32).
A comparison of the general clinical data between the two groups revealed that the average age and proportion of males/females in the poor prognosis group were not significantly different compared to those in the good prognosis group (P > 0.05, Table 1). In addition, there were no disparities between the two groups in terms of the prevalence of patients with a smoking history, patients with heart disease, and the location of bleeding (P > 0.05, Table 1). Compared to the good prognosis group, the poor prognosis group presented with higher blood loss and a higher prevalence of diabetes (P < 0.05, Table 1). The PPBP transcription levels in the peripheral blood were significantly higher in patients with poor prognosis compared to those with a good prognosis (P < 0.05, Figure 3B), while the transcription levels of PDLIM1 and TIMP1 in the peripheral blood were significantly lower in patients with a poor prognosis (P < 0.05, Figure 3C and 3D).
Table 1.
Baseline characteristics of the HICH patients
| Characteristic | Good prognosis (N = 36) | Poor prognosis (N = 32) | t/χ2 value | P value |
|---|---|---|---|---|
| Age | 63.36±5.47 | 64±5.55 | 0.478 | 0.634 |
| Gender | 0.433 | 0.614 | ||
| Male | 22 | 22 | ||
| Female | 14 | 10 | ||
| Blood pressure (mmHg) | ||||
| Systolic pressure | 171.45±19.82 | 176.65±29.01 | 0.871 | 0.387 |
| Diastolic pressure | 101.78±8.04 | 98.69±10.98 | 1.334 | 0.187 |
| BMI | 23.56±4.74 | 24.4±3.96 | 0.787 | 0.434 |
| Smoking history | 25 | 26 | 1.259 | 0.401 |
| Drink | 19 | 22 | 0.219 | 1.805 |
| Diabetes | 10 | 20 | 8.285 | 0.007 |
| Heart disease | 16 | 11 | 0.718 | 0.462 |
| LDL-C (mmol/L) | 2.99±0.77 | 2.77±0.72 | 1.212 | 0.230 |
| GLU (mmol/L) | 8.64±3.15 | 9.41±2.69 | 1.077 | 0.285 |
| FIB (g/L) | 3.88±0.77 | 3.96±1.25 | 0.322 | 0.749 |
| Albumin level | 42.36±8.03 | 43.34±6.72 | 0.542 | 0.590 |
| NIHSS score | 11.53±5.96 | 18.38±7.53 | 4.181 | < 0.001 |
| GCS score | 10.33±2.16 | 8.78±2.56 | 2.707 | 0.009 |
| Blood loss (ml) | 76.32±14.35 | 87.01±15.80 | 2.924 | 0.005 |
| Bleeding site | 3.606 | 0.305 | ||
| Basal ganglia | 10 | 15 | ||
| Thalamus | 9 | 7 | ||
| Cerebral cortex | 13 | 6 | ||
| Dura | 4 | 4 |
Note: BMI, Body mass index; LDL-C, Low-density lipoprotein cholesterol; GLU, Blood glucose; FIB, Fibrinogen; NIHSS, National Institute of Health Stroke Scale; GCS, Glasgow Coma Scale.
Logistic regression analysis based on PPBP, PDLIM1, and TIMP1
The univariate logistic regression analysis was conducted using patient clinical data and the three hub genes identified. This revealed that NIHSS score, GCS score, blood loss, prevalence of diabetes, and transcription levels of PPBP, PDLIM1, and TIMP1 were important factors in determining the poor prognosis of HICH patients (P < 0.05, Figure 4A). To address the issue of multicollinearity in genes, these factors were then subjected to the LASSO regression analysis. Interestingly, NIHSS score, GCS score, blood loss, prevalence of diabetes, and transcription levels of PPBP, PDLIM1, and TIMP1 were selected according to the nonzero coefficients, based on the minimum criteria (Figure 4B and 4C). Subsequently, the multivariate logistic regression analysis revealed that NIHSS score, GCS score, blood loss, prevalence of diabetes, and the transcription levels of PPBP, PDLIM1, and TIMP1 significantly influenced the prognosis of HICH patients (P < 0.05, Figure 4D and Table 2).
Figure 4.

Selection of the risk factors associated with outcome in patients with hypertensive intracerebral hemorrhage (HICH). A: Univariate logistic regression analysis of the risk factors associated with outcome in patients with HICH. B: Least absolute shrinkage and selection operator (LASSO) coefficient profiles for the risk factors associated with outcome in HICH patients. C: The risk factors associated with outcome in HICH, selected based on the results of LASSO regression analysis. D: Multivariate logistic regression analysis of the risk factors associated with outcome in patients with HICH.
Table 2.
Results of multivariate logistic regression
| Characteristic | P value | OR | 95% CI down | 95% CI up |
|---|---|---|---|---|
| Diabetes | 0.041 | 0.002 | 1.71E-07 | 0.134 |
| Blood loss | 0.034 | 1.355 | 1.1150424 | 2.151 |
| PPBP | 0.036 | < 0.001 | 9.07E-09 | 0.111 |
| PDLIM1 | 0.017 | 9.79E-05 | 1.58E-09 | 0.023 |
| TIMP1 | 0.031 | 9.29E-05 | 2.58E-10 | 0.055 |
Note: PPBP, Pro-platelet basic protein; PDLIM1, PDZ and LIM domain protein 1; TIMP1, Metalloproteinase 1; OR, Odds ratio.
Construction of a prediction model based on clinical data and hub genes
Multivariate logistic regression models were performed to evaluate the independent risk factors of death from HICH. The results showed that NIHSS score, GCS score, blood loss, prevalence of diabetes, and the transcription levels of PPBP, PDLIM1, and TIMP1 were chosen as independent risk factors to be included in the predictive model for determining adverse outcomes in the patients diagnosed with HICH. The new nomogram score, presented in Figure 5, indicated that these risk factors could assist physicians in the accurate assessment of the prognosis and probability of unfavorable outcomes for HICH patients.
Figure 5.
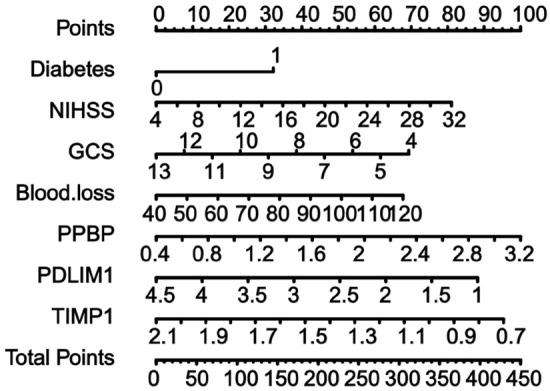
Nomogram for predicting adverse outcome in patients with hypertensive intracerebral hemorrhage based on the multivariate logistic regression analysis.
Evaluation of the accuracy of the constructed prognostic prediction model
The ROC curve, with an area under curve (AUC) value of 0.979, provided evidence that the new nomogram score exhibited excellent discriminatory power in identifying patients with a poor prognosis in HICH (Figure 6A). Harrell’s concordance index (C-index) was determined to be 0.980, indicating a relatively good discriminative capacity of the model. As depicted in Figure 6B, the prediction rate of the constructed prediction model closely matched the actual incidence rate, indicating that the new nomogram score model was well-calibrated. Finally, the DCA was performed to determine the clinical utility of the new nomogram score model. The DCA curve depicted in Figure 6C demonstrated that the new nomogram score was clinically useful.
Figure 6.

Evaluation of the performance of the nomogram score model constructed using hub genes along with clinical data in predicting adverse outcome\for patients with hypertensive intracerebral hemorrhage (HICH). A: The receiver operating characteristic curve for the nomogram score model for the prediction of adverse outcome\in patients with HICH. B: Calibration curves for the nomogram model for predicting adverse outcomes in HICH patients. C: The decision curve analysis curves to assess the clinical utility of the nomogram model in predicting the\prognosis in patients with HICH.
The clinical nomogram score model was constructed using the NIHSS score, GCS score, blood loss, and prevalence of diabetes (Figure 7A). Notably, this clinical nomogram score achieved an AUC value of 0.855, which was lower than the new nomogram score (Figure 7B). Similarly differences were noted in the C-index, with a value of 0.885 for the clinical nomogram score and 0.980 for the new nomogram score. According to the calibration curves depicted in Figure 7C, the calibration of the clinical nomogram score exhibited high consistency between the predicted and actual outcome probabilities. However, the similarities between the actual outcomes and the predicted outcomes were slightly worse for the clinical nomogram score compared to the new nomogram score. Furthermore, the DCA analysis confirmed that the novel nomogram score provided greater clinical net benefit compared to the clinical nomogram score (Figure 7D).
Figure 7.

Evaluation of the performance of the clinical nomogram score constructed based on only clinical data for predicting adverse outcome in patients with hypertensive intracerebral hemorrhage (HICH). A: The clinical nomogram score model constructed based on only clinical data for predicting adverse outcome in patients with HICH. B: The performance of the receiver operating characteristic curve (ROC) for the nomogram score model constructed based on clinical data in predicting adverse outcome in patients with HICH. C: The calibration curves for the nomogram model constructed based on clinical data for predicting adverse outcome in HICH patients. D: The decision curve analysis to assess the clinical utility of the nomogram model constructed based on only clinical data in predicting the prognosis in patients with HICH.
Comparison of post-treatment clinical characteristics of HICH patients in different risk groups
The patients enrolled with HICH were divided into two distinct groups based on the median nomogram score (score = 0.485): a low-risk group (score ≤ 0.485, N = 34) and a high-risk group (score > 0.485, N = 34). Interestingly, as depicted in Figure 8A, the NIHSS score after 4 weeks of treatment was significantly higher (P < 0.05) in the high-risk group compared to the low-risk group. The GCS score, on the other hand, was significantly higher in the low-risk group after 4 weeks of treatment (P < 0.05, Figure 8B). After 4 weeks of treatment, the blood loss in the high-risk group was 52.89±9.39, a value significantly greater than that determined for the low-risk group (32.14±7.30, P < 0.05, Figure 8C).
Figure 8.

Comparison of the post-treatment clinical characteristics among hypertensive intracerebral hemorrhage (HICH) patients at different risks based on predictive models. A: The relationship between the post-treatment National Institute of Health Stroke Scale (NIHSS) scores and risk scores determined using the nomogram score. B: Differences in the Glasgow Coma Scale (GCS) scores between the low-risk group and high-risk group. C: Relationship between post-treatment blood loss and the risk score determined using the nomogram score. VS low-risk, **P < 0.01.
Predictive value of the new nomogram score in the HICH patients with different clinical characteristics
The generated ROC curve revealed that the new nomogram score had relatively high AUC values of 1, 1, 1, and 0.986 for the male cohort, the female cohort, the cohort with age > 63, and the cohort with age ≤ 63, respectively (Figure 9A-D). The corresponding C-index values for these cohorts were 1 (male), 1 (female), 1 (age > 63), and 0.986 (age ≤ 63), respectively, all of which are high values. Interestingly, the calibration plots for the probability of outcomes revealed that the prediction of the nomogram score matched well with the actual observations for the HICH patients with different clinical characteristics (Figure 9E-H). Moreover, the DCA revealed that the nomogram score had clinical utility for HICH patients with varying clinical characteristics (Figure 9I-L).
Figure 9.

Predictive value of the new nomogram score in HICH patients with different clinical characteristics. The performance of receiver operating characteristic curve (ROC) for the newly established nomogram score model in male patients with HICH (A) and female patients with HICH (B). The performance of the ROC curves for the newly established nomogram score model in HICH patients with age > 63 (C) and HICH patients with age ≤ 63 (D). Calibration plot for the nomogram score model for male patients with HICH (E) and female patients with HICH (F). Calibration plot for the nomogram score model for HICH patients with age > 63 (G) and HICH patients with age ≤ 63 (H). Decision curve analysis of the nomogram scores of male patients with HICH (I) and female patients with HICH (J). Decision curve analysis of the nomogram scores of HICH patients with age > 63 (K) and HICH patients with age ≤ 63 (L).
Discussion
The optimal clinical management of HICH has not yet been achieved, and the effectiveness of craniotomy, or craniotomy, and hypertonic drugs in HICH management has not been confirmed [18,19]. Therefore, it is imperative to explore and identify the predictive risk factors for HICH and establish a robust prognostic model.
A reliable predictive model is crucial for accurately determining the prognosis of patients with HICH, as prognosis is typically unfavorable in these patients. Ding et al. developed a prognostic model for patients with HICH by incorporating variables such as cerebral hemorrhage volume, blood glucose level, and D dimer level. The predictive accuracy of their model, indicated by an AUC value of 0.816 (95% CI: 0.760-0.872), required further improvement [20]. Nevertheless, relying solely on data related to HICH characteristics and indicators of routine clinical tests is not sufficient for accurately predicting the prognosis in HICH patients. Considering the complicated pathogenesis of HICH, the results of Liu et al. suggested that incorporating the genes associated with HICH as model variables could enhance the precision of prognostic prediction models for HICH patients [21]. Previous studies have indicated that TIMP-1, PPBP, PDLIM1 are linked to inflammatory reaction [22-26]. In this study, the analysis of DEGs and WGCNA of GEO data revealed three hub genes, namely PPBP, PDLIM1, and TIMP-1, which exhibited a significant correlation to HICH. However, none of these studies have explored the use of these factors as variables in the construction of prognostic models for HICH patients. Therefore, the present study pioneers in proposing the incorporation of PPBP, PDLIM1, and TIMP-1 in the construction of prognostic models for HICH patients.
In this study, HICH patients were categorized into two groups based on their mRS score: the good prognosis group and the poor prognosis group. Interestingly, a significant increase in the transcription levels of PPBP was noted in patients with poor prognosis, while the transcription levels of PDLIM1 and TIMP-1 were significantly decreased in the poor prognosis group. These findings suggest that these hub genes can be used for constructing prognostic models. Accordingly, it was inferred that these indicators may possess predictive value for determining HICH prognosis. Importantly, we found a strong correlation of HICH prognosis with NIHSS score, GCS score, blood loss, prevalence of diabetes, and the transcription levels of PPBP, PDLIM1, and TIMP1. However, unlike in Wang’s research [27], we did not find an impact of age on prognosis. We speculate that this may be due to the small age range of the selected population, making it difficult to show differences. Therefore, the three hub genes PPBP, PDLIM1, and TIMP-1 were used along with the clinical indices to construct a nomogram score for predicting HICH prognosis. A comprehensive analysis revealed that the predictive model exhibited a remarkable level of efficiency and accuracy, indicating the great potential of this model for clinical application. The C-index of the predictive model constructed in the present study was 0.980, which is significantly higher than that of the aforementioned models [28,29]. A clinical nomogram score model was constructed in the present study based on the NIHSS score, GCS score, blood loss, and prevalence of diabetes. The predictive model demonstrates a strong association with both NIHSS and GCS scores, indicating the model’s alignment with established methods for evaluating cerebral hemorrhage. Interestingly, we confirmed that the clinical nomogram score model exhibited a strong predictive ability, similar to the models reported by Hu and Zhang [28,30]. Moreover, identifying the other HICH-related hub genes would assist in developing further accurate models for predicting treatment outcomes in HICH patients.
Since the prognosis of HICH patients is influenced by factors such as bleeding volume and age [31-33], it is imperative to explore the predictive ability of this model in HICH patients with varying clinical characteristics. However, research on gender-specific prognostic factors associated with ICH patients is limited [34]. Therefore, in the current study, the predictive risk model for HICH was applied to a diverse patient population, considering their gender, and a favorable predictive performance was noted in both male and female patients. These results validate the significance of the predictive model constructed in the present study as a crucial tool for managing HICH, while also highlighting its accuracy in predicting prognosis and outcome in HICH patients.
However, the present has some limitations. First, the study relied on data from the public database GEO, which had a relatively small sample size. This could have introduced bias in the univariate analysis of patients with varying prognoses during the construction of predictive models. Moreover, while subsequent clinical cohort studies corroborated the prognostic significance of the three hub genes identified based on differentially expressed genes from GEO datasets, incorporating more genes from different databases would further improve the predictive accuracy of the model. Further, to improve the clinical utility of the prognostic model, it is imperative to incorporate more hub genes relevant to HICH and validate them both internally and externally. This will result in a more refined and broadly applicable prognostic model.
Conclusion
The present study developed a further precise prognostic model for patients with HICH using hub genes (PPBP, PDLIM1, and TIMP1) and clinical data. The prognostic accuracy and effectiveness of the constructed model were robust in patients with HICH. Importantly, the constructed nomogram score system was superior to clinicopathologic features for predicting HICH prognosis. Notably, the predictive model exhibited remarkable predictive capability in HICH patients of different genders and ages. Therefore, this tool may be utilized by healthcare professionals to predict outcome for patients with HICH, guide clinical decisions, optimize the allocation of medical resources, and ultimately deliver optimal treatment.
Acknowledgements
We thank all patients involved in this study. This work is supported by the Gansu Provincial Natural Science Foundation (22JR5RM1044).
Written informed consent from the patient’s guardian have been acquired.
Disclosure of conflict of interest
None.
Supporting Information
References
- 1.Hawkes MA, Rabinstein AA. Acute hypertensive response in patients with acute intracerebral hemorrhage: a narrative review. Neurology. 2021;97:316–329. doi: 10.1212/WNL.0000000000012276. [DOI] [PubMed] [Google Scholar]
- 2.Zhao JL, Du ZY, Sun YR, Yuan Q, Yu J, Wu X, Li ZQ, Wu XH, Xie R, Hu J. Intensive blood pressure control reduces the risk of progressive hemorrhage in patients with acute hypertensive intracerebral hemorrhage: a retrospective observational study. Clin Neurol Neurosurg. 2019;180:1–6. doi: 10.1016/j.clineuro.2019.02.021. [DOI] [PubMed] [Google Scholar]
- 3.Herweh C, Nordlohne S, Sykora M, Uhlmann L, Bendszus M, Steiner T. Climatic and seasonal circumstances of hypertensive intracerebral hemorrhage in a worldwide cohort. Stroke. 2017;48:3384–3386. doi: 10.1161/STROKEAHA.117.018779. [DOI] [PubMed] [Google Scholar]
- 4.Katano H, Nishikawa Y, Uchida M, Yamanaka T, Hayashi Y, Yamada S, Tanikawa M, Yamada K, Mase M. Secular trends and features of thalamic hemorrhages compared with other hypertensive intracerebral hemorrhages: an 18-year single-center retrospective assessment. Front Neurol. 2023;14:1205091. doi: 10.3389/fneur.2023.1205091. [DOI] [PMC free article] [PubMed] [Google Scholar]
- 5.Ruiz-Sandoval JL, Chiquete E, Parra-Romero G, Carrillo-Loza K, Parada-Garza JD, Pérez-Gómez HR, Ochoa-Plascencia MR, Aguirre-Portillo L. Hypertensive thalamic hemorrhage: analysis of short-term outcome. Int J Neurosci. 2019;129:189–194. doi: 10.1080/00207454.2018.1518905. [DOI] [PubMed] [Google Scholar]
- 6.Rego SM, Snyder MP. High throughput sequencing and assessing disease risk. Cold Spring Harb Perspect Med. 2019;9:a026849. doi: 10.1101/cshperspect.a026849. [DOI] [PMC free article] [PubMed] [Google Scholar]
- 7.Zeng J, Lai C, Luo J, Li L. Functional investigation and two-sample Mendelian randomization study of neuropathic pain hub genes obtained by WGCNA analysis. Front Neurosci. 2023;17:1134330. doi: 10.3389/fnins.2023.1134330. [DOI] [PMC free article] [PubMed] [Google Scholar]
- 8.Zhang F, Jiang N, Gao Y, Fan Z, Li Q, Ke G, Li B, Wu Q, Xu R, Liu S. PPBP as a marker of diabetic nephropathy podocyte injury via bioinformatics analysis. Biochem Biophys Res Commun. 2021;577:165–172. doi: 10.1016/j.bbrc.2021.08.087. [DOI] [PubMed] [Google Scholar]
- 9.Dhanda AS, Yang D, Kooner A, Guttman JA. Distribution of PDLIM1 at actin-rich structures generated by invasive and adherent bacterial pathogens. Anat Rec (Hoboken) 2021;304:919–938. doi: 10.1002/ar.24523. [DOI] [PubMed] [Google Scholar]
- 10.Albini A, Gallazzi M, Palano MT, Carlini V, Ricotta R, Bruno A, Stetler-Stevenson WG, Noonan DM. TIMP1 and TIMP2 downregulate TGFβ induced decidual-like phenotype in natural killer cells. Cancers (Basel) 2021;13:4955. doi: 10.3390/cancers13194955. [DOI] [PMC free article] [PubMed] [Google Scholar]
- 11.Niño ME, Serrano SE, Niño DC, McCosham DM, Cardenas ME, Villareal VP, Lopez M, Pazin-Filho A, Jaimes FA, Cunha F, Schulz R, Torres-Dueñas D. TIMP1 and MMP9 are predictors of mortality in septic patients in the emergency department and intensive care unit unlike MMP9/TIMP1 ratio: multivariate model. PLoS One. 2017;12:e0171191. doi: 10.1371/journal.pone.0171191. [DOI] [PMC free article] [PubMed] [Google Scholar]
- 12.Greenberg SM, Ziai WC, Cordonnier C, Dowlatshahi D, Francis B, Goldstein JN, Hemphill JC 3rd, Johnson R, Keigher KM, Mack WJ, Mocco J, Newton EJ, Ruff IM, Sansing LH, Schulman S, Selim MH, Sheth KN, Sprigg N, Sunnerhagen KS American Heart Association/American Stroke Association. 2022 guideline for the management of patients with spontaneous intracerebral hemorrhage: a guideline from the American Heart Association/American Stroke Association. Stroke. 2022;53:e282–e361. doi: 10.1161/STR.0000000000000407. [DOI] [PubMed] [Google Scholar]
- 13.Liu J, Cheng J, Zhou H, Deng C, Wang Z. Efficacy of minimally invasive surgery for the treatment of hypertensive intracerebral hemorrhage: a protocol of randomized controlled trial. Medicine (Baltimore) 2021;100:e24213. doi: 10.1097/MD.0000000000024213. [DOI] [PMC free article] [PubMed] [Google Scholar]
- 14.Ghozy S, Kacimi SEO, Elfil M, Sobeeh MG, Reda A, Kallmes KM, Rabinstein AA, Holmes DR Jr, Brinjikji W, Kadirvel R, Kallmes DF. Transient ischemic attacks preceding ischemic stroke and the possible preconditioning of the human brain: a systematic review and meta-analysis. Front Neurol. 2021;12:755167. doi: 10.3389/fneur.2021.755167. [DOI] [PMC free article] [PubMed] [Google Scholar]
- 15.Roushdy T, Abdel Nasser A, Nasef A, Elbassiouny A, George J, Aref H. A clinical comparative analysis between expanded NIHSS and original NIHSS in posterior circulation ischemic stroke. J Clin Neurosci. 2023;114:77–80. doi: 10.1016/j.jocn.2023.06.006. [DOI] [PubMed] [Google Scholar]
- 16.Mahajan C, Sengupta D, Kapoor I, Prabhakar H, Kumar V, Purohit S, Priya V, Srivastava S, Thakur D, Karnik H, Sati HC, Kalaivani M. Evaluation of the GCS-Pupils Score for PrOgnosis in trauMatic brAin injury- The COMA Study. Brain Inj. 2023;37:1041–1047. doi: 10.1080/02699052.2023.2227943. [DOI] [PubMed] [Google Scholar]
- 17.Wong ML, Medrano JF. Real-time PCR for mRNA quantitation. Biotechniques. 2005;39:75–85. doi: 10.2144/05391RV01. [DOI] [PubMed] [Google Scholar]
- 18.Dotolo S, Esposito Abate R, Roma C, Guido D, Preziosi A, Tropea B, Palluzzi F, Giacò L, Normanno N. Bioinformatics: from NGS data to biological complexity in variant detection and oncological clinical practice. Biomedicines. 2022;10:2074. doi: 10.3390/biomedicines10092074. [DOI] [PMC free article] [PubMed] [Google Scholar]
- 19.Liu CZ, Ye ZH, Ma J, He RQ, Liang HW, Peng ZG, Chen G. A qRT-PCR and gene functional enrichment study focused on downregulation of miR-141-3p in hepatocellular carcinoma and its clinicopathological significance. Technol Cancer Res Treat. 2017;16:835–849. doi: 10.1177/1533034617705056. [DOI] [PMC free article] [PubMed] [Google Scholar]
- 20.Ding W, Gu Z, Song D, Liu J, Zheng G, Tu C. Development and validation of the hypertensive intracerebral hemorrhage prognosis models. Medicine (Baltimore) 2018;97:e12446. doi: 10.1097/MD.0000000000012446. [DOI] [PMC free article] [PubMed] [Google Scholar]
- 21.Liu Z, Zhang R, Chen X, Yao P, Yan T, Liu W, Yao J, Sokhatskii A, Gareev I, Zhao S. Identification of hub genes and small-molecule compounds related to intracerebral hemorrhage with bioinformatics analysis. PeerJ. 2019;7:e7782. doi: 10.7717/peerj.7782. [DOI] [PMC free article] [PubMed] [Google Scholar]
- 22.Chae WJ, Bothwell ALM. Dickkopf1: an immunomodulatory ligand and Wnt antagonist in pathological inflammation. Differentiation. 2019;108:33–39. doi: 10.1016/j.diff.2019.05.003. [DOI] [PMC free article] [PubMed] [Google Scholar]
- 23.Kim IS, Yang WS, Kim CH. Physiological properties, functions, and trends in the matrix metalloproteinase inhibitors in inflammation-mediated human diseases. Curr Med Chem. 2023;30:2075–2112. doi: 10.2174/0929867329666220823112731. [DOI] [PubMed] [Google Scholar]
- 24.Schulz C, Petzold T, Ishikawa-Ankerhold H. Macrophage regulation of granulopoiesis and neutrophil functions. Antioxid Redox Signal. 2021;35:182–191. doi: 10.1089/ars.2020.8203. [DOI] [PubMed] [Google Scholar]
- 25.Lu S, Kong W, Wang S. Exploring the changes of brain immune microenvironment in Alzheimer’s disease based on PANDA algorithm combined with blood brain barrier injury-related genes. Biochem Biophys Res Commun. 2021;557:159–165. doi: 10.1016/j.bbrc.2021.04.014. [DOI] [PubMed] [Google Scholar]
- 26.Huang Z, Zhou JK, Wang K, Chen H, Qin S, Liu J, Luo M, Chen Y, Jiang J, Zhou L, Zhu L, He J, Li J, Pu W, Gong Y, Li J, Ye Q, Dong D, Hu H, Zhou Z, Dai L, Huang C, Wei X, Peng Y. PDLIM1 inhibits tumor metastasis through activating hippo signaling in hepatocellular carcinoma. Hepatology. 2020;71:1643–1659. doi: 10.1002/hep.30930. [DOI] [PubMed] [Google Scholar]
- 27.Wang J, Zhou L, Chen Y, Zhou H, Tan Y, Zhong W, Zhou Z. Prediction of short-term prognosis of patients with hypertensive intracerebral hemorrhage by radiomic-clinical nomogram. Front Neurol. 2023;14:1053846. doi: 10.3389/fneur.2023.1053846. [DOI] [PMC free article] [PubMed] [Google Scholar]
- 28.Hu S, Sheng W, Hu Y, Ma Q, Li B, Han R. A nomogram to predict early hematoma expansion of hypertensive cerebral hemorrhage. Medicine (Baltimore) 2021;100:e24737. doi: 10.1097/MD.0000000000024737. [DOI] [PMC free article] [PubMed] [Google Scholar]
- 29.Vedicherla SV, Foo AS, Sharma VK, Ting EY, Sein Lwin, Chou N, Yeo TT. The “Blush” sign on computed tomography angiography is an independent predictor of hematoma progression in primary hypertensive hemorrhage. J Stroke Cerebrovasc Dis. 2018;27:1878–1884. doi: 10.1016/j.jstrokecerebrovasdis.2018.02.018. [DOI] [PubMed] [Google Scholar]
- 30.Zhang GJ, Wang H, Gao LC, Zhao JY, Zhang T, You C, Wang XY. Constructing and validating a nomogram for survival in patients without hypertension in hypertensive intracerebral hemorrhage-related locations. World Neurosurg. 2023;172:e256–e266. doi: 10.1016/j.wneu.2023.01.006. [DOI] [PubMed] [Google Scholar]
- 31.Zhang K, Wei L, Zhou X, Yang B, Meng J, Wang P. Risk factors for poor outcomes of spontaneous supratentorial cerebral hemorrhage after surgery. J Neurol. 2022;269:3015–3025. doi: 10.1007/s00415-021-10888-w. [DOI] [PMC free article] [PubMed] [Google Scholar]
- 32.Zhu ZY, Hao LF, Gao LC, Li XL, Zhao JY, Zhang T, Zhang GJ, You C, Wang XY. Determinants of acute and subacute case-fatality in elderly patients with hypertensive intracerebral hemorrhage. Heliyon. 2023;9:e20781. doi: 10.1016/j.heliyon.2023.e20781. [DOI] [PMC free article] [PubMed] [Google Scholar]
- 33.Guo R, Yin L, Chen R, Zhou L, You C, Ma L, Li H. Gender differences in characteristics and outcome in primary intraventricular hemorrhage. Curr Neurovasc Res. 2019;16:321–327. doi: 10.2174/1567202616666190906145035. [DOI] [PubMed] [Google Scholar]
- 34.Broberg E, Hjalmarsson C, Setalani M, Milenkoski R, Andersson B. Sex differences in treatment and prognosis of acute intracerebral hemorrhage. J Womens Health (Larchmt) 2023;32:102–108. doi: 10.1089/jwh.2021.0577. [DOI] [PubMed] [Google Scholar]
Associated Data
This section collects any data citations, data availability statements, or supplementary materials included in this article.