Abstract
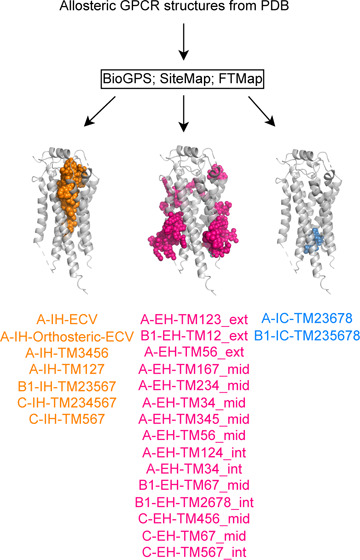
The steadily growing number of experimental G-protein-coupled receptor (GPCR) structures has revealed diverse locations of allosteric modulation, and yet few drugs target them. This gap highlights the need for a deeper understanding of allosteric modulation in GPCR drug discovery. The current work introduces a systematic annotation scheme to structurally classify GPCR binding sites based on receptor class, transmembrane helix contacts, and, for membrane-facing sites, membrane sublocation. This GPCR specific annotation scheme was applied to 107 GPCR structures bound by small molecules contributing to 24 distinct allosteric binding sites for comparative evaluation of three binding site detection methods (BioGPS, SiteMap, and FTMap). BioGPS identified the most in 22 of 24 sites. In addition, our property analysis showed that extrahelical allosteric ligands and binding sites represent a distinct chemical space characterized by shallow pockets with low volume, and the corresponding allosteric ligands showed an enrichment of halogens. Furthermore, we demonstrated that combining receptor and ligand similarity can be a viable method for ligandability assessment. One challenge regarding site prediction is the ligand shaping effect on the observed binding site, especially for extrahelical sites where the ligand-induced effect was most pronounced. To our knowledge, this is the first study presenting a binding site annotation scheme standardized for GPCRs, and it allows a comparison of allosteric binding sites across different receptors in an objective way. The insight from this study provides a framework for future GPCR binding site studies and highlights the potential of targeting allosteric sites for drug development.
1. Introduction
G-protein-coupled receptors (GPCRs) are the largest family of cell signaling transmembrane proteins and are the targets of ∼35% of FDA-approved drugs.1 GPCRs are regulated by diverse small molecules and peptides/proteins. Although most ligands target the orthosteric site, growing evidence has found a range of allosteric modulators binding at distinct sites around the receptors. However, in the absence of an experimental structure containing an allosteric ligand, identifying allosteric binding sites has been challenging due to the diversity in binding modes and protein plasticity upon ligand binding. Recent advances in GPCR structural biology2 are finding allosteric ligands at extracellular, intracellular, or extrahelical sites.3,5 Studying and comparing different binding sites6−8 in various receptors are paramount to understanding the nuances and shared structural features that play a crucial role in ligand recognition and binding.9 Such a comparison can provide insights into the design of novel drugs with different profiles from orthosteric ligands.
Previous works have assessed GPCR ligand binding including allosteric pockets.5,10,11 For example, two studies published in 2022 used computational docking of small molecules5,11 to probe GPCR allosteric pockets.5,11 In Hedderich et al.,5 probes were mapped onto the seven transmembrane GPCR helices. Regions surrounded by elevated densities of docked probes were deemed to be of interest. This work identified 9 putative extrahelical allosteric binding sites along with 4 intrahelical, 12 extrahelical, and 1 intracellular binding site that were known experimentally by the time of the publication. Wakefield et al.11 used FTMap12 to identify pockets for GPCRs by mapping small organic probes around a receptor. The authors reported that FTMap identified binding sites from 21 out of 39 allosteric ligands available in 2020, adding to 6 intrahelical, 2 extrahelical, and 1 intracellular location. Both studies show that GPCR allosteric modulators bind to diverse sites around transmembrane regions, yet there are some hotspots emerging. Rigorous comparison of such published studies is difficult, as the definition of a site is subjective and sometimes not fully described. Therefore, a consistent binding site annotation scheme would provide more transparency on data interpretation and greatly enhance comparison across different studies and methods, including those for future allosteric sites.
To achieve this, we introduce a standardized GPCR binding site annotation scheme. This scheme utilizes a consistent nomenclature to categorize pockets across different GPCR Classes. We applied this scheme to 107 GPCR structures bound by allosteric small molecules contributing to 7 intrahelical, 15 extrahelical, and 2 intracellular allosteric sites, the biggest GPCR allosteric data set analyzed to date from PDB. Next, we evaluated the performance of three pocket detection methods, BioGPS,13−16,21 SiteMap21 and FTMap12 on this benchmark set. To assess the ligand-induced fit effect of those allosteric sites, we compared the allosteric ligand-bound receptor pockets with unliganded forms. Systematic examination showed that some allosteric sites are class- and state-specific. Despite these differences, we identified distinct binding site descriptors and ligand chemical properties that differentiate allosteric sites from orthosteric sites. Lastly, we performed a ligandability assessment17 for three selected allosteric binding sites to evaluate their potential for drug development. In summary, by employing a standardized binding site annotation scheme, we facilitated consistent comparisons between different methods and enabled the characterization of the current GPCR allosteric binding site structural landscape. These insights provide valuable information for the rational design of future allosteric modulators with improved efficacy and selectivity.
2. Methods
2.1. Data Set Composition and System Preparation
There were 107 GPCR structures bound by allosteric ligands from the Protein Data Bank18 as of 21 December 2023. Allosteric ligands are molecules that bind to a specific site on a GPCR, distinct from the primary binding site for its endogenous ligand (orthosteric site) and without any overlap with endogenous ligand atoms. From the 107 allosteric ligand bound structures, we identified 100 structures containing noncovalent allosteric small molecules covering 51 GPCRs from Class A, 18 from Class B1, and 31 from Class C. Classes B2, F, and T were excluded from this analysis because of a lack of experimental structures containing allosteric ligands. The activation state (active and intermediate/inactive) was assigned to the bound GPCR structures based on the GPCRdb19 annotation. The data set consisted of three parts. The first is the GPCR Allosteric Set (PDB) made of 100 structures, of which 63 are unique noncovalent allosteric small molecules. The average resolutions are 2.83 ± 0.42 and 3.14 ± 0.54 Å for structures determined by X-ray crystallography and by cryo-EM, respectively. Second, a Reference Set (PDB) is enumerated to include 348 GPCR structures, and the third is an AlphaFold Set (GPCRdb)20 with 658 state-specific models. The latter two sets cover all available GPCR Class A, B1, and C families. The Reference Set (PDB) encompasses apo structures and ligand-bound structures where the allosteric site remains unoccupied, while the orthosteric site is bound by either a different ligand or the same ligand used in the Allosteric Set. Whenever possible, the Reference structure for each allosteric binding site was chosen to be the highest-resolution structure of the same GPCR in the same activation state. Before any calculation was started, the seven transmembrane regions of all selected structures were aligned to a set of Reference templates selected according to the activation state and subfamily of the receptor. Alignment was conducted using the Schrödinger SKA alignment algorithm (www.schrodinger.com/pythonapi). The structures were prepared using the Schrödinger protein preparation protocol. Missing loops were not remodeled. For each structure, the structurally resolved protein segments were retained, while additional G-protein subunits and the β-arrestin subunit were deleted. Additionally, the bound ligand, cofactors, solvent molecules, and ions were removed. For each GPCRdb AlphaFold model,20 residues that had a pLDDT value lower than 50 were removed.
2.2. Pocket Detection
Pockets from the prepared structures were calculated using the (a) SiteMap21 version 2023-04 (Schrödinger Inc.), (b) BioGPS13−16,21 version 2022-02 and 2023-01 (Molecular Discovery Inc.), and (c) FTMap12 Web server (https://ftmap.bu.edu/). SiteMap21 and BioGPS13−16,21 were run on one Xeon W-2155 CPU @3.30 GHz using a Dell Precision 5820 (64 GB) with Centos 7 as the operating system. The binding site determination was done in the absence of a membrane, and a site was considered as successfully detected if a site point or probe overlapped with the known GPCR allosteric ligand. The details of each of the methods are described below.
-
a)
SiteMap21,22 scans the whole GPCR surface for possible binding cavities. There are three steps involved during SiteMap calculation. The initial step is to define the sites by laying a 1 Å grid across the protein surface and grouping the site locations. Second, the clusters are mapped to another grid to visualize the properties of binding sites. The last stage evaluates the identified site points and mapping grids to determine each location’s druggability score and pocket properties. The default setting generates up to five pockets per system ranked by SiteScore. Besides running SiteMap21,22 with the default settings, it was also run with the protein–protein interaction (--ppi) mode, allowing the detection of shallow binding sites. The runtime of binding site detection and characterization with and without the --ppi mode is 1 min.
-
b)
The BioGPS workflow13−16,21 involves detecting and characterizing pockets followed by calculating 3D similarity. First, the protein is embedded in a three-dimensional grid with a 1 Å resolution. The algorithm identifies pocket points by either geometric features (geo) or an energy-based GRID hydrogen probe (eneg). Second, to compare pockets in terms of their three-dimensional similarity and identify cross-relationships, molecular interaction fields (MIFs) were calculated for all pockets. The shape, hydrophobic/lipophilic interactions, H-bond acceptor, and H-bond donor interactions were calculated using GRID probes H, CRY,23,24 O, and N1, respectively. Finally, the pocket’s MIFs and pocket residues were used as input to return a Glob-Sum similarity score using BioGPS version 2023-01. BioGPS outputs all detectable pockets from a protein with no ranking information provided. The pocket detection takes 10 s to run. The pocket characterization takes 1 min per pocket. Additionally, BioGPS version 2023-01 was used to determine the ligand 3D volume employing a probe radius of 1.8 Å.
-
c)
The FTMap algorithm places molecular probes on a 0.8 Å grid around the protein and finds favorable low-energy probe conformations, which are then clustered. The regions that bind several probe clusters are the predicted hot spots. FTMap writes out all predicted pockets when bound by multiple probes. The GPCR structures were uploaded to the FTMap12 Web servera. For running the site detection algorithm, the default setting and the advanced options (--ppi mode for binding hot spots on protein–protein interfaces) were tested. The runtime of binding site detection for one structure on the Web server is 4 h.
To establish a robust performance benchmark, we prioritized experimentally validated pockets predicted by all three methods for later discussion to establish a reliable baseline for performance evaluation. We proposed a structure-guided approach (Section 2.4) instead to assess the functional relevancy of any predicted pocket, including those not yet experimentally confirmed.
2.3. Analysis of Predicted Pockets
The BioGPS predicted pockets from the Allosteric and Reference Sets and GPCRdb AlphaFold models20 were split by Class with each Class split into active or intermediate/inactive conformations for detailed analysis. The predicted pocket locations, pocket properties (surface and volume descriptors), and corresponding information on Class and protein name were used as input for the postprocessing clustering analysis protocol to assess frequencies of binding at a particular location. The residues in the pocket were renumbered using generic GPCR residue numbers to streamline the comparison. If a site contained residues from two chains, the residues were separated by chain origin to enable alignment to the respective GPCR family. The generic residue numbers were assigned by loading the protein sequence from the PDB structure, running global sequence alignment with the GPCRdb residue sequenceb, and mapping the generic residue number from GPCRdb19 onto the residue number of the PDB. A blank is inserted for non-natural amino acids, and if no generic residue number is found, the protein segment is mapped onto the position. Clustering based on these generic residue numbers ensured a standardized annotation of binding sites detected among the GPCR structures and models. Specifically, a binary matrix is computed from the generic residue numbers that indicate if the position was within the ligand site (1) or not (0). The matrix was used as input for the python package clustermap, which performs hierarchical clustering using average-linkage and Jaccard as the distance metric. Average-linkage computes the distance between each pair of observations in each cluster and is added up and divided by the number of pairs to get an average intercluster distance. The Jaccard distance is the proportion of the elements of a vector that disagree. A distance threshold of 0.75 nm was used to distinguish different clusters. For each cluster, the generic residue numbers that were present in two-thirds of the cluster pocket members were retained and used to assign to the respective site to the cluster in the output file. Additionally, the GPCR structures were aligned to the Orientations of Proteins in Membranes (OPM) database25,26 (https://opm.phar.umich.edu), allowing for the determination of their relative positions of the binding site with respect to the cellular membrane. In more detail, the z coordinate from the upper and lower membrane boundaries and the pocket c-alpha residue is extracted. If the z value of the pocket c-alpha is larger than the membrane’s outer boundary, it is set to 11; if it is smaller than the membrane’s inner boundary, it is set to −11. The values in between are normalized by dividing the z coordinate of the pocket c-alpha by the membrane’s inner boundary and multiplying with 10. The average of all pocket residues’ c-alpha normalized values is taken to determine the relative position of the extrahelical sites. If the value is larger than 5 and smaller than 11, it is exterior (ext); if it is smaller than or equal to 5 and larger than and equal to −5, it is middle (mid); and if it is smaller than −5 but larger than −11, it is interior (int). If a bound ligand falls between two pockets, the pocket with the shortest center-of-mass distance measured between the ligand and the pocket is assigned to be the ligand bound pocket. For ligand-bound pockets, information regarding its ligand, activation state, allosteric ligand function, and location is added. The procedure uses a pocket-first approach to annotate the ligand pockets. In theory, this approach can also be used for a ligand-first approach, where the pocket residues within 4 Å are used to determine the generic residues and subsequence sublocation.
2.4. Ligandability Assessment
To evaluate the ligandability of predicted allosteric pockets, we used a ligand-based approach followed by a pocket-based approach. The ligand-based method assesses the similarity between bioactive compounds and bound allosteric ligands with structurally resolved binding modes, serving as an initial hypothesis for binding sites. We collected compounds with a pActivity ≥5 from GtoPdb,27 ChEMBL,28,29 and REAXYSc for each GPCR and calculated similarity against structurally resolved allosteric ligands (PDB). Duplicate compounds were removed by retaining the most potent entry. Compounds were clustered using single-linkage clustering based on a 0.40 cutoff for Tanimoto similarity of ECFP4 fingerprints (RDKit30); within these clusters, subsequent clustering at a cutoff of 0.60 and then 0.75 was carried out. This clustering approach is similar to that described in Vass et al.17
The GPCRs bound by those bioactive compounds identified above were then submitted for pocket comparison with the structurally resolved allosteric ligand complex. This step allowed us to visually assess any potential clashes that might hinder ligand binding. Next, the sequence of the binding site residues was aligned to identify crucial conserved features that are essential for ligand interaction. This analysis provided valuable insights into the binding site’s structural and functional characteristics. The pocket similarity was assessed using the BioGPS virtual pocket screening approach (Section 2.2 (b)).
3. Results
3.1. GPCR Binding Site Annotation
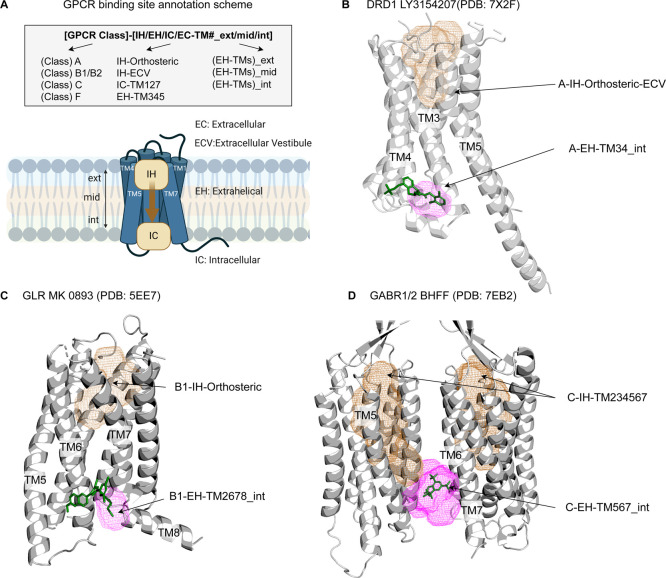
To navigate through the GPCR pocketome, we introduced an annotation scheme for naming GPCR binding sites clearly and meaningfully. The name of a binding site consists of the GPCR Class, the location (IH: intrahelical EH: extrahelical, IC: intracellular, and EC: extracellular with respect to transmembrane (TM) helices), and the binding site location with respect to the membrane (ext: exterior, mid: middle, and int: interior) (Figure 1). The membrane position is added only for extrahelical binding sites. If the intrahelical site extends beyond the vertical membrane boundary (as defined by the OPM25,26 database), the IH is supplemented with ECV, the extracellular vestibule. For example, the LY3154207 ligand, which binds to the Class A D1 receptor (DRD1) at the EH site between TMs 3 and 4 near the intracellular end, is classified as binding at site A-EH-TM34_int. The Class A orthosteric site, if extending into the extracellular vestibule, is annotated as A-IH-Orthosteric-ECV. The nomenclature provides human-interpretable names that unambiguously identify a binding site and allows for the combination of sites for ligands that span multiple pockets. Figure 1 illustrates the binding site annotation with selected examples of classes A, B1, and C.
Figure 1.
GPCR binding site annotation scheme illustrated with examples. (A) GPCR binding site annotation starts with GPCR Class (A, B1, C) followed by position with respect to the transmembrane domain (EC: extracellular, IH: intrahelical, ECV: extracellular vestibule, IC: intracellular, and EH: extrahelical). For extrahelical binding sites, the annotation is tagged with membrane position along the vertical axis (ext: exterior, mid: middle, or int: interior). (B) Two pockets shown for D1 receptor (DRD1, PDB: 7X2F) in ribbon with the positive allosteric modulator LY3154207 in sticks (green) binding to the A-EH-TM34_int pocket (pink) and the endogenous ligand binding site A-IH-Orthosteric-ECV (brown mesh). (C) Selected pockets for the glucagon receptor (GLR, PDB: 5EE7) shown in ribbon with the allosteric antagonist MK 0893 in sticks (green) occupying the B1-EH-TM2678_int pocket (pink) and the endogenous ligand binding site B1-IH-Orthosteric shown as brown mesh. (D) Selected pockets for GABAB receptor 1/2 heterodimer (GABR1/2, PDB: 7EB2) in ribbon and the positive allosteric modulator BHFF binding to C-EH-TM567_int (pink) and the allosteric site C-IH-TM234567 shown as brown mesh. For Class C, the endogenous ligand binding site is at the Venus flytrap region;31 therefore, we spell out the TMs of the intrahelical site C-IH-TM234567.
3.2. Quality and Diversity of the Present Allosteric Data Set
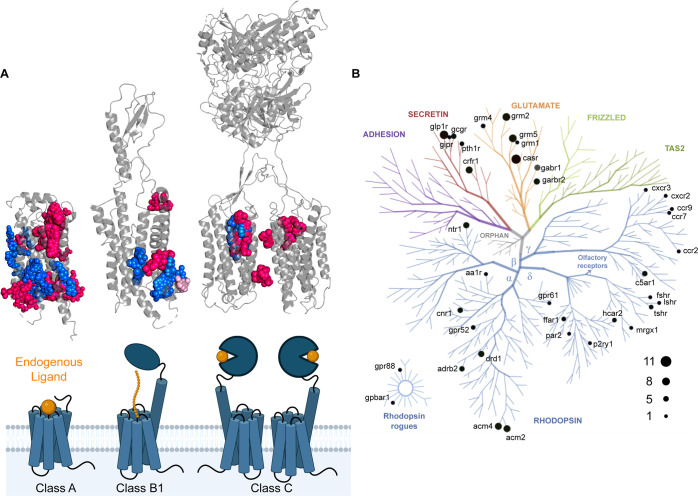
Currently, there are 217 GPCR structures bound by FDA-approved small-molecule drugs (Figure S1). Among these, the majority are orthosteric binders with allosteric drugs contributing to a smaller fraction. There are three FDA-approved allosteric drugs targeting GPCRs known today, namely, the allosteric antagonist avacopan32 binding to complement C5 receptor at A-EH-TM345_mid and the positive allosteric modulators cinacalcet and evocalcet,33−36 which bind at the intrahelical site, C-IH-TM234567, of the calcium sensing receptor. Allosteric binders are unique in that they modulate the activity of the receptor without directly interacting with the receptor’s primary binding site (Figure 2A). Our data set of 100 GPCR structures complexed with allosteric small molecules covers 63 distinct allosteric small molecules binding at diverse locations including extracellular vestibule, extrahelical, intracellular, and intrahelical sites or at the dimer interface. The Class-specific overlays highlight that some binding sites are more common than others (Figure 2A). For example, the A-EH-TM345_mid site is shared by many ligands with differing modalities. On the other hand, the A-ECV site is targeted only by allosteric agonists/positive allosteric modulators (AlloAgos/PAMs). ICL2 appears to be a hotspot for Class A PAMs with their interaction being crucial for stabilizing the active receptor conformation.37 For Class B1, the area along EH-TM6 is targeted by multiple ligand modalities and additionally covalent small molecules. The intrahelical and dimer interface site is the most common allosteric site for Class C. Despite a wealth of identified allosteric binding sites on GPCRs, the number of FDA-approved allosteric drugs targeting these sites remains disproportionately low. Understanding what drives allosteric binding may improve drug design processes when targeting those sites clinically. Therefore, we set out to characterize GPCR allosteric binding sites using BioGPS, FTMap, and SiteMap to identify descriptors that differentiate allosteric site binders from orthosteric binders to evaluate the ligandability of new candidate sites prospectively.
Figure 2.
Overview of allosteric small molecule bound GPCRs (PDB as of December 20, 2023). (A) Schematic of Class A, B1, and C with the endogenous ligand binding site in orange and Class-specific overlay of GPCR ligands highlights the diversity and popularity of targeted allosteric binding sites. Modulators that activate or inhibit GPCR activity are colored in pink or blue, respectively. The covalent ligands are colored light pink. (B) Phylogenetic GPCR tree shows the number of publicly available structures per GPCR family.
3.3. Structure-Based Pocket Detection by BioGPS, FTMap, and SiteMap
BioGPS, FTMap, and SiteMap predicted average numbers of 10.9, 12.0, and 4.6 pockets per GPCR allosteric structure, respectively. Specifically, SiteMap’s output is capped at five predicted sites/pockets per structure, deliberately limiting noisy prediction. On the other hand, BioGPS and FTMap generate a variable number of pockets that can be influenced by receptor size (Section 2.2). This explains the higher number of predicted pockets observed for a larger GPCR Class C by BioGPS and FTMap (Table S3). Yet, the number of sites suggested by BioGPS and FTMap per system remains moderate. All together, the presented detection of relevant allosteric sites is unlikely due to indiscriminate generation of numerous pockets. The exact number of predicted pockets for each PDB code is detailed in the Supporting Information (Table S3).
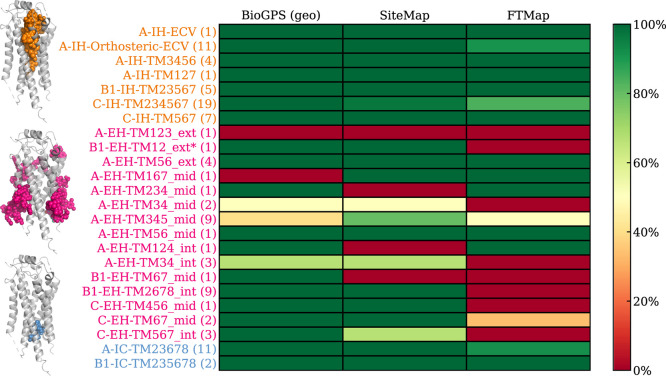
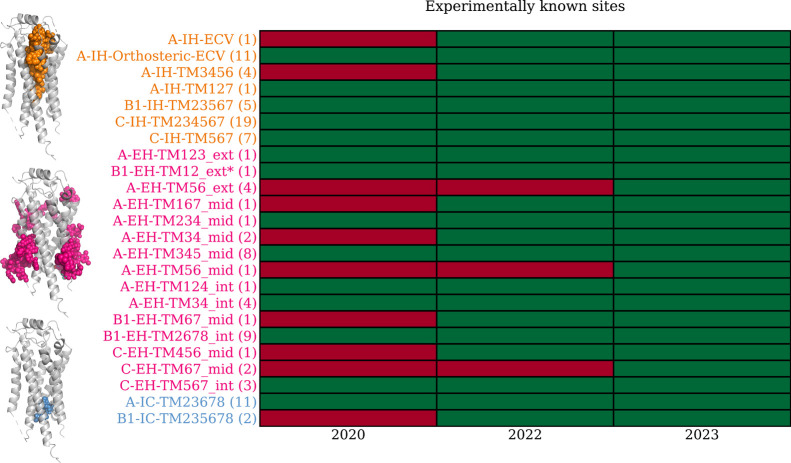
Focusing on the 24 unique allosteric sites (14 for Class A, 5 for Class B1, and 5 for Class C; Figure 3 and Figure S2), BiGPS (geo) identified 22 out of 24, closely followed by SiteMap (default) with 20 correct predictions. Although SiteMap (ppi) identified all 24 binding sites (Figure S2), its usage is not recommended as the prediction generates overly extended, nonspecific pockets (Figure S6), hence its apparent high prediction success. All detection methods were able to identify allosteric ligands that bind to the deep intrahelical site of Class A-IH-TM3456 or the intracellular binding sites, such as A-IC-TM23678 and B1-IC-TM235678. However, the performance of pocket detection for extrahelical sites varied. The shallow pocket located at A-EH-TM123_ext proved to be a particularly challenging site with most methods. We also observed the method dependency on prediction success. For instance, BioGPS could not detect A-EH-TM167_mid and A-EH-TM345_mid sites, whereas SiteMap failed to identify sites at A-EH-TM124_int. A-EH-TM234_mid and B1-EH-TM67_mid. FTMap struggled with detecting sites at the Class C dimer interface, which was well predicted by BioGPS and SiteMap. In conclusion, at their default settings, BioGPS and SiteMap can detect 92 and 84% of the allosteric binding sites, respectively, while FTMap achieves only a 62% success rate.
Figure 3.
Allosteric binding site detection by BioGPS, SiteMap, and FTMap. The site detection is considered successful if the bound ligand is partially covered by the predicted pocket. The performance heatmap is green (100%) if a method detected a binding site retrospectively in all structures (numbers in the parentheses). The binding sites are sorted vertically by their location within the receptor: intrahelical (IH), extrahelical (EH), and intracellular (IC) binding sites are highlighted in orange, pink, and blue, respectively. The location specific ligands illustrated on the left are shown in the matching colors. The total number of ligands is 101 instead of 100 as PDB: 8JD5 has two allosteric ligands binding at C-IH-TM234567 and C-EH-TM67_mid, respectively. *For GLP1R (PDB: 6VCB), the allosteric ligand binding pocket predicted by BioGPS (geo) and SiteMap was part of B1-IH-Orthsoteric (Figure S3). Therefore, the ligand-based pocket name B1-EH-TM12_ext* was manually assigned. This will carry over to subsequent figures.
Beyond the analysis of structurally validated allosteric sites, we explored the novel pockets identified in our study. To establish a comparative benchmark, we first compared these sites to the nine orphan allosteric sites reported by Hedderich et al.5 Notably, all nine orphan sites were predicted independently by BioGPS and SiteMap (Table S4). Like Hedderich et al.,5 our study aims to identify allosteric binding sites, but our study leveraged a larger allosteric data set and different methodologies. Thus, our work identified an additional 11 extrahelical sites, 4 of which were supported by experimental structures such as EH-TM124_int and EH-TM456_mid (Table S5). These findings underscore the potential of computational methods to uncover previously uncharacterized allosteric binding sites, expanding the ligandable space for GPCRs.
The remainder of the review will focus on the pockets detected by BioGPS (geo) for further analysis.
3.4. Input Structure Dependency on Allosteric Binding Site Detection
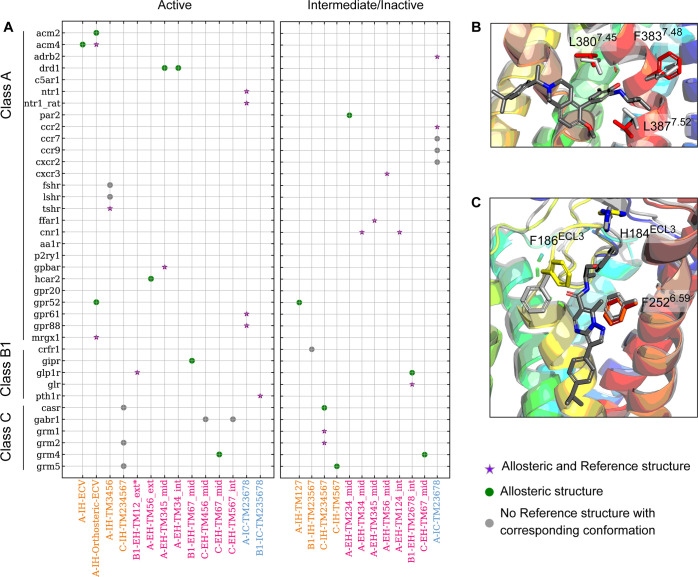
To assess whether there is any induced-fit effect of the observed allosteric binding sites, the allosteric structural data set was compared with Reference structures that represent the same receptors but without the allosteric ligand bound (either apo or only orthosteric ligand-bound from PDB). A total of 33 unique GPCR–site combinations were assessed, covering the sites detectable by BioGPS and having a Reference structure in the corresponding activation state. From the 33 systems, 58% of the allosteric binding sites could be detected with the Reference structures. For the allosteric structures ligands binding to inactive GPCR conformations, 60% can be detected in the Reference set, suggesting that 40% of those allosteric sites are results of ligand-induced effects or failure of the method to detect the pocket (Figure 4). The trend is similar for the active conformations with 56% detected in the Reference set, missing 44% of these active-state allosteric sites. The ligand-induced effect on the binding site formation is particularly pronounced with extrahelical sites from the active-state receptor, as five out of six were not detected among the Reference structures. Figure 4 shows two examples of extrahelical sites identified only in the Allosteric data set in the active conformation of GIPR and HCAR2. For GIPR, the orientation of F3837.48b differs in the two experimental structures (PDBs: 7RBT, Allosteric and 7DTY, Reference) and is required to rotate to accommodate a bound ligand. Similarly, a compulsory conformational change of F186ECL3 is also observed in HCAR2 (PDBs: 8J6P, Allosteric, and 8IHP, Reference) upon ligand binding. Interestingly, the induced-fit effect is much less pronounced with the extrahelical sites from the inactive state of the receptors, as only three out of eight of these were not detected in the corresponding Reference structures. This trend suggests that the extrahelical sites in the active conformation are potentially more prone to the ligand-induced effect.
Figure 4.
The detection outcome of GPCR binding sites depends on the starting conformation and the allosteric site. (A) Map of allosteric binding sites located at intrahelical (orange), extrahelical (pink), or intracellular (light blue) versus the GPCR families with known ligand bound experimental structures. If a binding site is detected only in the Allosteric structure, it is represented by a green circle. If it is also found in the Reference structure, it is represented by a purple star. If no Reference structure with matching activation state to the Allosteric structure is available, it is represented as a gray circle. (B) GIPR and (C) HCAR2 are two examples where ligand-induced conformational change is noted for pocket identification. The Allosteric structures are in rainbow, and the Reference structures are in gray.
We performed the same analysis on available GPCRdb-AlphaFold20 models where protein models were built in the absence of ligands. In total, 70% of the known allosteric ligand binding sites were present in the GPCRdb-AlphaFold20 models, with 79% being present in the inactive and 60% in the active conformation. For extrahelical sites, five out of six sites are not present in the active models, whereas three out of eight are not detected in the inactive GPCRdb-AlphaFold20 models. The trends at the extrahelical sites for detection are consistent with the Reference set. The A-IC-TM23678 site could be identified in the GPCRdb-AlphaFold20 models (Figure S4) in the absence of relevant experimental Reference structures. While these results cannot directly confirm or disprove a ligand-induced effect on the binding pocket, they do suggest that the identification of extrahelical sites in GPCRdb-AlphaFold20 models is challenging, especially in the active conformation.
3.5. Frequency of Allosteric Sites and Their Binding Site Properties
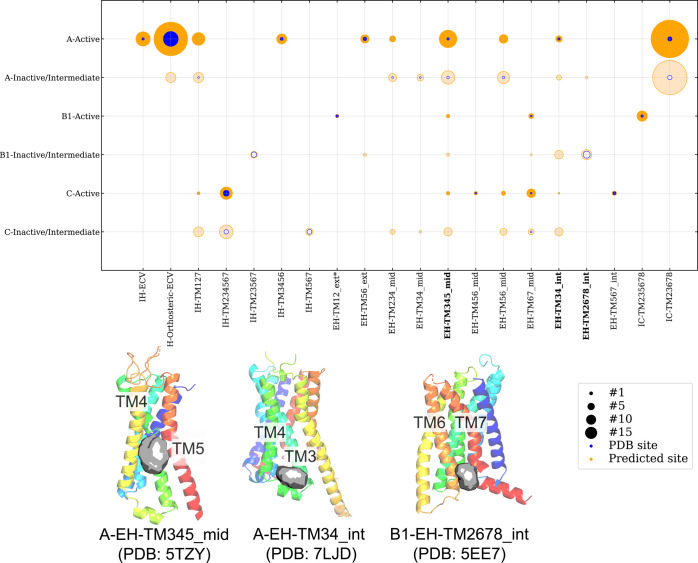
Analysis of the Allosteric data set clearly showed that there are preferred allosteric sites in GPCRs (Figure 2 A). A more detailed analysis of the allosteric sites was performed and stratified by Class and activation state (Figure 5). Not surprisingly, BioGPS successfully predicted well-represented intrahelical orthosteric sites (IH-Orthosteric and IH-Orthosteric-ECV) for Class A and B1 at both activation states. Pockets at EH-TM2678_int were identified only in the inactive state. The B1-EH-TM2678_int binding site, where glucagon like receptor 1 (GLP1R) allosteric antagonists stabilize TM6 in the inactive state, was also detected in Class A inactive/intermediate sites, although at a much smaller fraction. A-EH-TM34_int and A-EH-TM345_mid, on the other hand, are not specific to a particular activation state, and pockets are present across most Classes. Our analysis indicates that certain allosteric sites appear to be selective, while others are present across the GPCRome.
Figure 5.
Distribution of BioGPS (geo) predicted pockets across different GPCR Classes and conformation states. The pockets are sorted horizontally with intrahelical (IH) shown first followed by extrahelical (EH) and intracellular (IC). The size of the circles in the diagram indicates the frequency of pocket detection at the respective site in the respective Class/state, i.e., active or inactive/intermediate. Putative sites are marked in orange, while known sites from the PDB are marked in blue. Below the diagram are examples of four predicted sites (gray surface) with GPCRs shown in ribbons. The A-EH-TM345_mid site of FFAR1 (PDB: 5TZY) is detected in several Classes and both the active and inactive/intermediate states. The PAM binding site at A-EH-TM34_int for the D1 receptor (PDB: 7LJD) is also predicted in several Classes and both active and inactive/intermediate states. However, the allosteric antagonist binding site B1-EH-TM2678_int in the GLR (PDB: 5EE7) is present only in the inactive/intermediate state. No evaluation can be made for the known allosteric sites A-EH-TM123_ext and A-EH-TM167_mid, as these were not identified with the default setting of BioGPS (geo).
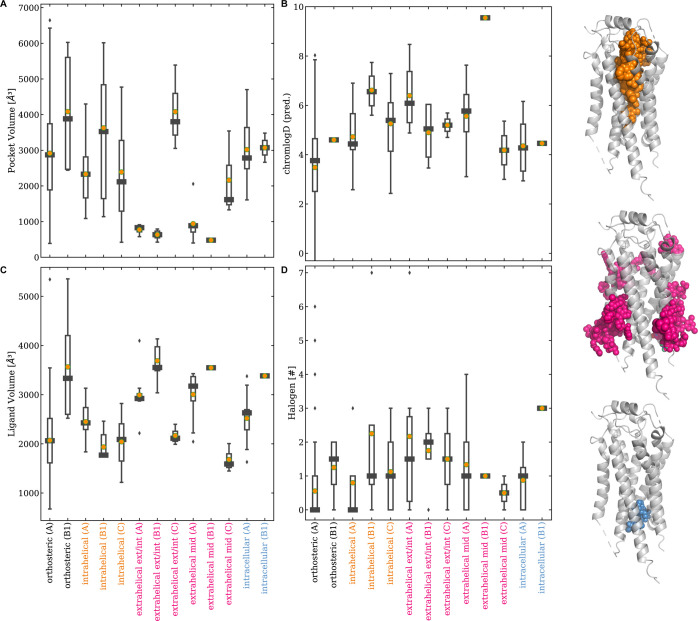
Next, we examined the binding site and ligand properties in Figure 6, and binning allosteric ligands by their binding location shows distinct trends in calculated properties. The binding site volumes for intrahelical and intracellular allosteric ligands are on par with the canonical orthosteric sites (Figure 6A; orthosteric: 3500 ± 1522 Å3, intrahelical: 2783 ± 1321 Å3, intracellular: 3046 ± 752 Å3). In contrast, extrahelical allosteric ligands represent a distinct space characterized by low pocket volume (1512 ± 632 Å3) (Figure 6A). In addition, extrahelical ligands on average demonstrate a significantly higher chromlogD value (6.0 with p < 0.000005, Figure 6B) and a greater number of halogens (1.4 with p < 0.05, Figure 6D) than orthosteric ligands (chromlogD of 4.0 and 0.9 halogen, respectively). In addition to binding site volume, ligand 3D volume was generated based on the bound conformation (Figure 6C). Comparing both types of volumes (Figure 6A,C) for the extrahelical sites suggests that a large portion of many extrahelical ligands is interacting with the membrane environment, as the ligand 3D volume (2847 ± 345 Å3) is almost twice as much as the corresponding binding site volume. On the other hand, the ligand 3D volume is in line with the binding site volume for intrahelical and intracellular ligands, suggesting a more buried or shielded nature of those binding sites (Figure 6C; orthosteric: 2818 ± 922 Å3, intrahelical: 2143 ± 384 Å3, intracellular: 2951 ± 268 Å3). To note, this analysis was performed only with pocket volumes, as pocket volumes and pocket surfaces highly correlate (data not shown).
Figure 6.
Box plots of binding site and ligand properties. Shown are (A) the calculated binding pocket volume and ligand properties in (B) calculated chromlogD, (C) ligand 3D volume (Å3) based on the bound conformations, and (D) the number of halogens. The binding sites are sorted horizontally and colored by location: intrahelical (in orange), extrahelical (in pink), and intracellular (in blue) for Class A, B1, and C, respectively. The median is shown as a black square, and the mean is shown as an orange dot. A breakdown of the number of ligands for each binding site location can be found in Supporting Information Table S8. Refer to Supporting Information Tables S6 and S7 for a more detailed Class-specific breakdown of descriptor values. The pocket volumes of GLP1R (PDB: 6VCB and 6X19) and of FFAR1 (PDB: 5TZY and 5TZR) were not included as their orthosteric site merged with allosteric (extrahelical) pockets (see Figure S3).
Fluorine is a versatile element that can substitute various atoms and functional groups that can affect a molecule’s polarity and lipophilicity.38,39 This was highlighted with our finding that an enrichment of halogens was found in the extrahelical-exterior, -mid, and -interior sites (Figure 6D). We found chlorine more frequently at the exterior and interior extrahelical sites of GPCRs. In summary, extrahelical sites differ from intrahelical and intracellular sites due to the size and the shallowness, which make them more challenging to target and require consideration in ligand design.
3.6. Validation of Predicted Allosteric Sites
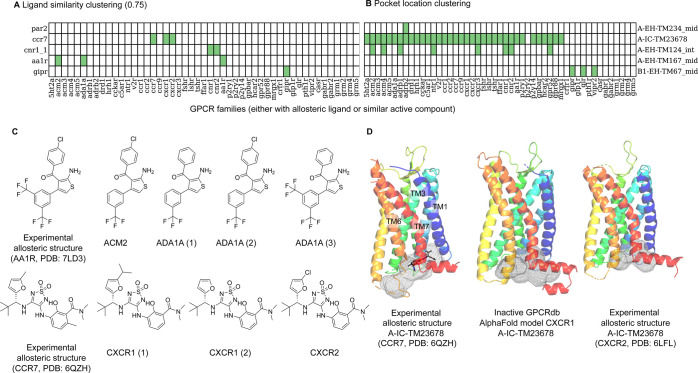
After predicting allosteric sites, we used ligand- and pocket-based approaches to scope out the functional relevance of predicted allosteric pockets. The ligand-based approach analyzes the similarity between the bound allosteric ligands and all of the bioactive GPCR compounds reported in the literature. If a compound has high similarity with the bound allosteric ligands, the hypothesis is that such a compound may share similar binding pharmacophores (i.e., binds to the same allosteric site). The pocket-based approach assesses the presence or absence of experimentally observed allosteric sites across the GPCRome and calculates the binding site similarity of those GPCRs that may share the same allosteric sites. Panel A from Figure 7 shows selected examples of the ligand clustering results (for a full overview, see Figure S11). For each bound allosteric (query) ligand on the left Y axis, positive retrieval of similar bioactive compounds from nonquery GPCRs are recorded in green. For instance, the AA1R-bound allosteric ligand is similar to ACM2- and ADA1A-bioactive compounds, while the CCR7-bound allosteric ligand is similar to CXCR1- and CXCR2-bioactive compounds (Figure 7C). We then check the site presence or absence for those nonquery GPCRs that have bioactive compounds similar to the bound allosteric (query) ligand (Figure 7B; for full a overview, see Figure S11). The hypothesis is that if a similar compound is identified in the ligand-based approach, it can only bind to the nonquery GPCR if the same pocket was detected. We observed that pockets of the known allosteric GPCR ligand are identified for many GPCRs that have similar active compounds. One example is A-IC-TM2678 that is bound by a CCR7 allosteric antagonist and can also be found in CXCR1 and CXCR2 (Figure 7B,D). This therefore indicates a binding site hypothesis for the similar active compounds from CXCR1 and CXCR2. Moreover, the pocket-based approach suggests more GPCRs with a pocket at the identical location to the known allosteric ligand. To assess the ligandability of these potential pockets, we calculated the 3D similarity of the query and nonquery pockets. The following section will focus on a more detailed assessment of the ligandability of the following three extrahelical sites: A-EH-TM124_int, A-EH-TM234_mid, and B1-EH-TM67_mid.
Figure 7.
Ligandability analysis using ligand- and pocket-based approaches for selected cases. (A) The heatmap indicates the identification of bioactive compounds (pActivity ≥5 for each GPCR listed horizontally) similar to the bound allosteric ligand listed by the binding site name shown vertically alongside the bound GPCR (similarity ≥0.75). Green: found; white: no similar bioactive compounds other than to itself. Please refer to Table S2 for more information. (B) The heatmap shows if a pocket is detected (in green) for the GPCRs either with known bound allosteric ligands or having similar active compounds as the allosteric GPCR ligand. Sites that were not detected by BioGPS (geo) are colored white. (C) Bioactive compounds similar to the bound AA1R and CCR7 allosteric ligands retrieved by similarity clustering. (D) The experimentally known allosteric binding site A-IC-TM23678 (gray mesh) of CCR7-Cmp2105 (gray sticks, PDB: 6QZH) can also be detected in the inactive CXCR1 GPCRdb-AlphaFold20 model and CXCR2 structure (PDB: 6LFL) (gray mesh).
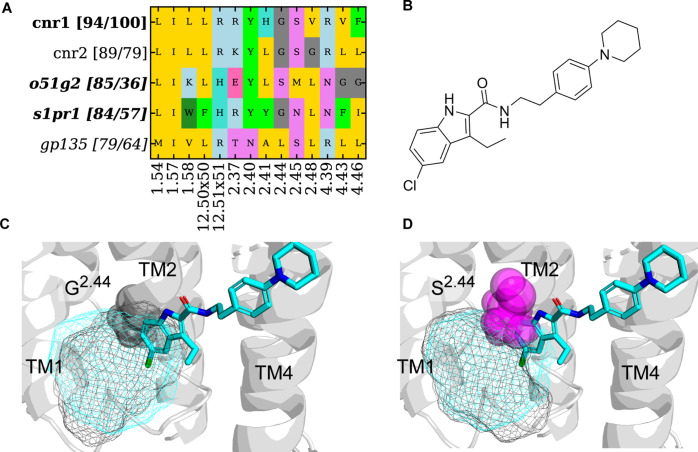
The first case study is the extrahelical site A-EH-TM124_int in Class A GPCRs. ORG2756940,41 is a selective negative allosteric modulator (NAM) of the CNR1 receptor, which binds to the A-EH-TM124_int site via interactions with G1572.44 and V1612.48. This binding site sits above F2374.46 that rotates outward upon CNR1 activation. The presence of ORG27569 blocks the outward rotation of F2374.46, thereby exerting its NAM effect by trapping the inactive receptor conformation. A-EH-TM124_int site formation is also suggested to have little induced-fit effect (Figure 4). Figure 8 summarizes the pocket-based similarity assessment of A-EH-TM124_int from CNR1. First, CNR2 (PDB: 5TZY) has bioactive compounds similar to ORG27569 (Figure 7 A) and additionally has the highest pocket sequence similarity (79%, Figure 8) corresponding to 89% of 3D binding site similarity compared to CNR1. Outside of the cannabinoid family, the pockets with the highest binding site similarity were found for the inactive GPCRdb AlphaFold model20 of sphingosine 1-phosphate receptor (S1PR1) and of olfactory 51G2 receptor (O51G2), namely, 84, and 85%, respectively. Even though GP135 has a higher pocket residue sequence similarity, namely, 64%, compared to S1PR1 and O51G2 (57 and 36%), the binding site similarity is lower (79%). This shows that residue sequence similarity and binding site similarity do not necessarily correlate. A closer analysis of the binding pocket suggests that G2.44 is critical to maintain a hydrophobic pocket and can be found in CNR1, CNR2, and S1PR1 (Figure 8C). In O51G2 (Figure 8D) and GP135, the G2.44 is mutated to bigger residues, which eliminates the binding site. S1PR1 may be the most promising target for follow-up analysis because the G2.44 hydrophobic pocket is conserved. However, attention must be drawn to the fact that F2374.46 is present only in CNR1, which is of functional relevance. Previous mutation studies showed that F2374.46L increased agonist affinity.41 Therefore, the position 4.46 variation may be a concern to repurpose ORG27569 to other GPCRs.
Figure 8.
Binding site analysis for pockets identified at A-EH-TM124_int with the highest binding site similarity and/or pocket residue sequence similarity. (A) Pocket composition from CNR1 (query) and similar receptors on the vertical axis. For each similar receptor, two similarity values are shown in the bracket. The first number is the average binding site 3D similarity to the query structure (CNR1, PDB: 6KQI). The second number is the sequence similarity of residues in the A-EH-TM124_int binding pocket. GPCR families where only pockets from the GPCRdb AlphaFold model20 were identified are in italics. (B) Ligand 2D structure of ORG 27567. (C) Pocket overlay of CNR1 (ribbon, PDB: 6KQI, cyan mesh) and inactive S1PR1 (black mesh) of GPCRdb AlphaFold models.20 S1PR1 retains the G2.44 and has the potential for ligand repurposing from CNR1 due to the accessibility of the pocket. (D) Pocket overlay of CNR1 (ribbon, PDB: 6KQI, cyan mesh) and inactive O51G2 (black mesh) of GPCRdb AlphaFold models.20 The residues and S2.44 (O51G2) clash with the ligand.
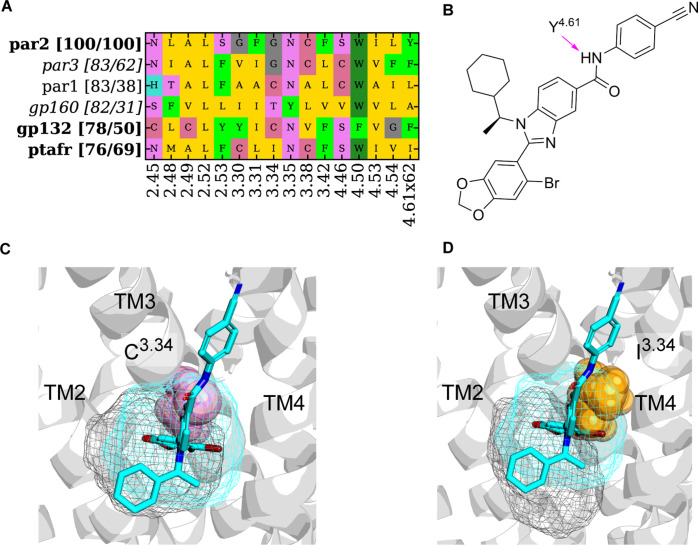
The second case study is A-EH-TM234_mid. A crystal structure of the protease-activated receptor (PAR2) found the allosteric antagonist AZ3451 bound at this site. The benzodioxazole of AZ3451 inserts into this pocket lined by residues L1232.52, F1543.31, and W1994.50. Of note is that the residue at the bottom of the pocket has been mutated from wild-type G1573.34 to Ala in the current structure, and this does not impact ligand binding. Additional contacts include a weak hydrogen bond between the benzimidazole and Y2104.61×62, which also forms π-stacking interactions with the benzonitrile ring and van der Waals packing between the cyclohexyl ring and L1232.52. AZ3451 at A-EH-TM234_mid may restrict the intrahelical rearrangement of helices required for PAR2 activation. As can be seen in Figure 4, the binding site was only detected in the allosteric-bound structure of PAR2 (PDB: 5NDZ) and not in Reference structures or the GPCRdb AlphaFold models.20 This suggested an influence of the ligand induced fit for A-EH-TM234_mid. We did not identify similar ligands that are active at other receptors (Figure 7) with respect to AZ3451. The binding site, however, was also identified in PAR1 and PAR3 (Figure 9). Outside of the PAR family, the binding site A-EH-TM234_mid was identified as well in GP160 and GP132 with the binding site similarity of 82 and 78%, respectively. The highest sequence similarity was identified for platelet activating factor receptor (PTAFR), but the binding site similarity is lower compared to GP160 and GP132, demonstrating that sequence similarity and binding site similarity do not necessarily correlate. Additionally, residue I3.34 clashes with AZ3451 (Figure 9B). GP132 (Figure 9A) and GP160 have less bulky C and T, respectively, at position 3.34. Y2104.61 is unique to PAR2, suggesting that only this residue could form the weak hydrogen bond; however, the conservative mutation to Phe as found in PAR3 and GP132 could still form π-stacking interactions. It was reported that replacing G1573.34, present in PAR2 and conserved in PAR3, by C1843.34 in PAR1 creates a steric repulsion.42 Therefore, targeting the pocket of GP132 would require a smaller ligand to accommodate the increased steric bulk of the cysteine residue.
Figure 9.
Binding site analysis for pockets identified at A-EH-TM234_mid with the highest binding site similarity and/or highest pocket residue sequence similarity. (A) Pocket composition from PAR2 (query) and similar receptors on the vertical axis. For each similar receptor, two similarity values are shown in the bracket. The first number is the average binding site 3D similarity to the query structure (PAR2, PDB: 5NDZ). The second number is the sequence similarity of residues in the A-EH-TM234_mid binding pocket. GPCR families where only pockets from the GPCRdb AlphaFold model20 were identified are in italics. (B) Ligand 2D structure of AZ3451. (C) Overlay of PAR2 (ribbon, PDB: 5NDZ, cyan mesh) and GP132 (black mesh) with AZ3451 (cyan sticks) demonstrating that C3.34 (shown as pink spheres) maintains pocket volume. (D) Overlay of PAR2 (ribbon, PDB: 5NDZ, cyan mesh) and PTAFR (black mesh) with AZ3451 (cyan sticks) showing that residue I3.34 (orange spheres) clashes with AZ3451, indicating that direct ligand repurposing is not possible for PTAFR.
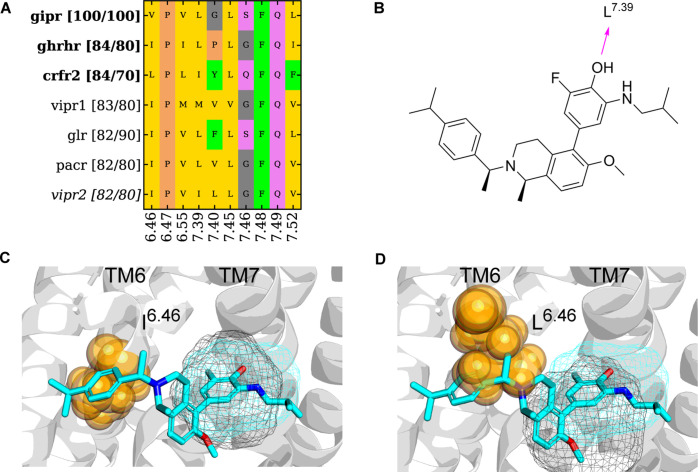
The final case study is that of B1-EH-TM67_mid. Previous studies showed that the GIP receptor (GIPR) has a positive allosteric modulator that binds at the B1-EH-TM67_mid. This PAM forms a hydrogen bond with the backbone oxygen at position L3897.39b and restricts the interhelical conformational rearrangement, which locks the receptor in an active conformation required for receptor activation. In Figure 4, we can see that the binding site was only detected in the allosteric-bound structure of GIPR (PDB: 7RBT) and not in Reference structures, again suggesting a ligand induced-fit effect. There were no similar compounds detected for other GPCR receptors (Figure 7).
Figure 10 demonstrates that the growth-hormone-releasing hormone receptor (GHRHR), corticotropin releasing factor receptor 2 (CRFR2), vasoactive intestinal peptide receptor 1 and 2 (VIPR 1 and VIPR 2), glucagon receptor (GLR), and pituitary adenylate cyclase activating polypeptide type I receptor (PACR) all have between 82 and 84% binding site similarity; however, this does not correlate with sequence similarity. While this extrahelical agonist from GIPR may be a good starting point for ligand optimization at candidate pockets from GLR, PACR, VIPR1, VIPR2, and GHRHR, the presence of L6.55b in CRFR2 would prevent similar ligands from binding in the B1-EH-TM67_mid site.
Figure 10.
Binding site analysis for pockets identified at B1-EH-TM67_mid. (A) Pocket composition from GIPR (query) and similar receptors on the vertical axis. For each similar receptor, two similarity values are shown in the bracket. The first number is the average binding site 3D similarity to the query structure (GIPR, PDB: 7RBT). The second number is the sequence similarity of residues in the B1-EH-TM67_mid binding pocket. (B) Ligand 2D structure of GIPR PAM. (C) Overlay of GIPR (ribbon, PDB: 7RBT, cyan mesh) and GHRHR (black mesh, PDB: 7CZ5). I6.46 shown as spheres of GHRHR does not clash with the PAM modulator. (D) Overlay of GIPR (ribbon, PDB: 7RBT cyan mesh) and CRFR2 (black mesh, PDB: 7TS0). L6.46 shown as spheres of CRFR2 clashes with the PAM.
4. Discussion
4.1. Updated Allosteric Data Set Used for Binding Site Detection
This review presents the latest data on allosteric GPCR binding sites and highlights the potential of underexplored allosteric binding regions. To systematically navigate this expanding GPCR pocketome, we developed a novel binding pocket annotation. Applying the site annotation scheme to the previous two studies,5,11Figure 11 depicts how the current knowledge of 24 allosteric binding sites (December 2023) has grown steadily from 14 and 21 known sites. Since the publication in 2022 by Hedderich et al.,5 the allosteric antagonist SCH546738 for CXCR3 was structurally elucidated43 to bind at A-EH-TM56_mid. Additionally, the allosteric agonist, compound 2, binding to GPR88 at the A-EH-TM56_int site was discovered, and the PAMs ADX88178 and VU0364770, binding at the Class C dimer interface C-EH-TM167_mid and C-EH-TM67_mid, were both structurally resolved by Wang et al.44 This richer collection of binding sites, coupled with the standardized pocket annotation scheme, facilitates a deeper and more systematic investigation of GPCR allostery.
Figure 11.
Known allosteric GPCR binding sites as of September 2020,11 May 2022,5 and December 2023. There are 24 known allosteric binding site GPCRs as of December 2023, growing steadily from 14 (2020) and 24 (2022) reported by previous studies. The binding sites are sorted vertically by their location within the receptor: intrahelical (IH), extrahelical (EH), and intracellular (IC) shown in orange, pink, and blue, respectively. The number following the binding site annotation indicates the number of structures with a known allosteric ligand. The total number is 101 instead of 100 as PDB: 8JD5 has two allosteric ligands binding at C-IH-TM234567 and C-EH-TM67_mid, respectively. The three types of allosteric binding locations are illustrated with matching colors on the left.
While our initial analysis focused on experimentally validated pockets to establish a reliable benchmark, we acknowledge the scientific interest in predicting functional roles of putative sites. However, this is beyond the scope of the current study. We do, however, propose a practical approach to select compounds for assessing functional roles of any predicted site (Sections 2.4 and 3.6).
4.2. Challenges in Allosteric GPCR Site Detection
Our results in Section 3.3 demonstrate that most allosteric pockets in GPCRs can be identified with default settings. However, extrahelical sites pose a particular challenge due to their small, hydrophobic, and shallow natures (Figure S10). Additionally, FTMap probes were optimized only for globular proteins.45 In such cases, modified settings, reoptimizing probes with GPCRs or embedding the receptor in a simulated membrane, might improve detection. However, these modifications are beyond the scope of the current study.
In our investigation of the structural dependency of allosteric binding site detection, we showed more success in predicting allosteric pockets in the inactive conformations compared to the active conformations. Therefore, prospective prediction of allosteric sites may have a higher chance of success when focusing on the inactive state of a GPCR. However, the challenge of identifying suitable starting structures, especially for extrahelical binding sites, underscores the importance of considering protein flexibility. Incorporating molecular dynamics (MD) simulations could provide valuable insights into protein plasticity and potentially identify transient or induced binding pockets, thereby improving the accuracy of the allosteric site prediction. Promising results have been reported by Ding et al.46 using classical MD and Shah et al.47 and Inan et al.48 employing cosolvent MD methods, demonstrating the potential of simulation-based approaches to aid allosteric pocket discovery and the complementary nature with faster methods using static structures.
4.3. Site Occurrence and Functional Role of Allosteric GPCR Binding Sites
The structural overlay in Figure 2 showed hotspots emerging even though allosteric GPCR ligands bind over the whole seven transmembrane domain. Comparing these hotspots to our illustration of the Class- and state-specific frequencies (Figure 5), we observed state and Class dependencies on the predicted allosteric location frequencies. The analysis of the structures suggests that the increased frequency of certain allosteric pockets such as A-IH-ECV and A-IH-Orthosteric-ECV correlates with the location of important microswitches required for G-protein activation in addition to stabilizing the orthosteric ligand binding site. From our data set collection, we see that there are currently seven structures of Class A that have an allosteric ligand bound at the A-EH-TM345_mid. This site mediates the conformational changes from the extracellular region to the cytoplasmic surface, suggesting a functional role in stabilizing or destabilizing GPCR activation.49 In Class B1, peptide binding results in a sharp kink at TM6 in the conserved motif P6.47xxG6.50, and it is therefore not surprising that the allosteric binding site B1-EH-TM2678_int is found more often in Class B1 compared to the other GPCR Classes. During Class C activation, the conformational change goes from the TM3/5-TM3/5 to a TM6/TM6 dimer interface.50 PAMs of gamma-aminobutyric acid (GABR) and the glutamate metabotropic receptor (GRM) stabilize the TM6/TM6 interface of the GPCR dimer and therefore its active conformation.
4.4. Property Analysis and Ligandability of Allosteric GPCR Sites
The property analysis in Section 3.5 highlights that extrahelical allosteric ligands are in a different chemical space compared to orthosteric modulators, as their binding sites are smaller and more exposed. The enrichment of halogens, particularly in extrahelical ligands, likely reflects their suitability for the membrane environment. Halogens possess both polar and lipophilic properties, potentially mitigating their physicochemical challenges associated with drug development. Our property analysis diverges from previous studies of Hedderich et al.51 and Burggraaff et al.52 due to several factors. First, our allosteric data set is larger and more diverse. Second, our structure-based approach differs fundamentally from the text-mining methodology employed by Burggraaff et al.,52 which is uncertain in terms of the structural meaning of what it considers as allosteric. Lastly, the inconsistent definition of allosteric ligands across studies, particularly the inclusion of ligands with partial overlap with the endogenous ligand in some studies, hinders direct comparison. Our exact structure-based definition of allosteric ligands excludes such ligands. These combined factors contribute to the observed discrepancies in the property analysis results.
To validate an allosteric site, we used ligand- and pocket-based approaches in three examples (Section 3.6). By the ligand-based approach, the observed cross-GPCR activity of allosteric ligands with known binding modes suggests potential starting points for targeting nonquery GPCRs through allosteric modulation. When followed up with a pocket-based approach, such ligandability potential can be further triaged by assessing both the 3D and sequence similarity of binding pockets. Calculated similarity values identify a subset of GPCRs of interest; however, visual inspection of binding site residues was shown to be crucial, as a single residue change can eliminate the pocket entirely. Each of the three illustrated allosteric sites, A-EH-TM124_int, A-EH-TM234_mid, and B1-EH-TM67_mid (Figures 8–10), exhibited a single critical residue change sufficient to abolish ligand binding for some of the shortlisted GPCRs. The most promising targets for drug repurposing are therefore S1PR1 at A-EH-TM124_int; GP132 at A-EH-TM234_mid; and GHRHR, VIPR1/2, GLR, and PACR at B1-EH-TM67_mid. Currently, there are no publicly available mutational data, which would be required to investigate the functional relevance of the sites for these GPCR families.
5. Conclusions
This study presents a novel GPCR binding site annotation scheme that systematically categorizes the increasingly diverse landscape of GPCR allosteric ligand binding sites and facilitates consistent comparisons across various methods enabling more efficient characterization and targeted analysis. Our data set represents the largest collection of GPCR allosteric binding sites from the PDB, with a particular focus on extrahelical binders. Our analysis of site detection methods finds that BioGPS and SiteMap perform well for most binding sites at default settings but struggle with extrahelical sites due to their smaller and shallower nature. This highlights an area for the future development of these methods. In addition, the importance of ligand-induced conformational change is noted in many cases for pocket detection success. Furthermore, we propose a structure-guided approach combining receptor and ligand similarity for assessing the ligandability of predicted sites. We find that visual inspection is essential to confirm the pocket availability. Overall, this work advances allosteric GPCR research, laying the groundwork for the future exploration and development of more effective therapeutic strategies.
Glossary
ABBREVIATIONS
- ALLODD
Allostery in Drug Discovery
- AlloAgos
Allosteric Agonist
- CCR7
CC motif chemokine receptor 7
- CNR1/2
cannabinoid receptor 1 and 2
- CRFR2
corticotropin releasing factor receptor 2
- CXCR1/2
CXC motif chemokine receptor 1 and 2
- DRD1
D1 receptor
- EC
extracellular
- ECV
extracellular vestibule
- EH
extrahelical
- eneg
energetic
- ext
exterior
- FFAR1
free fatty acid receptor 1
- GABR1/2
gamma-aminobutyric acid receptor 1 and 2
- geo
geometric
- GHRHR
growth-hormone-releasing hormone receptor
- GIPR
gastric inhibitory polypeptide receptor
- GLP1R
glucagon like peptide receptor
- GLR
glucagon receptor
- GPCR
G-protein-coupled receptor
- GPCRdb
G-protein-coupled receptor database
- GP132
G-protein-coupled receptor 132
- GP135
G-protein-coupled receptor 135
- GP160
G-protein-coupled receptor 160
- GRM
glutamate metabotropic receptor
- HCAR2
hydroxycarboxylic acid receptor
- IC
intracellular
- IH
intrahelical
- int
interior
- mid
middle
- MIFs
molecular interaction fields
- NAM
negative allosteric modulator
- OPM
Orientation of Proteins in Membranes database
- O51G2
olfactory 51G2 receptor
- PACR
pituitary adenylate cyclase activating polypeptide type I receptor
- PAMs
positive allosteric modulators
- PAR1/2/3
protease-activated receptor 1 and 2 and 3
- PDB
Protein Data Bank
- ppi
protein–protein interaction
- PTAFR
platelet activating factor receptor
- S1PR1
sphingosine 1-phosphate receptor
- TM
transmembrane
- VIPR1/2
vasoactive intestinal peptide receptor 1 and 2
Data Availability Statement
All protein and ligand coordinates utilized in this study were downloaded from RCSB (https://www.rcsb.org/) or GPCRdb (https://gpcrdb.org). The spreadsheets “Structure and model dataset” and “Descriptors” in SI_data.xlsx includes information on the Allosteric, Reference, and GPCRdb AlphaFold model20 data set including lists of ligand IDs, PDB IDs, and pocket and ligand descriptors.
Supporting Information Available
The Supporting Information is available free of charge at https://pubs.acs.org/doi/10.1021/acs.jcim.4c00819.
Figures S1–S11 and Tables S1 and S2 contain additional information on the definition of GPCR modulators, structural overview of FDA-approved GPCR drugs and categorization of allosteric GPCR modulator modalities, additional overview of binding site detection benchmarking (BioGPS (geo), SiteMap (ppi), and FTMap (ppi)), the annotation of the GLP1R PAM binding site and FFAR1 orthosteric binding site, analysis of pockets detected in GPCRdb AlphaFold models20, analysis of SiteMap versus SiteMap (ppi), additional information on pocket-based similarity assessment, and additional information on ligand similarity (PDF)
Tables S3–S8 contain the number of pockets detected for BioGPS, SiteMap, and FTMap; a Class-specific breakdown on pocket and ligand properties; a comparison to previously reported by Hedderich et al.5; and new sites (XLSX)
Author Contributions
S.P. performed the research and wrote the manuscripts. I.C. and C.D.G planned and supervised the research and the writing. B.B., G.B., G.M.K, G.G.F., and D.B. supervised the research. L.S., T.P., and S.C. provided support in the BioGPS analysis. M.G. provided support in the structural preparation and pocket clustering analysis. N.M.O. provided support in the ligand clustering analysis. All authors have read and given approval to the final version of the manuscript.
Research reported in this manuscript was supported by the EU Horizon 2020 MSCA Program under grant agreement 956314 (ALLODD to S.P.). This work was supported by the National Research, Development, and Innovation Office of Hungary [grants “PharmaLab” (RRF-2.3.1-21-2022-00015) to G.M.K. and FK146063 to D.B.] and the National Brain Research Program [NAP 3.0 to G.M.K.] of the Hungarian Academy of Sciences. D.B. was supported by the János Bolyai Research Scholarship of the Hungarian Academy of Sciences.
The authors declare the following competing financial interest(s): L.S., T.P., and S.C., are employees of Molecular Discovery Ltd. Molecular Discovery Ltd. offers commercial licenses for the use of BioGPS.
Footnotes
https://www.reaxys.com/, Elsevier Limited, 2024
Supplementary Material
References
- Hauser A. S.; Attwood M. M.; Rask-Andersen M.; Schiöth H. B.; Gloriam D. E. Trends in GPCR Drug Discovery: New Agents, Targets and Indications. Nat. Rev. Drug Discov 2017, 16 (12), 829–842. 10.1038/nrd.2017.178. [DOI] [PMC free article] [PubMed] [Google Scholar]
- Congreve M.; de Graaf C.; Swain N. A.; Tate C. G. Impact of GPCR Structures on Drug Discovery. Cell 2020, 181 (1), 81–91. 10.1016/j.cell.2020.03.003. [DOI] [PubMed] [Google Scholar]
- de Graaf C.; Song G.; Cao C.; Zhao Q.; Wang M.-W.; Wu B.; Stevens R. C. Extending the Structural View of Class B GPCRs. Trends Biochem. Sci. 2017, 42 (12), 946–960. 10.1016/j.tibs.2017.10.003. [DOI] [PubMed] [Google Scholar]
- Hedderich J. B.; Persechino M.; Becker K.; Heydenreich F. M.; Gutermuth T.; Bouvier M.; Bünemann M.; Kolb P. The Pocketome of G-Protein-Coupled Receptors Reveals Previously Untargeted Allosteric Sites. Nat. Commun. 2022, 13 (1), 2567. 10.1038/s41467-022-29609-6. [DOI] [PMC free article] [PubMed] [Google Scholar]
- Kooistra A. J.; Munk C.; Hauser A. S.; Gloriam D. E. An Online GPCR Structure Analysis Platform. Nat. Struct. Mol. Biol. 2021, 28 (11), 875–878. 10.1038/s41594-021-00675-6. [DOI] [PubMed] [Google Scholar]
- Kooistra A. J.; Mordalski S.; Pándy-Szekeres G.; Esguerra M.; Mamyrbekov A.; Munk C.; Keserű G. M.; Gloriam D. E. GPCRdb in 2021: Integrating GPCR Sequence, Structure and Function. Nucleic Acids Res. 2020, 49 (D1), D335. 10.1093/nar/gkaa1080. [DOI] [PMC free article] [PubMed] [Google Scholar]
- Desaphy J.; Bret G.; Rognan D.; Kellenberger E. Sc-PDB: A 3D-Database of Ligandable Binding Sites—10 Years On. Nucleic Acids Res. 2015, 43 (D1), D399–D404. 10.1093/nar/gku928. [DOI] [PMC free article] [PubMed] [Google Scholar]
- Stank A.; Kokh D. B.; Fuller J. C.; Wade R. C. Protein Binding Pocket Dynamics. Acc. Chem. Res. 2016, 49 (5), 809–815. 10.1021/acs.accounts.5b00516. [DOI] [PubMed] [Google Scholar]
- Ballante F.; Kooistra A. J.; Kampen S.; De Graaf C.; Carlsson J. Structure-Based Virtual Screening for Ligands of G Protein–Coupled Receptors: What Can Molecular Docking Do for You?. Pharmacol. Rev. 2021, 73 (4), 1698–1736. 10.1124/pharmrev.120.000246. [DOI] [PubMed] [Google Scholar]
- Wakefield A. E.; Bajusz D.; Kozakov D.; Keserű G. M.; Vajda S. Conservation of Allosteric Ligand Binding Sites in G-Protein Coupled Receptors. J. Chem. Inf Model 2022, 62 (20), 4937–4954. 10.1021/acs.jcim.2c00209. [DOI] [PMC free article] [PubMed] [Google Scholar]
- Brenke R.; Kozakov D.; Chuang G.-Y.; Beglov D.; Hall D.; Landon M. R.; Mattos C.; Vajda S. Fragment-Based Identification of Druggable ‘Hot Spots’ of Proteins Using Fourier Domain Correlation Techniques. Bioinformatics 2009, 25 (5), 621–627. 10.1093/bioinformatics/btp036. [DOI] [PMC free article] [PubMed] [Google Scholar]
- Baroni M.; Cruciani G.; Sciabola S.; Perruccio F.; Mason J. S. A Common Reference Framework for Analyzing/Comparing Proteins and Ligands. Fingerprints for Ligands And Proteins (FLAP): Theory and Application. J. Chem. Inf Model 2007, 47 (2), 279–294. 10.1021/ci600253e. [DOI] [PubMed] [Google Scholar]
- Cross S.; Baroni M.; Carosati E.; Benedetti P.; Clementi S. FLAP: GRID Molecular Interaction Fields in Virtual Screening. Validation using the DUD Data Set. J. Chem. Inf. Model. 2010, 50 (8), 1442–1450. 10.1021/ci100221g. [DOI] [PubMed] [Google Scholar]
- Siragusa L.; Cross S.; Baroni M.; Goracci L.; Cruciani G. BioGPS: Navigating Biological Space to Predict Polypharmacology, Off-targeting, and Selectivity. Proteins Struct Funct Bioinform 2015, 83 (3), 517–532. 10.1002/prot.24753. [DOI] [PubMed] [Google Scholar]
- Siragusa L.; Spyrakis F.; Goracci L.; Cross S.; Cruciani G. BioGPS: The Music for the Chemo- and Bioinformatics Walzer. Mol. Inform. 2014, 33 (6–7), 446–453. 10.1002/minf.201400028. [DOI] [PubMed] [Google Scholar]
- Vass M.; Kooistra A. J.; Yang D.; Stevens R. C.; Wang M.-W.; de Graaf C. Chemical Diversity in the G Protein-Coupled Receptor Superfamily. Trends Pharmacol. Sci. 2018, 39 (5), 494–512. 10.1016/j.tips.2018.02.004. [DOI] [PubMed] [Google Scholar]
- Berman H. M.; Bhat T. N.; Bourne P. E.; Feng Z.; Gilliland G.; Weissig H.; Westbrook J. The Protein Data Bank and the Challenge of Structural Genomics. Nat. Struct. Biol. 2000, 7 (Suppl 11), 957–959. 10.1038/80734. [DOI] [PubMed] [Google Scholar]
- Pándy-Szekeres G.; Munk C.; Tsonkov T. M.; Mordalski S.; Harpso̷e K.; Hauser A. S.; Bojarski A. J.; Gloriam D. E. GPCRdb in 2018: Adding GPCR Structure Models and Ligands. Nucleic Acids Res. 2017, 46 (D1), D440. 10.1093/nar/gkx1109. [DOI] [PMC free article] [PubMed] [Google Scholar]
- Pándy-Szekeres G.; Caroli J.; Mamyrbekov A.; Kermani A. A.; Keserű G. M.; Kooistra A. J.; Gloriam D. E. GPCRdb in 2023: State-Specific Structure Models Using AlphaFold2 and New Ligand Resources. Nucleic Acids Res. 2023, 51 (D1), D395–D402. 10.1093/nar/gkac1013. [DOI] [PMC free article] [PubMed] [Google Scholar]
- Halgren T. A. Identifying and Characterizing Binding Sites and Assessing Druggability. J. Chem. Inf Model 2009, 49 (2), 377–389. 10.1021/ci800324m. [DOI] [PubMed] [Google Scholar]
- Tubert-Brohman I.; Sherman W.; Repasky M.; Beuming T. Improved Docking of Polypeptides with Glide. J. Chem. Inf Model 2013, 53 (7), 1689–1699. 10.1021/ci400128m. [DOI] [PubMed] [Google Scholar]
- Mason J. S.; Bortolato A.; Weiss D. R.; Deflorian F.; Tehan B.; Marshall F. H. High End GPCR Design: Crafted Ligand Design and Druggability Analysis Using Protein Structure, Lipophilic Hotspots and Explicit Water Networks. Silico Pharmacol. 2013, 1 (1), 23. 10.1186/2193-9616-1-23. [DOI] [Google Scholar]
- Bortolato A.; Tehan B. G.; Bodnarchuk M. S.; Essex J. W.; Mason J. S. Water Network Perturbation in Ligand Binding: Adenosine A2A Antagonists as a Case Study. J. Chem. Inf. Model. 2013, 53 (7), 1700–1713. 10.1021/ci4001458. [DOI] [PubMed] [Google Scholar]
- Lomize M. A.; Pogozheva I. D.; Joo H.; Mosberg H. I.; Lomize A. L. OPM Database and PPM Web Server: Resources for Positioning of Proteins in Membranes. Nucleic Acids Res. 2012, 40 (D1), D370–D376. 10.1093/nar/gkr703. [DOI] [PMC free article] [PubMed] [Google Scholar]
- Lomize M. A.; Lomize A. L.; Pogozheva I. D.; Mosberg H. I. OPM: Orientations of Proteins in Membranes Database. Bioinformatics 2006, 22 (5), 623–625. 10.1093/bioinformatics/btk023. [DOI] [PubMed] [Google Scholar]
- Harding S. D.; Armstrong J. F.; Faccenda E.; Southan C.; Alexander S. P. H.; Davenport A. P.; Spedding M.; Davies J. A. The IUPHAR/BPS Guide to PHARMACOLOGY in 2024. Nucleic Acids Res. 2023, D1438. 10.1093/nar/gkad944. [DOI] [PMC free article] [PubMed] [Google Scholar]
- Davies M.; Nowotka M.; Papadatos G.; Dedman N.; Gaulton A.; Atkinson F.; Bellis L.; Overington J. P. ChEMBL Web Services: Streamlining Access to Drug Discovery Data and Utilities. Nucleic Acids Res. 2015, 43 (W1), W612–W620. 10.1093/nar/gkv352. [DOI] [PMC free article] [PubMed] [Google Scholar]
- Zdrazil B.; Felix E.; Hunter F.; Manners E. J.; Blackshaw J.; Corbett S.; De Veij M.; Ioannidis H.; Lopez D. M.; Mosquera J. F.; Magarinos M. P.; Bosc N.; Arcila R.; Kizilören T.; Gaulton A.; Bento A. P.; Adasme M. F.; Monecke P.; Landrum G. A.; Leach A. R. The ChEMBL Database in 2023: A Drug Discovery Platform Spanning Multiple Bioactivity Data Types and Time Periods. Nucleic Acids Res. 2023, D1180. 10.1093/nar/gkad1004. [DOI] [PMC free article] [PubMed] [Google Scholar]
- Landrum G.RDKit: Open-source cheminformatics software; RDKit: 2022.
- Mo̷ller T. C.; Moreno-Delgado D.; Pin J.-P.; Kniazeff J. Class C G Protein-Coupled Receptors: Reviving Old Couples with New Partners. Biophys. Rep. 2017, 3 (4–6), 57–63. 10.1007/s41048-017-0036-9. [DOI] [PMC free article] [PubMed] [Google Scholar]
- Li X. X.; Lee J. D.; Massey N. L.; Guan C.; Robertson A. A. B.; Clark R. J.; Woodruff T. M. Pharmacological Characterisation of Small Molecule C5aR1 Inhibitors in Human Cells Reveals Biased Activities for Signalling and Function. Biochem. Pharmacol. 2020, 180, 114156 10.1016/j.bcp.2020.114156. [DOI] [PubMed] [Google Scholar]
- Leach K.; Wen A.; Cook A. E.; Sexton P. M.; Conigrave A. D.; Christopoulos A. Impact of Clinically Relevant Mutations on the Pharmacoregulation and Signaling Bias of the Calcium-Sensing Receptor by Positive and Negative Allosteric Modulators. Endocrinology 2013, 154 (3), 1105–1116. 10.1210/en.2012-1887. [DOI] [PubMed] [Google Scholar]
- Nemeth E. F.; Heaton W. H.; Miller M.; Fox J.; Balandrin M. F.; Van Wagenen B. C.; Colloton M.; Karbon W.; Scherrer J.; Shatzen E.; Rishton G.; Scully S.; Qi M.; Harris R.; Lacey D.; Martin D. Pharmacodynamics of the Type II Calcimimetic Compound Cinacalcet HCl. J. Pharmacol. Exp. Ther. 2004, 308 (2), 627–635. 10.1124/jpet.103.057273. [DOI] [PubMed] [Google Scholar]
- Davey A. E.; Leach K.; Valant C.; Conigrave A. D.; Sexton P. M.; Christopoulos A. Positive and Negative Allosteric Modulators Promote Biased Signaling at the Calcium-Sensing Receptor. Endocrinology 2012, 153 (3), 1232–1241. 10.1210/en.2011-1426. [DOI] [PubMed] [Google Scholar]
- Leach K.; Gregory K. J.; Kufareva I.; Khajehali E.; Cook A. E.; Abagyan R.; Conigrave A. D.; Sexton P. M.; Christopoulos A. Towards a Structural Understanding of Allosteric Drugs at the Human Calcium-Sensing Receptor. Cell Res. 2016, 26 (5), 574–592. 10.1038/cr.2016.36. [DOI] [PMC free article] [PubMed] [Google Scholar]
- Zhuang Y.; Krumm B.; Zhang H.; Zhou X. E.; Wang Y.; Huang X.-P.; Liu Y.; Cheng X.; Jiang Y.; Jiang H.; Zhang C.; Yi W.; Roth B. L.; Zhang Y.; Xu H. E. Mechanism of Dopamine Binding and Allosteric Modulation of the Human D1 Dopamine Receptor. Cell Res. 2021, 31 (5), 593–596. 10.1038/s41422-021-00482-0. [DOI] [PMC free article] [PubMed] [Google Scholar]
- Müller K.; Faeh C.; Diederich F. Fluorine in Pharmaceuticals: Looking Beyond Intuition. Science 2007, 317 (5846), 1881–1886. 10.1126/science.1131943. [DOI] [PubMed] [Google Scholar]
- Meanwell N. A. Fluorine and Fluorinated Motifs in the Design and Application of Bioisosteres for Drug Design. J. Med. Chem. 2018, 61 (14), 5822–5880. 10.1021/acs.jmedchem.7b01788. [DOI] [PubMed] [Google Scholar]
- Price M. R.; Baillie G. L.; Thomas A.; Stevenson L. A.; Easson M.; Goodwin R.; McLean A.; McIntosh L.; Goodwin G.; Walker G.; Westwood P.; Marrs J.; Thomson F.; Cowley P.; Christopoulos A.; Pertwee R. G.; Ross R. A. Allosteric Modulation of the Cannabinoid CB1 Receptor. Mol. Pharmacol. 2005, 68 (5), 1484–1495. 10.1124/mol.105.016162. [DOI] [PubMed] [Google Scholar]
- Shao Z.; Yan W.; Chapman K.; Ramesh K.; Ferrell A. J.; Yin J.; Wang X.; Xu Q.; Rosenbaum D. M. Structure of an Allosteric Modulator Bound to the CB1 Cannabinoid Receptor. Nat. Chem. Biol. 2019, 15 (12), 1199–1205. 10.1038/s41589-019-0387-2. [DOI] [PubMed] [Google Scholar]
- Cheng R. K. Y.; Fiez-Vandal C.; Schlenker O.; Edman K.; Aggeler B.; Brown D. G.; Brown G. A.; Cooke R. M.; Dumelin C. E.; Doré A. S.; Geschwindner S.; Grebner C.; Hermansson N.-O.; Jazayeri A.; Johansson P.; Leong L.; Prihandoko R.; Rappas M.; Soutter H.; Snijder A.; Sundström L.; Tehan B.; Thornton P.; Troast D.; Wiggin G.; Zhukov A.; Marshall F. H.; Dekker N. Structural Insight into Allosteric Modulation of Protease-Activated Receptor 2. Nature 2017, 545 (7652), 112–115. 10.1038/nature22309. [DOI] [PubMed] [Google Scholar]
- Jiao H.; Pang B.; Liu A.; Chen Q.; Pan Q.; Wang X.; Xu Y.; Chiang Y.-C.; Ren R.; Hu H. Structural Insights into the Activation and Inhibition of CXC Chemokine Receptor 3. Nat. Struct. Mol. Biol. 2024, 610–620. 10.1038/s41594-023-01175-5. [DOI] [PMC free article] [PubMed] [Google Scholar]
- Wang X.; Wang M.; Xu T.; Feng Y.; Shao Q.; Han S.; Chu X.; Xu Y.; Lin S.; Zhao Q.; Wu B. Structural Insights into Dimerization and Activation of the MGlu2–MGlu3 and MGlu2–MGlu4 Heterodimers. Cell Res. 2023, 33 (10), 762–774. 10.1038/s41422-023-00830-2. [DOI] [PMC free article] [PubMed] [Google Scholar]
- Wakefield A. E.; Mason J. S.; Vajda S.; Keserű G. M. Analysis of Tractable Allosteric Sites in G Protein-Coupled Receptors. Sci. Rep. 2019, 9 (1), 6180. 10.1038/s41598-019-42618-8. [DOI] [PMC free article] [PubMed] [Google Scholar]
- Ding T.; Karlov D. S.; Pino-Angeles A.; Tikhonova I. G. Intermolecular Interactions in G Protein-Coupled Receptor Allosteric Sites at the Membrane Interface from Molecular Dynamics Simulations and Quantum Chemical Calculations. J. Chem. Inf. Model. 2022, 62 (19), 4736–4747. 10.1021/acs.jcim.2c00788. [DOI] [PMC free article] [PubMed] [Google Scholar]
- Shah S. D.; Lind C.; De Pascali F.; Penn R. B.; MacKerell A. D. Jr.; Deshpande D. A. In Silico Identification of a Β2-Adrenoceptor Allosteric Site That Selectively Augments Canonical Β2AR-Gs Signaling and Function. Proc. Natl. Acad. Sci. U. S. A. 2022, 119, e2214024119 10.1073/pnas.2214024119. [DOI] [PMC free article] [PubMed] [Google Scholar]
- Inan T.; Flinko R.; Lewis G. K.; MacKerell A. D.; Kurkcuoglu O. Identifying and Assessing Putative Allosteric Sites and Modulators for CXCR4 Predicted through Network Modeling and Site Identification by Ligand Competitive Saturation. J. Phys. Chem. B 2024, 128 (21), 5157–5174. 10.1021/acs.jpcb.4c00925. [DOI] [PMC free article] [PubMed] [Google Scholar]
- Liu H.; Kim H. R.; Deepak R. N. V. K.; Wang L.; Chung K. Y.; Fan H.; Wei Z.; Zhang C. Orthosteric and Allosteric Action of the C5a Receptor Antagonists. Nat. Struct. Mol. Biol. 2018, 25 (6), 472–481. 10.1038/s41594-018-0067-z. [DOI] [PubMed] [Google Scholar]
- Mao C.; Shen C.; Li C.; Shen D.-D.; Xu C.; Zhang S.; Zhou R.; Shen Q.; Chen L.-N.; Jiang Z.; Liu J.; Zhang Y. Cryo-EM Structures of Inactive and Active GABAB Receptor. Cell Res. 2020, 30 (7), 564–573. 10.1038/s41422-020-0350-5. [DOI] [PMC free article] [PubMed] [Google Scholar]
- Persechino M.; Hedderich J. B.; Kolb P.; Hilger D. Allosteric Modulation of GPCRs: From Structural Insights to in Silico Drug Discovery. Pharmacol. Ther. 2022, 237, 108242 10.1016/j.pharmthera.2022.108242. [DOI] [PubMed] [Google Scholar]
- Burggraaff L.; van Veen A.; Lam C. C.; van Vlijmen H. W. T.; IJzerman A. P.; van Westen G. J. P. Annotation of Allosteric Compounds to Enhance Bioactivity Modeling for Class A GPCRs. J. Chem. Inf. Model. 2020, 60 (10), 4664–4672. 10.1021/acs.jcim.0c00695. [DOI] [PMC free article] [PubMed] [Google Scholar]
Associated Data
This section collects any data citations, data availability statements, or supplementary materials included in this article.
Supplementary Materials
Data Availability Statement
All protein and ligand coordinates utilized in this study were downloaded from RCSB (https://www.rcsb.org/) or GPCRdb (https://gpcrdb.org). The spreadsheets “Structure and model dataset” and “Descriptors” in SI_data.xlsx includes information on the Allosteric, Reference, and GPCRdb AlphaFold model20 data set including lists of ligand IDs, PDB IDs, and pocket and ligand descriptors.


