Abstract
A database that links patents to NIH awards enables evaluation of key milestones along the research translation pathway.
The 1980 Bayh–Dole Act provides a framework for licensing US federally funded intellectual property to private companies and thereby enables the public and the economy to benefit from discoveries made at research institutions and universities. However, success rates in bridging the gap between the bench and broad implementation varies substantially across institutions, despite the production rates of scientific publications at research institutions being relatively steady and predictable1-3.
Although publication rates are generally stable, relatively few institutions produce entities such as startups that successfully deploy and commercialize their intellectual property as reliably as they generate publications. The variability in success in research translation contributes to a large and growing gap between the bench and broad implementation — a gap whose magnitude has grown so wide as to now be called the ‘valley of death’3-6. Despite it having important implications for institutions, research policy and the greater economy, explanations for this ‘valley’ remain understudied from a mechanism-based perspective3-5,7.
Leaders at research institutions are generally keen to encourage commercialization and the licensing of institutional inventions4,8, because such licenses may enhance institutional prestige, generate royalties and demonstrate return on investment to stakeholders (including taxpayers, in the case of public institutions)9. Peer-reviewed publications continue to serve as a time-honored benchmark within academia, and patenting is a reasonable — although imperfect — approximation of economically and socially valuable output from research-derived knowledge4,10,11. Accordingly, most universities have implemented incentives as called for in Bayh–Dole (for example, large percentages of licensing incomes) to encourage individual researchers to produce patents12.
Both federal and university policies increasingly seek to encourage patent production, but there is a paucity of data that quantify factors that explain variation in the patenting outcomes of individual researchers and institutions4,7,13-15. Objective metrics of the efficiency of patent generation would enable comparisons between institutions and the identification of best practices. To enable this, we have generated a database that offers a basis for the accurate determination of the relationship between funding inputs and the production of issued biomedical patents.
Overview of methods
Our database is formed by linking issued US utility patents to US National Institutes of Health (NIH) funding awards at every NIH-recipient institution by using publicly available data from the NIH and US Patent and Trademark Office (USPTO). Combining these datasets requires programmatically transforming each to meet a common standard and is necessary because neither contains a complete association between patents and any supporting NIH funding7,16.
The inadequate reporting of federally funded patenting activity has repeatedly been noted in the literature7,16,17 and creates a barrier to the substantive assessment of institutional performance in translating research7. Notably, although Bayh–Dole requires completeness of both of the USPTO and NIH datasets, the incompleteness of each7,16,17 is detailed later in this study. Despite their shortcomings, these two datasets are the most complete that are available: combining them into a single database forms the most complete dataset that is possible under the present circumstances.
After assembling the database, we created a metric to measure the relative cost efficiency of patent creation at each institution (for n = 201 institutions that met our inclusion criteria). The ‘translational ratio’ (TR) is equal to the total amount of NIH funding, inclusive of facilities and administrative costs, that was received by an institution divided by the number of NIH-associated patents that were issued during the 10-year study period. Only issued utility patents were included; pending patent applications were not included.
Put differently, the TR is the average amount of NIH funding used to generate one issued patent at a particular institution. Lower TR values indicate greater translational efficiency (that is, a lower TR value indicates that less funding was required to generate each patent).
A comparison of TR values between institutions enables evaluation of characteristics that predict higher or lower translational efficiency. Results of this analysis may prove useful for evaluating and calibrating innovation policy7.
Many hypotheses can be tested using this database and TR methodology: several sample experiments are reported here. We investigate the extent to which differences in translational efficiency can be explained by total NIH funding level, the presence of a well-funded engineering unit, and the facilities and administrative cost rate (also known as the indirect cost rate). Finally, we derive statistics regarding patenting and publishing activity among NIH-funded principal investigators (PIs).
Based on the database, the TR was paradoxically lower (that is, more efficient research translation) at institutions that receive lower levels of NIH funding as compared to those that receive moderate or high funding. Similarly, no difference in the TR was found at institutions that assigned higher facilities and administrative rates as compared to institutions with lower rates. The funding level for engineering units predicted reductions in the TR as funding was increased. Finally, 18% of all NIH PIs were listed as PIs on a grant that was associated with a patent, and 2% of these PIs were associated with half of the issued patents.
Results
For the study period 2009–2019, 201 institutions met the study inclusion criteria of more than US $40 million in cumulative NIH awards and at least 15 issued utility patents.
Relationships between institutional NIH funding and the generation of scientific papers.
As total NIH funding increases, the number of publications produced also increases at a linear rate (Fig. 1a). The data yields an R2 value of 0.901, which indicates a strong linear relationship, and a median cost per publication of $302,804. Institutions converted grant awards to published papers at similar costs regardless of overall funding level. All institutions depicted in Fig. 1 meet the inclusion criteria (n = 201).
Fig. 1 ∣. Total NIH funding comparisons.
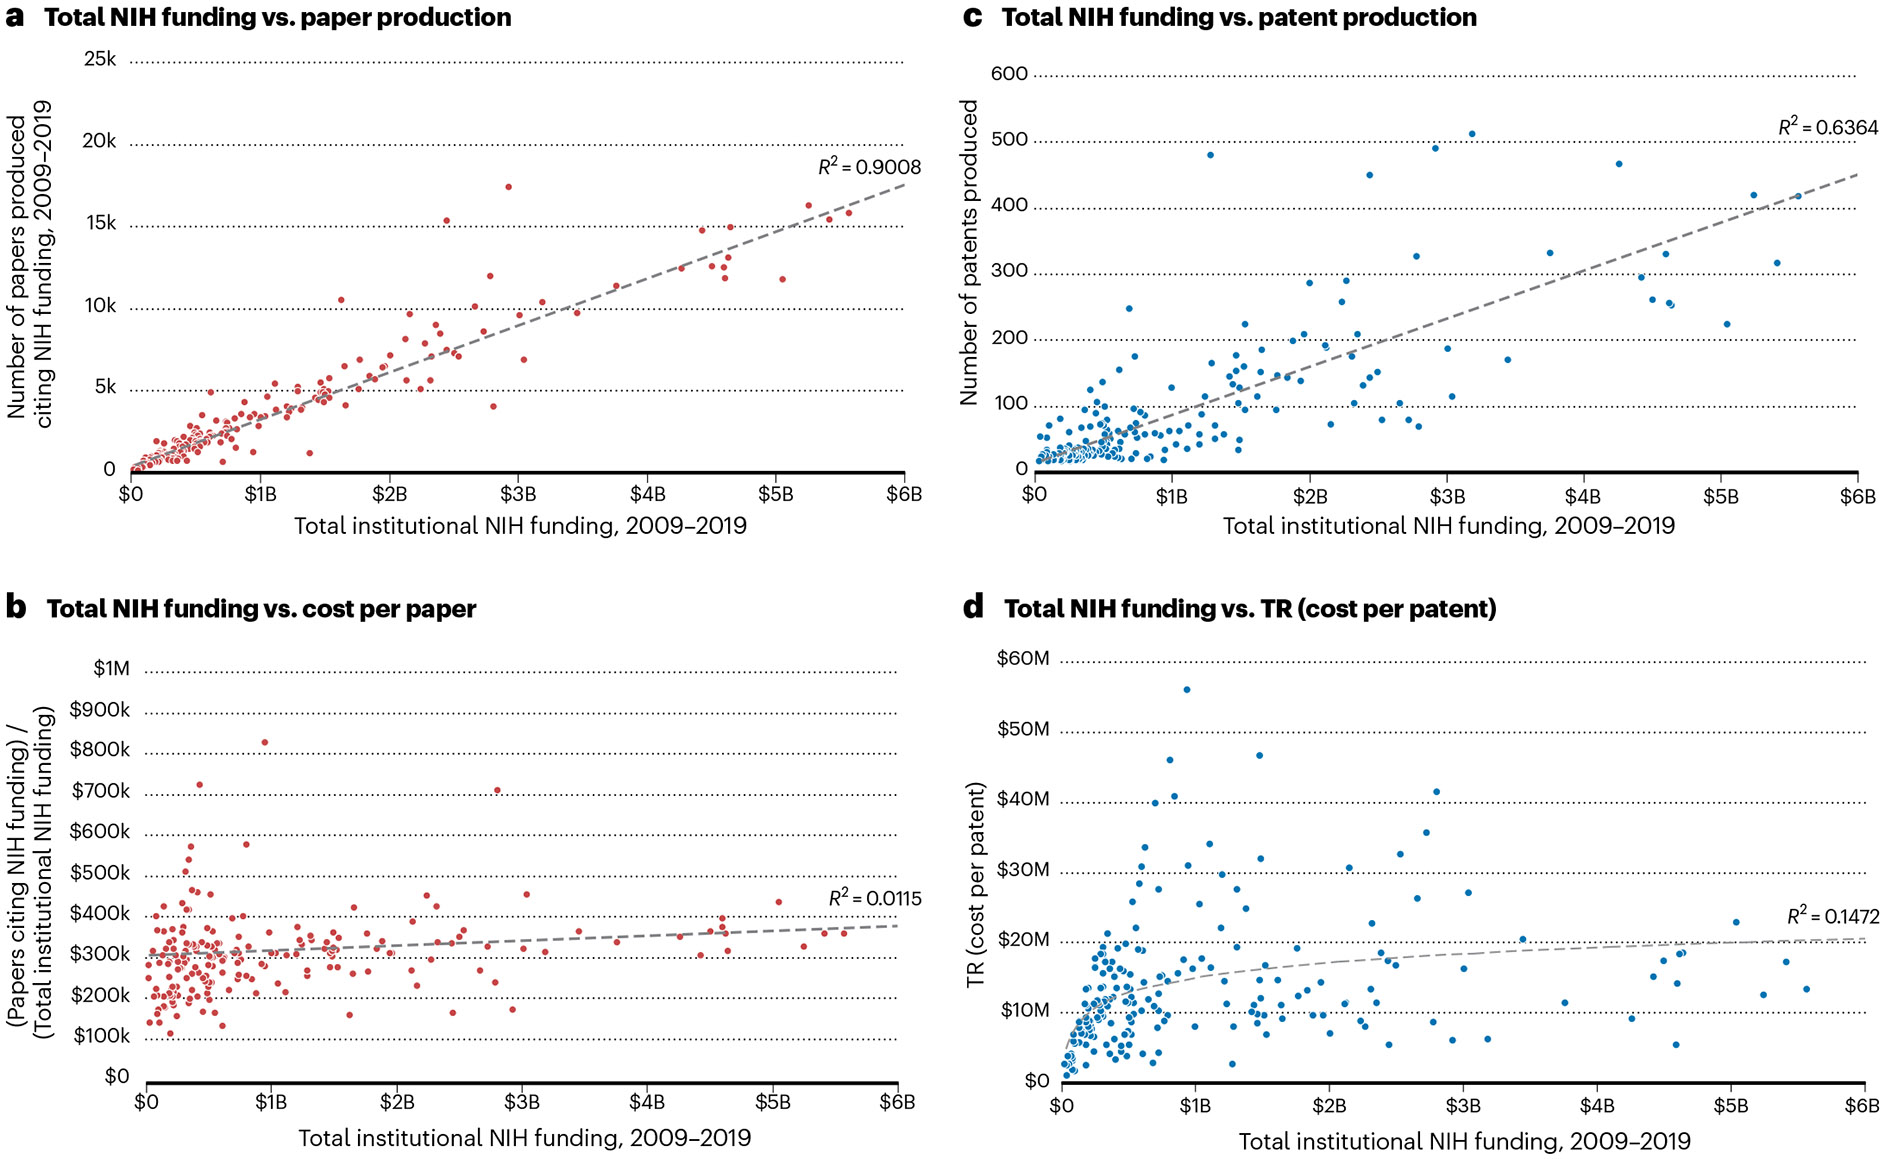
Each point on the chart represents an institution that met the inclusion criteria (n = 201). The x axis in each panel represents the total NIH funding that was received during the 10-year study period. a, Number of scientific publications produced versus total institutional funding. b, Mean cost per scientific publication at each institution versus total funding. c, Number of issued patents versus total funding. d, Mean cost per issued patent (the TR) versus total funding.
Institutions with larger amounts of NIH funding tend to be less efficient in patent generation.
Institutions were divided into three equal groups on the basis of their NIH funding level: high, moderate and low funding groups (n = 67 institutions per group) (Table 1 and Fig. 2). No significant difference in median TR exists between the high and moderate funding tiers (P = 0.40), but a significantly lower TR value was found in the low funding group (low versus moderate P < 0.01, and low versus high P < 0.01). The data show that the TR increases with total NIH funding, and that the TR is lowest in the group that receives the lowest overall funding from the NIH. These data are further reflected in Fig. 1d, which shows a modest decline in efficiency of patent production as total NIH funding increases.
Table 1 ∣.
Sample of TRs
| Institution | Total funding | NIH-award- associated patents |
TR |
|---|---|---|---|
| Johns Hopkins Universitya | $7,569,392,607 | 658 | $11,503,636 |
| University of Pennsylvaniaa | $5,573,814,892 | 417 | $13,366,463 |
| University of Washingtona | $5,422,263,823 | 316 | $17,159,063 |
| Stanford Universitya | $4,603,360,657 | 856 | $5,377,758 |
| Massachusetts Institute of Technologya | $1,292,132,471 | 478 | $2,703,206 |
| University of Arizonab | $1,125,658,822 | 69 | $16,313,896 |
| Vanderbilt University Medical Centerb | $1,120,679,954 | 33 | $33,959,999 |
| Medical College of Wisconsinb | $1,041,695,081 | 41 | $25,407,197 |
| Dartmouth Collegeb | $1,007,193,491 | 127 | $7,930,657 |
| Wayne State Universityb | $750,715,346 | 50 | $15,014,307 |
| Rhode Island Hospitalc | $344,531,013 | 20 | $17,226,551 |
| Indiana University Bloomingtonc | $344,483,006 | 29 | $11,878,724 |
| Georgia Institute of Technologyc | $331,765,694 | 29 | $11,440,196 |
| Virginia Polytechnic Institute and State Universityc | $328,250,362 | 17 | $19,308,845 |
| University of Puerto Rico Med Sciencesc | $328,160,856 | 18 | $18,231,159 |
Two hundred and one institutions met the inclusion criteria (n = 67 per group). aExample institution from the high NIH funding group. bExample institution from the moderate NIH funding group. cExample institution from the low NIH funding group.
Fig. 2 ∣. Total NIH funding versus TR.
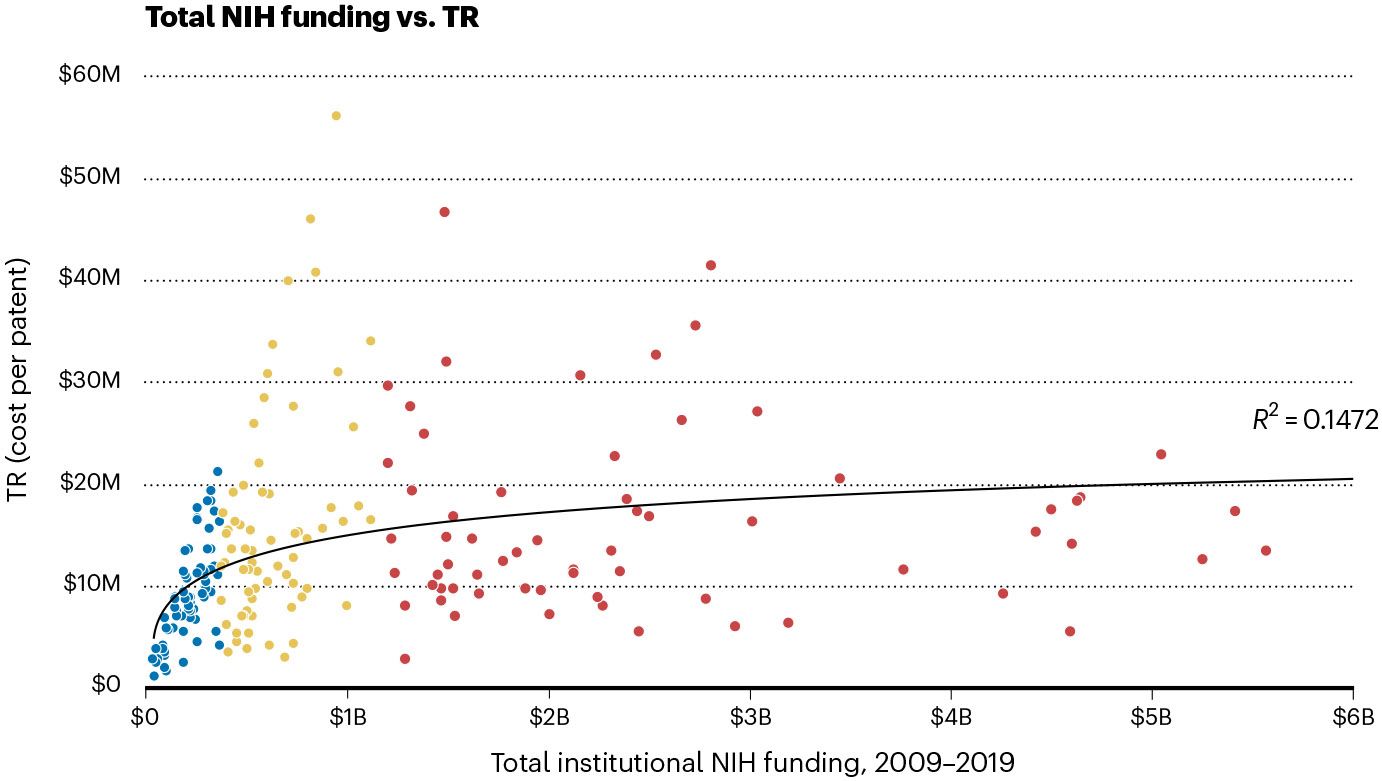
TRs that are suggestive of greater translational efficiency were found in the lower-funding group as compared to both the high- and moderate-funding groups (P < 0.01). No significant differences were found between the moderate- and high-funding groups.
Indirect cost rates tend to have no effect on patent-production efficiency.
Facilities and administrative cost rates were obtained for 134 institutions that met inclusion criteria based on a US Freedom of Information Act request. These institutions were divided into two equal groups of 67 on the basis of their indirect cost percentage in descending order. Table 2 provides a sample of the institutions in the high- and low-rate groups. Rates ranged from 42.6% to 89.5%, with a mean of 61.38% in the high-cost group and 51.21% in the low-cost group. No significant difference in median TR was found between the high- and low-cost groups, which suggests that translational efficiency is not accounted for by facilities and administrative cost rates (Fig. 3).
Table 2 ∣.
Examples of institutions in high and low indirect-cost percentage groups
| Institution | Total funding | Total patents | TR | Facilities and administrative rate (%) |
|---|---|---|---|---|
| Brigham and Women’s Hospitala | $3,767,396,625 | 330 | $11,416,353 | 79.0 |
| Fred Hutchinson Cancer Research Centera | $2,811,587,285 | 68 | $41,346,872 | 76.0 |
| Massachusetts General Hospitala | $4,270,145,311 | 466 | $9,163,402 | 74.0 |
| New York University School of Medicinea | $2,320,364,922 | 174 | $13,335,431 | 69.4 |
| Harvard Universitya | $736,190,973 | 174 | $4,230,983 | 68.6 |
| George Washington Universityb | $951,372,063 | 17 | $55,963,063 | 54.1 |
| Michigan State Universityb | $636,887,388 | 19 | $33,520,389 | 53.5 |
| Ohio State Universityb | $1,778,720,585 | 145 | $12,267,039 | 53.3 |
| University of Kentuckyb | $1,228,651,834 | 85 | $14,454,727 | 49.9 |
| University of Nevada, Renob | $223,415,137 | 30 | $7,447,171 | 42.6 |
Institution that meets inclusion criteria in the high indirect-cost percentage group.
Institution that meets inclusion criteria in the low indirect-cost percentage group.
Fig. 3 ∣. TR versus facilities and administrative cost rates.
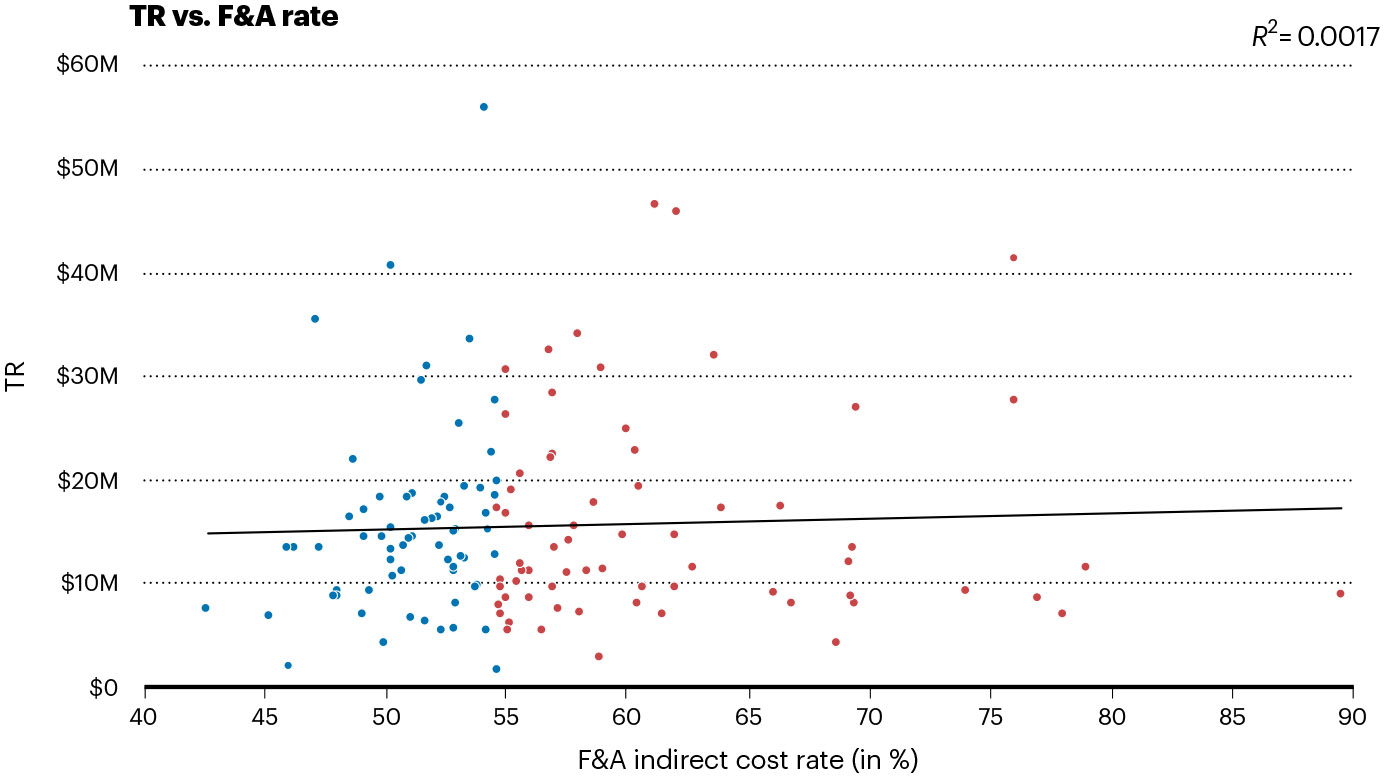
TRs were not significantly different between the high and low indirect-cost percentage groups.
Institutions with engineering units and higher levels of NIH funding tend to show more efficient generation of issued patents.
Among the 201 institutions that met the inclusion criteria, 114 have engineering units (for example, colleges or schools of engineering or applied science) that report funding data to the National Science Foundation (NSF) Higher Education Research and Development (HERD) survey. The median TR in the high engineering-unit funding group was significantly lower than in the lower funding group (P = 0.022); that is, institutions with high engineering-unit expenditures (including both intramural and extramural funding) tended to produce issued patents with higher levels of translational efficiency (Table 3 and Fig. 4).
Table 3 ∣.
Engineering expenditure
| Institution | TR | Engineering budget for 2016–2019 |
|---|---|---|
| Georgia Institute of Technologya | $11,440,196 | $2,415,226,000 |
| Massachusetts Institute of Technologya | $2,703,206 | $1,743,218,000 |
| Pennsylvania State University, University Parka | $11,887,463 | $1,275,968,000 |
| State University of New York, Stony Brooka | $10,909,860 | $1,223,626,000 |
| Texas A&M University Health Science Centera | $8,746,527 | $1,200,362,000 |
| University of Michigan at Ann Arbora | $26,197,622 | $1,170,983,000 |
| Virginia Polytechnic Institute and State Universitya | $19,308,845 | $959,059,000 |
| Purdue Universitya | $3,362,721 | $954,643,000 |
| University of Texas, Austina | $12,709,617 | $949,663,000 |
| University of California, Berkeleya | $10,007,510 | $775,389,000 |
| University of Illinois at Urbana-Champaigna | $7,383,628 | $759,825,000 |
| University of Alabama at Birminghamb | $35,511,765 | $186,746,000 |
| University of South Floridab | $14,483,208 | $180,381,000 |
| University of Pittsburgh at Pittsburghb | $12,569,724 | $176,253,000 |
| University of Utahb | $13,133,966 | $175,877,000 |
| Louisiana State University and A&M Collegeb | $8,608,156 | $174,182,000 |
| University of Missouri-Columbiab | $13,547,556 | $170,357,000 |
| Case Western Reserve Universityb | $7,071,809 | $167,079,000 |
| University of California, Santa Cruzb | $17,267,427 | $164,435,000 |
| University of Connecticut School of Medicineb | $22,022,487 | $162,768,000 |
| Colorado State Universityb | $17,102,918 | $162,524,000 |
| University of Cincinnatib | $15,530,553 | $159,507,000 |
Universities ranked by the sum of engineering unit expenditures between the fiscal years of 2016 and 2019. n = 57 institutions in the high funding group; n = 57 institutions in the low funding group. aExample institution from the high funding group. bExample institution from the low funding group.
Fig. 4 ∣. Engineering unit budget versus TR.
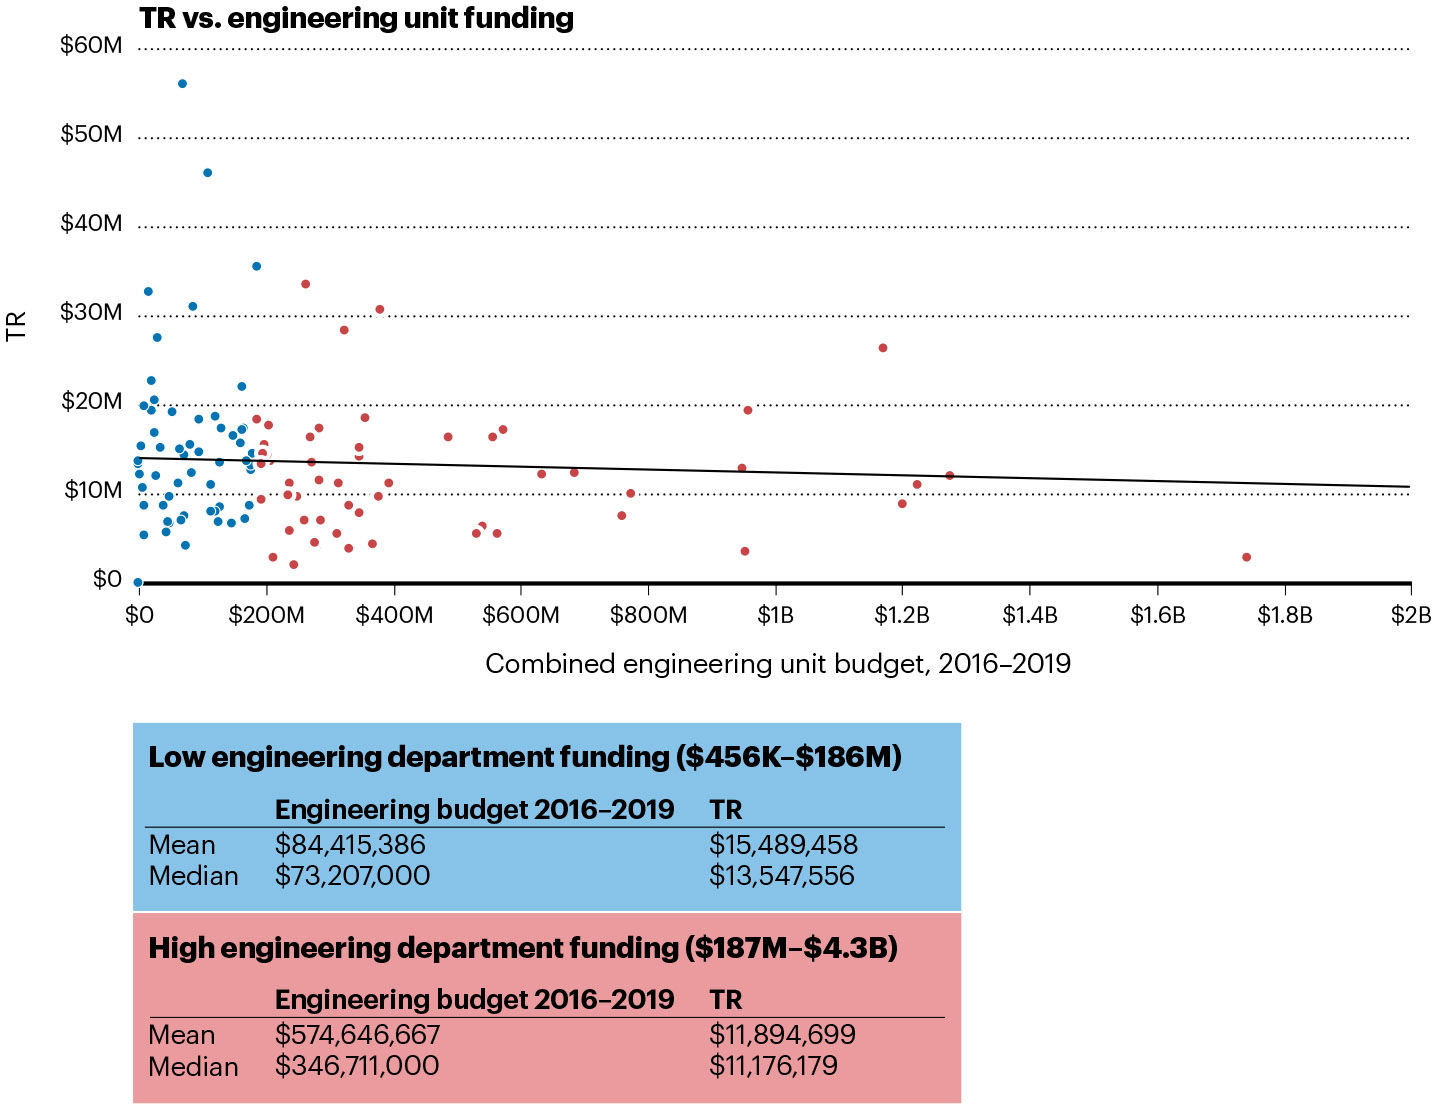
Significantly lower mean and median TRs were found in the high engineering-unit-funding group versus the low funding group (P = 0.022).
PIs versus institutions in predictions of patenting efficiency.
During the study period, 98,063 PIs received funding from any type of NIH award. However, only 17,387 PIs were listed on an NIH award that was cited by an issued patent, representing 17.7% of the total PI population (Fig. 5).
Fig. 5 ∣. PI–patent histogram.
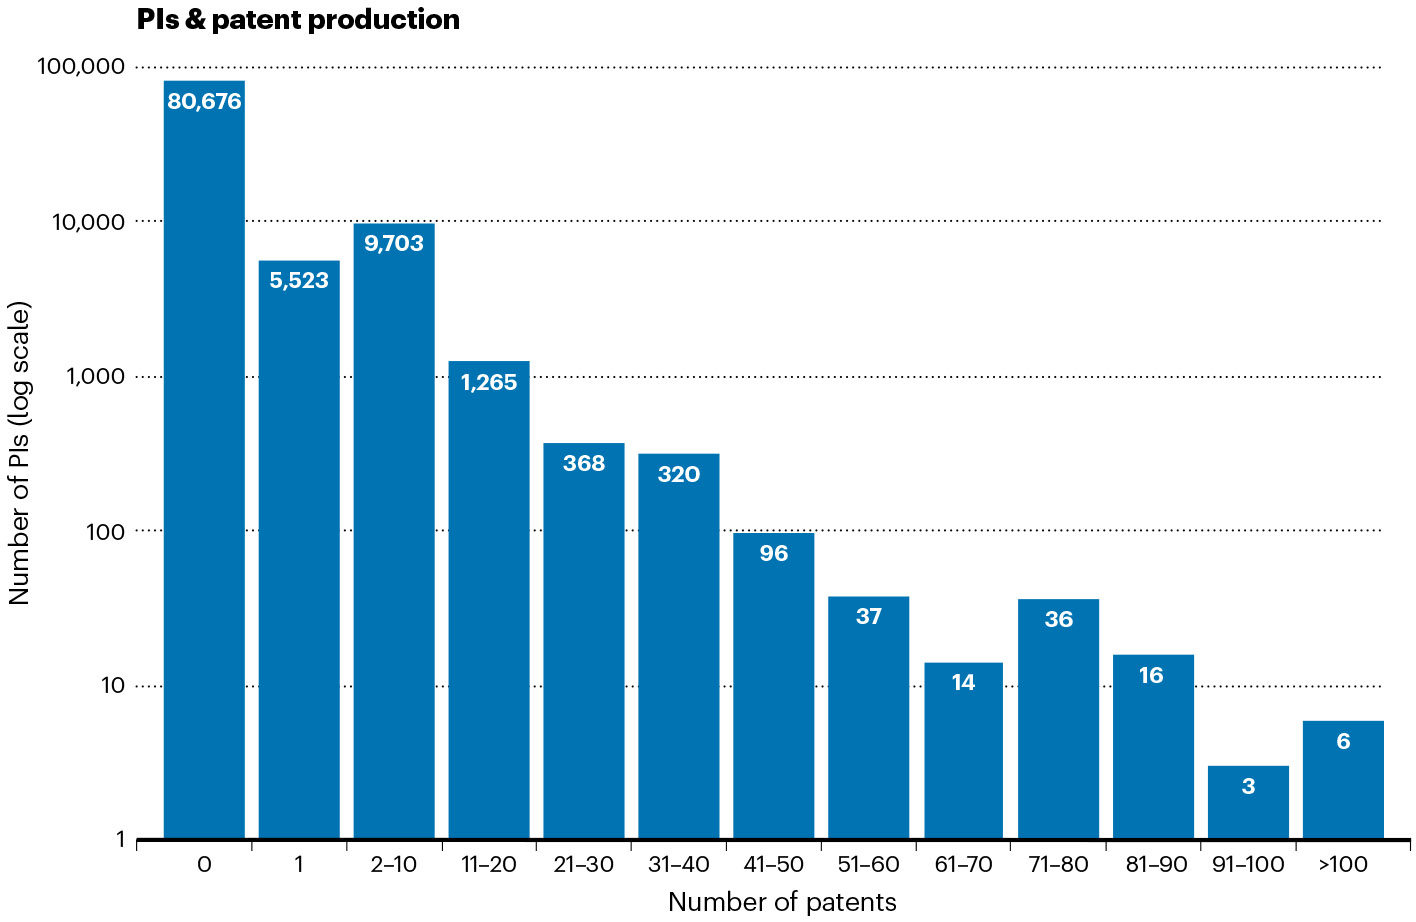
Number of patents awarded to PIs during the study period. The x axis contains groups that represent the number of awarded patents, and the y axis represents how many PIs comprise each group (the y axis is shown using a logarithmic scale).
We additionally found that the 1,952 PIs with the most patents (2.0% of the total PI population) were associated with 50% of the issued patents during the study period. These ‘super-producers’ were each awarded 10 patents or more (Fig. 6). The data also show that 83% of PIs have not been issued any patents related to their NIH awards.
Fig. 6 ∣. Density of super-producers at each institution versus TR.
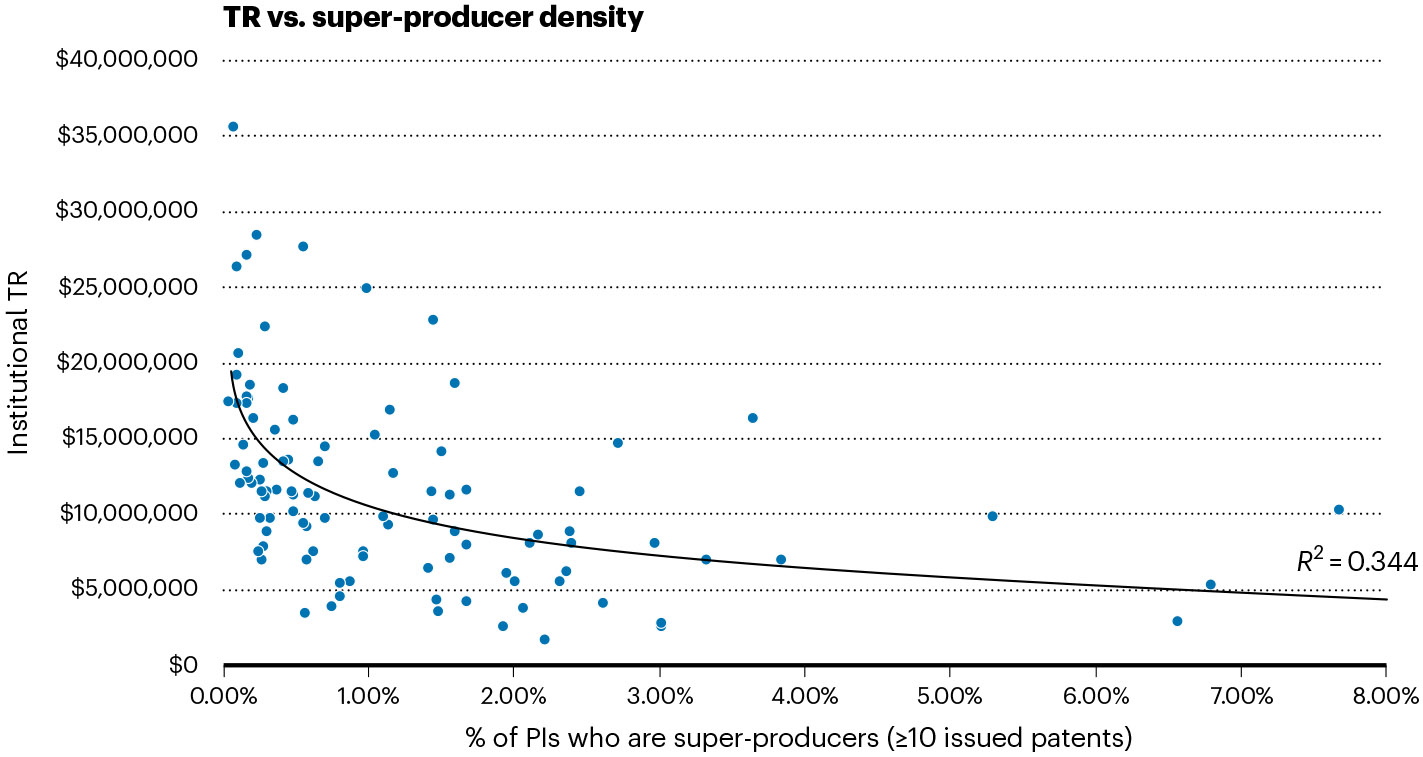
Each blue circle represents one institution. Dense clusters of super-producers at a single institution are associated with greater cost efficiency in patent generation at that institution. Super-producer density (x axis) is defined as the number of PIs who are associated with at least 10 patents divided by the total number of NIH PIs at each institution. The y axis represents the TR for each institution.
Discussion
NIH funding creates knowledge and not patents.
The purpose of NIH funding is the advancement of science and medicine, and not necessarily the production of patents or the support of imminently translatable research. NIH support is largely designed to fund basic science research, which may have no immediate applications but may serve as a foundation to advance science and medicine decades later in ways that are not presently obvious. This strategic support of research is rare, fragile and deserving of protection.
Much evidence exists that the NIH succeeds in its mission to “seek fundamental knowledge about the nature and behavior of living systems and the application of that knowledge to enhance health, lengthen life and reduce illness and disability”16. For example, total NIH funding is directly correlated with the production of scientific publications. If publications are a proxy for the creation and dissemination of new knowledge, then NIH support creates new knowledge at a linear and constant rate. Additionally, many PIs who achieve substantial impact and win major awards (such as Nobel Prizes) may never generate patents.
It would be a mischaracterization of this study to criticize the NIH or its funding practices, as we seek to measure a side effect of NIH support: the efficiency of institutions and PIs in translating federally funded research into forms that improve and advance human health on a broad scale.
Patenting as a marker of translational activity.
Patenting has long been used to measure the economically and socially valuable products of research-derived knowledge and has extensively been used in the literature to assess the productive output of research institutions4,7,10,11. Patenting is also an important and expected step along the translational pathway, because the licensing of patents usually occurs at the demarcation between the research and the production environments.
Although measurements of downstream steps in the translational pathway are of interest (such as the percentage of patents licensed to companies or the number of derivative products that reach the market), data on these milestones are sporadically and incompletely available owing to their proprietary nature. By contrast, the NIH and USPTO datasets are publicly available, complete and largely well-validated.
Patents are issued only after completing a rigorous quality control process at the USPTO, usually in a protracted multiyear legal process that involves a back-and-forth with the inventor and their agents. For claims to be allowed and a patent issued, a professional patent examiner must agree that the claimed invention is useful, nonobvious and demonstrates an inventive step. NIH awards are also highly competitive and applications are thoroughly examined using a peer-review process on the basis of scientific merit and programmatic alignment with the various institutions of the NIH. Awardees tend to be high-performing and accomplished researchers.
Taken together, these two markers can provide a basis for robust quantitative analysis, particularly when considered at scale across all NIH-funded institutions. Our primary metric (the TR) is derived from all sources of NIH funding during the 10-year study period, including grant and non-grant (that is, contract and cooperative agreement) funding mechanisms. Therefore, our calculations of total funding may differ from other reports that include only grant awards.
By capturing the total magnitude of NIH support and associated patent production, we expect the TR to enable comparisons between institutions. Additionally, by restricting this analysis to institutions that hold 15 or more issued patents, nearly all included institutions were large research universities that meet the ‘Carnegie R1’ research university designation.
Patenting and the number of publications.
The remarkable linearity of publication production per unit of NIH funding (Fig. 1a) indicates that publications are reliably and predictably produced with NIH awards. By contrast, Fig. 1c shows that patent production is considerably more variable. We therefore suggest that patent production rates are independent of publication rates. Further, it appears that a focus on patenting does not necessarily detract from publishing. Huang4 and Rai7 both found that patenting more frequently was associated with publishing more frequently.
Peer-reviewed publications are the academic norm, but new knowledge derived from research can be disseminated within both papers and patents1,15. PIs who produce both are likely to benefit from increased industry collaboration and the associated exposure to new research ideas and funding sources15,18,19.
Economies of scale for big institutions and big engineering units
Institutions were combined into three groups on the basis of total NIH funding to evaluate the effects of institutional size on patent production efficiency. A total of 201 institutions met the study inclusion criteria.
Institutions in the lowest tier of NIH funding produced patents at a lower ‘cost’ per unit NIH funding (that is, a lower TR) than institutions at moderate or high funding levels. Overall, our data show that patents are produced more efficiently by institutions that receive lower overall NIH funding, and that the TR showed a modest increase as total NIH funding is increased (that is, the cost per patent was higher at the highest-funded institutions).
Many factors probably contribute to this result. One may be the relatively high institutional emphasis placed on pure basic science research at the largest and wealthiest research institutions. Previous studies have identified several contributing factors that include royalty policies, patenting incentives and characteristics of technology transfer offices such as professionalism and profit drive4. Although large institutions may have better-funded technology transfer offices, the data do not demonstrate that larger institutions produce patents more cost efficiently than smaller ones. Our results are consistent with other studies that have that found PI factors, such as attitudes toward patenting and the associated risks and benefits, were more predictive of patent production than institutional factors4,20.
We also expect that universities with large, well-funded engineering units would have lower TRs because of an enhanced focus on reducing scientific ideas to practice. Interdisciplinary collaboration between engineering faculty members and NIH basic science researchers may also have a role. Our analysis found that institutions in the high engineering-unit funding group had lower TRs than those in the lower funding group. Incidentally, higher engineering-unit funding was not correlated with higher total NIH award funding.
Relationship of facilities and administrative costs to efficient patent production.
Facilities and administrative costs are included in NIH awards to support the host institutions at which NIH research takes place. The rates of included institutions ranged from 42.6% to 89.5% (a list of institutions and their corresponding rates are available in Supplementary Table 1). No statistically significant difference in TRs was found between the high and low facilities and administrative cost percentage groups. We conclude that, in aggregate, higher institutional facilities and administrative rates are not correlated with a greater cost efficiency in patent generation, despite presumably offering higher funding for technology transfer offices and related services. Consistent with previous reports, we also found that smaller institutions are also more likely to have lower cost rates21.
Role of the PI and institution in translational efficiency.
Our finding that 2.0% of PIs are associated with over 50% of NIH-supported patents suggests that a small group of super-producer PIs are responsible for the majority of NIH-associated patent generation. Although this finding is reasonable considering that the mission of the NIH is to advance science, it demonstrates that relatively few PIs actively engage in patent production. We suggest that individual PI attitudes and intrinsic motivation to apply their research beyond the institution, rather than institutional size or other properties, are primary drivers of patent creation and translational activity.
Super-producer PIs (defined as having 10 or more issued patents) present an interesting case. Clusters of super-producers at a single institution are associated with greater cost efficiency in patent generation at that institution. Owing to the large effect that super-producers have on the TR of their institution, we suggest that these individuals are responsible for a considerable portion of the biomedical translational output of their institutions.
However, it is also important to note that PIs are unlikely to produce patents until their research has advanced to a point at which reduction to practice is useful and feasible. This generally requires years to accomplish, which means that successful and meaningful translation is more likely to come from more-senior PIs who probably received substantial early-stage support from the NIH and other research sponsors7,22. This view is held by others in the literature, who reason that senior scientists have additional time and resources available for patenting and related entrepreneurial endeavors7,23,24. Tenured faculty, who are less exposed to the uncertainty associated with promotion and tenure, may also be better positioned to accept the risks that are associated with an entrepreneurial venture4,15. Junior researchers lack these advantages and may be less likely to produce patents because academic promotion systems continue to value publications above patents4, especially in their promotion and tenure processes.
Cross-checking the NIH and USPTO datasets.
The database that underlies this analysis is formed by precisely linking issued patents to the specific NIH awards that supported their creation. After patents have been linked to specific awards, the properties of both can be evaluated at scale.
The NIH publishes a dataset that links patents and NIH awards on its website. However, this dataset is incomplete and poor reporting of federally funded patenting activity has repeatedly been noted in the literature7,16,17,25. This incomplete reporting has been implicated as a barrier to substantive assessment of institutional performance in translating research7,25. As per the NIH website “The patents in RePORTER come from the iEdison database. Not all recipients of NIH funding are compliant with the iEdison reporting requirements, particularly after their NIH support has ended”16. We found this to be true, despite the contractual and legal obligation of NIH recipients to perform patent reporting. A recent US General Accountability Office study carefully analyzes this issue and demonstrates results that are consistent with our findings25.
To mitigate the effects of this underreporting, we merged the NIH RePORTER (exported in bulk using ExPORTER) and the USPTO Office of the Chief Economist (OCE) datasets into a single database. The NIH dataset lists only 16,640 issued patents associated with NIH awards, but the USPTO OCE dataset reported more than 21,000 during the study period.
Acknowledging a government interest in the USPTO patent application is legally required when the patent’s claims have been developed using federal funding: this notation appears in the ‘Government Interest’ section of issued patents. The USPTO OCE dataset captures awards reported in this section. However, considerable underreporting of federal grant support also exists in this USPTO dataset7,25. Given these challenges, undertaking the considerable — but achievable — task of merging and cross-referencing these two datasets provided us a path to the most complete picture of NIH award-to-patent links under the present circumstances, as these relationships are not recorded at scale in any other dataset.
In addition to underreporting of awards in both datasets, errors were found in the data that were reported. For example, over 1,100 issued patents in the USPTO dataset listed the NIH as a funding source but did not include a specific award number (as required by USPTO guidelines). Additionally, award numbers are not recorded using a standardized format within a patent’s Government Interest section and therefore award identifiers were extracted and standardized using a series of parsing algorithms. Although great care was taken to complete this process thoroughly and fastidiously, we expect that approximately 10% of issued patents that cite NIH support cannot be accurately resolved to a particular NIH award owing to missing information or unresolvable typographical errors. Of all the NIH grants awarded during the study period (225,289), only 5.0% were cited by an issued patent.
Potential confounders and limitations.
This analysis encounters multiple complexities. Underreporting obscures some patents from analysis and approximately 10% of reported patents contain errors that prevent linking them to a specific NIH award.
The study leans heavily on the TR metric, which assumes a correlation between patent production and translational activity. Although numerous factors could measure translational activity, NIH awards and issued patents provide reliable, well-validated and objective metrics. The relationship between these two variables can now be derived with improved precision. However, the TR only gauges patent quantity and not the inherent value or utility of the patents, which are challenging attributes to measure4,7,26.
Additionally, there is a substantial delay between NIH award and patent issuance, with late-period awards often recorded without their corresponding patents (causing an overall increase in the TR). By examining recipient institutions at scale, we minimize this bias toward specific groups.
Finally, these data should not be used to compare specific quantitative outcomes between individual institutions or researchers. Several potential issues such as multi-PI or multi-institution NIH awards complicate the assignment of credit for patents. Additionally, several methodologies can be used to aggregate and total institutional NIH funding. The NIH also periodically revises funding data from prior fiscal years. Despite these challenges, repeating the analysis using a variety of methodologies to address the issues noted above yielded consistent aggregate results. Large cohort grouping reduced institution-specific and grant-level biases.
Materials and methods
Our database was formed by methodically linking USPTO and NIH databases using the NIH award numbers cited in the Government Interest section of awarded patents. NIH and USPTO data were first loaded into a MariaDB SQL database. A master link table was created, which links each patent that cites NIH support to a specific NIH award or awards. This linking forms the foundation of our subsequent analysis.
Study period
We define the study period as the years 2009–2019 (inclusive), unless otherwise specified.
Master link table.
The master link table (Fig. 7) was assembled through the following process: First, all available NIH award data during the study period were acquired using the NIH ExPORTER website (the NIH ExPORTER facilitates bulk access to the dataset on which the NIH RePORTER website is based). Next, bulk data were acquired from the USPTO’s PatentsView website. PatentsView is a service provided by the USPTO OCE that provides specialized datasets for economic research. The ‘government_organization’ and ‘patent_contractawardnumber’ datasets were used in this analysis. The government_organization data contain organization names and related agency hierarchy parsed from the government interest statements within issued patents. The patent_contractawardnumber dataset lists contract or award numbers parsed from the same government interest statements. The government_organization data were used to identify NIH-associated patent numbers, and then specific award numbers were found by joining this patent number list with the award numbers for each respective patent found in the patent_contractawardnumber table.
Fig. 7 ∣. Simplified view of the summary diagram of the master link table.
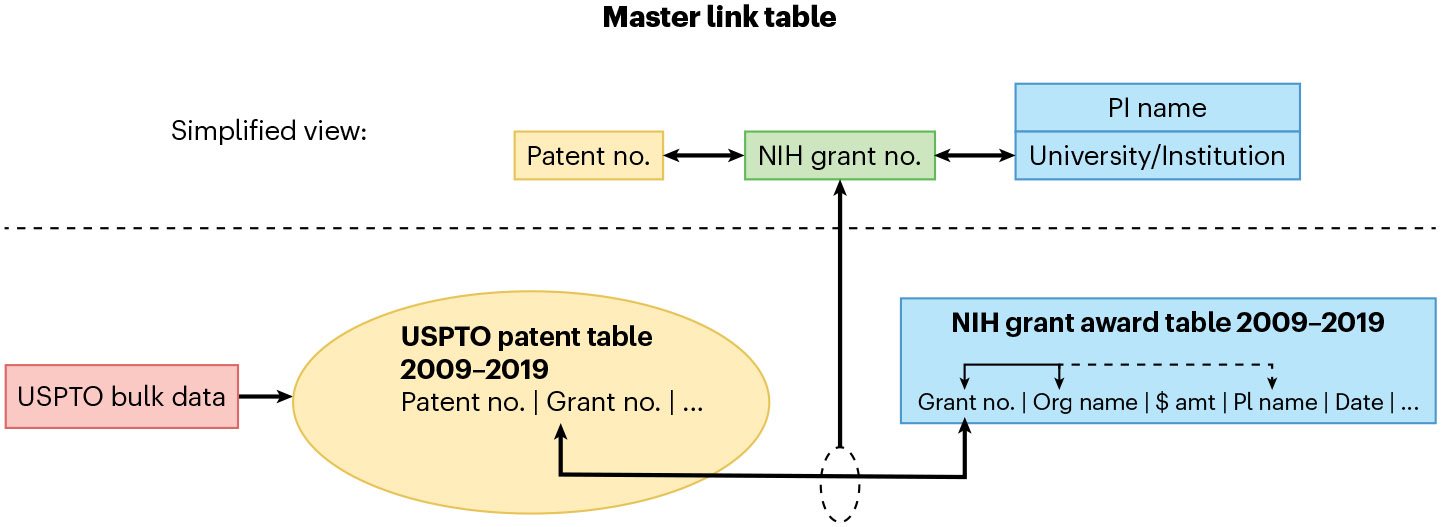
Patents that cite NIH support are linked to specific NIH awards.
The patent_contractawardnumber data contain the award numbers as they are listed in the patent, which are recorded in a non-standardized fashion. For example, the NIH Core Project Number (NIH-CPN) R01CA012345 may be recorded as R-01 CA 012345, CA2345 or, ambiguously, as 012345. Additionally, one patent may be associated with more than one NIH award. A parsing operation was performed to extract the NIH activity codes, institute and center abbreviations, and award numbers, then the parsed values were recorded using the standardized NIH-CPN scheme used in the NIH award dataset. A patent was considered to be ‘linked’ when the patent number was unambiguously associated with at least one NIH award record in our NIH award dataset using a common NIH-CPN.
Validly formatted or recoverable award numbers from the patent_contractawardnumber dataset were resolved to a single NIH-CPN; the remainder did not contain sufficient information to uniquely identify a NIH-CPN. Contributing factors varied but commonly a notation that NIH funding was received was included without specifying an award number. Less commonly, the award number was inaccurately or incompletely transcribed. For example, several patents listed only a number in the Government Interest section without any activity type or awarding institute or center (for example, ‘012345’ instead of ‘R01CA012345’).
After the linking process was completed, it was then possible to study patent production based on any field that is present in the NIH award table (such as university or institution name, PI name or region). For example, the master link table can be queried to return all the patent numbers linked to NIH awards associated with the ‘Massachusetts Institute of Technology’.
Inclusion criteria.
Each institution included in subsequent analysis must meet both of the following criteria: (1) at least 15 issued patents that cite NIH support; and (2) received at least $40 million in total NIH funding throughout the study period. Institutions that met these criteria tended to be large research universities that meet the Carnegie ‘R1: very high research activity’ designation. The remaining institutions tended to be large corporations and quasi-commercial research institutions (for example, the Broad Institute or Salk Institute).
Preliminary calculations of total institutional funding.
NIH RePORTER project data were used to aggregate and sum all funding that was received by each institution. The sum of the ‘Total_Cost’ column for each institution was computed for the study period. This methodology included all funding that was received by an entity regardless of funding mechanism (that is, including grants, cooperative agreements and contracts) and therefore may differ from other published sources.
Patent count calculation.
To compute this value, the master link table was used to find the total number of unique patents that were associated with each institution. Only utility patents issued during the study period were included.
TR calculation.
For each institution, total institutional funding was divided by the patent count to compute the TR.
Economy of scale summary analysis.
Included institutions were then ranked by total institutional funding and divided into three groups that contained an equal number of members (high funding, moderate funding and low funding), based on their position in the ranked list. The mean and median of the TRs for each group was then calculated and subsequently evaluated for statistical differences. Mean and median values were also computed for other available fields, such as total patents and total indirect funding, within each group.
Statistical analysis.
Comparisons between groups were evaluated using the nonparametric Kruskal–Wallis test unless otherwise specified. The analysis was performed using R software version 3.6.3.
Indirect cost analysis.
For each institution that met inclusion criteria, the ‘On Campus–Organized Research’ facilities and administrative rate was obtained by either: (1) examining the ‘Colleges and Universities Rate Agreement Form’ in effect for each institution during the study period; or (2) using the response from a Freedom of Information Act request submitted to the US Department of Health and Human Services. This request disclosed annualized rate data for 134 entities for the study period. A time-weighted average was calculated using the available data from these two sources, which in some cases accounted only for a portion of the study period. A listing of all values can be found in Supplementary Table 1. These rates are used by the NIH to calculate the facilities and administrative component of each award, and the rates are negotiated between the institution and either the Department of Health and Human Services or the Office of Naval Research.
Indirect cost rate calculations.
Included institutions were ranked by indirect cost rates in descending order. This list was then divided in half to form two groups that each contain an equal number of members: high indirect-cost rate institutions, and low indirect-cost rate institutions. The mean and median of the TRs for each group was then calculated and evaluated for statistical differences using the nonparametric Kruskal–Wallis test.
Engineering-unit funding analysis.
The NSF HERD dataset was used to compute the sum total of each institution’s engineering department budget during the years 2016–2019. Specifically, the following table was loaded into a SQL database and used to compute total engineering department budgets: ‘Table 55. Higher education R&D expenditures in engineering subfields, ranked by all FY [fiscal year] 2018 engineering R&D: FYs 2016–2018 and by subfield for FY 2018’. Institutions included in this analysis met both the previously defined inclusion criteria and also responded to the HERD survey.
Included institutions were ranked by total engineering-unit budget in descending order. This list was divided into two groups, each with an equal number of members: high funding and low funding. Similar to previous analyses, the mean and median of the TRs for each group was then calculated and evaluated for statistical differences using the non-parametric Kruskal–Wallis test.
NIH PI analysis.
The master link table was used to generate a new table (‘patent_to_pi_id’) that contains all NIH awards linked to patents. This table contains three fields: the NIH award number (NIH-CPN), patent number and the PI ID. The PI ID is an identification number assigned by the NIH to each PI who receives an NIH funding award. We assumed that each PI in the NIH dataset is represented by a single and unique PI ID. In cases in which more than one PI ID was listed for a single NIH award cited by a patent, all PI IDs were awarded ‘credit’ for that patent.
Using the new table (patent_to_pi_id), the total number of patents associated with each PI ID was found and a list was created that ranked PI IDs in descending order on the basis of the number of associated patents. The number of PIs with 0, 1, 2–10, 11–20, 21–30, 31–40, 41–50, 51–60, 61–70, 71–80, 81–90, 91–100, and greater than 100 associated patents was then computed. Finally, by moving from highest to lowest along the list, the number of the ‘highest-performing’ PIs that were required to account for 50% of the total number of NIH-associated patents was computed.
Supplementary Material
Acknowledgements
The authors thank M. Friedlander for his review of an early draft of this manuscript; A. Tegge for her assistance in preparing the statistical analysis portion of the manuscript; and L. LaConte for her guidance with this project. Funding was provided by NIH grant R01HL056728 (R.G.), NIH grant R01HL141855 (R.G.) and NIH grant R35HL161237-01 (R.G.).
Footnotes
Competing interests
The authors declare no competing interests.
Supplementary information The online version contains supplementary material available at https://doi.org/10.1038/s41587-023-01890-w.
Data availability
All data and materials used in analysis are publicly available from the sources listed in the ‘Material and methods’ section.
References
- 1.Agrawal A & Henderson R Manage. Sci 48, 44–60 (2002). [Google Scholar]
- 2.Ambos TC J. Manage. Stud 45, 1424–1447 (2008). [Google Scholar]
- 3.Auerswald PE & Branscomb LM J. Technol. Transf 28, 227–239 (2003). [Google Scholar]
- 4.Huang WL Sci. Public Policy 38, 463–479 (2011). [Google Scholar]
- 5.Ponomariov B. J. Technol. Transf 38, 749–767 (2013). [Google Scholar]
- 6.Rossini A. Bridging the technological “valley of death”. pwc.no, https://www.pwc.no/en/bridging-the-technological-valley-of-death.html (11 June 2018). [Google Scholar]
- 7.Rai AK & Sampat BN Nat. Biotechnol 30, 953–956 (2012). [DOI] [PMC free article] [PubMed] [Google Scholar]
- 8.Thursby JG & Thursby MC Manage. Sci 48, 90–104 (2002). [Google Scholar]
- 9.Drivas K. J. Eng. Technol. Manage 40, 45–63 (2016). [Google Scholar]
- 10.Griliches Z. J. Econ. Lit 28, 1661–1707 (1990). [Google Scholar]
- 11.Salter AJ & Martin BR Res. Policy 30, 509–532 (2001). [Google Scholar]
- 12.Lach S & Schankerman M RAND J. Econ 39, 403–433 (2008). [Google Scholar]
- 13.Audretsch DB & Kayalar-Erdem D in Handbook of Entrepreneurship Research (eds Alvarez SA et al. ) 97–118 (Springer, 2005). [Google Scholar]
- 14.Carayol N. Econ. Innov. New Technol 16, 119–138 (2007). [Google Scholar]
- 15.Stephan PE Econ. Innov. New Technol 16, 71–99 (2007). [Google Scholar]
- 16.US National Institutes of Health. Frequently asked questions. nih.gov, https://report.nih.gov/faqs (accessed 01 July 2023).
- 17.US Government Accountability Office. Technology Transfer: Reporting Requirements for Federally Sponsored Invention Need Revision (GAO, 1999). [Google Scholar]
- 18.Franzoni C. Ind. Corp. Change 18, 671–699 (2009). [Google Scholar]
- 19.Wright BD, Drivas K, Lei Z & Merrill SA Nature 507, 297–299 (2014). [DOI] [PubMed] [Google Scholar]
- 20.Brockhaus R & Horwitz P in Entrepreneurship: Critical Perspectives on Business and Management (ed. Krueger N) 260–279 (Routledge, 2002). [Google Scholar]
- 21.Mills A. Fix science, don’t just fund it. innovationfrontier.org, https://innovationfrontier.org/fix-science-dont-just-fund-it/ (16 September 2021). [Google Scholar]
- 22.Hobin JA et al. J. Transl. Med 10, 72 (2012). [DOI] [PMC free article] [PubMed] [Google Scholar]
- 23.Bercovitz J & Feldman M Organ. Sci 19, 69–89 (2008). [Google Scholar]
- 24.Bican PM et al. J. Knowl. Manage 21, 1384–1405 (2017). [Google Scholar]
- 25.US Government Accountability Office. National Institutes of Health: Better Data will Improve Understanding of Federal Contributions to Drug Development (GAO, 2023). [Google Scholar]
- 26.Mowery DC & Ziedonis AA The Geographic Reach of Market and Non-Market Channels of Technology Transfer: Comparing Citations and Licenses of University Patents (Working Paper 8568) (NBER, 2001). [Google Scholar]
Associated Data
This section collects any data citations, data availability statements, or supplementary materials included in this article.
Supplementary Materials
Data Availability Statement
All data and materials used in analysis are publicly available from the sources listed in the ‘Material and methods’ section.


