

Abstract
Background.
Rural cancer patients receive lower-quality care and experience worse outcomes than urban patients. Commission on Cancer (CoC) accreditation requires hospitals to monitor performance on evidence-based quality measuresPlease confirm the list of authors is correc, but the impact of accreditation is not clear due to lack of data from non-accredited facilities and confounding between patient rurality and hospital accreditation, rurality, and size.
Methods.
This retrospective, observational study assessed associations between rurality, accreditation, size, and performance rates for four CoC quality measures (breast radiation, breast chemotherapy, colon chemotherapy, colon nodal yield). Iowa Cancer Registry data were queried to identify all eligible patients diagnosed between 2011 and 2017. Cases were assigned to the surgery hospital to calculate performance rates. Univariate and multivariate regression models were fitted to identify patient- and hospital-level predictors and assess trends.
Results.
The study cohort included 10,381 patients; 46% were rural. Compared with urban patients, rural patients more often received treatment at small, rural, and non-accredited facilities (p < 0.001 for all). Rural hospitals had fewer beds and were far less likely to be CoC-accredited than urban hospitals (p < 0.001 for all). On multivariate analysis, CoC accreditation was the strongest, independent predictor of higher hospital performance for all quality measures evaluated (p < 0.05 in each model). Performance rates significantly improved over time only for the colon nodal yield quality measure, and only in urban hospitals.
Conclusions.
CoC accreditation requires monitoring and evaluating performance on quality measures, which likely contributes to better performance on these measures. Efforts to support rural hospital accreditation may improve existing disparities in rural cancer treatment and outcomes.
Overall cancer mortality is significantly worse among the 60 million rural residents in the US despite similar cancer incidence between rural and urban populations1. The challenges rural patients face in receiving high-quality care (measured in terms of travel time and distance, clinical trial participation, receipt of genetic testing, care under a specialty-trained physician and/or multidisciplinary team, receipt of guideline-recommended treatments or follow-up and supportive services), as well as the challenges rural hospitals face in providing high-quality care (measured in terms of size, volume, advanced technologies, diagnostic services, compliance with guideline-recommended treatment), are well documented2–20.
For almost 20 years, the American College of Surgeons Commission on Cancer (CoC) have assessed the quality of their accredited cancer programs using a framework of evidence-based standards21. This strategy has been shown to improve care for cancer patients over time, even those residing in under-resourced, rural areas22. Based on the principle that the first step to improvement is measurement, the CoC requires their programs to not only monitor but also meet performance thresholds for several established disease-specific quality measures23–25. Hospitals and cancer programs submit case reports on all newly diagnosed cancer patients to the National Cancer Database (NCDB) where a computational algorithm identifies the patients eligible for each quality measure and categorizes them as compliant or non-compliant to that metric26,27. Once calculated, the hospital-level performance rate (i.e. percentage compliant) for each quality measure is provided to CoC-accredited programs as feedback and a comparative benchmark for quality improvement28.
Studies using the NCDB have reported improved compliance with quality measures over time in CoC-accredited hospitals29–33 as well as an association between performance and overall survival for at least one quality measure30,34. However, it is difficult to ascertain to what extent accreditation itself contributes to improving quality, in part because of the challenges in assessing performance in non-accredited hospitals that do not self-report data35. Although the NCDB encompasses approximately 30% of hospitals and 70% of newly diagnosed cancer cases in the US, 100% of the included hospitals are CoC-accredited, and therefore these data cannot be used to directly evaluate the effect of accreditation27. Recent evidence points to poorer performance in at least one quality measure for non-accredited hospitals compared with CoC-accredited hospitals22,36, however it is unclear to what extent performance is related to accreditation itself or reflects other differences between accredited and non-accredited hospitals. For example, the majority of CoC-accredited hospitals are located in urban areas, resulting in marked underrepresentation of rural cancer patients and rural hospitals in the database37–39. Indeed, fewer than 10% of nonmetro/rural hospitals are currently accredited by the CoC.40 In addition, accredited hospitals tend to be large, high-volume hospitals and concentrated in specific census divisons38,39. There is also evidence that rural cancer patients are more likely to receive treatment in smaller hospitals, whether measured by bed size or volume15,41,42.
Given the related nature of these factors and a paucity of data for non-accredited hospitals, it is unclear to what extent hospital accreditation status, hospital rurality, hospital size, and patient rurality independently predict compliance to quality measures. In this paper, we use data from the Iowa Cancer Registry to answer this question, as it captures data on all Iowans diagnosed with cancer regardless of where they are treated and is therefore able to tease apart these variables.
METHODS
Data Source
The Iowa Cancer Registry has been a member of the National Cancer Institute’s Surveillance, Epidemiology, and End Results (SEER) Program since its inception in 197343. Every case of malignant or in situ cancer diagnosed or treated within its catchment area (i.e., residents of the state of Iowa) is identified, recorded, and followed. Trained tumor registrars routinely abstract patient-level demographics, disease and tumor characteristics, information on first course of therapy, and outcomes data from hospitals, pathology laboratories, cancer treatment centers, dermatology clinics and Iowa death certificates. These data elements, formatted according to the North American Association of Central Cancer Registries (NAACCR) Data Standards, are submitted bi-annually to the SEER Program and, along with data from the other registries, provide estimates of cancer incidence and survival in the US. Each year since the inception of certification criteria, the Iowa Cancer Registry has achieved NAACCR’s highest Gold Certification standard for its complete, accurate, and timely data44.
Commission on Cancer Quality Measures and Case Selection
Although measures currently exist for 10 cancer sites (bladder, breast, cervix, colon, endometrium, gastric, kidney, lung, ovary, rectum), breast and colon measures were chosen for this study because of their high incidence and because they are more commonly treated at rural or non-accredited hospitals compared with more rare cancers. Of the breast and colon measures, the following four were selected: breast radiation, breast chemotherapy, colon chemotherapy, and colon nodal yield (Table 1). Each is endorsed by the National Quality Forum45 and categorized by the CoC as an ‘accountability’ or ‘quality improvement’ measure24. In addition, the measures are well-established, having been released to cancer programs since 200625. Finally, and most importantly, for the purposes of this study, these quality measures are able to be calculated from reliable and validated data elements routinely collected by all SEER registries.
TABLE 1.
Description and acceptable performance rate threshold for four Commission on Cancer quality measures
| Site and treatment | Description of the measure | Performance rate |
|---|---|---|
| Breast radiation | Radiation therapy administered within 1 year of diagnosis for women < 70 years of age receiving breast-conserving surgery for breast cancer | 90% |
| Breast chemotherapy | Combination chemotherapy recommended or administered within 4 months of diagnosis for women < 70 years of age with AJCC T1cN0M0 or stage IB–III hormone receptor-negative breast cancer who received primary tumor resection | |
| Colon chemotherapy | Adjuvant chemotherapy recommended or administered within 4 months of diagnosis for patients < 80 years of age with AJCC stage III (lymph node-positive) colon cancer who received primary tumor resection | |
| Colon nodal yield | At least 12 regional lymph nodes removed and pathologically examined for resected colon cancer | 85% |
AJCC American Joint Committee on Cancer
Cases were identified from the Iowa Cancer Registry data and included adult patients diagnosed between 2011 and 2017 with breast or colon cancer. Additional criteria and specific SEER variables used to determine eligibility for each measure (i.e., denominator of the performance rate) are detailed in the Appendix, along with the algorithm used to identify patients compliant with the quality measure (i.e., numerator of the performance rate).
CoC quality measures are based on the treatments received by patients and performance rates are calculated at the hospital level24. In this study, patients were assigned to the hospital where surgery was performed. If multiple hospitals performed surgeries, the hospital that performed the highest level of surgery was chosen. Manual review of abstracts was conducted for cases where the surgery hospital could not be identified from structured data elements. Those that could not be matched to a surgery hospital were excluded from the study.
Variables
Patient and hospital characteristics were extracted from the Iowa Cancer Registry data. Patient-level demographic variables included age at diagnosis, sex, race, marital status at diagnosis, year of diagnosis, residence (rurality of county), and insurance (primary payor). Tumor characteristic variables included cancer site, stage, and grade, while hospital characteristics included location (rurality of county), size, CoC-accreditation status, and Critical Access Hospital designation status. County rurality was defined using US Department of Agriculture’s Rural-Urban Continuum Codes (RUCCs) and categorized as urban if they were fully or partially located in a metropolitan area (RUCCs 1–3); all other counties were categorized as rural (RUCCs 4–9). Hospital size was categorized as having < 100, 100–249, 250–499, or 500+ beds. Key predictors included patient rurality, hospital rurality, CoC-accreditation status, and hospital size.
Statistical Analyses
Descriptive analysis was used to compare patient and hospital characteristics across the four quality measures. Bivariate associations between patient and hospital characteristics were also assessed. Performance rates for each of the quality measures was estimated by hospital rurality and accreditation status with standard errors clustered at the hospital-level. Logistic regression models were fitted to estimate the odds of concordance with the quality measure: individual univariate models for each of the key predictor variables and a multivariate model with all four. Ordinary least squares regression models were fitted to estimate changes in performance rates over time by hospital accreditation status and rurality. Standard errors for all the regression models were clustered at the hospital level. Statistical tests were two-tailed, with the significance level set at 5%. Analyses were performed using Stata Statistical Software, Release 15 (StataCorp LLC, College Station, TX, USA). This study was reviewed and approved by our Institutional Review Board.
RESULTS
The final analytic cohort included 10,381 patients (Table 2). Of these, 4585 were eligible to be evaluated in the breast radiation measure, 871 in the breast chemotherapy measure, 996 in the colon chemotherapy measure, and 5320 in the colon nodal yield measure. Some patients were eligible for more than one measure; 396 patients were assessed in both breast measures and 995 in the two colon measures. Overall, colon cancer patients tended to be older than breast cancer patients at the time of diagnosis and were also more likely to be separated/divorced/widowed. Almost all patients were White (97%) and the vast majority (90%) were covered by either Medicare and/or private health insurance. Almost half of the patients (46%) resided in a rural county. A total of 116 hospitals provided cancer surgery for the analytic cohort. Most (63%) were rural and had <100 beds (70%). Only 19% of the hospitals were CoC-accredited (results not shown).
TABLE 2.
Characteristics of patients included in the full sample and cohorts, for each quality measure
| Full sample n (%) | Breast radiation n (%) | Breast chemotherapy n (%) | Colon chemotherapy n (%) | Colon nodal yield n (%) | |
|---|---|---|---|---|---|
| Sample size | 10,381 | 4585 | 871 | 996 | 5320 |
| Rural patient | |||||
| No | 5635 (54.3) | 2739 (59.7) | 493 (56.6) | 514 (51.6) | 2646 (49.7) |
| Yes | 4746 (45.7) | 1846 (40.3) | 378 (43.4) | 482 (48.4) | 2674 (50.3) |
| Age at diagnosis | |||||
| Mean (median) | 64.4 (64) | 57.4 (59) | 53.7 (55) | 62.3 (64) | 71.5 (74) |
| Range | 19–106 | 22–69 | 24–69 | 19–79 | 19–106 |
| Sex | |||||
| Male | 2457 (23.7) | 0 (0) | 0 (0) | 528 (53.0) | 2456 (46.2) |
| Female | 7924 (76.3) | 4585 (100) | 871 (100) | 468 (47.0) | 2864 (53.8) |
| Site | |||||
| Breast | 5060 (48.7) | 4585 (100) | 871 (100) | 0 (0) | 0 (0) |
| Colon | 5321 (51.3) | 0 (0) | 0 (0) | 996 (100) | 5320 (100) |
| Stage | |||||
| I | 4840 (46.6) | 3216 (70.1) | 280 (32.1) | 0 (0) | 1506 (28.3) |
| II | 3483 (33.6) | 1216 (26.5) | 465 (53.4) | 0 (0) | 2022 (38.0) |
| III | 2058 (19.8) | 153 (3.3) | 126 (14.5) | 996 (100) | 1792 (33.7) |
| Grade | |||||
| 1–2 (low) | 7328 (70.6) | 3259 (71.1) | 114 (13.1) | 698 (70.1) | 4006 (75.3) |
| 3–4 (high) | 2856 (27.5) | 1235 (26.9) | 743 (85.3) | 282 (28.3) | 1220 (22.9) |
| Unknown | 197 (1.9) | 91 (2.0) | 14 (1.6) | 16 (1.6) | 94 (1.8) |
| Race | |||||
| Non-White | 306 (2.9) | 151 (3.3) | 53 (6.1) | 37 (3.7) | 128 (2.4) |
| White | 10,075 (97.1) | 4434 (96.7) | 818 (93.9) | 959 (96.3) | 5192 (97.6) |
| Marital status | |||||
| Married/domestic partner | 6593 (63.5) | 3245 (70.8) | 596 (68.4) | 637 (64.0) | 3027 (56.9) |
| Separated/divorced/widowed | 2476 (23.9) | 759 (16.6) | 160 (18.4) | 208 (20.9) | 1633 (30.7) |
| Single (never married) | 1065 (10.3) | 496 (10.8) | 104 (11.9) | 127 (12.8) | 505 (9.5) |
| Unknown | 247 (2.4) | 85 (1.9) | 11 (1.3) | 24 (2.4) | 155 (2.9) |
| Primary payor | |||||
| Private insurance | 4735 (45.6) | 3072 (67.0) | 605 (69.5) | 431 (43.3) | 1315 (24.7) |
| Public insurance, no Medicaid | 4627 (44.6) | 1081 (23.6) | 153 (17.6) | 447 (44.9) | 3484 (65.5) |
| Public insurance, any/all Medicaid | 314 (3.0) | 82 (1.8) | 19 (2.2) | 32 (3.2) | 222 (4.2) |
| Public insurance, Medicaid NOS | 442 (4.3) | 236 (5.1) | 68 (7.8) | 55 (5.5) | 165 (3.1) |
| Uninsured | 102 (1.0) | 47 (1.0) | 11 (1.3) | 16 (1.6) | 49 (0.9) |
| Unknown | 161 (1.6) | 67 (1.5) | 15 (1.7) | 15 (1.5) | 85 (1.6) |
Data are expressed as n (%) unless otherwise specified
NOS not otherwise specified
Patient residential location was strongly associated with treatment facility type. Rural patients received treatment less often in an urban hospital (53% vs. 99%, p < 0.001) or CoC-accredited hospital (56% vs. 77%, p < 0.001) than urban patients (Fig. 1). In addition, rural patients were more likely to be treated at a hospital with < 100 beds (28% vs, 3%, p < 0.001) or a Critical Access Hospital (16% vs. 1%, p < 0.001; results not shown) than their urban counterparts. These differences were just as pronounced by hospital location. Very few of the rural hospitals (3%) had achieved CoC accreditation, compared with 47% of the urban hospitals (p < 0.001). Rural hospitals also treated larger proportions (99%) of rural patients and were more likely (93%) to have <100 beds than urban hospitals (31% and 30%, respectively; both p < 0.001). Only urban hospitals had 500+ beds, all of which were also CoC accredited.
FIG. 1.
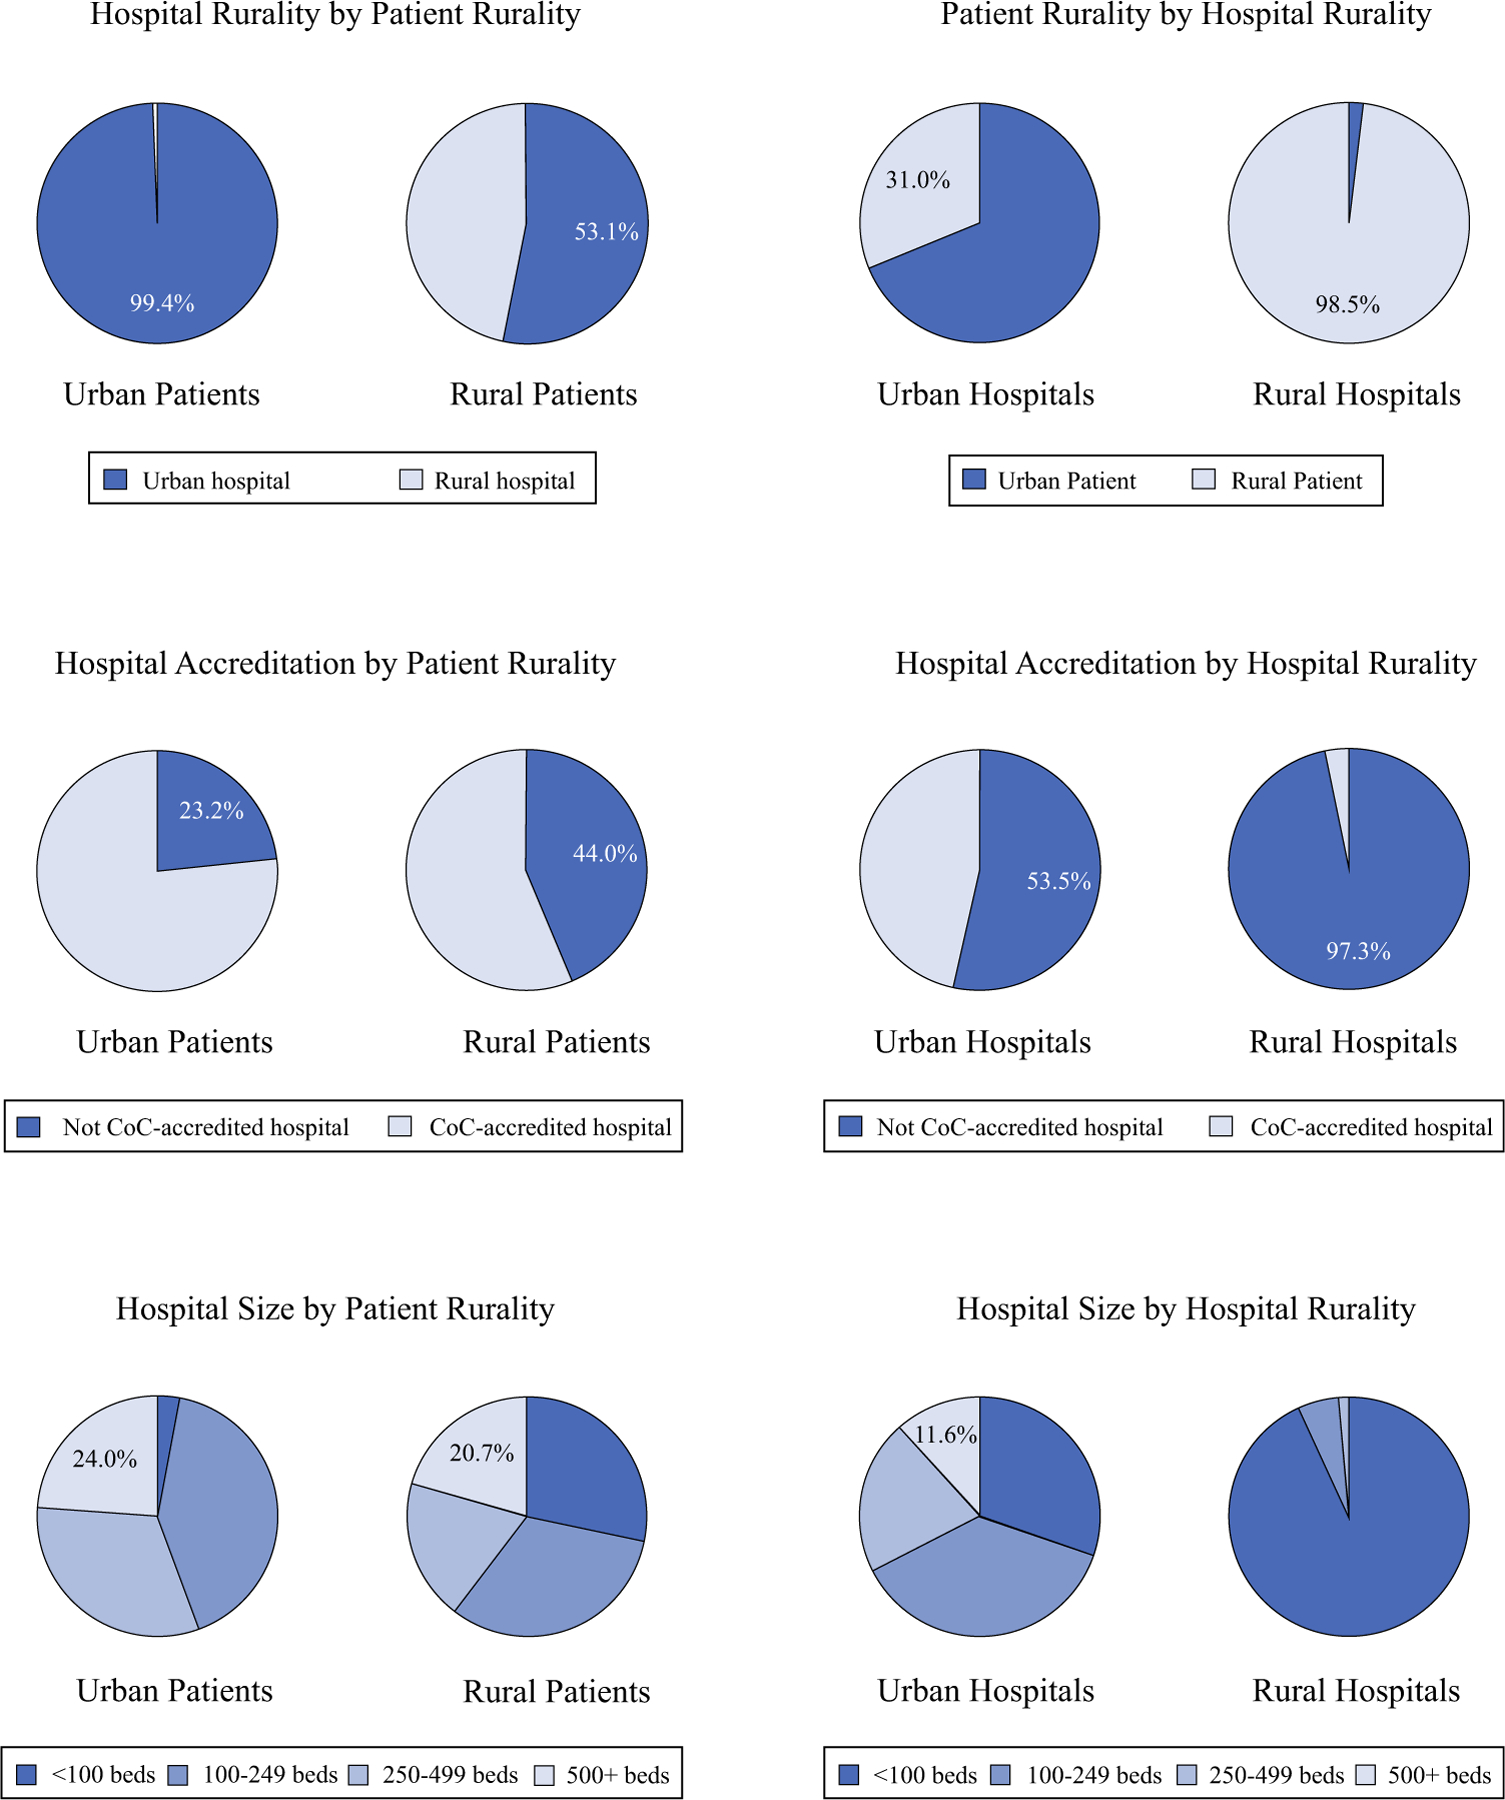
Bivariate associations between patient rurality, hospital rurality, hospital CoC accreditation status, and hospital size. CoC Commission on Cancer
In general, performance rates were worse for rural hospitals (compared with urban hospitals) and non-accredited hospitals (compared with accredited hospitals). Even so, the differences were more pronounced by hospital accreditation status than rurality. Indeed, rural, CoC-accredited hospitals consistently outperformed urban, non-accredited facilities (Fig. 2). With regard to individual measures, the best performance was observed for the breast radiation measure, with performance rates equal to or greater than the 90% acceptable threshold set by the CoC for all facility types. In contrast, only CoC-accredited hospitals met the expected 85% performance rate for the colon nodal yield measure. Accredited hospitals located in rural counties performed 2.6 percentage points worse than those in urban counties (p = 0.091), a far smaller, absolute difference than the 14.9 percentage-point discrepancy in performance between accredited and non-accredited hospitals for this quality measure (p < 0.001, results not shown).
FIG. 2.
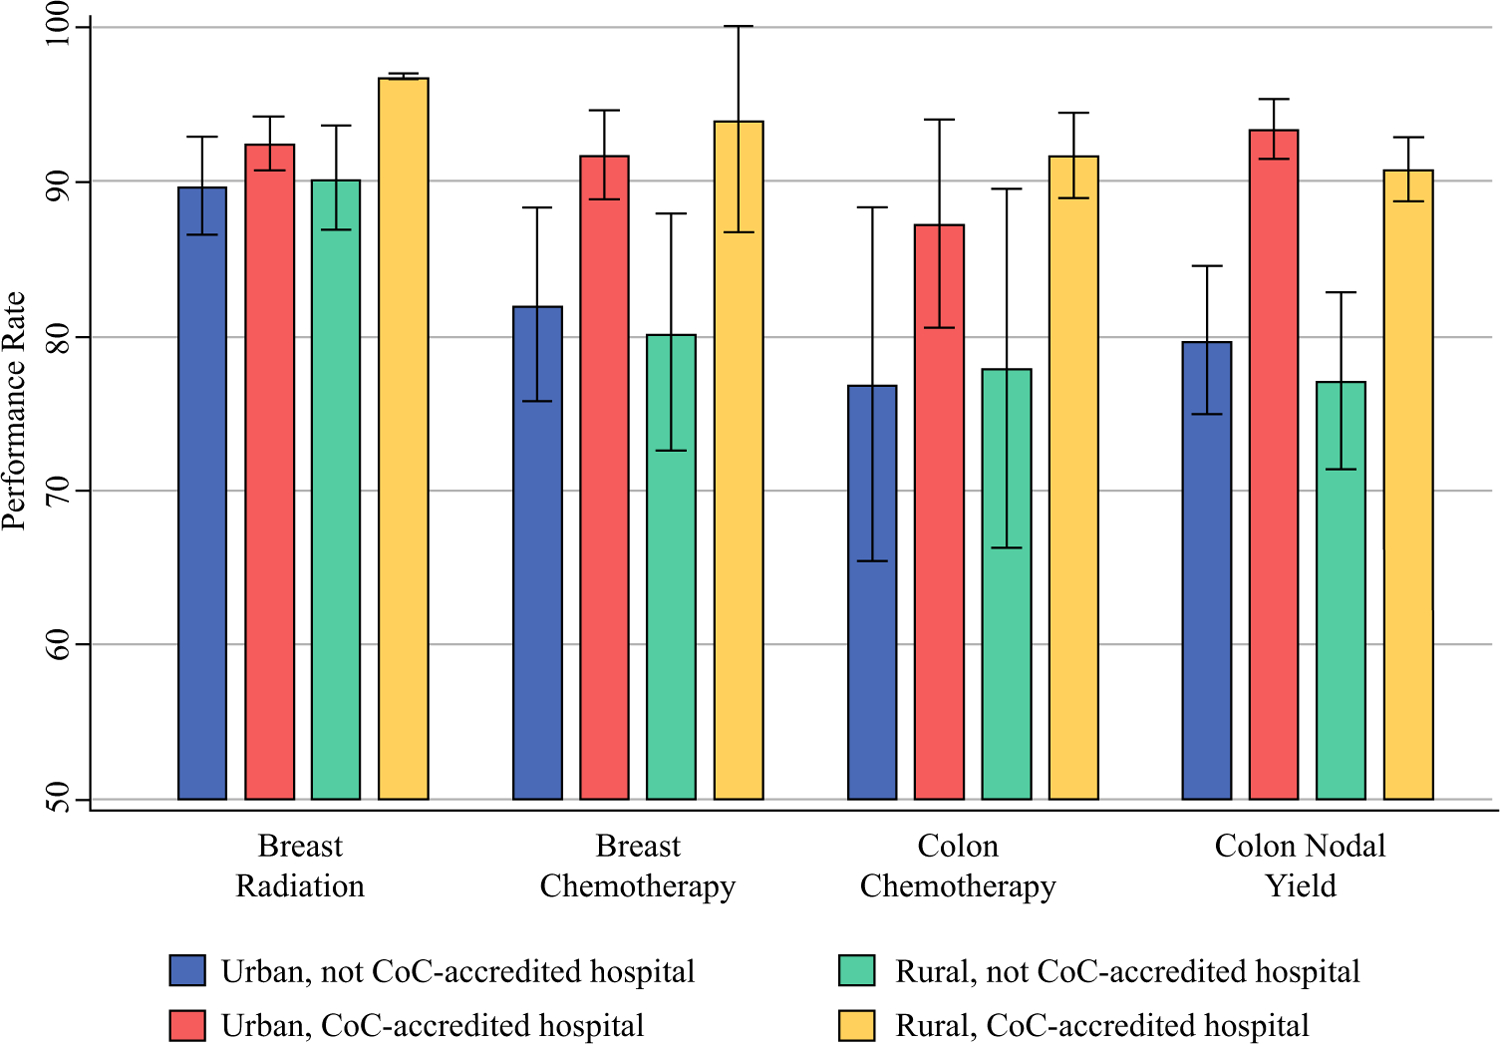
Performance rates for four quality measures by hospital rurality and CoC accreditation status. CoC Commission on Cancer
Results from univariate logistic regression models also indicate that hospital accreditation status was significantly associated with performance rates for all four quality measures (Table 3). Odds ratios (ORs) of compliance with the measures for patients treated at CoC-accredited hospitals (compared with those treated at non-accredited hospitals) ranged from 1.44 (95% confidence interval [CI] 1.01–2.05, p = 0.046) for the breast radiation measure to 3.78 (95% CI 2.63–5.44, p < 0.001) for the colon nodal yield measure. Hospital rurality and size were also significant predictors of performance for the colon nodal yield measure.
TABLE 3.
Univariate and multivariate logistic regressions: odds of complying with quality measure, by hospital and patient characteristics
| Univariate |
Multivariatea |
|||||
|---|---|---|---|---|---|---|
| OR | 95% CI | p-Value | OR | 95% CI | p-Value | |
| Breast radiation | ||||||
| CoC accreditation | 1.44 | 1.01–2.05 | 0.046 | 1.53 | 1.05–2.24 | 0.027 |
| Rural hospital | 1.06 | 0.64–1.75 | 0.820 | 1.19 | 0.73–1.93 | 0.482 |
| Rural patient | 1.20 | 0.89–1.61 | 0.229 | 1.21 | 0.91–1.60 | 0.183 |
| Hospital size <100 beds | 0.87 | 0.53–1.43 | 0.574 | 0.93 | 0.55–1.56 | 0.771 |
| Breast chemotherapy | ||||||
| CoC accreditation | 2.60 | 1.61–4.22 | <0.001 | 2.71 | 1.57–4.68 | <0.001 |
| Rural hospital | 0.64 | 0.31–1.33 | 0.236 | 1.06 | 0.48–2.37 | 0.883 |
| Rural patient | 0.72 | 0.49–1.07 | 0.107 | 0.79 | 0.52–1.20 | 0.265 |
| Hospital size <100 beds | 0.64 | 0.37–1.13 | 0.124 | 1.26 | 0.57–2.76 | 0.564 |
| Colon chemotherapy | ||||||
| CoC accreditation | 2.08 | 1.01–4.29 | 0.048 | 2.40 | 1.10–5.20 | 0.030 |
| Rural hospital | 0.77 | 0.35–1.68 | 0.510 | 0.85 | 0.32–2.22 | 0.730 |
| Rural patient | 0.95 | 0.59–1.54 | 0.850 | 1.11 | 0.72–1.70 | 0.630 |
| Hospital size <100 beds | 0.89 | 0.40–1.96 | 0.770 | 1.63 | 0.57–4.68 | 0.360 |
| Colon nodal yield | ||||||
| CoC accreditation | 3.78 | 2.63–5.44 | <0.001 | 3.73 | 2.55–5.44 | <0.001 |
| Rural hospital | 0.43 | 0.26–0.73 | 0.002 | 0.59 | 0.38–0.92 | 0.019 |
| Rural patient | 0.68 | 0.47–1.00 | 0.051 | 1.12 | 0.87–1.44 | 0.399 |
| Hospital size <100 beds | 0.55 | 0.34–0.87 | 0.010 | 1.62 | 0.99–2.64 | 0.053 |
OR odds ratio, CI confidence interval, CoC Commission on Cancer
For multivariate analyses, all four variables were included in the same model. Standard errors for all models were clustered at the hospital level
On multivariate analysis with all four variables included in the same model, hospital accreditation status remained significant for all quality measures, with ORs ranging from 1.53 (95% CI 1.05–2.24, p = 0.027) for the breast radiation measure to 3.73 (95% CI 2.55–5.44, p < 0.001) for the colon nodal yield measure. Hospital rurality also remained significant for the colon nodal yield measure (OR 0.59, 95% CI 0.38–0.92, p = 0.019).
Performance rates were generally stable across time; only the colon nodal yield measure changed significantly over time (Fig. 3). From 2011 to 2017, performance rates for this quality measure increased at non-accredited facilities, with an absolute annual percentage change of 2.85 (95% CI 0.19–5.51, p = 0.037). Smaller increases were observed in accredited facilities (0.79, 95% CI 0.39–1.19, p = 0.001). Although the non-accredited hospitals experienced greater improvements in their performance rates during this time period (p < 0.001), accredited hospitals still outperformed the non-accredited hospitals every single year. Even so, by 2017, the performance rate for urban, non-accredited hospitals had surpassed the CoC’s acceptable threshold of 85% and was as high as the rural, accredited hospitals. No improvements were observed in the rural hospitals during this time period, regardless of accreditation status.
FIG. 3.
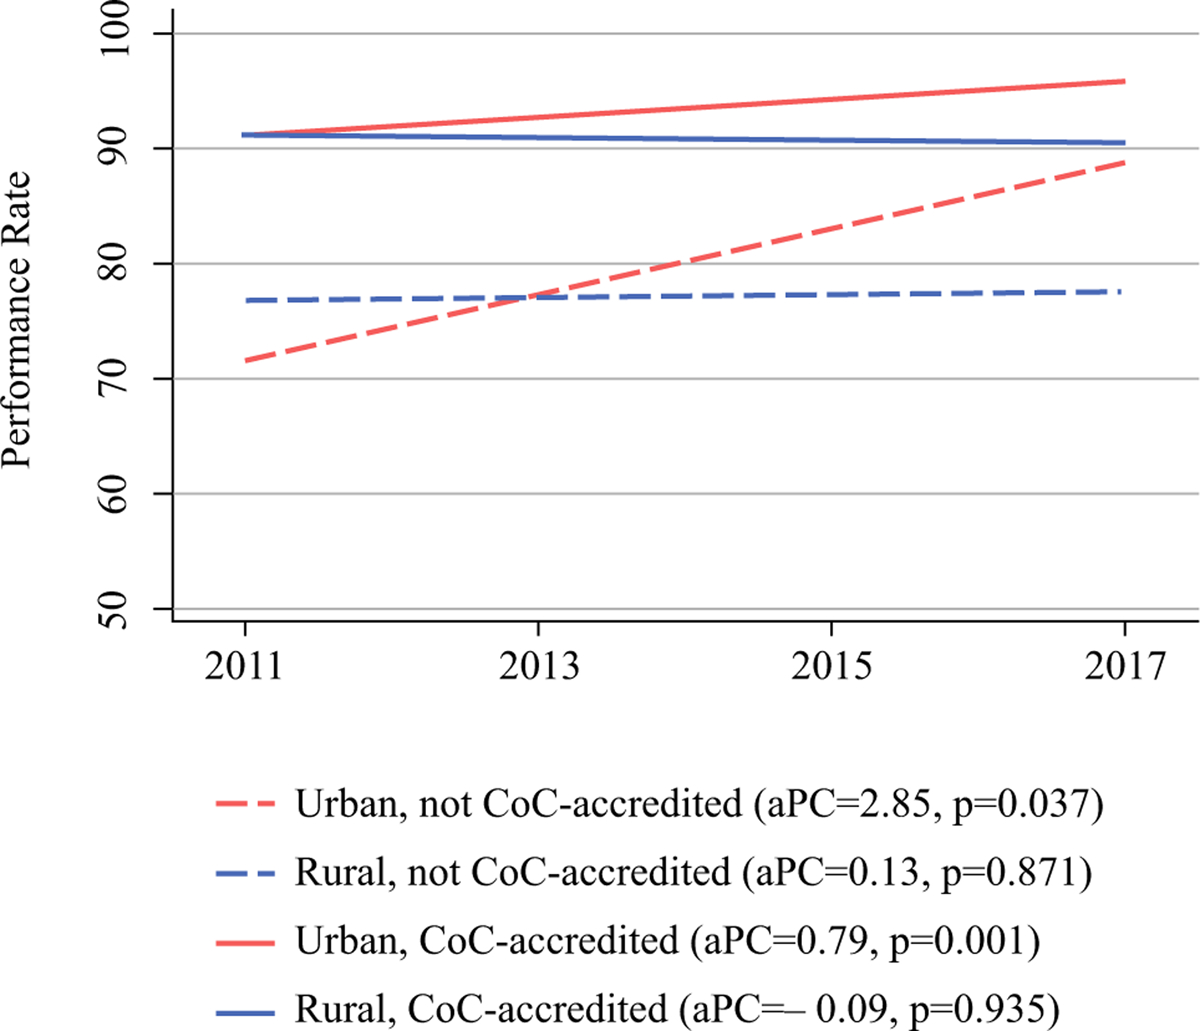
Performance rate over time for colon nodal yield quality measure by hospital rurality and CoC accreditation status. CoC Commission on Cancer, aPC annual percentage change
DISCUSSION
This is the first study to assess the impact of rurality and institutional, cancer-specific accreditation on compliance with evidence-based treatment guidelines for breast and colon cancer. We found that accreditation status was strongly associated with performance on all four quality measures examined, independent of hospital size and patient or hospital rurality. These results have implications for the 60 million individuals living in rural America, considering that people who reside in a rural county comprise 19% of the US population but only 2% of patients treated by CoC-accredited hospitals46,47. We found similar disparities in our data. Rural patients were less likely to receive treatment at an urban hospital than urban patients (53% vs, 99%). In addition, urban hospitals were more likely to have achieved CoC accreditation than rural hospitals (47% vs. 3%). Together, these findings support the benefit of accreditation for rural hospitals in improving the level of care for local residents while relieving travel burden for rural individuals seeking care at an accredited hospital.
Despite similar incidence rates, cancer mortality is significantly worse among rural residents than their urban counterparts1,48. Studies have shown that patients in rural areas face many challenges, including higher poverty rates, lower educational attainment, and a higher proportion of elderly individuals13,20. Specific to cancer care, rural patients endure longer travel times5,6, have limited access (whether directly or by referral) to specialty trained oncologists and diagnostic services4,7–10, and experience barriers to participation in clinical trials11,12. These patients are also more likely to be diagnosed at higher stages49,50 and less likely to receive guideline-recommended treatments or follow-up and supportive services3,13,14,16,17.
However, there is evidence that these negative outcomes are not intrinsic to the patient’s residential location. Unger et al. conducted a retrospective cohort analysis of pooled trial data and found that when enrolled in clinical trials and given the same quality of care, survival outcomes no longer differed between rural and urban patients11. Among other things, the authors advocate for improved travel resources to address this disparity. Unfortunately, studies show that, all else equal, patients prefer to be treated close to home51–53. Another strategy to replicate the type of protocol-driven care seen in clinical trials and improve access to high-quality care for rural patients could be accomplished through the standardization of infrastructure, processes, and services associated with accreditation. Data reporting and self-monitoring of guideline compliance, which are also key components of accreditation, have been attributed to improved performance on quality measures also22,30,34,36.
In our study, the lowest performance rate for rural hospitals was observed in the only measure that directly assessed surgical treatment quality (i.e., colon nodal yield). This corroborates findings from the California Cancer Registry, which found that rural patients were more likely than their urban counterparts to have an inadequate lymphadenectomy for colon cancer after correcting for other sociodemographic risk factors54. Using the NCDB to examine performance in CoC-accredited institutions only, Shulman et al. found that compliance with this measure varied by case volume and cancer program category, with the highest compliance observed in NCI-designated cancer centers and the lowest in community cancer centers30. Performance on this measure is dictated not only by the skill and training of the surgeon but also by the pathologist, specimen handling, and processing and documentation protocols, thus making it a good proxy for assessing the quality of multidisciplinary processes within an institution54. The association between compliance with this measure and overall survival also makes it a valuable indicator of quality30,55, and therefore the trends in performance we identified are particularly concerning. The improvement in colon yield seen in urban non-accredited hospitals over time may be related to higher volume and greater likelihood of surgical subspecialists in these institutions, both of which are associated with faster diffusion of evidence-based care29,42,56. Conversely, the lack of improvement for non-accredited, rural hospitals over time suggests that, for these facilities, the impact of accreditation may be particularly significant for this type of process-driven measure.
In the US, rural hospitals face significant challenges, including poor financial health, low occupancy, and difficulty recruiting and retaining surgeons57,58. Some rural hospitals have been designated as Critical Access Hospitals by Medicare in order to reduce their financial vulnerability, thus helping them remain viable and keeping essential services in rural communities. In Iowa, 81 of the 118 community hospitals are Critical Access Hospitals59,60. Even though a good portion of rural patients bypass the closest hospital for their cancer treatment (often to another rural hospital), this is less likely to be the case for surgery39,61. In our study, 16% of rural patients received their cancer surgery at a Critical Access Hospital, making them more vulnerable to receipt of non-guideline-concordant care. Although cancer center accreditation may not be feasible or appropriate for Critical Access Hospitals in general, rural centers treating >100 cancer cases a year could be targets for interventions that facilitate and support accreditation and allow them to act as regional centers of quality care.
There are several limitations to our study. Data from the registry are subject to reporting and abstracting error. Because patients were attributed to the surgery hospital when determining compliance data, it is possible they may have received adjuvant treatment at a CoC-accredited hospital even though they were categorized in the non-accredited group. In addition, there were only a small number of rural, accredited hospitals in our data. Finally, because attaining accreditation requires significant institutional commitment and resources, CoC accreditation may simply be a surrogate for a higher-achieving hospital rather than the actual driver of improved quality. It may also serve as a proxy for surgical procedure volume, which is itself associated with guideline-concordant treatment and better outcomes, and which we were unable to assess because this is not collected by the Iowa Cancer Registry. Although we were unable to account for all the institutional factors that impact quality, it is reassuring that accreditation status remained independently associated with performance after controlling for hospital size and rural location as well as patient rurality. Furthermore, as demonstrated by Tucker et al., achieving accreditation does appear to be associated with improved performance in several measures when comparing hospitals of similar size, analytic cancer cases, county population, and geographic region22.
CONCLUSIONS
Rural patients are at increased risk of receiving non-guideline-concordant cancer treatment, which may contribute to worse cancer outcomes in this population. In our study, CoC accreditation was independently associated with improved hospital performance across four quality measures for colon and breast cancer treatment. Interventions to support accreditation in rural hospitals could improve the quality of care afforded to rural patients.
FUNDING
This work was made possible by the National Cancer Institute/Holden Comprehensive Cancer Center (P30 CA086862) Oberley Award.
APPENDIX: Eligibility Criteria and Case Selection Definitions for Quality Measures
Breast Radiation Quality Measure (BCSRT):
Radiation therapy is administered within 1 year of diagnosis for women <70 receiving breast conserving surgery for breast cancer.
Measure Type: Accountability, National Quality Forum measure #0219
| Case Eligibility Criteria | |||
|---|---|---|---|
| Assessment | SEER Item | SEER Codes | |
| 1 | Diagnosis of breast cancer | Primary Site | C50.0, C50.1, C50.2, C50.3, C50.4, C50.5, C50.6, C50.8, C50.9 |
| 2 | Female patients only | Sex | 2 |
| 3 | Adult patient under the age of 70 at diagnosis | Age at Diagnosis | 18–69 |
| 4 | First or only diagnosis of malignant neoplasm | Sequence Number | 00 or 01 |
| 5 | Epithelial tumors which can be staged, according to the AJCC 7th Ed. (Excluding rare tumors: 8940 - Mixed tumor, malignant, NOS 8950 - Mullerian mixed tumor 8980 - Carcinosarcoma 8981 - Carcinosarcoma, embryonal) |
Histology | 8000-8576, 8941-8949 |
| 6 | Invasive tumors | Behavior Code | 3 |
| 7 | Exclude pathologic evidence of in situ or metastatic disease | Diagnosis years 2011–2015: Derived AJCC 7th stage group Diagnosis years 2016–2017: Derived SEER Combined stage group |
≠ 0, 4 (0, 0A, 0IS, 4, 4A, 4A1, 4A2, 4B, 4C) |
| Diagnosis years 2011–2015: Derived AJCC 7th M stage Diagnosis years 2016–2017: Derived SEER Combined M stage |
≠ (c1, c1A, c1B, c1C, c1D, c1E, p1, p1A, p1B, p1p, p1D, p1E, 1, 1A, 1B, 1C, 1D, 1E) | ||
| 8 | If Pathologic Stage Group is unknown, exclude clinical evidence of in situ or metastatic disease | Diagnosis years 2016–2017: Path stage group and clinical stage group |
If Pathologic Stage Group is unknown, Clinical Stage Group ≠ 0, 4 (0, 0A, 0IS, 4, 4A, 4A1, 4A2, 4B, 4C) |
| 9 | Receipt of Breast Conserving Surgery | Surgical Procedure of the Primary Site | 20–24 |
| 10 | Patient reported living within the treatment timeframe period of 365 days from date of diagnosis | Date of Initial Diagnosis | Exclude if have <365 days of follow-up and reported as died |
| Date of Last Contact or Death | |||
| Vital Status | |||
| Numerator Criteria | |||
| 11 | Radiation Therapy Administered within 365 days following Diagnosis | Radiation Treatment Modality | 20–32, 40–43, 50–55, 60–62, 98 AND # elapsed days between diagnosis and treatment ≤365 |
| Date of Initial Diagnosis | |||
| Date Radiation Therapy Started | |||
Breast Chemotherapy Quality Measure (MAC):
Combination chemotherapy is recommended or administered within 4 months of diagnosis for women <70 with AJCC T1cN0M0 or Stage IB-III hormone receptor negative breast cancer.
Measure Type: Accountability, National Quality Forum measure #0559
| Case Eligibility Criteria | |||
|---|---|---|---|
| Assessment | SEER Item | SEER Codes | |
| 1 | Diagnosis of breast cancer | Primary Site | C50.0, C50.1, C50.2, C50.3, C50.4, C50.5, C50.6, C50.8, C50.9 |
| 2 | Female patients only | Sex | 2 |
| 3 | Adult patient, age at diagnosis <70 | Age at Diagnosis | 18–69 |
| 4 | First or only diagnosis of malignant or non-malignant neoplasm | Sequence Number | 00 or 01 |
| 5 | Epithelial tumors which can be staged, according to the AJCC 7th Ed. (Excluding 8200 - adenoid cystic carcinoma, and excluding rare tumors: 8940 - Mixed tumor, malignant, NOS 8950 - Mullerian mixed tumor 8980 - Carcinosarcoma 8981 - Carcinosarcoma, embryonal) |
Histology | 8000-8199, 8201-8576, 8941-8949 |
| 6 | Invasive tumors | Behavior Code | 3 |
| 7 | Exclude pathologic evidence of in situ or metastatic disease | Diagnosis years 2011–2015: Derived AJCC 7th stage group Diagnosis years 2016–2017: Derived SEER Combined stage group |
≠ 0, 4 (0, 0A, 0IS, 4, 4A, 4A1, 4A2, 4B, 4C) |
| Diagnosis years 2011–2015: Derived AJCC 7th M stage Diagnosis years 2016–2017: Derived SEER Combined M stage |
≠ (c1, c1A, c1B, c1C, c1D, c1E, p1, p1A, p1B, p1p, p1D, p1E, 1, 1A, 1B, 1C, 1D, 1E) | ||
| 8 | If Pathologic Stage Group is unknown, exclude clinical evidence of in situ or metastatic disease | Diagnosis years 2016–2017: Path stage group and clinical stage group |
If Pathologic Stage Group is unknown, Clinical Stage Group ≠ 0, 4 (0, 0A, 0IS, 4, 4A, 4A1, 4A2, 4B, 4C) |
| 9 | Surgically treated | Surgical Procedure of the Primary Site | 20–90 |
| 10 | Patient reported living within the treatment timeframe period of 120 days from date of diagnosis | Date of Diagnosis | Exclude if have <120 days of follow-up and reported as died |
| Date of Last Contact or Death | |||
| Vital Status | |||
| 11 | AJCC T1cN0M0 tumor OR AJCC Stage IB-III tumor |
Pathologic N Diagnosis years 2011–2015: Derived AJCC 7th Pathologic N CS tumor size |
Pathologic N = (c0, p0, pI-, p0I-, pI+, p0I+, pM-, p0M-, pM+, p0M+, 0, 0I-, 0I+, 0M-, 0M+, 0A, 0B) AND [CS Tumor Size = (011-989, 992-995) or Tumor Size Summary = (011-989)] OR Pathologic N = (p1, p1M, p1MI, p1A, p1B, p1C, p2, p2A, p2B, p3, p3A, p3B, p3C, 1, 1A, 1B, 1C, 1MI, 2, 2A, 2B, 3, 3A, 3B, 3C) |
| Diagnosis years 2016–2017: Path N value Tumor size summary | |||
| 12 | Hormone Receptor Negative | CS Site Specific Factor 1 (Estrogen Receptor) |
Estrogen Receptor = 020 and Progesterone Receptor = 020, 030 OR Estrogen Receptor = 030 and Progesterone Receptor = 020 |
| CS Site Specific Factor 2 (Progesterone Receptor) | |||
| Numerator Criteria | |||
| 13 | Combination Chemotherapy administered within 120 days following diagnosis OR Chemotherapy Recommended, but not administered OR Starting in 2013, for HER2 positive cases: Chemotherapy and Immunotherapy both administered within 120 days following diagnosis, or single agent chemotherapy within 120 days of diagnosis and biologic response modifiers recommended |
Chemotherapy | Chemotherapy = 03 and # elapsed days between diagnosis and treatment ≤120 OR Chemotherapy = 82, 85, 86, 87 OR If diagnosis Year >2012 and HER2 (ssf15) = 010, (Chemotherapy = 02 and Immunotherapy = 01 and # elapsed days between diagnosis and treatment ≤120 OR Chemotherapy = 02 and Immunotherapy = 82, 85, 86, 87 and # elapsed days between diagnosis and treatment ≤120) |
| Date Chemotherapy Started | |||
| Date of Initial Diagnosis | |||
| CS Site Specific Factor 15 (HER2) | |||
| Immunotherapy | |||
| Date Immunotherapy Started | |||
Colon Chemotherapy Quality Measure (ACT):
Adjuvant chemotherapy is recommended or administered within 4 months of diagnosis for patients <80 with AJCC Stage III (lymph node positive) colon cancer.
Measure Type: Accountability, National Quality Forum measure #0223
| Case Eligibility Criteria | |||
|---|---|---|---|
| Assessment | SEER Item | SEER Codes | |
| 1 | Diagnosis of colon cancer | Primary Site | C18.0, C18.2, C18.3, C18.4, C18.5, C18.6, C18.7, C18.8, C18.9 |
| 2 | Adult patient age at diagnosis <80 | Age at Diagnosis | 18–79 |
| 3 | Male or Female Patient | Sex | 1, 2 |
| 4 | First or only diagnosis of malignant or non-malignant neoplasm | Sequence Number | 00 or 01 |
| 5 | Epithelial tumors which can be staged, according to the AJCC 7th Ed. | Histology | 8000-8152, 8154-8231, 8243-8245,8247-8248, 8250-8576, 8940-8950,8980-8981 |
| 6 | Invasive tumors | Behavior Code | 3 |
| 7 | Clinical or pathologic evidence of in situ disease or metastatic disease (exclude) | Diagnosis years 2011–2015: Derived AJCC 7th stage group Diagnosis years 2016–2017: Derived SEER Combined stage group |
≠ 0, 4 (0, 0A, 0IS, 4, 4A, 4A1, 4A2, 4B, 4C) |
| Diagnosis years 2011–2015: Derived AJCC 7th M stage Diagnosis years 2016–2017: Derived SEER Combined M stage |
≠ (c1, c1A, c1B, c1C, c1D, c1E, p1, p1A, p1B, p1p, p1D, p1E, 1, 1A, 1B, 1C, 1D, 1E) | ||
| 8 | Surgically treated | Surgical Procedure of the Primary Site | 30 – 90 |
| 9 | Patient reported living within the treatment timeframe period of 120 days from date of diagnosis | Date of Initial Diagnosis | Exclude if have <120 days of follow-up and reported as died |
| Date of Last Contact or Death | |||
| Vital Status | |||
| 10 | Lymph node positive disease | Regional nodes positive OR derived AJCC 7th edition stage IIIB-C | 1–90, 95, 97 OR derived AJCC 7th stage = 500-630 |
| Numerator Criteria | |||
| 11 | Chemotherapy Administered within 120 days following Diagnosis | Chemotherapy | 01, 02, 03 AND # elapsed days ≤120 |
| Date of Initial Diagnosis | |||
| Date Chemotherapy Started | |||
| OR | |||
| Chemotherapy Recommended, but not Administered | Chemotherapy | 82, 85, 86, 87 | |
Colon Nodal Yield Quality Measure (12RLN):
At least 12 regional lymph nodes are removed and pathologically examined for resected colon cancer.
Measure Type: Quality Improvement, National Quality Forum measure #0225
| Case Eligibility Criteria | |||
|---|---|---|---|
| Assessment | SEER Item | SEER Codes | |
| 1 | Diagnosis of Colon cancer | Primary Site | C18.0, C18.2, C18.3, C18.4, C18.5, C18.6, C18.7, C18.8, C18.9 |
| 2 | Male or Female | Sex | 1, 2 |
| 3 | Adult patient over 17 at diagnosis | Age at Diagnosis | 18–120 |
| 4 | Any sequence of malignant primary tumor | Sequence Number | 00-59, 99 |
| 5 | Epithelial tumors which can be staged according to the AJCC 7th ed. | Histology | 8000-8152, 8154-8231, 8243-8245, 8247-8248, 8250-8576, 8940-8950, 8980-8981 |
| 6 | Invasive tumors | Behavior Code | 3 |
| 7 | Clinical or pathologic evidence of in situ disease or metastatic disease (exclude) | Diagnosis years 2011–2015: Derived AJCC 7th stage group Diagnosis years 2016–2017: Derived SEER Combined stage group |
≠ 0, 4 (0, 0A, 0IS, 4, 4A, 4A1, 4A2, 4B, 4C) |
| Diagnosis years 2011–2015: Derived AJCC 7th M stage Diagnosis years 2016–2017: Derived SEER Combined M stage |
≠ (c1, c1A, c1B, c1C, c1D, c1E, p1, p1A, p1B, p1p, p1D, p1E, 1, 1A, 1B, 1C, 1D, 1E) | ||
| 8 | Surgically treated at this facility | Surgical Procedure of the Primary Site at this Facility | 30–80 |
| Numerator Criteria | |||
| 9 | At least 12 regional lymph nodes are removed and pathologically examined | Regional Lymph Nodes Examined | Regional Lymph Nodes Examined 12–90 AND Regional Lymph Nodes Examined ≥ Regional Lymph Nodes Positive |
| Regional Lymph Nodes Positive | |||
Footnotes
DISCLOSURE The authors declare that they have no conflicts of interest.
REFERENCES
- 1.Henley SJ, Anderson RN, Thomas CC, et al. Invasive cancer incidence, 2004–2013, and deaths, 2006–2015, in nonmetropolitan and metropolitan counties—United States. MMWR Surveill Summ 2017;66(14):1–13. [DOI] [PMC free article] [PubMed] [Google Scholar]
- 2.Del Vecchio NJ, Schlichting JA, Chioreso C, et al. Guideline-recommended chemoradiation for patients with rectal cancer at large hospitals: a trend in the right direction. Dis Colon Rectum 2019;62(10):1186–94. [DOI] [PMC free article] [PubMed] [Google Scholar]
- 3.Meilleur A, Subramanian SV, Plascak JJ, et al. Rural residence and cancer outcomes in the United States: issues and challenges. Cancer Epidemiol Biomarkers Prev 2013;22(10):1657–67. [DOI] [PMC free article] [PubMed] [Google Scholar]
- 4.Chioreso C, Gao X, Gribovskaja-Rupp I, et al. Hospital and surgeon selection for medicare beneficiaries with stage II/III rectal cancer: the role of rurality, distance to care, and colonoscopy provider. Ann Surg 2021;274(4):e336–44. [DOI] [PMC free article] [PubMed] [Google Scholar]
- 5.Longacre CF, Neprash HT, Shippee ND, et al. Evaluating travel distance to radiation facilities among rural and urban breast cancer patients in the medicare population. J Rural Health. 2020;36(3):334–46. [DOI] [PubMed] [Google Scholar]
- 6.Chan L, Hart LG, Goodman DC. Geographic access to health care for rural Medicare beneficiaries. J Rural Health. 2006. Spring; 22(2):140–6. [DOI] [PubMed] [Google Scholar]
- 7.Hung P, Deng S, Zahnd WE, et al. Geographic disparities in residential proximity to colorectal and cervical cancer care providers. Cancer. 2020;126(5):1068–76. [DOI] [PubMed] [Google Scholar]
- 8.Nass SJ, Cogle CR, Brink JA, et al. Improving cancer diagnosis and care: patient access to oncologic imaging expertise. J Clin Oncol 2019;37(20):1690–4. [DOI] [PMC free article] [PubMed] [Google Scholar]
- 9.Aboagye JK, Kaiser HE, Hayanga AJ. Rural-urban differences in access to specialist providers of colorectal cancer care in the United States: a physician workforce issue. JAMA Surg 2014;149(6):537–43. [DOI] [PubMed] [Google Scholar]
- 10.Weeks K, Lynch CF, West M, et al. Rural disparities in surgical care from gynecologic oncologists among Midwestern ovarian cancer patients. Gynecol Oncol 2021;160(2):477–84. [DOI] [PMC free article] [PubMed] [Google Scholar]
- 11.Unger JM, Moseley A, Symington B, et al. Geographic distribution and survival outcomes for rural patients with cancer treated in clinical trials. JAMA Netw Open. 2018; 1(4):e181235. [DOI] [PMC free article] [PubMed] [Google Scholar]
- 12.Ellis SD, Geana M, Mackay CB, et al. Science in the Heartland: exploring determinants of offering cancer clinical trials in rural-serving community urology practices. Urol Oncol 2019;37(8):529.e9–e18. [DOI] [PMC free article] [PubMed] [Google Scholar]
- 13.Blake KD, Moss JL, Gaysynsky A, et al. Making the case for investment in rural cancer control: an analysis of rural cancer incidence, mortality, and funding trends. Cancer Epidemiol Biomarkers Prev 2017;26(7):992–7. [DOI] [PMC free article] [PubMed] [Google Scholar]
- 14.Gilbertson-White S, Yeung C, Wickersham KE. ‘‘Just Living With Them’’: symptom management experiences of rural residents with advanced cancer. Oncol Nurs Forum. 2019;46(5):531–42. [DOI] [PubMed] [Google Scholar]
- 15.Stewart DB, Hollenbeak C, Desharnais S, et al. Rectal cancer and teaching hospitals: hospital teaching status affects use of neoadjuvant radiation and survival for rectal cancer patients. Ann Surg Oncol 2013;20(4):1156–63. [DOI] [PubMed] [Google Scholar]
- 16.Lewis-Thames MW, Carnahan LR, James AS, et al. Understanding posttreatment patient-provider communication and follow-up care among self-identified rural cancer survivors in illinois. J Rural Health. 2020;36(4):549–63. [DOI] [PMC free article] [PubMed] [Google Scholar]
- 17.Singer S, Tkachenko E, Sharma P, et al. Geographic disparities in access to scalp cooling for the prevention of chemotherapy-induced alopecia in the United States. J Am Acad Dermatol 2020; 27. [DOI] [PubMed] [Google Scholar]
- 18.Aviki EM, Chen L, Dessources K, et al. Impact of hospital volume on surgical management and outcomes for early-stage cervical cancer. Gynecol Oncol 2020;157(2):508–13. [DOI] [PMC free article] [PubMed] [Google Scholar]
- 19.Onega T, Duell EJ, Shi X, et al. Geographic access to cancer care in the U.S. Cancer. 2008; 112(4):909–18. [DOI] [PubMed] [Google Scholar]
- 20.Levit LA, Byatt L, Lyss AP, et al. Closing the rural cancer care gap: three institutional approaches. JCO Oncol Pract 2020;16(7):422–30. [DOI] [PubMed] [Google Scholar]
- 21.American College of Surgeons. Commission on Cancer. Available at: https://www.facs.org/quality-programs/cancer/coc. Accessed 22 Jan 2021.
- 22.Tucker TC, Charlton ME, Schroeder MC, et al. Improving the quality of cancer care in community hospitals. Ann Surg Oncol 2021;28(2):632–8. [DOI] [PMC free article] [PubMed] [Google Scholar]
- 23.Knutson AC, McNamara EJ, McKellar DP, et al. The role of the American College of Surgeons’ cancer program accreditation in influencing oncologic outcomes. J Surg Oncol 2014;110(5):611–5. [DOI] [PubMed] [Google Scholar]
- 24.American College of Surgeons. CoC Quality Measure Development. Commission on Cancer. Available at: https://www.facs.org/quality-programs/cancer/ncdb/qualitymeasurescocweb/development. Accessed 10 Jul 2021.
- 25.American College of Surgeons. CoC Quality of Care Measures 2020 Surveys. Commission on Cancer. Available at: https://www.facs.org/quality-programs/cancer/ncdb/qualitymeasurescocweb. Accessed 26 Jun 2021.
- 26.Bilimoria KY, Stewart AK, Winchester DP, et al. The national cancer data base: a powerful initiative to improve cancer care in the United States. Ann Surg Oncol 2008;15(3):683–90. [DOI] [PMC free article] [PubMed] [Google Scholar]
- 27.Boffa DJ, Rosen JE, Mallin K, et al. Using the national cancer database for outcomes research: a review. JAMA Oncol 2017;3(12):1722–8. [DOI] [PubMed] [Google Scholar]
- 28.American College of Surgeons. About the national cancer database. Commission on cancer. Available at: https://www.facs.org/Quality-Programs/Cancer/NCDB/about. Accessed 26 Jan 2021.
- 29.Berger ER, Wang CE, Kaufman CS, et al. National accreditation program for breast centers demonstrates improved compliance with post-mastectomy radiation therapy quality measure. J Am Coll Surg 2017;224(3):236–44. [DOI] [PubMed] [Google Scholar]
- 30.Shulman LN, Browner AE, Palis BE, et al. Compliance with cancer quality measures over time and their association with survival outcomes: the commission on cancer’s experience with the quality measure requiring at least 12 regional lymph nodes to be removed and analyzed with colon cancer resections. Ann Surg Oncol 2019;26(6):1613–21. [DOI] [PubMed] [Google Scholar]
- 31.Thiels CA, Hanson KT, Habermann EB, et al. Integrated cancer networks improve compliance with national guidelines and outcomes for resectable gastric cancer. Cancer. 2020;126(6):1283–94. [DOI] [PubMed] [Google Scholar]
- 32.Bilimoria KY, Bentrem DJ, Stewart AK, et al. Lymph node evaluation as a colon cancer quality measure: a national hospital report card. J Natl Cancer Inst 2008;100(18):1310–7. [DOI] [PMC free article] [PubMed] [Google Scholar]
- 33.Lodrigues W, Dumas J, Rao M, et al. Compliance with the commission on cancer quality of breast cancer care measures: self-evaluation advised. Breast J 2011;17(2):167–71. [DOI] [PubMed] [Google Scholar]
- 34.Kantor O, Wang CH, Yao K. Regional variation in performance for commission on cancer breast quality measures and impact on overall survival. Ann Surg Oncol 2018;25(10):3069–75. [DOI] [PubMed] [Google Scholar]
- 35.Brubakk K, Vist GE, Bukholm G, et al. A systematic review of hospital accreditation: the challenges of measuring complex intervention effects. BMC Health Serv Res 2015;15:280. [DOI] [PMC free article] [PubMed] [Google Scholar]
- 36.Charlton M, Kahl A, Gao X, et al. commentary and complementary data to add to ‘‘compliance with cancer quality measures over time and their association with survival outcomes: the commission on cancer’s experience with the quality measure requiring at least 12 regional lymph nodes to be removed and analyzed with colon cancer resections’’. Ann Surg Oncol 2020;27(4):1306–7. [DOI] [PMC free article] [PubMed] [Google Scholar]
- 37.Bilimoria KY, Bentrem DJ, Stewart AK, et al. Comparison of commission on cancer-approved and -nonapproved hospitals in the United States: implications for studies that use the National Cancer Data Base. J Clin Oncol 2009;27(25):4177–81. [DOI] [PubMed] [Google Scholar]
- 38.Merkow RP, Chung JW, Paruch JL, et al. Relationship between cancer center accreditation and performance on publicly reported quality measures. Ann Surg 2014;259(6):1091–7. [DOI] [PubMed] [Google Scholar]
- 39.Escarce JJ, Kapur K. Do patients bypass rural hospitals? Determinants of inpatient hospital choice in rural California. J Health Care Poor Underserv 2009;20(3):625–44. [DOI] [PubMed] [Google Scholar]
- 40.Charlton M Quality of Care and CoC accreditation in rural America. In: Presented at the SI003 CoCAMS 2019. American College of Surgeons Clinical Congress: San Francisco, CA. [Google Scholar]
- 41.Charlton M, Schlichting J, Chioreso C, et al. Challenges of rural cancer Care in the United States. Oncology (Williston Park). 2015;29(9):633–40. [PubMed] [Google Scholar]
- 42.Chioreso C, Del Vecchio N, Schweizer ML, et al. Association between hospital and surgeon volume and rectal cancer surgery outcomes in patients with rectal cancer treated since 2000: systematic literature review and meta-analysis. Dis Colon Rectum. 2018;61(11):1320–32. [DOI] [PMC free article] [PubMed] [Google Scholar]
- 43.Iowa Cancer Registry (ICR). Available at: https://shri.public-health.uiowa.edu/about-icr/. Accessed 31 Jan 2021.
- 44.North American Association of Central Cancer Registries (NAACCR). Certification levels and recognition logos. Available at: https://www.naaccr.org/certification-criteria/#1483458871621-d51cc6b1-d942. Accessed 7 Feb 2021.
- 45.American College of Surgeons. National Quality Forum Endorsement. CoC quality of care measures. Available at: https://www.facs.org/quality-programs/cancer/ncdb/qualitymeasurescocweb/nqf. Accessed 26 Jan 2021.
- 46.US Census Bureau. What is Rural America? America counts: stories behind the numbers. Washington, DC. Available at: https://www.census.gov/library/stories/2017/08/rural-america.html. Accessed 4 Aug 2021. [Google Scholar]
- 47.Obeng-Gyasi S, Timsina L, Bhattacharyya O, et al. Breast cancer presentation, surgical management and mortality across the rural-urban continuum in the national cancer database. Ann Surg Oncol 2020;27(6):1805–15. [DOI] [PubMed] [Google Scholar]
- 48.Singh GK, Williams SD, Siahpush M, et al. Socioeconomic, rural-urban, and racial inequalities in US cancer mortality: part I-All cancers and lung cancer and part II-colorectal, prostate, breast, and cervical cancers. J Cancer Epidemiol 2011;2011:107497. [DOI] [PMC free article] [PubMed] [Google Scholar]
- 49.Charlton ME, Matthews KA, Gaglioti A, et al. Is travel time to colonoscopy associated with late-stage colorectal cancer among medicare beneficiaries in Iowa? J Rural Health. 2016;32(4):363–73. [DOI] [PMC free article] [PubMed] [Google Scholar]
- 50.Henry KA, Boscoe FP, Johnson CJ, et al. Breast cancer stage at diagnosis: is travel time important? J Commun Health. 2011;36(6):933–42. [DOI] [PubMed] [Google Scholar]
- 51.Porell FW, Adams EK. Hospital choice models: a review and assessment of their utility for policy impact analysis. Med Care Res Rev 1995;52(2):158–95. [DOI] [PubMed] [Google Scholar]
- 52.Tai WT, Porell FW, Adams EK. Hospital choice of rural Medicare beneficiaries: patient, hospital attributes, and the patient-physician relationship. Health Serv Res 2004;39(6 Pt 1):1903–22. [DOI] [PMC free article] [PubMed] [Google Scholar]
- 53.Charlton ME, Shahnazi AF, Gribovskaja-Rupp I, et al. Determinants of rectal cancer patients’ decisions on where to receive surgery: a qualitative analysis. J Gastrointest Surg 2019;23(7):1461–73. [DOI] [PMC free article] [PubMed] [Google Scholar]
- 54.Chow CJ, Al-Refaie WB, Abraham A, et al. Does patient rurality predict quality colon cancer care?: a population-based study. Dis Colon Rectum. 2015;58(4):415–22. [DOI] [PMC free article] [PubMed] [Google Scholar]
- 55.Shia J, Wang H, Nash GM, et al. Lymph node staging in colorectal cancer: revisiting the benchmark of at least 12 lymph nodes in R0 resection. J Am Coll Surg 2012;214(3):348–55. [DOI] [PubMed] [Google Scholar]
- 56.Kulaylat AS, Pappou E, Philp MM, et al. Emergent colon resections: does surgeon specialization influence outcomes? Dis Colon Rectum. 2019;62(1):79–87. [DOI] [PubMed] [Google Scholar]
- 57.Weigel PAM, Ullrich F, Ward MM. Rural bypass of critical access hospitals in Iowa: do visiting surgical specialists make a difference? J Rural Health. 2018;34(Suppl 1):s21–9. [DOI] [PubMed] [Google Scholar]
- 58.Diaz A, Pawlik TM. Rural surgery and status of the rural workplace: hospital survival and economics. Surg Clin North Am 2020;100(5):835–47. [DOI] [PubMed] [Google Scholar]
- 59.Rural Health Information Hub State Guides: Iowa. Available at: https://www.ruralhealthinfo.org/states/iowa. Accessed 2 Feb 2021. [Google Scholar]
- 60.Iowa Hospital Association. Iowa Hospital Data. Iowa hospital facts. Available at: http://www.iowahospitalfacts.com/Documents/Iowa_Hospital_Data.pdf. Accessed 2 Feb 2021.
- 61.Ward MM, Ullrich F, Matthews K, et al. Where do patients with cancer in Iowa receive radiation therapy? J Oncol Pract 2014;10(1):20–5. [DOI] [PMC free article] [PubMed] [Google Scholar]