Abstract
Pancreatic cancer (PC) has poor prognosis. PRKAA1 (AMPK-α1) is the catalytic subunit of 5’-adenylate-activated protein kinase (AMPK), which plays a critical role in multiple stages of tumorigenesis and development. However, the biological mechanisms of PRKAA1 in the tumor microenvironment have not been well studied. In this study, we performed a combined analysis of data from TCGA and GTEx databases to determine whether PRKAA1 is differentially expressed in a variety of tumors. Kaplan-Meier curve and Cox regression analyses indicated that the differential expression of PRKAA1 affected overall survival in a variety of tumors and was an independent prognostic factor for Brain Lower Grade Glioma (LGG), Brain Lower Grade Glioma (LAML), Liver hepatocellular carcinoma (LIHC), Pancreatic adenocarcinoma (PAAD), and Pancreatic adenocarcinoma (KICH). PRKAA1 was closely associated with various immune profiles, suggesting that PRKAA1 can be used for direct immunotherapy. We investigated the role of PRKAA1 in PC cells. We found that the downregulation of PRKAA1 expression reduced the proliferation, migration, and invasion of PC cells. In addition, we found that PRKAA1 regulated PC progression, possibly through the PI3K/AKT signaling pathway. Treatment of cells with the AKT inhibitors MK2206 and GSK2110183 revealed that the PRKAA1 overexpression group was less sensitive to AKT inhibitors than the negative control group. Taken together, PRKAA1 can be used as a potential prognostic marker and new target for tumor immunotherapy.
Keywords: PRKAA1, pancreatic cancer, pan-cancer, prognosis
Introduction
Pancreatic cancer (PC) is a highly aggressive gastrointestinal cancer with poor prognosis. It is the fourth leading cause of cancer-related death in the United States. Based on the 2022 cancer statistics published by CA (A Cancer Journal for Clinicians), up to 49,830 deaths were projected in the US for 2022 out of 62,210 new cases of PC [1]. According to a study conducted in 28 European countries [2], PC is expected to surpass breast cancer as the third leading cause of cancer-related death by 2025. Most patients with PC are 65-74 years of age (average: 70 years) at the time of diagnosis [3]. Imaging tests, such as ultrasound, computed tomography, and magnetic resonance imaging, are not ideal for the early diagnosis of PC, and the lack of molecular markers to effectively screen and confirm PC is one of the main reasons for the difficulty in early diagnosis [4].
PRKAA1 encodes the catalytic subunit of 5’-adenosine monophosphate (AMP)-activated protein kinase (AMPK) [1]. AMPK is a heterotrimer consisting of a catalytic subunit (α) and two regulatory subunits (β and γ), with phosphorylation of T172 in the α catalytic subunit being a key requirement for the activation of AMPK [2]. AMPK activity is stimulated by increasing the intracellular AMP/adenosine-triphosphate (ATP) ratio or by upstream kinases, such as LKB1/CAMKKβ [3]. Currently, there is much debate regarding the role of PRKAA1 in tumors. The specific role of PRKAA1 in tumors is related to their environment. The proliferation and growth of tumor cells are restricted when PRKAA1 is highly expressed in the presence of adequate nutrients. For example, Wu et al. [4] found that metformin inhibited bladder cancer cell proliferation by upregulating phosphorylated AMPK-α to induce cellular G1 cycle arrest, which in turn affected cell proliferation through the P53 axis. However, when cells are nutritionally restricted, high PRKAA1 expression protects them from death and promotes cellular adaptation to a low-energy status [5]. For example, Jeon et al. [6] showed that under energy stress conditions, where intracellular ATP is reduced to below a certain level, AMPK activation and increased PRKAA1 expression promote the proliferation of lung cancer cells. Thus, PRKAA1 plays a far more complex role in tumors than initially believed.
Ye et al. [7] suggested that PRKAA1 has an inhibitory effect on tumors, while Zhao et al. [8] discovered that PRKAA1 promotes the progression of PC. Consequently, we investigated the role of PRKAA1 in PC. In this study, we comprehensively analyzed the pan-cancer expression of PRKAA1, its prognosis, and its relationship with immunity. We subsequently demonstrated that PRKAA1 was highly expressed in PC and correlated with a poor prognosis. PRKAA1 knockdown may inhibit the malignant behavior of PC cells by downregulating the PI3K/AKT pathway. Thus, PRKAA1 is a potential therapeutic target for PC.
Materials and methods
Acquisition of PRKAA1 expression and prognostic data in pan-cancer
To predict the expression and prognosis of PRKAA1, we downloaded the unified and standardized pan-cancer dataset from the UCSC (https://xenabrowser.net/) database, extracted the expression data of PRKAA1 gene in each sample, and obtained the expression data of 33 cancer types and the clinical information of the corresponding samples.
Relationship between PRKAA1 gene expression and immunization, tumor mutational load, microsatellite instability
After extracting PRKAA1 expression data, we calculated the stromal, immune, and ESTIMATE scores for each patient’s tumor using gene expression data and the R package ESTIMATE (version 1.0.13). Subsequently, we calculated the B cell, T cell CD4, T cell CD8, neutrophil, macrophage, and dendritic cell (DC) infiltration scores for each patient across the pan-cancer using gene expression data and the R package IOBR (version 0.99.9). The Timer method was then employed to reassess these infiltration scores based on gene expression. We extracted the expression data of marker genes for the two types of immune checkpoint pathways (Inhibitory, Stimulatory) in each sample and calculated the Pearson’s correlation between PRKAA1 and the marker genes of these pathways. Spearman’s correlation was used to analyze the correlation between PRKAA1, tumor mutational load (TMB), and microsatellite instability (MSI).
Tissue samples and immunohistochemistry
Eighty patients were selected based on inclusion and exclusion criteria. Postoperatively, PC (n=80) and healthy paracancerous tissues (n=20) were collected and stored in paraffin blocks. This study was approved by the Ethics Committee of the Second Hospital of Lanzhou University, and written informed consent was obtained from all patients.
Inclusion: (1) Radical surgery in the Second Hospital of Lanzhou University. (2) Pathological diagnosis of PC.
Exclusion: (1) Pre-operative chemotherapy or immunotherapy. (2) Patients with positive surgical margins. (3) Severe underlying systemic disease.
The clinicopathological characteristics of the patients are presented in Table 1. Paraffin-embedded tissue sections were baked at 65°C for 30 min, dewaxed in xylene, hydrated with graded ethanol, and then macerated in phosphate-buffered saline (PBS) or pure water for several minutes. The sections were boiled in citrate buffer for 20 min for antigen repair before incubation with 10% bovine serum albumin. Samples were incubated with rabbit anti-PRKAA1 primary antibody (Shanghai GeneChem Co., Shanghai, China) overnight. After washing, the sections were incubated with goat anti-rabbit secondary antibody (Santa Cruz Biotechnology, Santa Cruz, CA, US) for 1 h at room temperature. Tissue sections were stained with 3,3’-diaminobenzidine, counterstained with hematoxylin, dehydrated, and sealed. The sections were examined and scored by two pathologists according to the proportion of positive cells and staining intensity. The proportion of positively stained cells was scored according to the following criteria: 0 (<10% positive cells), 1 (10%-25% positive cells), 2 (26%-50% positive cells), 3 (51%-75% positive cells), and 4 (>75% positive cells). Staining intensity was scored as 0 (no staining), 1 (weak staining), 2 (moderate staining), or 3 (strong staining). The final staining score was calculated as the staining intensity score × scale score, ranging from 0 to 12. A score of ≤4 was classified as low expression (-), and a score >4 was classified as high expression (+).
Table 1.
Relationships between PRKAA1 expression and the clinicopathological characteristics of patients with PC
| Characteristic | Levels | Low expression of PRKAA1 | High expression of PRKAA1 | P value |
|---|---|---|---|---|
| Age, n (%) | ≥60 | 24 (32%) | 12 (16%) | 0.001 |
| <60 | 11 (14.67%) | 28 (37.33%) | ||
| Sex, n (%) | Male | 23 (30.67%) | 27 (36%) | 0.870 |
| Female | 12 (16%) | 13 (17.33%) | ||
| Tumor size (cm), n (%) | ≤4 | 14 (18.67%) | 18 (24%) | 0.662 |
| >4 | 21 (28%) | 22 (29.33%) | ||
| Vascular invasion status, n (%) | Yes | 15 (20%) | 16 (21.33%) | 0.802 |
| No | 20 (26.67%) | 24 (32%) | ||
| Neural tract invasion status, n (%) | Yes | 23 (30.67%) | 25 (33.33%) | 0.772 |
| No | 12 (16%) | 15 (20%) | ||
| Differentiation status, n (%) | Highly differentiated | 5 (6.67%) | 7 (9.33%) | 0.164 |
| Moderately differentiated | 26 (34.67%) | 22 (29.33%) | ||
| Poorly differentiated | 4 (5.33%) | 11 (14.67%) | ||
| CA19-9 (U/ml), median (IQR) | 25.0 (12.8, 57.42) | 245.60 (101.01, 745.95) | 0.417 | |
| AFP (ng/ml), median (IQR) | 2.90 (2.01, 4.94) | 2.18 (1.73, 3.32) | 0.413 | |
| T stage, n (%) | T1+T2 | 15 (20%) | 2 (2.67%) | <0.000 |
| T3+T4 | 20 (26.67%) | 38 (50.67%) | ||
| N stage, n (%) | N0 | 22 (29.33%) | 23 (30.67%) | 0.283 |
| N1 | 11 (14.67%) | 10 (13.33%) | ||
| N2 | 2 (2.67%) | 7 (9.33%) | ||
| M stage, n (%) | M0 | 26 (34.67%) | 16 (21.33%) | 0.003 |
| M1 | 9 (12%) | 24 (37.33%) |
Cell culture
Human pancreatic ductal epithelial cells hTERT-HPNE, PC cell lines CFPAC-1, and Mia-PaCa-2 were obtained from the Shanghai Cell Culture Bank of the Chinese Academy of Sciences. These cells were identified through short tandem repeat DNA analysis at Shanghai GeneChem Ltd. (Shanghai, China) and cultured in Dulbecco’s modified Eagle’s medium supplemented with 10% fetal bovine serum (Gibco, Carlsbad, CA, US) and 1% penicillin/streptomycin (Beyotime, Shanghai, China). All cells tested in this study were used within 6 months of thawing and stored at 37°C in 5% carbon dioxide. Mycoplasma testing was routinely performed.
Cell transfection
Stably transfected cell lines were constructed using short hairpin RNA (shRNA) sequences targeting PRKAA1 and a negative control shRNA (5’GGGTTCTACCTGCAGCTGAA3’, 5’GCGTGTCACCCAGAATGTAG3’ and 5’TTCTCCGAACGTGTCACGT3’, respectively). The shRNA sequences and PRKAA1 constructs were subcloned into a lentiviral expression vector containing green fluorescent protein (Shanghai Genechem, Ltd.). Lentiviral transduction was performed according to manufacturer’s instructions. The cells were screened with 2 μg/mL puromycin for 7 days, and stable strains were selected for subsequent experiments. Western blotting was performed to measure the protein expression of PRKAA1.
Quantitative real-time polymerase chain reaction
Total RNA was extracted utilizing TRIzol reagent (Thermo Fisher Scientific, Shanghai, China) according to the manufacturer’s protocol. A reverse transcription kit (Agbio, Hunan, China) was used to stably transcribe 1000 ng of RNA into complementary DNA. Quantitative real-time polymerase chain reaction was performed using a SYBR Premix Ex Taq kit (Takara Biomedical Technology, Beijing, China). The Rotor-Gene Q system (QIAGEN, Venlo, Netherlands) was used to measure the expression of PRKAA1 at the transcriptional level. The specific primers were as follows: PRKAA1 forward primer: 5’TTGAAACCTGAAAATGTCCTGCT3’; PRKAA1 reverse primer: 3’GGTGAGCCACAACTTGTTCTT5’; GAPDH forward primer: 5’GAAGGCTGGGGCTCATTT3’; GAPDH reverse primer: 3’CAGGAGGCATTGCTGATGAT5’. The assay was repeated three times for each sample, and the data were analyzed through relative quantification and normalization to GAPDH expression.
Western blot
Western blotting was performed according to conventional methods. The anti-GAPDH antibody (T40004) and goat anti-rabbit immunoglobulin G (TS0001) were purchased from Abmart (Shanghai, China). Antibodies including anti-Akt (4691T), anti-phosphorylated Akt (4060T), anti-PI3K P85 (4257T), and anti-phosphorylated PI3K p85 (Tyr458) (4228T) were purchased from Cell Signaling Technology (Beverly, MA, US). Anti-PRKAA1 antibody (ab32047) was procured from Abcam (Cambridge, MA, US).
Cell Counting Kit (CCK)-8 cell proliferation assay
The experiments were performed using a Cytotoxicity Assay Kit (Beyotime Biotechnology). Cells grown in the logarithmic phase were prepared in a cell suspension at a density of 1.25 × 10⁴ cells/mL, and 100 μL/well cell suspension was seeded into 96-well plates. After the cells adhered, 10 μL of Cell Counting Kit (CCK)-8 reagent was added, and the cells were incubated for another 2 h. The optical density (OD) at 450 nm was then measured using an enzyme marker, and this OD value was recorded as the 0-h data. Thereafter, the OD at 450 nm was measured at 24, 48, and 72 h. The growth curves of the cells were plotted using GraphPad software.
Wound healing assay
Cells were seeded in 6-well plates at a density of 5 × 10⁵ cells/well and cultured overnight. Scratches were created using a 200-µL gun tip. Serum-free medium was used throughout the incubation period. Images were acquired at various time points using a microscope at 10× magnification. Gap distances were assessed using ImageJ software (V1.8.0).
Transwell cell invasion assay
Cell invasion experiments were performed in 24-well Transwell chambers (Corning, NY, US). First, diluted Corning Matrigel was quickly spread into the upper chamber of the Transwell and then placed in a 37°C incubator, where it solidified dynamically. The cell density was adjusted to 1-10 × 105/ml and inoculated in the chambers. The next day, the gel and cells in the upper chamber were gently wiped off with a cotton swab, fixed in 4% paraformaldehyde for 10 min, washed briefly with PBS, and incubated for 24 h at 37°C. Crystalline violet (0.1%) was added for 15 min, and the small chamber was washed three times with PBS. Images were captured using an inverted microscope.
Data analysis
Three independent experiments were performed for each analysis. Statistical analysis and visualization were performed employing R software (V4.2.2). Mean values were compared using two-sided t-tests. Count data were compared utilizing Fisher’s exact probability method or the χ2 test, as appropriate. Survival curves were plotted using the Kaplan-Meier method and log-rank test. One-way Cox proportional hazards regression analysis was conducted to assess the hazard ratio (HR) and 95% confidence interval (CI) of each influencing factor for overall survival (OS). Statistical significance was set at P<0.05, and all statistical tests were two-sided.
Results
Expression of PRKAA1 in pan-cancer
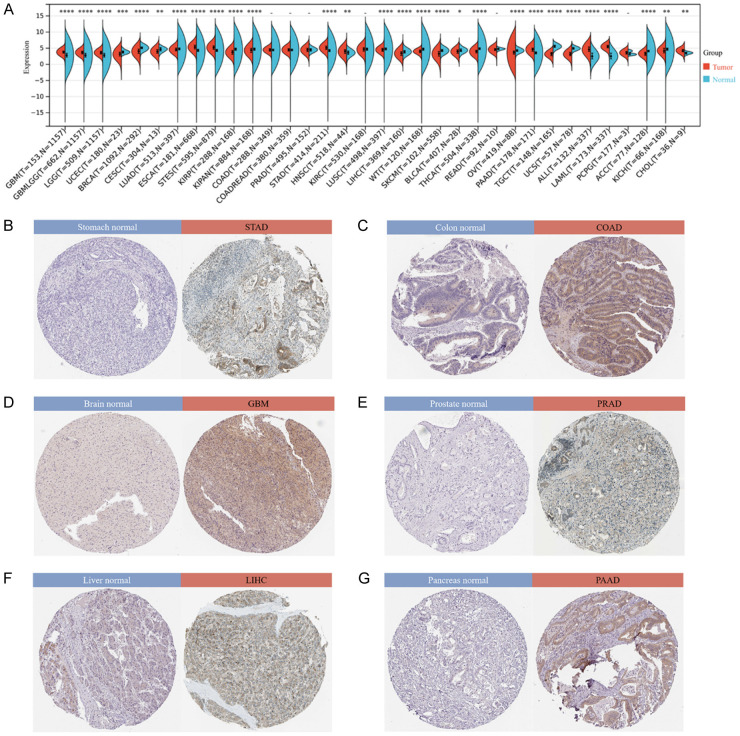
By integrating and mining data from TCGA and GTEx databases and performing significance of difference analysis, we observed significant upregulation in 11 tumors, including GBM (P=6.8e-36), ESCA (P=9.5e-47), STAD (P=2.1e-40), HNSC (P=1.3e-3), PAAD (P=3.9e-32), and CHOL (P=1.0e-3). Significant downregulation was observed in 17 tumors such as UCEC (P=1.4e-4), BRCA (P=2.6e-66), CESC (P=6.8e-3), LUAD (P=1.2e-7), KIRP (P=1.0e-24), LIHC (P=2.2e-11), THCA (P=1.7e-80), OV (P=2.0e-14), ACC (P=1.4e-12), and KICH (P=3.6e-3) (Figure 1A). In addition, we determined the expression of PRKAA1 in tissues using the HPA database. The results showed that PRKAA1 was highly expressed in STAD, COAD, GBM, PRAD, LIHCA, and PAAD (Figure 1B-G).
Figure 1.
Expression of PRKAA1 in pan-cancer. A. Matched analysis comparing PRKAA1 expression differential in TCGA database and GTEx database. Ns, P≥0.05; *P<0.05; **P<0.01; ***P<0.001; ****P<0.0001; B-G. PRKAA1 expression in STAD, COAD, GBM, PRAD, LIHC and PAAD from the HPA database.
The prognostic value of PRKAA1 in pan-cancer
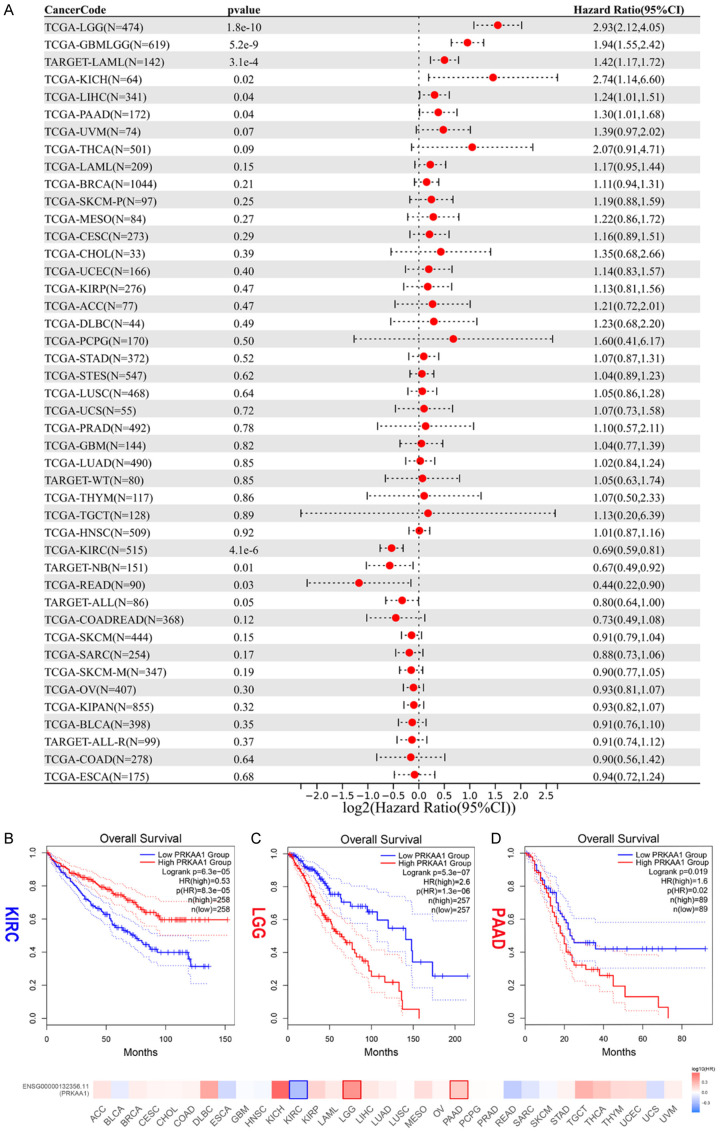
We used the survival package of R software to analyze the relationship between PRKAA1 gene expression and the prognosis of each tumor, and prognostic significance was obtained with the log-rank test for statistical testing. High PRKAA1 expression was a risk factor for OS in patients with six tumor types: GBMLGG, LGG, LAML, LIHC, PAAD, and KICH. Low PRKAA1 expression suggested a lower OS in patients with KIRC, TARGET-NB, READ, and TARGET-ALL (Figure 2A). Kaplan-Meier survival curves were plotted, which further confirmed that patients with low PRKAA1 expression had worse prognosis in KIRC, and patients with high PRKAA1 expression had worse prognosis in LGG and PAAD (Figure 2B-D).
Figure 2.
The prognostic value of PRKAA1 in pan-cancer. A. Univariate Cox regression analysis of PRKAA1 with OS; B-D. Kaplan-Meier survival analysis for OS in KIPC, LGG and PAAD. P<0.05 was considered statistically significant (Red for high PRKAA1 expression and blue for low PRKAA1 expression).
Immunological relevance of PRKAA1 in pan-cancer
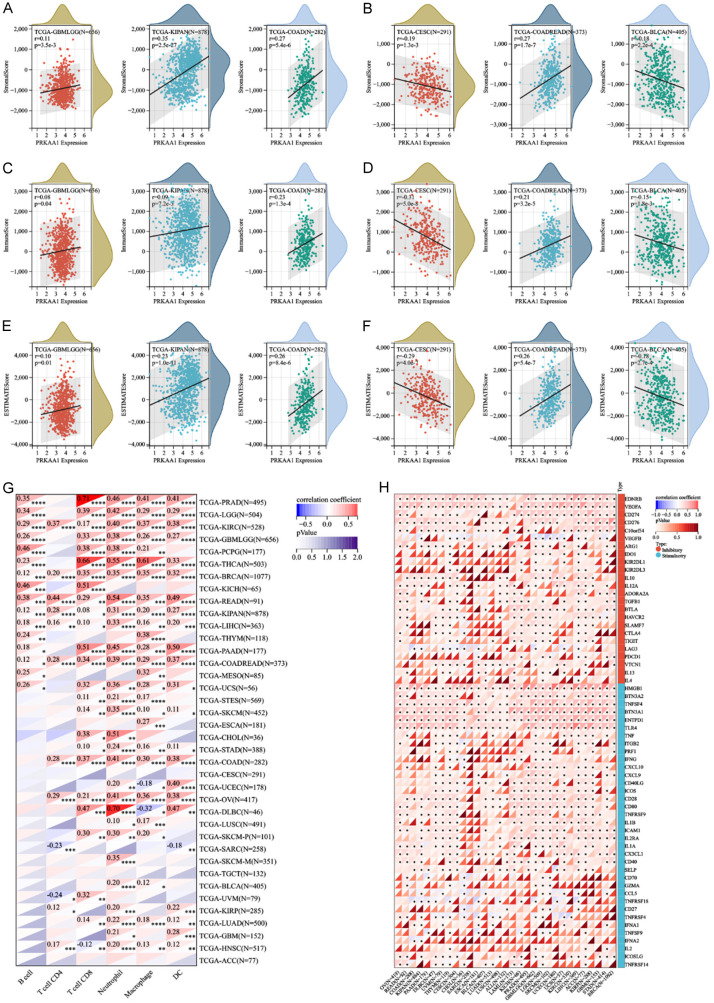
The tumor microenvironment plays a crucial role in tumor diagnosis, treatment, and prognosis. To explore the pan-cancer role of PRKAA1 in the tumor microenvironment, we comprehensively analyzed the relationship between PRKAA1 and immune infiltration scores using the psych package of R software, and the results are presented in the form of three scores (StromalScore, ImmuneScore, and ESTIMATEScore). We found that PRKAA1 expression was significantly correlated with immune infiltration in six cancer types, with four significant positive correlations (GBMLGG, KIPAN, COAD, and COADREAD) and two significant negative correlations (CESC and BLCA) (Figure 3A-F), suggesting that the PRKAA1 gene plays a role in regulating the tumor immune microenvironment in these tumors. We analyzed the relationship between PRKAA1 and immune cells and showed that PRKAA1 interacted with immune cells (B cell, T cell CD4, T cell CD8, neutrophil, macrophages, and DC) in most tumors (Figure 3G). In addition, we found that PRKAA1 was significantly and positively associated with immune checkpoint genes (e.g., EDNRB, VEGFA, HMGB1, and TNFSF4) in many cancers (Figure 3H).
Figure 3.
The correlation between PRKAA1 expression and immune infiltration and immune checkpoints. A, B. Correlation of PRKAA1 expression with StromalScore; C, D. Correlation of PRKAA1 expression with ImmuneScore; E, F. Correlation of PRKAA1 expression with EstimateScore; G. Relationship between PRKAA1 and immune cells in pan-cancer; H. Relationship between PRKAA1 and immune checkpoint genes in pan-cancer.
Relationship between PRKAA1 expression and TMB/MSI in pan-cancer
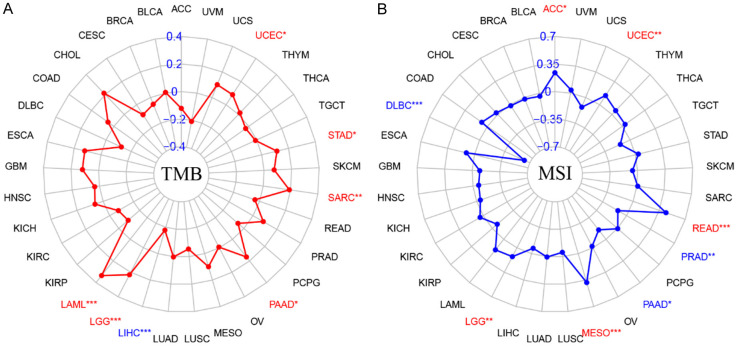
The TMB, which is the total number of mutations present in a tumor sample, was assessed via whole exome sequencing. TMB levels correlate with PD1/PD-L1 antibody efficacy, and tumor cells with higher TMB levels are more likely to be recognized by the immune system; hence, the probability that immunotherapy will be effective in these patients is higher [9,10]. MSI is a phenomenon in which the length of a microsatellite sequence is altered by insertion or deletion mutations during DNA replication. Some clinical studies have confirmed that patients with MSI-H colorectal cancer have a significant survival advantage, with poorer clinical performance but better prognosis [11,12]. Correlation analysis showed that PRKAA1 expression positively correlated with TMB in LAML, LGG, PAAD, SARC, STAD, and UCEC tumors, and PRKAA1 expression positively correlated with TMB in LIHC (Figure 4A). Regarding the correlation analysis between PRKAA1 and MSI, the results showed that PRKAA1 was positively correlated with MSI in ACC, UCEC, READ, MESO, and LGG and negatively correlated with MSI in PRAD, PAAD, and DLBC (Figure 4B).
Figure 4.
A. Relationship between TMB and PRKAA1 expression in pan-cancer; B. Relationship between MSI and PRKAA1 expression in pan-cancer.
PRKAA1 expression is significantly increased in PC
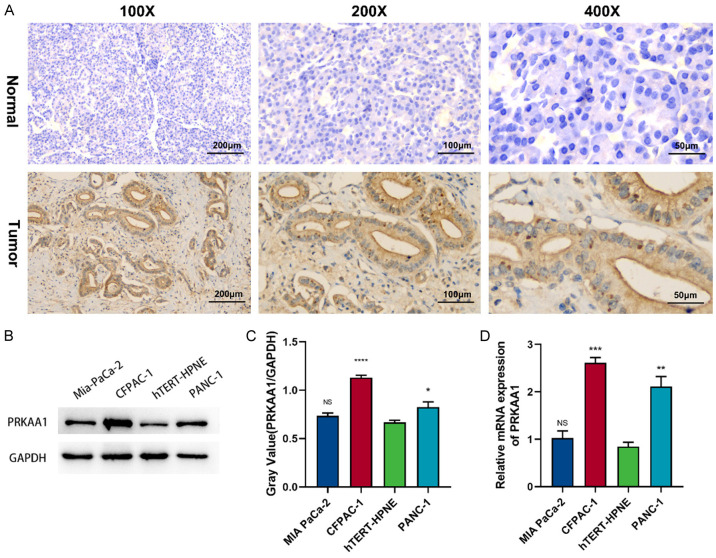
We first examined the expression of PRKAA1 in PC and healthy pancreatic tissues in paraffin-embedded tissue sections. Immunohistochemical staining showed increased PRKAA1 expression in PC tissues. Figure 5A shows representative images of PRKAA1 staining in tumors and healthy tissues at different magnifications. We also found that PRKAA1 protein expression was significantly higher in PC cell lines than in healthy pancreatic cells (hTERT-HPNE) (Figure 5B, 5C). Quantitative real-time polymerase chain reaction revealed similar results (Figure 5D).
Figure 5.
(A) Expression of PRKAA1 in pancreatic cancer and normal tissues detected by immunohistochemical staining; PRKAA1 expression in PC cells was determined by Weston blotting (B, C) and qRT-PCR (D).
High PRKAA1 expression in PC correlates with age, metastasis, and poor survival
To investigate the relationship between PRKAA1 expression and clinical characteristics, the clinical data of 75 patients (five patients lost to follow-up) with PC were analyzed (Table 1). Patients were divided into two groups based on the median level of PRKAA1 expression (high vs. low) according to immunohistochemical staining. Pearson’s χ2 test was used to analyze the correlations between PRKAA1 expression and the clinicopathological variables. PRKAA1 expression significantly correlated with age (P=0.001), M stage (P=0.003), and T stage (P<0.000). No significant correlation was observed between PRKAA1 expression and other clinical features, including histological grade, sex, tumor size, serum alpha-fetoprotein (AFP) concentration, serum cancer antigen (CA)19-9 levels, vascular invasion, nerve bundle invasion, or N stage. Therefore, high PRKAA1 expression may be a potential risk factor for PC development. However, its predictive accuracy for prognosis needs to be further investigated.
High PRKAA1 expression is an independent risk factor for poor prognosis in PC patients
To examine whether PRKAA1 expression was an independent prognostic factor for PC, we performed univariate and multivariate Cox proportional hazards regression analyses using data on clinicopathological features and PRKAA1 expression levels in 75 patients with PC (Table 2). The univariate analysis revealed that serum CA19-9 levels (HR=1.001 [95% CI 1.000-1.002]; P=0.014), M-stage (HR=4.498 [95% CI 2.548-7.939]; P=0.001), T-stage (HR=1.959 [95% CI 1.241-3.094]; P=0.004), and PRKAA1 expression (HR=1.991 [95% CI 1.206-3.288]; P=0.007) were associated with shorter survival. In contrast, age, sex, tumor size, degree of differentiation, vascular invasion, nerve bundle invasion, serum AFP concentration, and N stage were not significantly associated with PRKAA1 expression.
Table 2.
Univariate and multivariate Cox proportional-hazards regression analyses for patients with PC
| Characteristic | Univariate analysis | Multivariate analysis | ||
|---|---|---|---|---|
|
|
|
|||
| HR (95% CI) | P value | HR (95% CI) | P value | |
| Age | 1.284 (0.787-2.095) | 0.316 | ||
| Sex | 1.385 (0.812-2.363) | 0.232 | ||
| Tumor size (cm) | 1.364 (0.829-2.244) | 0.222 | ||
| Diferentiation status | 1.042 (0.705-1.538) | 0.837 | ||
| Vascular invasion status | 1.018 (0.621-1.670) | 0.943 | ||
| Neural tract invasion status | 1.160 (0.699-1.925) | 0.565 | ||
| CA199 (U/ml) | 1.001 (1.000-1.002) | 0.014 | 1.000 (0.999-1.001) | 0.847 |
| AFP (ng/ml) | 0.256 (0.760-1.076) | 0.256 | ||
| T stage | 1.959 (1.241-3.094) | 0.004 | 0.982 (0.584-1.651) | 0.944 |
| N stage | 1.307 (0.911-1.876) | 0.146 | ||
| M stage | 4.498 (2.548-7.939) | 0.001 | 4.453 (2.244-8.837) | 0.001 |
| PRKAA1 | 1.991 (1.206-3.288) | 0.007 | 1.879 (1.067-3.310) | 0.029 |
We then included the variables with P<0.1 from the univariate analysis - serum CA19-9 concentration, M-stage, T-stage, and PRKAA1 expression - in the multivariate Cox proportional-hazards regression analysis. The results showed that M stage (HR=4.453 [95% CI 2.244-8.837]; P=0.001) and PRKAA1 expression (HR=1.879 [95% CI 1.067-3.310]; P=0.029) were independent prognostic predictors of PC.
We followed up the survival data of the patients, and a combined analysis of PRKAA1 expression in conjunction with immunohistochemistry revealed that high PRKAA1 expression was associated with poorer OS (HR=2.667; 95% confidence interval 1.637-4.343; P=0.037) (Figure 6).
Figure 6.
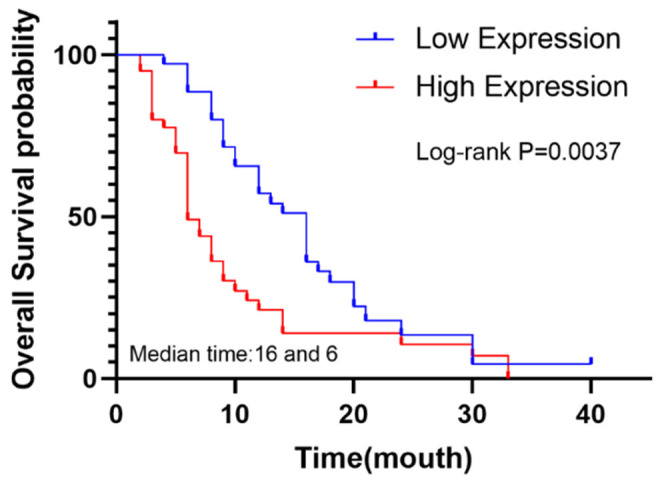
The overall survival curve of 75 pancreatic cancer patients with high and low expression of PRKAA1 was analyzed.
Inhibition of PRKAA1 expression suppresses PC cell proliferation, migration and invasion
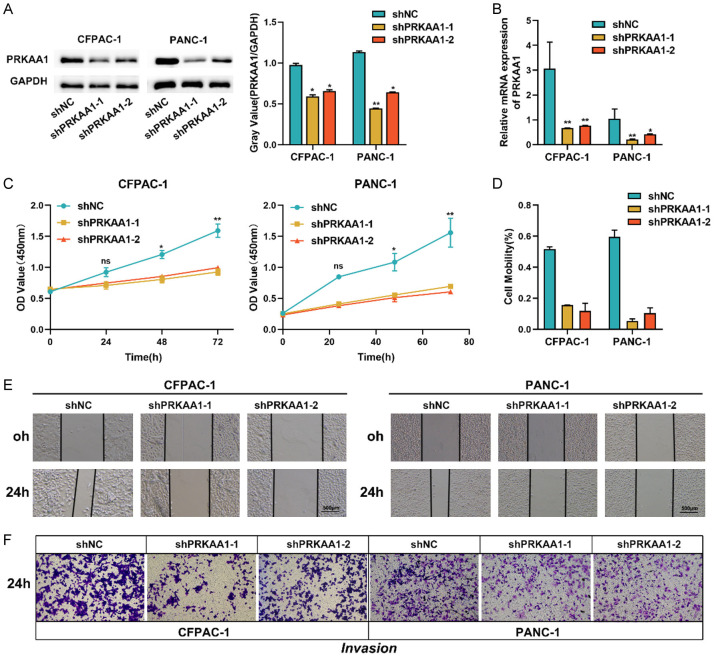
The observation that PRKAA1 was upregulated in PC was immediately followed by investigation of its biological role in PC progression. We used a lentivirus encoding PRKAA1 to construct PRKAA1-silenced cell lines (CFPAC-1 and PANC-1) that were stably transfected with PRKAA1. PRKAA1 mRNA and protein expression were knocked down in both cell lines (Figure 7A, 7B). First, we investigated the effect of PRKAA1 expression on PC cell proliferation. Figure 7C shows that the knockdown of PRKAA1 significantly reduced the proliferation of PANC-1 and CFPAC-1 cells in the CCK-8 assay. In addition, the scratch assay (Figure 7D, 7E) confirmed that PRKAA1 knockdown reduced the motility of PANC-1 and CFPAC-1 cells. The Transwell cell invasion assay (Figure 7F) confirmed that PRKAA1 silencing inhibited the invasive ability of PC cells.
Figure 7.
The knockdown efficiency of PRKAA1 in PC cells was determined by Weston blotting (A) and qRT-PCR (B); (C) Cell proliferation was detected by CCK8 assay; (D, E) Wound healing assay was used to detect cell migration; (F) Transwell assay was used to detect cell invasion.
PRKAA1 overexpression promotes the proliferation, migration, and invasion of PC cell lines
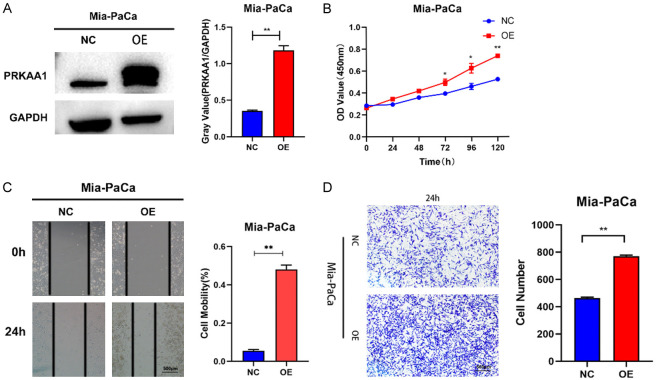
The effects of PRKAA1 overexpression are shown in Figure 8A. The proliferation of cell lines overexpressing PRKAA1 was significantly enhanced at 48, 72, and 96 h compared to that of the negative control (Figure 8B). The results of the scratch migration assay (Figure 8C) showed that the migration of cells overexpressing PRKAA1 was significantly enhanced after 24 h. In the subsequent cell invasion assay, we found that cell lines overexpressing PRKAA1 had significantly enhanced invasion ability after 24 h (Figure 8D).
Figure 8.
Weston blotting (A) Detection of PRKAA1 overexpression efficiency in PC cells; (B) CCK8 assay for cell proliferation; (C) Scratch assay for cell migration; (D) Transwell assay for cell invasion.
PRKAA1 promotes phosphorylation activation of the PI3K/ATK pathway
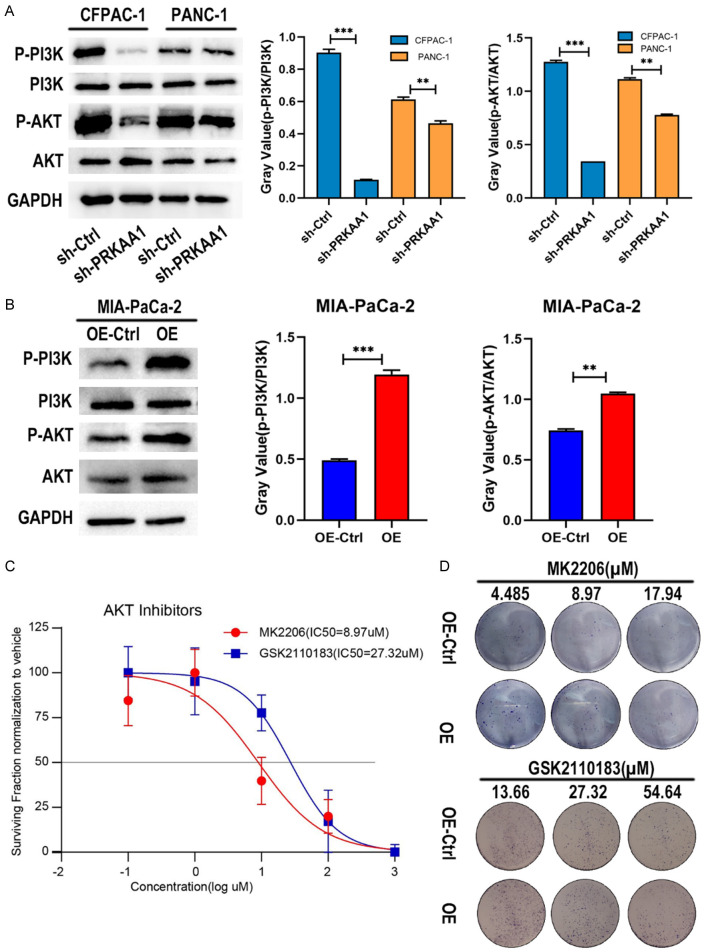
The PI3K/AKT signaling pathway is a key signaling pathway in tumor research. We investigated the changes in this signaling pathway in PRKAA1 overexpressing cell lines and knockdown cell lines. We found that (Figure 9A, 9B) compared to the control group, P-PI3K and P-AKT were significantly reduced in the PRKAA1 knockdown group, as were the ratios of P-PI3K/PI3K and P-AKT/AKT. Conversely, PRKAA1 overexpression led to increased levels of P-PI3K and P-AKT, as well as higher P-PI3K/PI3K and P-AKT/AKT ratios.
Figure 9.
A. Western blotting was performed to detect changes in p-PI3K/PI3K and p-AKT/AKT ratios in CFPAC-1 and PANC-1 cell knockdown models; B. Western blotting was performed to detect changes in p-PI3K/PI3K and p-AKT/AKT ratios in the Mia-PaCa cell overexpression model; C. IC50 values of MK2206 and GSK2110183 in Mia-PaCa cells determined by CCK8 assay; D. Drug survival assay.
We determined the IC50 values of the AKT inhibitors, MK2206 and GSK2110183 (Figure 9C). Drug survival experiments revealed that the PRKAA1 overexpression group was less sensitive to AKT inhibitors than the NC group (Figure 9D).
Discussion
Despite significant research efforts, PC remains highly aggressive and has a poor prognosis; therefore, new therapeutic targets are urgently required. PRKAA1 has been found to be involved in glycolipid metabolism, vasodilation, and autophagy [13-16]; however, research on its role in cancer is incomplete. We integrated data from the TCGA and GTEx databases and performed pan-cancer expression analysis, which showed that PRKAA1 was significantly and abnormally highly expressed in many tumors. In addition, we performed COX regression and Kaplan-Meier survival curve analyses, confirming that PRKAA1 has the potential to be a reliable biomarker. PRKAA1 has been shown to have a unique role in cancer evolution. For example, Zhang et al. [17] explored the role of PRKAA1 in gastric cancer and found that PRKAA1 promotes the proliferation of gastric cancer cells and inhibits apoptosis by activating the JNK1 and Akt pathways. Zhang et al. [18] also found that PRKAA1 promotes cell proliferation and glycolysis in gastric cancer by regulating redox homeostasis. Obba et al. [19] explored the role of PRKA1 in CMML and found that PRKAA1 triggers autophagy during the CSF1-induced differentiation of human monocytes. Yi et al. [20] found that high expression of AMPKα1 in advanced breast cancer prevents tumor metastasis.
The tumor microenvironment in PC is closely associated with chemotherapy resistance. It is worth noting that PRKAA1 is involved in tumor immunotherapy. Gao et al. [21] found that PRKAA1 deactivation can lead to lung cancer via CD8+/CD4+ T-cell infiltration and antigen presentation reduction, which can lead to immune escape by lung cancer cells. Chen et al. [22] also noted that PRKAA1 expression in gastric cancer is associated with immune infiltration. However, none of these studies have examined the relationship between PRKAA1 and other immune features. Therefore, we first investigated the relationship between PRKAA1 and immune infiltration scores and found that PRKAA1 expression was negatively correlated with stromal and immune scores in the four swellings. This suggests that high PRKAA1 expression suppresses the immune response in patients and that a reduction in immune infiltration hinders the effectiveness of immunotherapy. PRKAA1 expression significantly correlated with B cells, CD4+ T cells, CD8+ T cells, neutrophils, macrophages, and DC in 33 tumors. Targeting immune checkpoint genes reverses the immunosuppressive tumor microenvironment, which in turn activates immune cells to fight tumors [23]. We found that PRKAA1 positively correlated with a variety of immune checkpoint genes, such as EDNRB, VEGF, and CD274. These results suggest that PRKAA1 may be involved in tumor immunotherapy and that PRKAA1 may be involved in tumor immunotherapy, providing insights for the development of immune checkpoint inhibitors.
Biomarkers, such as TMB, MSI, and PD-L1, predict the efficacy of tumor immunotherapy. Patients with both TMB-H and MSI-H can benefit from immunotherapy [24]. We explored the relationship between PRKAA1, TMB, and MSI in pan-cancer and showed that PRKAA1 expression positively correlated with TMB in six tumors and with MSI in five tumors. Notably, PRKAA1 expression positively correlated with both TMB and MSI in LGG and UCEC. We speculate that patients with high PRKAA1 expression in LGG and UCEC will better benefit from immunotherapy.
Subsequently, we used PC as an entry point to explore the effect of PRKAA1 on the proliferation, invasion, and migration ability of PC cells, as well as its potential mechanisms of action. We compared the clinicopathologic information of patients with varying PRKAA1 levels and found that the high expression of PRKAA1 was correlated with the patients’ M stage. We analyzed the relationship between PRKAA1 expression and patient prognosis and determined that patients with high PRKAA1 expression had a poor prognosis. The above analyses and the univariate and multivariate COX regression analyses showed that PRKAA1 was an independent prognostic factor for PC. Knockdown and overexpression of PC cells showed that PRKAA1 overexpression promoted the proliferation, invasion, and migration of PC cells, whereas PRKAA1 knockdown inhibited their malignant biological behaviors. These results suggest that PRKAA1 can promote the biological progression of PC. Aberrant activation of the PI3K/Akt signaling pathway promotes the survival and proliferation of various human tumor cells [25]. Interestingly, our analysis showed that the PRKAA1 knockdown significantly reduced the levels of p-PI3K/PI3K, p-Akt/Akt. Using Akt inhibitors to treat cells, we found that low PRKAA1 expression enhanced the antitumor effects of Akt inhibitors. These results further indicate that PRKAA1 may promote PC progression through the PI3K/Akt signaling pathway.
This study had certain limitations that should be acknowledged. Although we propose that PRKAA1 promotes the malignant biological process of PC through the PI3K/Akt signaling pathway, its direct target in PC was not identified in the present study. It is also noteworthy that the number of patients included was limited, especially because fresh specimens were not collected for protein expression assays. Furthermore, our study lacked a direct in vivo validation of the role of PRKAA1 in PC. Studying the specific mechanisms of action of PRKAA1 in PC will expand our understanding of its role. In future studies, we will continue to explore the detailed mechanisms through which PRKAA1 regulates the PI3K-Akt pathway in PC.
In summary, PRKAA1, a pan-oncogene that is differentially expressed in different malignancies, could reflect the survival prognosis of patients with diverse tumors and could act as a therapeutic and prognostic marker for a variety of malignancies. PRKAA1 exhibited a remarkable correlation with both immune cell infiltration and immune checkpoint genes, suggesting its potential as a target for tumor immunotherapy. In addition, the present study revealed that PRKAA1 is aberrantly overexpressed in PC and ultimately promotes PC cell proliferation, migration, and invasion, in part through the activation of the PI3K/Akt signaling pathway. Therefore, PRKAA1 is a potentially useful therapeutic target for PC.
Acknowledgements
This project was supported by the Key Science and Technology Foundation of Gansu Province (20YF3FA033); Gansu Provincial Science and Technology Program (23JRRA1008, 23JRRA0979); and Gansu Clinical Medical Research Center Construction Project (21JR7RA433). We would like to thank Editage (www.editage.cn) for English language editing.
Disclosure of conflict of interest
None.
References
- 1.Steinberg GR, Kemp BE. AMPK in health and disease. Physiol Rev. 2009;89:1025–1078. doi: 10.1152/physrev.00011.2008. [DOI] [PubMed] [Google Scholar]
- 2.Jeon SM, Hay N. The dark face of AMPK as an essential tumor promoter. Cell Logist. 2012;2:197–202. doi: 10.4161/cl.22651. [DOI] [PMC free article] [PubMed] [Google Scholar]
- 3.Hardie DG, Ross FA, Hawley SA. AMPK: a nutrient and energy sensor that maintains energy homeostasis. Nat Rev Mol Cell Biol. 2012;13:251–262. doi: 10.1038/nrm3311. [DOI] [PMC free article] [PubMed] [Google Scholar]
- 4.Wu Y, Zheng Q, Li Y, Wang G, Gao S, Zhang X, Yan X, Zhang X, Xie J, Wang Y, Sun X, Meng X, Yin B, Wang B. Metformin targets a YAP1-TEAD4 complex via AMPKα to regulate CCNE1/2 in bladder cancer cells. J Exp Clin Cancer Res. 2019;38:376. doi: 10.1186/s13046-019-1346-1. [DOI] [PMC free article] [PubMed] [Google Scholar]
- 5.Jones RG, Plas DR, Kubek S, Buzzai M, Mu J, Xu Y, Birnbaum MJ, Thompson CB. AMP-activated protein kinase induces a p53-dependent metabolic checkpoint. Mol Cell. 2005;18:283–293. doi: 10.1016/j.molcel.2005.03.027. [DOI] [PubMed] [Google Scholar]
- 6.Jeon SM, Chandel NS, Hay N. AMPK regulates NADPH homeostasis to promote tumour cell survival during energy stress. Nature. 2012;485:661–665. doi: 10.1038/nature11066. [DOI] [PMC free article] [PubMed] [Google Scholar]
- 7.Ye T, Su J, Huang C, Yu D, Dai S, Huang X, Chen B, Zhou M. Isoorientin induces apoptosis, decreases invasiveness, and downregulates VEGF secretion by activating AMPK signaling in pancreatic cancer cells. Onco Targets Ther. 2016;9:7481–7492. doi: 10.2147/OTT.S122653. [DOI] [PMC free article] [PubMed] [Google Scholar]
- 8.Zhao G, Zhang JG, Liu Y, Qin Q, Wang B, Tian K, Liu L, Li X, Niu Y, Deng SC, Wang CY. miR-148b functions as a tumor suppressor in pancreatic cancer by targeting AMPKα1. Mol Cancer Ther. 2013;12:83–93. doi: 10.1158/1535-7163.MCT-12-0534-T. [DOI] [PubMed] [Google Scholar]
- 9.Chan TA, Yarchoan M, Jaffee E, Swanton C, Quezada SA, Stenzinger A, Peters S. Development of tumor mutation burden as an immunotherapy biomarker: utility for the oncology clinic. Ann Oncol. 2019;30:44–56. doi: 10.1093/annonc/mdy495. [DOI] [PMC free article] [PubMed] [Google Scholar]
- 10.Mosele F, Remon J, Mateo J, Westphalen CB, Barlesi F, Lolkema MP, Normanno N, Scarpa A, Robson M, Meric-Bernstam F, Wagle N, Stenzinger A, Bonastre J, Bayle A, Michiels S, Bièche I, Rouleau E, Jezdic S, Douillard JY, Reis-Filho JS, Dienstmann R, André F. Recommendations for the use of next-generation sequencing (NGS) for patients with metastatic cancers: a report from the ESMO Precision Medicine Working Group. Ann Oncol. 2020;31:1491–1505. doi: 10.1016/j.annonc.2020.07.014. [DOI] [PubMed] [Google Scholar]
- 11.André T, Shiu KK, Kim TW, Jensen BV, Jensen LH, Punt C, Smith D, Garcia-Carbonero R, Benavides M, Gibbs P, de la Fouchardiere C, Rivera F, Elez E, Bendell J, Le DT, Yoshino T, Van Cutsem E, Yang P, Farooqui MZH, Marinello P, Diaz LA Jr KEYNOTE-177 Investigators. Pembrolizumab in microsatellite-instability-high advanced colorectal cancer. N Engl J Med. 2020;383:2207–2218. doi: 10.1056/NEJMoa2017699. [DOI] [PubMed] [Google Scholar]
- 12.Marabelle A, Le DT, Ascierto PA, Di Giacomo AM, De Jesus-Acosta A, Delord JP, Geva R, Gottfried M, Penel N, Hansen AR, Piha-Paul SA, Doi T, Gao B, Chung HC, Lopez-Martin J, Bang YJ, Frommer RS, Shah M, Ghori R, Joe AK, Pruitt SK, Diaz LA Jr. Efficacy of pembrolizumab in patients with noncolorectal high microsatellite instability/mismatch Repair-deficient cancer: results from the phase II KEYNOTE-158 study. J. Clin. Oncol. 2020;38:1–10. doi: 10.1200/JCO.19.02105. [DOI] [PMC free article] [PubMed] [Google Scholar]
- 13.Moore LG. Hypoxia and reproductive health: reproductive challenges at high altitude: fertility, pregnancy and neonatal well-being. Reproduction. 2021;161:F81–F90. doi: 10.1530/REP-20-0349. [DOI] [PubMed] [Google Scholar]
- 14.Niu C, Chen Z, Kim KT, Sun J, Xue M, Chen G, Li S, Shen Y, Zhu Z, Wang X, Liang J, Jiang C, Cong W, Jin L, Li X. Metformin alleviates hyperglycemia-induced endothelial impairment by downregulating autophagy via the Hedgehog pathway. Autophagy. 2019;15:843–870. doi: 10.1080/15548627.2019.1569913. [DOI] [PMC free article] [PubMed] [Google Scholar]
- 15.Song YM, Lee YH, Kim JW, Ham DS, Kang ES, Cha BS, Lee HC, Lee BW. Metformin alleviates hepatosteatosis by restoring SIRT1-mediated autophagy induction via an AMP-activated protein kinase-independent pathway. Autophagy. 2015;11:46–59. doi: 10.4161/15548627.2014.984271. [DOI] [PMC free article] [PubMed] [Google Scholar]
- 16.Yang Q, Xu J, Ma Q, Liu Z, Sudhahar V, Cao Y, Wang L, Zeng X, Zhou Y, Zhang M, Xu Y, Wang Y, Weintraub NL, Zhang C, Fukai T, Wu C, Huang L, Han Z, Wang T, Fulton DJ, Hong M, Huo Y. PRKAA1/AMPKα1-driven glycolysis in endothelial cells exposed to disturbed flow protects against atherosclerosis. Nat Commun. 2018;9:4667. doi: 10.1038/s41467-018-07132-x. [DOI] [PMC free article] [PubMed] [Google Scholar]
- 17.Zhang Y, Zhou X, Cheng X, Hong X, Jiang X, Jing G, Chen K, Li Y. PRKAA1, stabilized by FTO in an m6A-YTHDF2-dependent manner, promotes cell proliferation and glycolysis of gastric cancer by regulating the redox balance. Neoplasma. 2022;69:1338–1348. doi: 10.4149/neo_2022_220714N714. [DOI] [PubMed] [Google Scholar]
- 18.Zhang Y, Zhou X, Cheng L, Wang X, Zhang Q, Zhang Y, Sun S. PRKAA1 promotes proliferation and inhibits apoptosis of gastric cancer cells through activating JNK1 and Akt pathways. Oncol Res. 2020;28:213–223. doi: 10.3727/096504019X15668125347026. [DOI] [PMC free article] [PubMed] [Google Scholar]
- 19.Obba S, Hizir Z, Boyer L, Selimoglu-Buet D, Pfeifer A, Michel G, Hamouda MA, Gonçalvès D, Cerezo M, Marchetti S, Rocchi S, Droin N, Cluzeau T, Robert G, Luciano F, Robaye B, Foretz M, Viollet B, Legros L, Solary E, Auberger P, Jacquel A. The PRKAA1/AMPKα1 pathway triggers autophagy during CSF1-induced human monocyte differentiation and is a potential target in CMML. Autophagy. 2015;11:1114–1129. doi: 10.1080/15548627.2015.1034406. [DOI] [PMC free article] [PubMed] [Google Scholar]
- 20.Yi Y, Chen D, Ao J, Zhang W, Yi J, Ren X, Fei J, Li F, Niu M, Chen H, Luo Y, Luo Z, Xiao ZJ. Transcriptional suppression of AMPKα1 promotes breast cancer metastasis upon oncogene activation. Proc Natl Acad Sci U S A. 2020;117:8013–8021. doi: 10.1073/pnas.1914786117. [DOI] [PMC free article] [PubMed] [Google Scholar]
- 21.Gao Y, Päivinen P, Tripathi S, Domènech-Moreno E, Wong IPL, Vaahtomeri K, Nagaraj AS, Talwelkar SS, Foretz M, Verschuren EW, Viollet B, Yan Y, Mäkelä TP. Inactivation of AMPK leads to attenuation of antigen presentation and immune evasion in lung adenocarcinoma. Clin Cancer Res. 2022;28:227–237. doi: 10.1158/1078-0432.CCR-21-2049. [DOI] [PubMed] [Google Scholar]
- 22.Chen Y, Chen S, Zhu J, Yang S, Yu Q, Xu S. PRKAA1 predicts prognosis and is associated with immune characteristics in gastric cancer. Funct Integr Genomics. 2023;23:252. doi: 10.1007/s10142-023-01176-z. [DOI] [PubMed] [Google Scholar]
- 23.Gaikwad S, Agrawal MY, Kaushik I, Ramachandran S, Srivastava SK. Immune checkpoint proteins: signaling mechanisms and molecular interactions in cancer immunotherapy. Semin Cancer Biol. 2022;86:137–150. doi: 10.1016/j.semcancer.2022.03.014. [DOI] [PubMed] [Google Scholar]
- 24.Palmeri M, Mehnert J, Silk AW, Jabbour SK, Ganesan S, Popli P, Riedlinger G, Stephenson R, de Meritens AB, Leiser A, Mayer T, Chan N, Spencer K, Girda E, Malhotra J, Chan T, Subbiah V, Groisberg R. Real-world application of tumor mutational burden-high (TMB-high) and microsatellite instability (MSI) confirms their utility as immunotherapy biomarkers. ESMO Open. 2022;7:100336. doi: 10.1016/j.esmoop.2021.100336. [DOI] [PMC free article] [PubMed] [Google Scholar]
- 25.Ediriweera MK, Tennekoon KH, Samarakoon SR. Role of the PI3K/AKT/mTOR signaling pathway in ovarian cancer: biological and therapeutic significance. Semin Cancer Biol. 2019;59:147–160. doi: 10.1016/j.semcancer.2019.05.012. [DOI] [PubMed] [Google Scholar]


