Abstract
Background
177Lu-based radiopharmaceuticals (RPs) are the most used for targeted radionuclide therapy (TRT) due to their good response rates. However, the worldwide availability of 177Lu is limited. 161Tb represents a potential alternative for TRT, as it emits photons for SPECT imaging, β−-particles for therapy, and also releases a significant yield of internal conversion (IE) and Auger electrons (AE). This research aimed to evaluate cell dosimetry with the MIRDcell code considering a realistic localization of three 161Tb- and 177Lu-somatostatin (SST) analogs in different subcellular regions as reported in the literature, various cell cluster sizes (25–1000 µm of radius) and percentage of labeled cells. Experimental values of the α- and β-survival coefficients determined by external beam photon irradiation were used to estimate the survival fraction (SF) of AR42J pancreatic cell clusters and micrometastases.
Results
The different localization of RPs labeled with the same radionuclide within the cells, resulted in only slight variations in the dose absorbed by the nuclei (ADN) of the labeled cells with no differences observed in either the unlabeled cells or the SF. ADN of labeled cells (MDLC) produced by 161Tb-RPs were from 2.8–3.7 times higher than those delivered by 177Lu-RPs in cell clusters with a radius lower than 0.1 mm and 10% of labeled cells, due to the higher amount of energy emitted by 161Tb-disintegration in form of IE and AE. However, the 161Tb-RPs/177Lu-RPs MDLC ratio decreased below 1.6 in larger cell clusters (0.5–1 mm) with > 40% labeled cells, due to the significantly higher 177Lu-RPs cross-irradiation contribution. Using a fixed number of disintegrations, SFs of 161Tb-RPs in clusters with > 40% labeled cells were lower than those of 177Lu-RPs, but when the same amount of emitted energy was used no significant differences in SF were observed between 177Lu- and 161Tb-RPs, except for the smallest cluster sizes.
Conclusions
Despite the emissions of IE and AE from 161Tb-RPs, their localization within different subcellular regions exerted a negligible influence on the ADN. The same cell damage produced by 177Lu-RPs could be achieved using smaller quantities of 161Tb-RPs, thus making 161Tb a suitable alternative for TRT.
Supplementary Information
The online version contains supplementary material available at 10.1186/s40658-024-00696-2.
Keywords: Theranostics, 161Tb, Cell dosimetry, Targeted radionuclide therapy, Somatostatin analogs, Radiopharmaceuticals, 177Lu
Background
Targeted radionuclide therapy (TRT) is a nuclear medicine technique that uses radiopharmaceuticals (RPs) with high affinity to receptors or antigens on the surface of tumor cells to achieve a therapeutic effect. The use of TRT has increased significantly over the past decade due to an expanded knowledge of radiochemistry, cancer biology, and bioengineering [1]. TRT causes less collateral damage than external beam radiotherapy (EBRT) because the RPs are selectively taken up by tumors and their metastases, delivering high doses of radiation to cancer cells and minimizing doses to normal tissues [2]. In addition, RPs can have a longer therapeutic effect than EBRT because they can remain in the cells until the radionuclide decays completely, reducing the number of treatments required for the patient [1]. 177Lu is the radionuclide most frequently used for TRT [3]. Although 177Lu-RPs have shown promising safety and response rates, there are concerns about the availability of 177Lu due to the limited production capabilities of this non-carrier-added radioisotope [4, 5]. Furthermore, no Lu radioisotope with optimal properties could be used as a "matched pair" to obtain an accurate patient dosimetric assessment via imaging. Consequently, in clinical TRT, 177Lu must be paired with radionuclides of different elements, such as 68Ga or 111In [6, 7].
Terbium-161 (161Tb) has decay properties similar to 177Lu, such as a long half-life of 6.91 days, low-energy photon emission suitable for SPECT imaging, and relatively low-energy β−-particles useful for therapy (Table 1). In addition, the isotopes 152Tb and 155Tb, positron and γ emitters, respectively, could be employed as matched pairs to obtain the nuclear images necessary for the dosimetric calculations [8]. Therefore, Lehenberger et al. proposed using 161Tb for TRT [9].
Table 1.
Comparison of main decay characteristics of 177Lu and 161Tb
| Radionuclide | t1/2 (d) | γ-emission | β−-emission | Internal conversion (keV/decay) | Auger Electron (keV/decay) | Total Electron energy/decay (keV) | |||
|---|---|---|---|---|---|---|---|---|---|
| Energy (keV) | Yield (%) | Mean energy (keV) | End point energy (keV) | Yield (%) | |||||
| 177Lu | 6.71 | 112 | 6 | 47 | 176 | 12 | 13.5 | 1.13 | 147.9 |
| 208 | 11 | 111 | 384 | 9 | |||||
| 149 | 497 | 79 | |||||||
| 161Tb | 6.91 | 26 | 23 | 138 | 461 | 25 | 39.2 | 8.94 | 202.5 |
| 46* | 11 | 157 | 518 | 65 | |||||
| 49 | 17 | 175 | 567 | 5 | |||||
| 75 | 10 | 184 | 593 | 5 | |||||
*X-ray
Bifunctional chelating agents, such as DOTA, have been reported to label molecules with 161Tb [10]. DOTA produces stable complexes with biodistribution and pharmacokinetic characteristics similar to those of 177Lu-complexes, as both lanthanides have similar chemical properties [11, 12]. Additionally, research has shown that 161Tb-RPs improve the therapeutic effectiveness compared to those labeled with 177Lu [13]. Alcocer-Avila et al. performed a comparison between the radiation doses delivered to the cell nucleus by 161Tb and 177Lu, assuming different distributions of the radionuclide within the cells using a Monte Carlo track-structure code called CELLDOSE [14, 15]. The study results indicated that, for the same amount of electron energy released, 161Tb delivers from 2.6 to 3.6 times more dose than 177Lu to the nucleus of a single cell, depending on the localization of the radionuclides in different cell compartments. The increase in cell-absorbed dose (AD) after 161Tb treatment is mainly due to the higher number of internal conversion electrons (IE) and Auger electrons (AE) with energies ≤ 40 keV. Based on these findings, it has been concluded that 161Tb is a better candidate for irradiating single tumor cells and micrometastasis. A recent study, conducted by the same research group, reported the use of CELLDOSE to assess the dose to the nucleus and membrane in a 19-cell cluster model after treatment with 161Tb or 177Lu, assuming the radionuclides localized on the cell surface, the cytoplasm or the nucleus. The findings indicated that when all 19 cells were targeted and the radionuclides are in the cytoplasm or on the cell surface, the ADs delivered to cell membranes by 161Tb were two- to sixfold higher than those delivered by 177Lu. The authors confirmed that the absorbed dose to cell nuclei (ADN) after 161Tb treatment were two- to threefold higher than those delivered by 177Lu [16]. However, a precise determination of biological damage based on a realistic localization of the radioisotope within the cell is still lacking. In the case of 161Tb, it is crucial to consider its cell localization because it has been demonstrated that low-energy electron emitters can cause more biological damage than high-LET α-particles when the decay occurs near the nuclear DNA [17].
Borgna et al. recently labeled three somatostatin (SST) analogs (DOTATOC, DOTATOC-NLS, and DOTA-LM3) with 161Tb and 177Lu to investigate the effect of RPs localization on cell viability and survival [13]. They concluded, as Alcocer-Avila, that the IE and AE emitted by 161Tb contributed positively to its therapeutic efficacy. However, the authors did not perform dosimetric evaluations.
The aim of this study was to assess and compare the radiation doses delivered to nuclei by three 161Tb- and 177Lu-SST analogs on AR42J pancreatic tumor cells, using the MIRDcell 4.14 code, considering the realistic localization of the RPs in different subcellular regions, spherical cell clusters and micrometastases of varying size and percentage of labeled cells. Moreover, a preliminary estimate of cell survival fractions (SFs) was made using the linear quadratic model and α and β survival coefficients previously determined by external photon beam irradiation, using the same software.
Methods
Experimental measurement of the average dimensions of AR42J cells
The AR42J (CRL1492) rat pancreatic tumor cell line (ATCC, Manassas, VA, USA) was cultured in Dulbecco's modified Eagle's medium (DMEM) as described in the supplementary data.
The three-dimensional (3D) cell culture was performed by immobilization of AR42J cells in sodium alginate beads. A single cell suspension containing 1 × 10⁶ viable cells was mixed with 500 μL of 1.2% low viscosity solution of alginic acid sodium salt from brown algae (SigmaAldrich, Steinheim, DEU). The bead-embedded cells were then hardened by adding them drop by drop to 15 mL of a 2.5% CaCl2 anhydrous 20 mesh solution (SigmaChem, St. Louis, MO) and incubating them for 30 min. After incubation, excess calcium was removed by rinsing the beds with phosphate-buffered saline (PBS). The cells were then maintained in a complete medium described in the supplementary information.
AR42J cells embedded in alginate beads, with an average radius of 1.2 mm, were co-stained with a 1 μM solution of propidium iodide (Merck KGaA, Darmstadt, DEU) and calcein green AM (Thermo Fisher Scientific, MA, USA) by incubating at room temperature (RT) in the dark for 15 min. Fluorescence images of AR42J cells embedded in alginate beads were obtained using a 40X objective on an inverted microscope, ImageXpress XL (Danaher, WA, USA), and analyzed with Metaxpress software. The software was used to determine the average nuclear and cytoplasmic radius.
Estimation of α-and β-survival coefficients
Three distinct methodologies were employed in the survival studies. The first two involved the standard clonogenic assay method and the assessment of EdU (5-ethynyl-2'-deoxyuridine) cell proliferation following irradiation with a Gammacell 220 irradiator (Atomic Energy of Canada, Ottawa, Canada) at a dose rate of 7.5 Gy/h. The third method involved the impedance-based real-time cell analysis conducted after irradiating the biological sample with an IBL 430 C biological sample irradiator (Schering/Cys bio-International, Milan, Italy) with a dose rate of 120 Gy/h. The supplementary information provides a detailed description of both instruments and the test performed to assess the accuracy and uniformity of the dose delivered by both of them.
Clonogenic assay
Six-well plates (Corning, New York, USA) containing 3 mL of medium were used to cultivate increasing numbers of cells (between 2 × 10³ and 8 × 10³) from a single cell suspension of AR42J. Then cells were exposed to gamma-dose between 0–10 Gy and incubated at 37 °C and 5% CO2 for at least 8 days until the formation of macroscopic colonies was clearly observed. The colonies were fixed with a 4% paraformaldehyde (PFA) solution (Sigma-Aldrich, Steinheim, DEU) and stained with a 5% crystal violet methanol solution (Merck kGaA, Darmstadt, DEU). Subsequently, the images of the former colonies obtained with a camera (Nikon, Tokyo, JPN) were analyzed with the free software ImageJ (National Institutes of Health, Bethesda, Maryland, USA) tool to obtain the number of colonies in each well. From these data, plating efficiency (PE) and survival fraction (SF) were estimated using the following Eqs. (1, 2):
| 1 |
| 2 |
The survival curve was generated by plotting the SF against the radiation dose received by the cells on a semilogarithmic scale. The α and β radiobiological parameters were estimated by fitting the data using OriginPro 2016 (OriginLab Corporation, MA, USA) with the following linear quadratic Eq. (3):
| 3 |
where D represents the radiation AD received by the cells.
EdU cell proliferation assay
Three alginate beads, each one containing 1 × 10⁵ AR42J cells were placed inside microtubes filled with 1.5 mL of complete medium. Microtubes were irradiated to reach a radiation dose of 0.5, 2, 4, 6, 8, or 10 Gy, respectively. After irradiation, each alginate bead was placed in a separate well of a 96-well plate filled with a complete medium. The plate was then incubated for 24 h, and the medium was removed. Subsequently, the alginate beads were stained with the thymidine analog (EdU Alexa Fluor 488) and Hoechst 33,342 from the Click-iT® EdU Imaging Kit (Thermo Fisher Scientific, MA, USA) following the manufacturer's instructions. To each well containing an alginate bead, 50 μL of fresh complete medium and 50 μL of the thymidine analog EdU (reactive A) were added. The well plate was incubated at 37 °C for 2 h. Next, the cells were washed twice with PBS and fixed by incubation with 100 μL of PFA at RT for 15 min. The fixed cells were then incubated with 100 μL of a 0.5% Triton X-100 solution (Biobasic, Markham, CAN) in PBS at RT for 20 min. The cells were washed twice with 3% bovine serum albumin (BSA) solution. Then 100 μL of the dye cocktail, prepared according to the kit manufacturer's instructions, was added to each well, and the plate was incubated for 30 min at RT in the dark. The beads were washed twice with 3% BSA to remove the cocktail. Finally, 100 μL of Reagent G (Hoechst, 1:2000) was added to each well and incubated for 30 min at RT in the dark, the excess dye was removed by washing the beads twice with PBS.
The plate was placed on the plate holder of the ImageXpress XL automated inverted microscope (Danaher, WA, USA) to obtain brightfield and fluorescence images with the 10 X objective using the filters with wavelengths of 350/461 nm (excitation/emission) to observe the Hoechst (total number of cells) and 495/519 nm to observe the Alexa Fluor dye (present in proliferating cells incorporating Edu). The pairs of epifluorescence images (Hoechst and Alexa) were obtained using the free software Image J. A minimum of ten image fields per bead have been taken into account at the same planar position. The images were used to manually count the Hoechst-Alexa-stained cells from the same field for each bead. The resulting numerical values were used to estimate the SF by assigning a value of 100% to the proliferation of non-irradiated AR42J cells cultured and stained under identical conditions. Finally, the survival curve was generated, as reported above.
Impedance-based real-time cell analysis
The cells were harvested when they reached 70–80% confluence, using 0.25% trypsin supplemented with 2 mM ethylenediaminetetraacetic acid, and cell number was determined using trypan blue solution. Then, 1.5 × 10⁵ cells/450 μL were washed by centrifugation at 300 g for 6 min at RT, resuspended in fresh complete medium, and irradiated with 0.5, 1, 2.5, 5, 10, or 15 Gy using the IBL 430 C biological sample γ-ray irradiator. The impedance-based xCELLigence real-time cell analysis (RTCA) instrument (Agilent Technologies, Milan, Italy) was used to determine the cellular response to irradiation. The E-plate 12 (Agilent Technologies, Milan, Italy) was filled with 50 µl of complete medium per well to measure the background impedance signal. Next, 150 µl of each irradiated cell suspension at a density of 5 × 10⁴ cells/well was added in duplicate to the 50 μL medium, and the E-plate was left at RT for 30 min to allow the cells to settle to the bottom of the well. Finally, cell proliferation was monitored by recording cell index (CI) values at 15-min intervals for 50 h using the xCELLigence RTCA software. The experiment was repeated three times, including a control group of non-irradiated cells.
To calculate the SF at each dose at 24 and 48 h after irradiation, a value of 100% survival was assigned to CI of non-irradiated AR42J cells. Survival curves were generated by plotting the SF against the radiation dose received by the cells.
Cellular dosimetry and survival fraction estimation
Dosimetric calculations were performed using MIRDcell software (v. 4.14)[18, 19] to compare the ADN values of AR42J cells incubated with one of the SST analogs (DOTATOC, DOTATOC-NLS or DOTA-LM3) labeled with either 177Lu or 161Tb. Cellular ADN was calculated for each labeled complex using as program input the full electron emission data (β-spectra, IC, and AE) reported in the International Commission on Radiological Protection publication ICRP-107 for both 161Tb and 177Lu radionuclides [20].
Two models of multicellular geometry were used for dose calculations: a two-dimensional (2D) circular colony and a 3D spherical cell cluster. The MIRDcell's one-dimensional (1D) cell-pair model was also used to compare the self-ADN and the cross-ADN to neighboring cell per nuclear transformation between 161Tb- and 177Lu-RPs. In all models, the cells were considered as two concentric spheres, with the inner sphere representing the nucleus (N), the surface of the larger sphere corresponding to the membrane or cell surface (CS), and the area between the two spheres representing the cytoplasm (Cy). CS, Cy, or N were assumed to be the source regions where radioactivity was uniformly distributed, and N was considered the only target region.
The S-Values, representing the mean ADN per nuclear decay, were calculated for all 161Tb-SST and 177Lu-SST RPs using the localization data within the cell source regions (Table 2) reported by Borgna et al. [13]. The experimentally obtained cell size and the previously described cell model were also used as program input data. Next the calculated S-values were used to assess the total ADN through the following Eq. (4):
| 4 |
where Nsource i is the number of disintegrations in the i-source region and Starget←source, i the S-values obtained with MIRDcell software.
Table 2.
Distribution of somatostatin radiopharmaceuticals within AR42J cell regions
| SST analog | Activity in source region (%) | ||
|---|---|---|---|
| Membrane | Cytoplasm | Nucleus | |
| DOTATOC | 19 | 80 | 1 |
| DOTATOC-NLS | 16 | 78 | 6 |
| DOTA-LM3 | 92 | 6 | 2 |
Finally, the MIRDcell software was employed to estimate the SF assuming either 2D circular colonies or 3D spherical cell clusters, where adjacent cells touch each other, with a radius of 25, 50, 100, 200, 300, 500, 750, or 1000 µm (diameters from 0.05 to 2 mm), with 10%, 40%, and 70% of the cells labeled with either 161Tb-RPs or 177Lu-RPs. The 40% and 70% values were selected based on the percentage of cancer cells that are expected to uptake the RP in order to achieve a therapeutic effect. Although a 10% value of labeled cells in a micrometastasis can be considered insufficient for clinical usefulness, it was included for comparative purposes. Based on the experimental data, it was estimated that the mean activity of cells could range up to a maximum value of 0.023 Bq/cell, so this value was used as the input for the Maximum Mean Activity per Cell query of the MIRDcell software. The total number of cells and labeled cells contained in each size of both multicellular geometry models were calculated by the software, which randomly selects the labeled cells within the cluster. The time-integrated activity coefficient (Ã) corresponds to the cumulative number of nuclear transformations (Bq∙s) over a dose integration period, per unit of administered activity (1 Bq) [21]. In this case, the à values obtained with dose integration from zero to infinity were 836,394 s (232 h) for 177Lu and 861,323 s (239 h) for 161Tb.
The probability of cell survival following treatment with the RPs was calculated using the linear quadratic model as described in the following equation:
| 5 |
where Dself and Dcross are the doses to the cell target due to radiation emitted by the same cell and by neighboring cells, respectively [22]. The effects of self- and cross-ADN are independent and characterized by the αself and βself, αcross and βcross parameters, respectively. In this research, it has been assumed that αself = αcross = α and βself = βcross = β. The experimental values of the α and β survival coefficients were obtained from the external irradiation assays previously described.
Results
Experimental Measurement of Average Cellular Dimensions
Accurate cell dosimetry and survival rate assessment require precise cell size and volume measurements. In a real situation, pancreatic cells assume a spherical shape that differs from that of conventional 2D cell cultures (adhered to the bottom of the flask and flattened). Therefore, a 3D culture method was used to immobilize the cells inside alginate beads, allowing them to maintain their spherical shape. This strategy allowed for a more accurate determination of cell size.
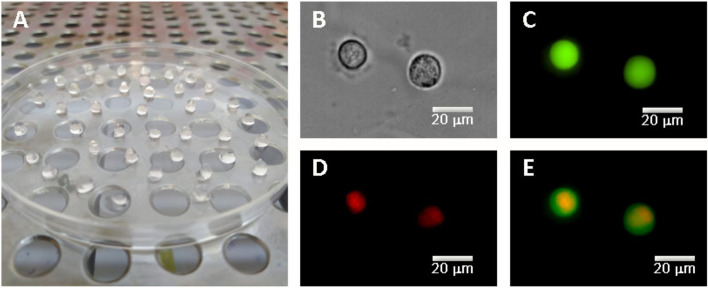
Figure 1 shows the microscopic images of stained cells embedded in alginate beads, confirming the spherical morphology of AR42J cells. The mean radius of cell and nucleus obtained from cell imaging after microscopic measurements were 8 ± 1 μm and 6 ± 1 μm, respectively.
Fig. 1.
A 3D culture of AR42J cells embedded in alginate beads. Representative microscopic images of the 3D culture AR42J cells: B phase contrast image, C cytoplasmic distribution of green AM (green) in alive cells, D nuclear imaging, staining with propidium iodide (red), and E merged image of C and D
Estimation of α- and β-survival coefficients
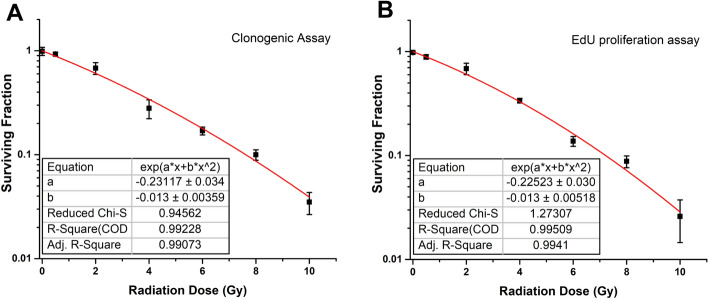
The results of clonogenic and EdU proliferation assays (Figure S1) were used to construct the dose–response curves (Fig. 2). By fitting proliferation curves to a linear-quadratic equation, the average values of the radiobiological parameters were estimated as α = 0.225 ± 0.031 and β = 0.013 ± 0.005.
Fig. 2.
Survival curve obtained from A clonogenic assay and B EdU proliferation assay at 24 h after irradiation. Each point represents the mean value of the six experiments, and the bars indicate the standard errors obtained. The red line represents the best fit to the experimental data points using the linear-quadratic model
Impedance-based real-time cell analysis allows for proliferation monitoring, recording CI values every 15-min intervals for 50 h (Figure S2A). In contrast to the results obtained with both the clonogenic and the EdU proliferation assays, the proliferation analysis of AR42J cells performed with the xCELLingence instrument did not show significant differences in proliferation after irradiation with increasing dose (Figure S2B). This discrepancy could be attributed to the cell line's characteristics and methodology. The AR42J cell line does not grow as a monolayer, and due to the formation of 'domes,' it never properly reaches the confluence of the well. This peculiarity may have affected the results obtained with the xCELLigence instrument, as impedance measurement is closely related to cell adhesion to the well. It is possible that if irradiation damages cells forming 'domes,' the impedance would not be notably affected, resulting in minimal differences between cell proliferation rates of cells irradiated with the various doses. Therefore, this assay may not be the best method for detecting the irradiation effect on the AR42J cell line.
Cellular dosimetry and survival
Table 3 shows the calculated 1D cell pair S-values for the three RPs under investigation, assuming cells with a radius of 8 μm and a nucleus radius of 6 μm and considering the radioactivity distribution within the cell regions reported in Table 2. The results demonstrated that both self- and cross-irradiation S-values were consistently higher for 161Tb than for 177Lu, due to the higher electron energy emitted per decay. As expected, the higher concentration of NLS in the cell nucleus resulted in the highest self-irradiation S-value, which was 1.2 and 1.6 times higher than those of DOTATOC and LM3, respectively, when the RPs were labeled with 161Tb and 1.1 and 1.5 times higher when labeled with 177Lu. In contrast, minimal differences were observed among the cross-irradiation S-values of different RPs labeled with the same radionuclide.
Table 3.
Calculated S-values (Gy/Bq-s) of self-irradiation and cross-irradiation to a neighboring cell (1D cell pair model) considering the real subcellular distribution of three molecular probes (DOTATOC, NLS, and LM3) labeled with 161Tb or 177Lu, reported in Table 2
| Molecular probe | 161 Tb | 177Lu | 161 Tb/177Lu ratio | |||
|---|---|---|---|---|---|---|
| Self | Cross | Self | Cross | Self | Cross | |
| DOTATOC | 6.97E−04 | 7.66E−05 | 1.95E−04 | 2.98E−05 | 3.57 | 2.57 |
| NLS | 8.27E−04 | 7.58E−05 | 2.20E−04 | 2.97E−05 | 3.76 | 2.55 |
| LM3 | 5.33E−04 | 8.05E−05 | 1.48E−04 | 3.05E−05 | 3.60 | 2.64 |
The total number of cells and labeled cells contained in each size of both multicellular geometry models, calculated assuming cells with a radius of 8 μm touching each other, are reported in Table S1.
Numerous data were generated for each cell model when calculating the dosimetry and effect on cell survival of three 177Lu- and three 161 Tb-SST analog RPs at the eight cluster sizes and three labeled cancer cell percentage levels indicated in Table S1. Therefore, to simplify the analysis explanation of the main findings, only the 3D dosimetric results of 177Lu-DOTATOC and 161 Tb-DOTATOC at three cluster sizes with three labeled cancer cell percentage levels will be shown first. Subsequently, the results of the three 177Lu-RPs and three 161Tb-RPs at all cluster sizes and three labeled cancer cell percentage levels for both 3D and 2D models will be shown and analyzed.
Table 4 shows the mean ADN values on labeled cells (MDLC) and on unlabeled cells (MDUC) for different amounts of activity of 177Lu- and 161Tb-DOTATOC and clusters of 100, 500, and 1000 µm considering 10, 40, or 70% of labeled cells. The MDLC values are dependent on the contributions of both self- and cross-irradiation, whereas the MDUC values are dependent only on the cross-irradiation contribution. Additionally, the table includes SF data, which will be discussed in greater detail later.
Table 4.
Mean ADN values of labeled cells (MDLC) and of unlabeled cells (MDUC) and percent of dead cells calculated for different amounts of activity of 177Lu- and 161Tb-DOTATOC within clusters of 100, 500 and 1000 µm considering 10, 40 or 70% of labeled cells
| Cluster Activity (Bq) | Labeled cells (%) | Activity/labeled cell (Bq/cell) | no disintegrations/cell (labeled cell) | MDLC (Gy) | MDUC (Gy) | SF (%) | ||||
|---|---|---|---|---|---|---|---|---|---|---|
| 177Lu-RP | 161 Tb-RP | 177Lu-RP | 161 Tb-RP | 177Lu-RP | 161 Tb-RP | 177Lu-RP | 161 Tb-RP | |||
| Cluster Size 100 μm radius (1021 cells) | ||||||||||
| 1.15 | 10 | 1.13E−02 | 9416 | 9701 | 2.89 | 8.06 | 1.04 | 1.63 | 74.913 | 61.305 |
| 40 | 2.82E−03 | 2354 | 2425 | 1.49 | 3.29 | 1.02 | 1.64 | 76.204 | 55.429 | |
| 70 | 1.61E−03 | 1343 | 1384 | 1.29 | 2.56 | 1.03 | 1.63 | 77.669 | 60.416 | |
| 5.98 | 10 | 5.86E−02 | 48,966 | 50,443 | 15.00 | 43.50 | 5.42 | 8.81 | 21.880 | 8.812 |
| 40 | 1.47E−02 | 12,241 | 12,611 | 7.76 | 17.80 | 5.33 | 8.87 | 19.304 | 5.093 | |
| 70 | 8.37E−03 | 6985 | 7196 | 6.71 | 13.80 | 5.37 | 8.80 | 18.968 | 3.812 | |
| 11.99 | 10 | 1.18E−01 | 98,177 | 101,139 | 30.00 | 87.00 | 10.80 | 17.60 | 3.132 | 1.179 |
| 40 | 2.94E−02 | 24,544 | 25,285 | 15.50 | 35.50 | 10.70 | 17.70 | 2.253 | 0.294 | |
| 70 | 1.68E−02 | 14,006 | 14,428 | 13.40 | 27.60 | 10.70 | 17.60 | 1.958 | 0.195 | |
| 23.11 | 10 | 2.26E−01 | 189,230 | 194,940 | 57.70 | 161.00 | 20.90 | 32.60 | 0.196 | 0.098 |
| 40 | 5.66E−02 | 47,308 | 48,735 | 29.90 | 65.80 | 20.50 | 32.80 | 0.000 | 0.000 | |
| 70 | 3.23E−02 | 26,995 | 27,810 | 25.80 | 51.10 | 20.70 | 32.60 | 0.000 | 0.000 | |
| Cluster Size 500 μm radius (127,675 cells) | ||||||||||
| 144 | 10 | 1.13E−02 | 9416 | 9691 | 4.96 | 10.50 | 3.13 | 3.89 | 42.640 | 32.220 |
| 40 | 2.82E−03 | 2354 | 2423 | 3.60 | 5.54 | 3.13 | 3.89 | 42.180 | 30.260 | |
| 70 | 1.61E−03 | 1343 | 1384 | 3.40 | 4.83 | 3.13 | 3.89 | 42.310 | 29.740 | |
| 748 | 10 | 5.86E−02 | 48,966 | 50,396 | 25.80 | 56.50 | 16.30 | 21.00 | 0.429 | 0.136 |
| 40 | 1.46E−02 | 12,241 | 12,598 | 18.70 | 29.90 | 16.30 | 21.00 | 0.326 | 0.038 | |
| 70 | 8.37E−03 | 6985 | 7199 | 17.70 | 29.00 | 16.30 | 23.30 | 0.295 | 0.010 | |
| 1499 | 10 | 1.17E−01 | 98,177 | 101,044 | 51.60 | 113.00 | 32.60 | 42.10 | 0.000 | 0.001 |
| 40 | 2.94E−02 | 24,544 | 25,260 | 37.40 | 59.80 | 32.60 | 42.00 | 0.000 | 0.000 | |
| 70 | 1.68E−02 | 14,006 | 14,434 | 35.30 | 52.20 | 32.60 | 42.00 | 0.000 | 0.000 | |
| 2890 | 10 | 2.26E−01 | 189,230 | 194,756 | 99.30 | 209.00 | 62.60 | 77.90 | 0.000 | 0.000 |
| 40 | 5.66E−02 | 47,308 | 48,687 | 72.00 | 111.00 | 62.70 | 77.80 | 0.000 | 0.000 | |
| 70 | 3.23E−02 | 26,995 | 27,821 | 67.90 | 96.60 | 62.70 | 77.80 | 0.000 | 0.000 | |
| Cluster Size 1000 μm radius (1,023,349 cells) | ||||||||||
| 1153 | 10 | 1.13E−02 | 9416 | 9691 | 5.97 | 11.60 | 4.13 | 5.03 | 31.380 | 22.464 |
| 40 | 2.82E−03 | 2354 | 2423 | 4.59 | 6.68 | 4.13 | 5.03 | 31.080 | 20.900 | |
| 70 | 1.61E−03 | 1343 | 1384 | 4.39 | 5.97 | 4.13 | 5.03 | 31.070 | 20.640 | |
| 5994 | 10 | 5.86E−02 | 48,966 | 50,394 | 31.00 | 62.70 | 21.50 | 27.10 | 0.060 | 0.011 |
| 40 | 1.46E−02 | 12,241 | 12,598 | 23.80 | 36.00 | 21.50 | 27.20 | 0.044 | 0.003 | |
| 70 | 8.37E−03 | 6985 | 7199 | 22.80 | 32.20 | 21.50 | 27.20 | 0.041 | 0.002 | |
| 12,018 | 10 | 1.17E−01 | 98,177 | 101,040 | 62.10 | 125.00 | 42.90 | 54.30 | 0.000 | 0.000 |
| 40 | 2.94E−02 | 24,544 | 25,260 | 47.70 | 72.10 | 42.90 | 54.30 | 0.000 | 0.000 | |
| 70 | 1.68E−02 | 14,006 | 14,434 | 45.70 | 64.50 | 42.90 | 54.30 | 0.000 | 0.000 | |
| 23,163 | 10 | 2.26E−01 | 189,230 | 194,749 | 119.00 | 232.00 | 82.60 | 101.00 | 0.000 | 0.000 |
| 40 | 5.66E−02 | 47,308 | 48,687 | 91.70 | 134.00 | 82.50 | 101.00 | 0.000 | 0.000 | |
| 70 | 3.23E−02 | 26,995 | 27,821 | 87.80 | 119.00 | 82.50 | 101.00 | 0.000 | 0.000 | |
The data presented in Table 4 demonstrate that, for a given activity per labeled cell, the mean ADN delivered by 177Lu-DOTATOC and 161Tb-DOTATOC in both labeled and unlabeled cells increases as the cluster size becomes larger, due to the enhanced effect of cross-irradiation.
Besides, for a fixed amount of activity in the cluster, the MDUC and cross-MDLC values are essentially independent of the labeling percentage. Conversely, as the self-contribution to the MDLC is proportional to the activity per labeled cell, a lower labeling percentage results in a higher number of disintegrations per labeled cell, so the MDLC increases. If cluster size and percentage of labeling remained fixed, both MDLC and MDUC values would increase linearly with the total amount of activity in the cluster, as expected.
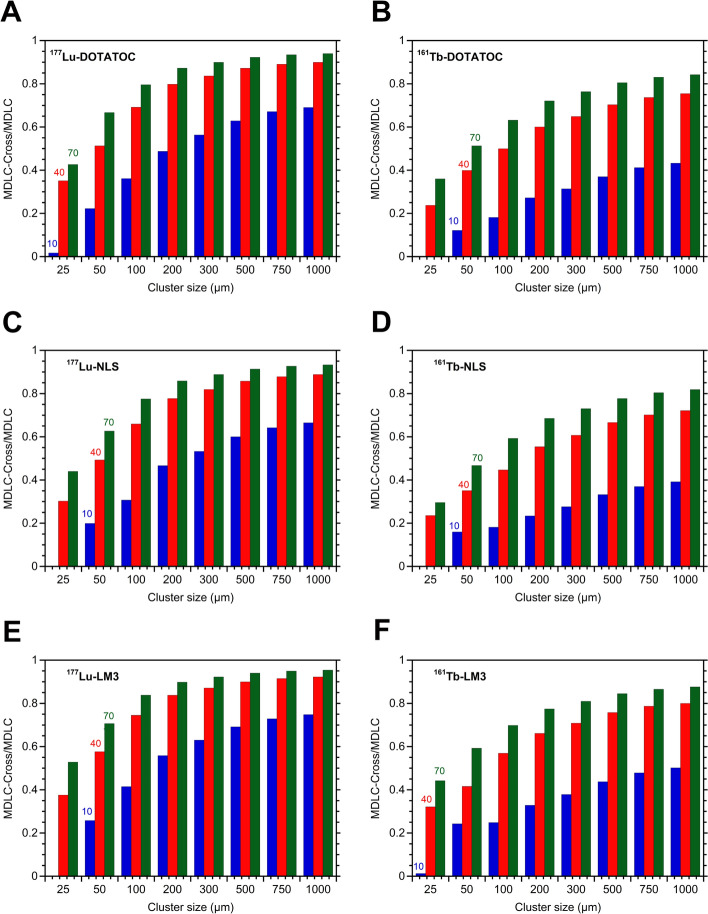
Table 4 also demonstrated that for small clusters (e.g. 100 µm) with a low value of labeled cells (e.g. 10%), the 161Tb-RP/177Lu-RP MDLC ratio was approximately 3 (Fig. 3), due to the greater self-irradiation contribution of 161Tb. This finding is consistent with the 1D cell pair simulation (Table 3) and with the data previously reported by other authors [14]. However, as the cluster size and percentage of labeled cells increase, the 161 Tb-RP/177Lu-RP MDLC ratio decreases significantly, reaching a value of 1.36 in larger clusters, with no significant difference between sizes of 500 and 1000 µm in radius (Fig. 3). The results can be attributed to the elevated cross-irradiation produced by 177Lu-DOTATOC in comparison to 161Tb-DOTATOC. To demonstrate this fact also for other RPS, the relative contribution of cross-irradiation to the MDLC of 177Lu-RPs and 161Tb-RPs were compared using different percentages of labeling (10%, 40%, and 70%) with a fixed mean number of 18,900 disintegrations per cell (Fig. 4). This fixed number was obtained by multiplying the maximum values of cluster activity of each cluster size (Table 4), by the time-integrated activity coefficient for 177Lu (836,394 s), divided by the total number of cells in the cluster. For comparative purposes, the same value was employed for 161Tb. Figure 4 clearly demonstrates that the relative contribution of cross-irradiation to the MDLC of 177Lu-RPs is consistently much higher than that of 161Tb-RPs for all cluster sizes. This result can be explained by taking into account the energetic characteristics of the emissions of these radionuclides (Table 1), which, for the same amount of energy released, give rise to a dose deposition profile around point sources that is higher for 161Tb compared to 177Lu, particularly in the first 10 μm, up to a distance of 30 μm, then becoming similar or even higher for 177Lu [23].
Fig. 3.
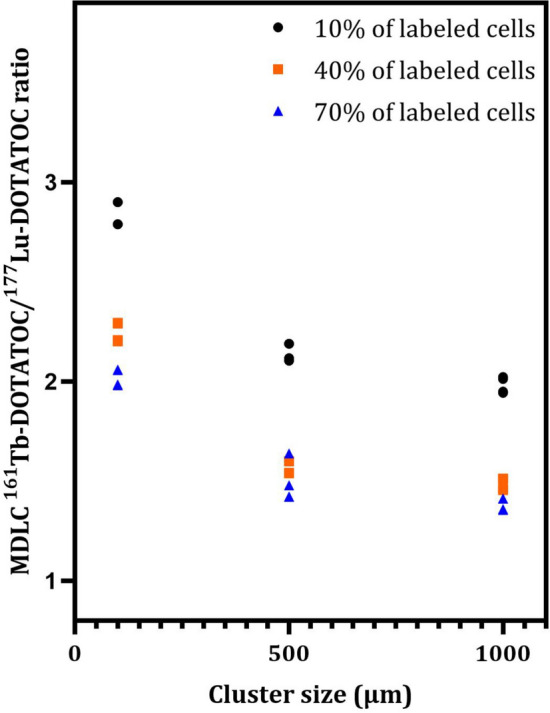
161 Tb-DOTATOC/177Lu-DOTATOC ratios of the mean doses to nuclei of labeled cells (MDLC) calculated for the three different cluster sizes (radius of 100, 500, and 1000 µm) and 10, 40, or 70% of labeled cells. For each cluster size and percentage of labeling, four points are reported in the plot, corresponding to the activity levels presented in Table 5. A two-way ANOVA analysis with a significance level of 0.05 (three columns and twelve rows, with a total of 36 observations) revealed significant differences in the MDLC 161Tb-DOTATOC/177Lu-DOTATOC ratios among cluster sizes (54.67% of total variation; P < 0.0001) and percentages of labeled cells (54.67% of total variation; P < 0.001). Tests of Tukey's multiple comparisons showed significant differences between the following combinations of labeled cells: 10% vs. 40% (P < 0.001), 10% vs. 70% (P < 0.0001), and 70% vs. 40% (P < 0.0001). Significant differences were also observed when comparing 100 µm vs. clusters of 500 µm (P < 0.0001) and clusters of 100 µm vs. clusters of 1000 µm (P < 0.0001). However, a comparison of clusters of 500 µm vs. clusters of 1000 µm revealed no significant difference (P = 0.9977)
Fig. 4.
The relative contribution of cross-irradiation to the MDLC for different percentages of labeled cells (10%, 40s%, and 70%) using a mean number of disintegrations per cell of 18,900 for both 177Lu-RPs and 161Tb-RPs versus the radius of the spherical cell cluster
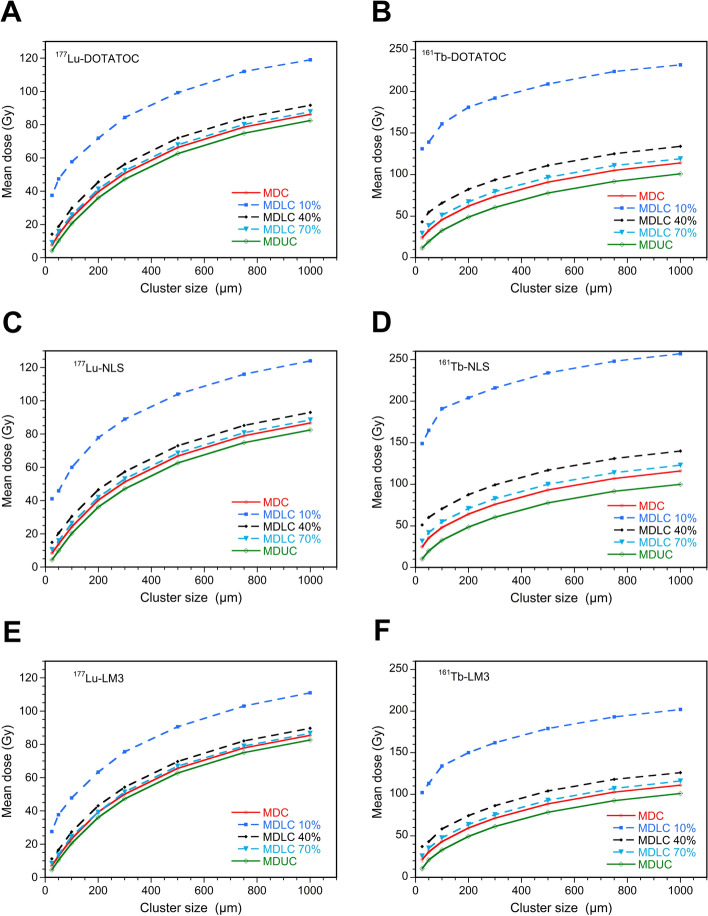
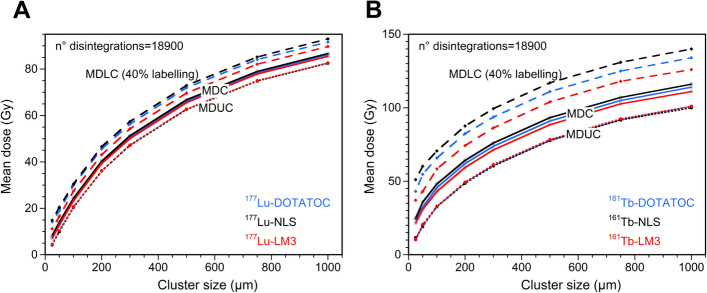
Figure 5 showed a graphical representation of the MDUC and MDLC obtained for all 177Lu-RPs and 161Tb-RPs calculated for the eight cluster sizes using a mean number of disintegrations per cell of 18,900 and the three percentages of labeled cells. This figure corroborates the findings presented in Table 4 and Fig. 3 for both 177Lu- and 161Tb-DOTATOC, with the inclusion of the other two RPs labeled with both radionuclides. The mean dose to all cells (MDC) value has been also included in the figure for comparison purposes; it represents the mean ADN value of both labeled and unlabeled cells and it is independent of percentage of labeling. It therefore coincides with the MDLC for 100% labeling.
Fig. 5.
Mean dose (ADN) to all cells (MDC), unlabeled cells (MDUC), and labeled cells (MDLC) calculated using a mean number of disintegrations per cell of 18,900 and 10%, 40%, or 70% of cells labeled with 177Lu-RPs or 161 Tb-RPs versus the radius of the cell cluster
In the case of 177Lu-RPs, when moving from a 25 µm to a 1000 µm spherical cluster, the MDUC, and MDLC with 10%, 40%, or 70% of labeled cells demonstrated a relative increment from 202 to 1864%. The reduced role of cross-irradiation for 161Tb-RPs is evidenced by lower relative dose increments, ranging from 72 to 871% (Table S2).
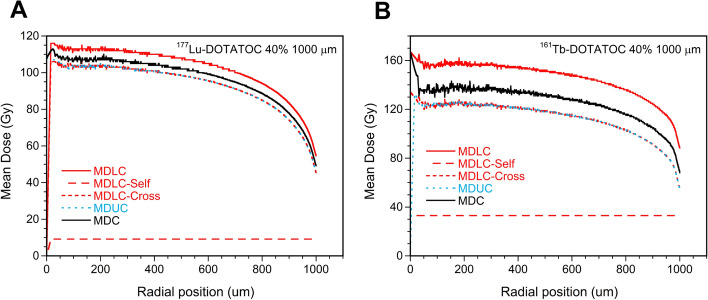
The mean values plotted in Figs. 4 and 5 are calculated over the entire population of cells within the cluster. However, it is crucial to highlight the existence of significant discrepancies in ADN between cells situated in the core of the cluster and those positioned at its border, due to the diminished effect of cross-irradiation in the periphery of the cluster. This phenomenon has also been documented in uniformly radioactively loaded spheres by Champion et al. [15]. Figure 6 illustrates the radial dependence of MDC, MDUC, and MDLC for 177Lu- and 161Tb-DOTATOC, with a cluster size of 1000 µm and 40% of the cells labeled. The lines representing MDUC and the cross-irradiation contribution to MDLC overlap, because MDUC depends only on cross-irradiation. The results obtained for the other 177Lu- and 161Tb-RPs were highly comparable, exhibiting a consistent decrease in cell ADN with increasing radial distance.
Fig. 6.
Mean dose to all cells (MDC), labeled cells (MDLC), and unlabeled cells (MDUC) versus the radial position within the cluster with a radius of 1000 µm and 40% of cells labeled with A) 177Lu-DOTATOC and B) 161Tb-DOTATOC. The self- and cross-contributions to MDLC were plotted separately
However, the ADN values after the 161Tb-RPs treatment appeared to be less influenced by the radial position and exhibited the most significant differences between labeled and unlabeled cells compared to the ADN after the 177Lu-RPs treatment. This confirms the previous finding that the cross-irradiation contribution of 161Tb is lower than that of 177Lu (Fig. 4).
A comparative analysis of the ADN values resulting from different 177Lu-RPs revealed that MDUC values were similar (Fig. 7A). In contrast, larger differences in MDLC values were observed, especially when the number of labeled cells was low, due to the smaller effect of cross-irradiation (Table S3). The MDLC values reflect the differences in S-values of the self-irradiation of the RPs (Table 3), but attenuated by the effect of cross-irradiation. A comparable pattern can be observed in the case of 161Tb-RPs (Fig. 7B). However, the MDLC values in this case showed slightly larger differences. The MDLC values of 161Tb-DOTATOC and 161Tb-NLS are respectively between 1.28 and 1.03 times and 1.46 and 1.06 times larger than those resulting from 161Tb-LM3, with the highest differences observed at the smallest cluster sizes (Table S3). Figure S3 highlights that for a fixed number of disintegrations and cell cluster size, the MDUC, and MDLC values are significantly higher for 161Tb-RPs than for 177Lu-RPs, especially at low percentages of labeled cells, as discussed previously.
Fig. 7.
Mean dose to all cells (MDC), to 40% labeled cells (MDLC), and to unlabeled cells (MDUC) versus the radius of cell cluster, considering a mean number of disintegrations per cell of 18,900, for all A 177Lu-RPs and B 161Tb-RPs
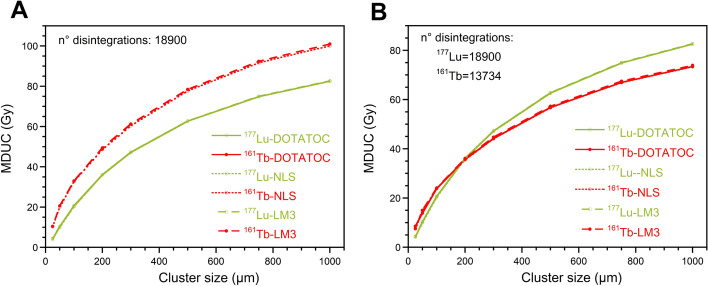
It is important to note that the mean energy emitted in the form of electrons from 161Tb and 177Lu differs considerably. Therefore, the dosimetric properties of 177Lu- and 161Tb-RPs were also compared by scaling the number of disintegrations of 161Tb by a factor of 1.37. Figure 8 represents the relationship between the MDUC and the cluster size, using both the same mean disintegration number of 18,900 for 177Lu- and 161Tb-labeled RPs and also scaling the mean disintegration number for 161Tb-RPs (13,734). This second approach results in a greater similarity in the dosimetric properties of the two radionuclides. The data indicate that for very small clusters, 161Tb delivers a higher ADN to unlabeled cells than 177Lu. However, as the cluster size increases, the MDUC values of the 177Lu-RPs are higher than those of the 161Tb-RPs. In contrast, the MDLC values resulting from 161Tb-RPs treatment remain higher than those from 177Lu-RPs (or comparable to them for large clusters and 70% of labeled cells) (Figure S4).
Fig. 8.
MDUC versus the size of the cluster radius considering A) the same mean number of disintegrations per cell for all RPs and B) a mean number of disintegrations per cell of 18,900 and 13,734 for 177Lu-RPs and 161Tb-RPs, respectively
The relative trend of MDC values of 161Tb- and 177Lu-RPs versus the cluster size is similar to that of MDUC values, with 161Tb-RPs being more effective than 177Lu-RPs at small-medium cluster sizes (Figure S4).
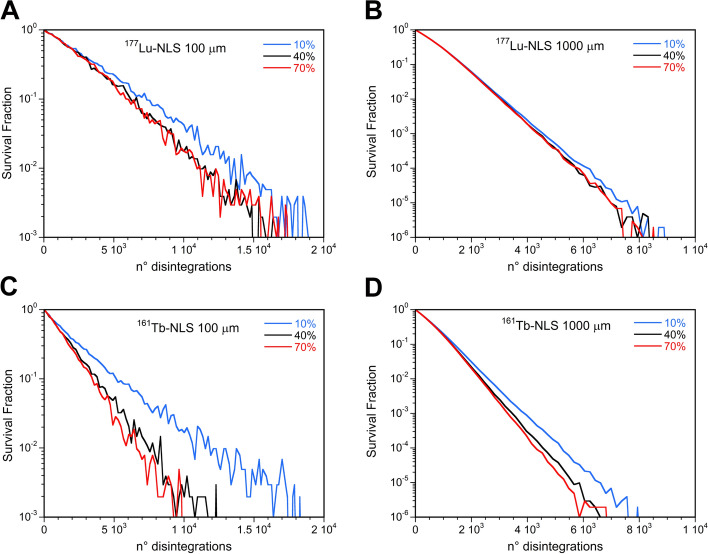
The SF curves for 177Lu-RPs at a given cluster size exhibited only a slight dependence on the percentage of labeled cells, despite the observed dependence of the MDLC on the same parameter. Clusters of 100 and 1000 µm treated with 177Lu-NLS using 40% and 70% labeled cells demonstrated no discernible differences in SF versus the mean number of disintegrations per cell (Fig. 9A and B). In contrast, higher values of SF were observed in small clusters when just 10% of the cells were labeled. This gap is less pronounced as the cluster size increases. Similar results were observed for 177Lu-DOTATOC and 177Lu-LM3.
Fig. 9.
Survival fraction versus the mean number of disintegrations per cell after administration of 177Lu-NLS or 161Tb-NLS considering 10, 40, or 70% of cells labeled and a cluster size of 100 µm (A and C) and 1000 µm (B and D)
Higher values of SF were found when considering the 10% of cells labeled with 161Tb-RPs particularly for the larger clusters. In this instance, a notable discrepancy was observed between the 40% and 70% labeled cell. This discrepancy can be attributed to the fact that the MDLC values of 161Tb-RPs are more susceptible to influence by the percentage of labeled cells than those of 177Lu-RPs (Fig. 9C and D).
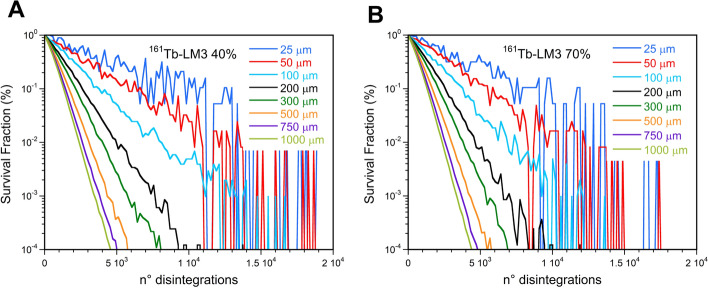
The SF curves are markedly influenced by the cluster size, as illustrated in Fig. 10 for 161Tb-LM3, as a consequence of the ADN dependence on this parameter. Additionally, it can be observed that the scatter between the SF curves is greater when the percentage of labeled cells is lower. Similar outcomes were obtained for the other 177Lu- and 161Tb-RPs.
Fig. 10.
Survival fraction versus the mean number of disintegrations per cell after administration of 161Tb-LM3 in cell clusters with sizes ranging between 100 µm and 1000 µm considering (A) 40% and (B) 70% of labeled cells
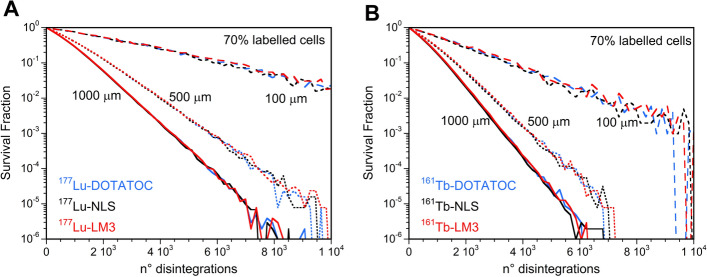
Given the dependence of the SF on the cluster size, it is necessary to perform an analysis of survival studies with fixed values of this parameter to make a correct comparison between the RPs. Figure 11A demonstrated that there was no discernible difference between the SF curves of 177Lu-RPs using the same percentage of labeled cells and cluster size. Similar outcomes were observed for the SF curves of 161Tb-RPs under the same conditions (Fig. 11B).
Fig. 11.
Survival fraction versus the mean number of disintegrations per cell for 100, 500, and 1000 µm cluster sizes considering the 70% of the cells labeled with A) 177Lu-RPs or B) 161Tb-RPs
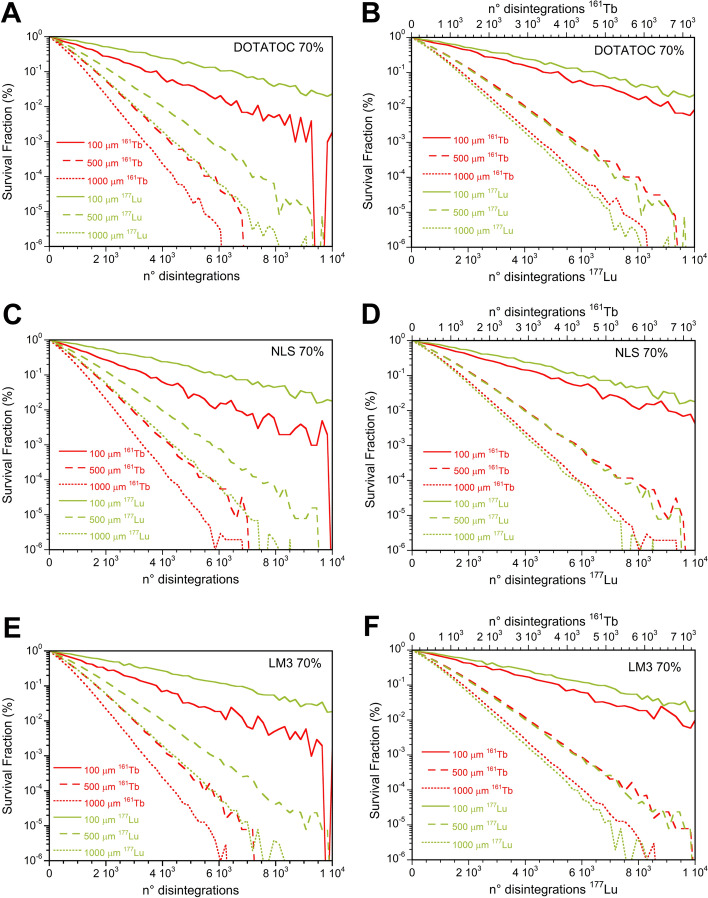
The cell SFs after 161Tb-RPs treatment were significantly lower than those of 177Lu-RPs for all cluster sizes when the same disintegration number was employed for both radionuclides, as evidenced in Figs. 12A, C and E. However, when the number of disintegrations of 161Tb is scaled by a factor of 1.37 to account for the differing energy emitted by 161Tb and 177Lu, it can be observed that 161Tb-RPs are more effective only for small cluster sizes (see Figs. 12B, D and F).
Fig. 12.
Comparison of survival fractions versus the mean number of disintegrations per cell following 177Lu- or 161Tb-LM3 treatment of 100, 500, and 1000 µm cell clusters considering 70% of cells labeled A using the same mean number of disintegrations per cell for the two radionuclides, while in B scaling the mean number of disintegrations of 161Tb by a factor 1.37
Discussion
The localization of the radiopharmaceutical in TRT is of greater importance than the dose rate, particularly given that alpha particles, beta particles, or Auger electrons localized in proximity to DNA can cause double-strand breaks (DSBs), leading to cell death or apoptosis, even at low radiation doses and dose rates. Consequently, discrepancies may be observed between the radiobiological outcomes attained through external gamma beam irradiation and TRT [24]. It would have been ideal to obtain biological parameters specific to target radionuclide therapy. However, the experimental values of the α and β survival coefficients determined using external beam photon irradiation were sufficient to preliminarily compare the survival profile of three 161Tb- and three 177Lu-SST analogues in cancer cell clusters. It was also assumed that the α and β parameters were identical for the different emissions of the two radionuclides, although it is known that differences in radiotoxicity can be attributed to the dose released by AE and higher-energy electrons, which may increase the differences between the SF of the three RPs. It is also important to consider that although nuclear DNA is widely considered the primary target of ionizing radiation, other sensitive sites, such as the cell membrane and mitochondria, could also be critical targets in TRT [25].
A dosimetric comparison between 177Lu and 161Tb was previously conducted by Champion et al. assuming a homogeneous distribution of the radionuclides in water-density spheres [26]. The results demonstrated that, for the same amount of energy released, the absorbed doses due to 161Tb are higher than those of 177Lu at the smallest sphere sizes, becoming very similar at the millimetric scale. These findings are consistent with the results obtained in the present study using cell clusters. At the cellular level, calculations of Alcocer-Avila et al. were limited to a single cell or a small cluster of 19 cells, supposing a uniform distribution of the radionuclides in one cell compartment (cell surface, cytoplasm or nucleus) or within the whole cell [14, 16]. The present study considered the experimentally determined cellular distributions of three different RPs. Additionally, clusters of cancer cells with radii ranging from 25 to 1000 µm (from 0.05 to 2 mm in diameter) were simulated, assuming different percentages of labeled cells.
This study showed no noticeable differences in the SF of different RPs labeled with the same radionuclide. This result can be attributed to two main facts, the assumption that the nucleus is the only radiosensitive target of the cell, and basing therefore the estimation of the ADN value, and that the RPs considered do not differ significantly in their fraction of nuclear uptake, which determines only small differences to the S-values of the three RPs. Moreover, when considering the same number of disintegrations for both radionuclides, 161Tb consistently delivered higher ADN and produced higher biological damage than 177Lu, regardless of the cellular distribution of the radionuclides. However, when the comparison between the two radionuclides is performed for the same amount of energy emitted in the form of electrons, the 161Tb-RPs demonstrated a higher reduction in cell survival only in small clusters, becoming comparable or even less effective than the 177Lu-RPs for larger clusters (Fig. 12).
A substantial amount of experimental data regarding in vitro cell survival studies with RPs, particularly those of Borgna et al., has been collected in 2D cell cultures. However, despite their simplicity, rapidity, and reliability, 2D models are inadequate for accurately reproducing the behavior of tumors in vivo. Consequently, a variety of 3D models have been employed to assess the cell-killing efficacy of RPs [27, 28]. In this work, a simulation of a 3D geometry was chosen because it more accurately represents a real micrometastasis. Nevertheless, to compare 2D and 3D models, dosimetric and cell survival calculations were also performed on cell colonies disposed in a circle with a radius ranging from 25 to 1000 µm (Table S1). The results demonstrated that the ADs obtained for all RPs with 2D geometry were consistently lower than those obtained for the 3D models for a given mean number of disintegrations per cell and cell colony or cluster radius. This finding is consistent with the results of a Monte Carlo-based assessment of AD at the macroscopic level in a cell monolayer and 3D spheroids, which explained the lower viability of cells in 3D cultures compared to that in 2D ones [29]. The results presented in Table S3 demonstrate that, for all the considered RPs, the 3D/2D ratios of the ADN are the largest for MDUC, followed by MDLC using 70%, 40%, and 10% labeled cells. For each quantity, the ratios become more significant with increasing the geometric size. This trend can be attributed to the reduced influence of cross-irradiation in the 2D scenario, particularly in the context of large colonies. These results are also supported by the observation that the increase of MDUC and MDLC values with the cell colony dimensions is considerably lower than in the 3D clusters (see Figure S5). The differences between the 2D and the 3D scenarios were more pronounced for 177Lu-RPs than for 161Tb-RPs, indicating that the impact of 161Tb cross-irradiation is minimal.
A comparison of the MDLC after treatment with the three considered 177Lu-RPs reveals larger differences in the 2D than in the 3D case (Table S3). A similar behavior was observed with 161Tb-RPs. Moreover, also in the 2D case, the differences in the MDLC values resulting from the three 161Tb-RPs were more evident than those observed for the 177Lu-RPs values (Table S3). The dependence of SF on cluster size is considerably lower in the 2D case due to the smaller influence of colony size on the ADN. Besides, the smaller cell ADN in 2D models resulted in a notably higher SF compared to the 3D clusters (Figure S6). Furthermore, due to the reduced influence of cross-irradiation on 2D models, the impact of the percentage of labeled cells is more evident, especially for 161Tb-RPs (Figure S7).
The SF curves obtained for a given cluster size and percentage of labeled cells do not significantly differ when comparing different RPs using the 2D model, for both 177Lu and 161Tb labeling (Figure S8). 161Tb-RPs were found to be more effective than 177Lu-RPs also in the 2D models. This trend is attenuated but maintained, even when the number of disintegrations of 161Tb is scaled by a factor of 1.37, to consider the larger amount of energy released per nuclear transformation in the form of electron emissions (Figure S9). Consequently, cell survival experiments conducted in 2D can demonstrate a higher efficiency of 161Tb-RPs compared to 177Lu-RPs, but this advantage may be lost in a 3D geometry for medium to large cluster sizes.
The higher efficacy of 161Tb-RPs compared to 177Lu-RPs was experimentally confirmed by Borgna et al., through the performance of 2D in vitro assays, which demonstrated that 161Tb-DOTATOC and 161Tb-NLS were four times more effective in inhibiting tumor viability than their 177Lu-labeled counterparts [13]. Besides, they reported that 161Tb-LM3 was 102-fold more potent than 177Lu-LM3. The last result may be partially attributed to the fact that the membrane is a susceptible target for the dense ionization produced by AE [30]. However, the differences between the two LM3 RPs in vivo in the mouse model were considerably less than expected, as evidenced by tumor volume, tumor growth delay, and the percent survival of animals at 49 days after treatment with both RPs. These data indicated that 161Tb-LM3 was only approximately two to three times more potent than 177Lu -LM3 [13].
Conclusions
The biological outcomes of 177Lu- and 161Tb-RPs on cell clusters are influenced by several factors, including the dimensions of the cell cluster, the fraction of labeled cells within the cluster, and the localization of the radioactivity into different cell compartments. However, evaluations conducted with a fixed cluster size (0.025–1 mm of radius) and percentage of labeled cells indicated that the localization of the RPs within different cell compartments had a minimal impact on the ADN values and cell survival for the three SST analogs considered in this work, when labeled with the same radionuclide. This result may be attributed to two factors: firstly, the assumption that the nucleus was considered the sole radiosensitive target of the cells; and secondly, the fact that the three RPs are characterized by small differences in the amount of nuclear localization. The assessment demonstrated that 161Tb-RPs are not more effective than 177Lu-RPs for tumors with a radius of 0.5 to 1 mm when comparison was carried out using the same amount of emitted energy in the form of electrons. Nevertheless, the same effect on cell survival produced by 177Lu-RPs could be achieved by smaller activities of 161Tb-RPs due to the higher energy emitted by 161Tb per disintegration. Consequently, 161Tb-RPs represent a suitable alternative for TRT.
Supplementary Information
Acknowledgements
This study was conducted as part of the activities of the International Atomic Energy Agency, CRP-F22078 (Research Agreement No. 28140).
Abbreviations
- Ã
Time-integrated activity coefficient
- AD
Absorbed dose
- ADN
Absorbed dose to the cell nucleus
- AE
Auger electrons
- BSA
Bovine serum albumin
- CI
Cell index
- Cy
Cytoplasm
- CS
Cell surface
- DOTA
1,4,7,10-Tetraazacyclododecane-1,4,7,10-tetraacetic acid
- EBRT
External beam radiotherapy
- IE
Internal Conversion Electrons
- N
Cell nucleus
- OD
Optical density
- PBS
Phosphate-buffered saline
- PE
Plating efficiency
- PFA
Paraformaldehyde
- RP
Radiopharmaceutical
- RT
Room temperature
- RTCA
Real-time cell analysis
- SF
Survival Fraction
- SPECT
Single photon emission computed tomography
- SST
Somatostatin
- TRT
Targeted radionuclide therapy
- 1D
One-dimensional
- 2D
Two-dimensional
- 3D
Three-dimensional
Author contributions
LDN, LMA and AR contributed to the study conception and design of the study. ADP, SS, EAV performed cell culture. EAV and GFF measured cell dimensions and performed the proliferation assays. VB, AZ and EAV performed cell irradiation. ADP, SS determined survival from impedance-based real-time cell analysis. GFF and EN generated survival curves. LDN and LMA performed dosimetric studies. The manuscript was written, read and approved by all authors.
Funding
The authors are grateful to the 5 × 1000 (2019) for the financial support of the project “DECURTA” to LMA. This research was funded by the Italian Ministry of Health “Ricerca Corrente”.
Availability of data and materials
The datasets used and/or analyzed during the current study are available from the corresponding author on reasonable request.
Declarations
Ethics approval and consent to participate
Not applicable.
Consent for publication
Not applicable.
Competing interests
The authors declare that they have no competing interests.
Footnotes
Publisher's Note
Springer Nature remains neutral with regard to jurisdictional claims in published maps and institutional affiliations.
References
- 1.Gudkov SV, Shilyagina NY, Vodeneev VA, Zvyagin AV. Targeted radionuclide therapy of human tumors. Int J Mol Sci. 2016;17(1):19. [DOI] [PMC free article] [PubMed] [Google Scholar]
- 2.Malcolm J, Falzone N, Lee BQ, Vallis KA. Targeted radionuclide therapy: new advances for improvement of patient management and response. Cancers. 2019;11(2):12. [DOI] [PMC free article] [PubMed] [Google Scholar]
- 3.Stokke C, Kvassheim M, Blakkisrud J. Radionuclides for targeted therapy: physical properties. Molecules. 2022;27(17):20. [DOI] [PMC free article] [PubMed] [Google Scholar]
- 4.Vogel WV, van der Marck SC, Versleijen MWJ. Challenges and future options for the production of lutetium-177. Eur J Nucl Med Mol Imaging. 2021;48(8):2329–35. [DOI] [PMC free article] [PubMed] [Google Scholar]
- 5.Chakravarty R, Chakraborty S. A review of advances in the last decade on targeted cancer therapy using Lu-177: focusing on Lu-177 produced by the direct neutron activation route. Am J Nucl Med Molec Imaging. 2021;11(6):443–75. [PMC free article] [PubMed] [Google Scholar]
- 6.Barca C, Griessinger CM, Faust A, Depke D, Essler M, Windhorst AD, Devoogdt N, Brindle KM, Schäfers M, Zinnhardt B, Jacobs AH. Expanding theranostic radiopharmaceuticals for tumor diagnosis and therapy. Pharmaceuticals. 2022;15(1):13. [DOI] [PMC free article] [PubMed] [Google Scholar]
- 7.Qaim SM, Scholten B, Neumaier B. New developments in the production of theranostic pairs of radionuclides. J Radioanal Nucl Chem. 2018;318(3):1493–509. [Google Scholar]
- 8.Barbaro F, Canton L, Uzunov N, De Nardo L, Melendez-Alafort L. 155Tb production by cyclotrons: what level of 155Gd enrichment allows clinical applications? EJNMMI Phys. 2024;11(1):6. [DOI] [PMC free article] [PubMed] [Google Scholar]
- 9.Lehenberger S, Barkhausen C, Cohrs S, Fischer E, Grunberg J, Hohn A, Koster U, Schibli R, Turler A, Zhernosekov K. The low-energy beta(-) and electron emitter Tb-161 as an alternative to Lu-177 for targeted radionuclide therapy. Nucl Med Biol. 2011;38(6):917–24. [DOI] [PubMed] [Google Scholar]
- 10.Van Laere C, Koole M, Deroose CM, van de Voorde M, Baete K, Cocolios TE, Duchemin C, Ooms M, Cleeren F. Terbium radionuclides for theranostic applications in nuclear medicine: from atom to bedside. Theranostics. 2024;14(4):1720–43. [DOI] [PMC free article] [PubMed] [Google Scholar]
- 11.Muller C, Reber J, Haller S, Dorrer H, Bernhardt P, Zhernosekov K, Turler A, Schibli R. Direct in vitro and in vivo comparison of Tb-161 and Lu-177 using a tumour-targeting folate conjugate. Eur J Nucl Med Mol Imaging. 2014;41(3):476–85. [DOI] [PubMed] [Google Scholar]
- 12.Muller C, Umbricht CA, Gracheva N, Tschan VJ, Pellegrini G, Bernhardt P, Zeevaart JR, Koster U, Schibli R, van der Meulen NP. Terbium-161 for PSMA-targeted radionuclide therapy of prostate cancer. Eur J Nucl Med Mol Imaging. 2019;46(9):1919–30. [DOI] [PMC free article] [PubMed] [Google Scholar]
- 13.Borgna F, Haller S, Rodriguez JMM, Ginj M, Grundler PV, Zeevaart JR, Koster U, Schibli R, van der Meulen NP, Muller C. Combination of terbium-161 with somatostatin receptor antagonists-a potential paradigm shift for the treatment of neuroendocrine neoplasms. Eur J Nucl Med Mol Imaging. 2022;49(4):1113–26. [DOI] [PMC free article] [PubMed] [Google Scholar]
- 14.Alcocer-Avila ME, Ferreira A, Quinto MA, Morgat C, Hindie E, Champion C. Radiation doses from Tb-161 and Lu-177 in single tumour cells and micrometastases. EJNMMI Phys. 2020;7(1):9. [DOI] [PMC free article] [PubMed] [Google Scholar]
- 15.Champion C, Zanotti-Fregonara P, Hindié E. CELLDOSE: A Monte Carlo code to assess electron dose distribution - S values for 131I in spheres of various sizes. J Nucl Med. 2008;49(1):151–7. [DOI] [PubMed] [Google Scholar]
- 16.Larouze A, Alcocer-Avila M, Morgat C, Champion C, Hindié E. Membrane and nuclear absorbed doses from 177Lu and 161Tb in tumor clusters: effect of cellular heterogeneity and potential benefit of dual targeting—a monte carlo study. J Nucl Med. 2023;64(10):1619–24. [DOI] [PubMed] [Google Scholar]
- 17.Howell RW, Rao DV, Hou DY, Narra VR, Sastry KSR. The question of relative biological effectiveness and quality factor for Auger emitters incorporated into proliferating mammalian-cells. Radiat Res. 1991;128(3):282–92. [PubMed] [Google Scholar]
- 18.Katugampola S, Wang JC, Rosen A, Howell RW. MIRD pamphlet no 27: MIRDcell V3, a revised software tool for multicellular dosimetry and bioeffect modeling. J Nuclear Med. 2022;63(9):1441–9. [DOI] [PMC free article] [PubMed] [Google Scholar]
- 19.Vaziri B, Wu H, Dhawan AP, Du PC, Howell RW, Botch WE, Brill AB, Dewaraja YK, Dunphy MP, Fisher DR, Howell RW, Meredith RF, Sgouros G, Wessels BW, Zanzonico PB, Comm SM. MIRD pamphlet No 25: MIRDcell V20 software tool for dosimetric analysis of biologic response of multicellular populations. J Nuclear Med. 2014;55(9):1557–64. [DOI] [PubMed] [Google Scholar]
- 20.ICRP-2008, Nuclear decay data for dosimetric calculations. ICRP Publication 107. Ann. ICRP 2008; 32(3) [DOI] [PubMed]
- 21.Bolch WE, Eckerman KF, Sgouros G, Thomas SR, Brill AB, Fisher DR, Howell RW, Meredith R, Wessels BW. MIRD pamphlet No 21: a generalized schema for radiopharmaceutical dosimetry-standardization of nomenclature. J Nuclear Med. 2009;50(3):477–84. [DOI] [PubMed] [Google Scholar]
- 22.De Nardo L, Pupillo G, Mou L, Esposito J, Rosato A, Meléndez-Alafort L. A feasibility study of the therapeutic application of a mixture of Cu-67/64 radioisotopes produced by cyclotrons with proton irradiation. Med Phys. 2022;49(4):2709–24. [DOI] [PMC free article] [PubMed] [Google Scholar]
- 23.Hindie E, Zanotti-Fregonara P, Quinto MA, Morgat C, Champion C. Dose deposits from90Y,177Lu,111In, and161Tb in micrometastases of various sizes: Implications for radiopharmaceutical therapy. J Nucl Med. 2016;57(5):759–64. [DOI] [PubMed] [Google Scholar]
- 24.Cai Z, Kwon YL, Reilly RM. Monte Carlo N-Particle (MCNP) modeling of the cellular dosimetry of 64Cu: Comparison with MIRDcell S values and implications for studies of its cytotoxic effects. J Nucl Med. 2017;58(2):339–45. [DOI] [PubMed] [Google Scholar]
- 25.Bavelaar BM, Lee BQ, Gill MR, Falzone N, Vallis KA. Subcellular targeting of theranostic radionuclides. Front Pharmacol. 2018;9:3389. [DOI] [PMC free article] [PubMed] [Google Scholar]
- 26.Champion C, Quinto MA, Morgat C, Zanotti-Fregonara P, Hindié E. Comparison between three promising β-emitting radionuclides, 67Cu, 47Sc and 161Tb, with emphasis on doses delivered to minimal residual disease. Theranostics. 2016;6(10):1611–8. [DOI] [PMC free article] [PubMed] [Google Scholar]
- 27.Antonelli F. 3D cell models in radiobiology: improving the predictive value of in vitro research. Int J Mol Sci. 2023;24(13):10620. [DOI] [PMC free article] [PubMed] [Google Scholar]
- 28.Engrácia DM, Pinto CIG, Mendes F. Cancer 3D models for metallodrug preclinical testing. Int J Mol Sci. 2023;24(15):11915. [DOI] [PMC free article] [PubMed] [Google Scholar]
- 29.Raitanen J, Barta B, Fuchs H, Hacker M, Balber T, Georg D, Mitterhauser M. Radiobiological assessment of targeted radionuclide therapy with [177Lu]Lu-PSMA-I&T in 2D vs 3D cell culture models. Int J Mol Sci. 2023;24(23):17015. [DOI] [PMC free article] [PubMed] [Google Scholar]
- 30.Pouget JP, Santoro L, Raymond L, Chouin N, Bardiès M, Bascoul-Mollevi C, Huguet H, Azria D, Kotzki PO, Pèlegrin M, Vivès E, Pèlegrin A. Cell membrane is a more sensitive target than cytoplasm to dense ionization produced by auger electrons. Radiat Res. 2008;170(2):192–200. [DOI] [PubMed] [Google Scholar]
Associated Data
This section collects any data citations, data availability statements, or supplementary materials included in this article.
Supplementary Materials
Data Availability Statement
The datasets used and/or analyzed during the current study are available from the corresponding author on reasonable request.


