

Abstract
The genetic architecture of white matter lesions (WMLs) in Asian populations has not been well-characterized. Here, we performed a genome-wide association study (GWAS) to identify loci associated with the WML volume. Brain MRI and DNA samples were collected from 9479 participants in the Japan Prospective Studies Collaboration for Aging and Dementia (JPSC-AD). The GWAS confirmed three known WML-associated loci (SH3PXD2A, GFAP, and TRIM47). The lead variant of GFAP was a common missense variant (p.D295N) in East Asians. Meta-GWAS using the publicly available summary statistics of UK Biobank identified one previously unreported locus 6q23.2 (SLC2A12). Integration with expression quantitative trait locus data implied the newly identified locus affects SLC2A12 expression. The effect sizes of 20 lead variants at the WML-associated loci were moderately correlated between JPSC-AD and UK Biobank. These results indicate that the alteration in GFAP protein caused by the common missense variant in East Asians influences the WML volume.
Subject terms: Genome-wide association studies, White matter disease
Introduction
White matter lesions (WMLs), which can be seen on brain imaging modalities such as magnetic resonance imaging (MRI), are a small vessel disease1 and a risk factor for dementia2, cerebrovascular disease, and death3. WMLs are a complex trait, as twin studies have shown a high heritability of 0.76, suggesting a strong genetic influence4. There is thus a need for elucidation of the genetic components associated with WML. Recent large-scale genome-wide association studies (GWASs), comprising up to about 50,000 individuals, have identified up to 30 genetic regions associated with WMLs5–10. These studies also identified candidate causal genes, biological pathways (such as the D5 dopamine receptor binding pathways), and human traits sharing heritability with WML (longevity, blood pressure, stroke, behavior and anthropometric traits)8. However, most of these studies were conducted mainly in European populations. Because only a few studies have included Asian participants, and the numbers of such participants have been small (N = ~400)6,8, the genetic architecture of WML in Asian populations has not been well-characterized.
The Japan Prospective Studies Collaboration for Aging and Dementia (JPSC-AD) study, which includes approximately 10,000 older people in eight regions of Japan, is an ongoing prospective cohort study of dementia, with a baseline survey of cognitive function, brain MRI testing, and deoxyribonucleic acid extraction11. In the present study, we analyzed the MRI imaging and genomic data from the JPSC-AD study in order to elucidate the genetic architecture of the WML volume in a Japanese population through GWAS. We also performed a meta-GWAS using the publicly available GWAS summary statistics of UK Biobank. Finally, we compared the associated variants and signals of associations between the studies in order to assess population differences.
Results
Genome-wide association analyses
There were 9479 JPSC-AD participants, 4020 men and 5459 women. Supplementary Table 1 summarizes the characteristics of the participants of JPSC-AD and the UK Biobank. The mean age of the JPSC-AD participants was 72.9 years (range 59–101 yrs), which was higher than that of the UK Biobank. We note that 499 JPSC-AD participants reported a history of stroke. The genomic inflation factor of the GWAS in JPSC-AD was 1.052 (Supplementary Fig. 1), and the linkage disequilibrium (LD) score regression intercept (standard error [SE]) was 1.024 (0.007), indicating that bias due to population stratification and cryptic relatedness was negligible. The estimated per-SNP heritability h2 (SE) was 0.28 (0.06), which was appeared to be higher than that in the European population (h2 = 0.18, SE = 0.02)8. The GWAS of JPSC-AD participants identified three loci that satisfied the genome-wide significance level (P < 5.0 × 10⁻⁸): 10q24.33 [SH3PXD2A], 17q21.31 [GFAP] and 17q25.1 [TRIM47]); Table 1 and Fig. 1a. All of these significantly associated loci have been reported previously. To search for associated variants independent of the lead variants, conditional analyses adjusted for the lead variants for these three loci were performed within ±500 kb of the lead variants. Although no variant satisfied the Bonferroni significance level, a rare stop codon of GFAP (R414*; rs180974014) showed the strongest association at GFAP (P = 3.8 × 10⁻⁴, beta = 0.288, SE = 0.081). Next, we combined the results of JPSC-AD GWAS with the published GWAS summary statistics of UK Biobank. The meta-GWAS revealed 20 significant loci (Fig. 1b and Table 2). Of these 20 variants, nine showed nominal associations (P < 0.05) in the JPSC-AD group, and SLC2A12 has not been previously reported (P = 6.61 × 10⁻⁹, beta = 0.053, SE = 0.017; Fig. 2). To assess the impact of the MRI field strength on the effect sizes of the associated variants, we performed a sensitivity analysis by subdividing the participants into two groups based on their MRI scans (1.5 T and 3.0 T; Supplementary Table 2 and Supplementary Fig. 2). We found no significant difference in the effect sizes between the two groups (P for heterogeneity > 0.05).
Table 1.
Lead variants of the genome-wide significant loci for white matter hyperintensity lesion volume, the JPSC-AD Study
| Chr:Pos | Location | Lead variant | Ref/Alt | Nearest gene | Annotation | EAF | β (SE) | P | |
|---|---|---|---|---|---|---|---|---|---|
| JPSC-AD | EUR (1KGP) | ||||||||
| 10:105591049 | 10q24.33 | rs11191817 | T/C | SH3PXD2A | Intronic | 0.444 | 0.055 | −0.080 (0.015) | 2.80E-08 |
| 17:42989063 | 17q21.31 | rs1126642 | C/T | GFAP | Exonic / Missense variant | 0.151 | 0.030 | −0.151 (0.020) | 1.10E-13 |
| 17:73874071 | 17q25.1 | rs4600514 | G/A | TRIM47 | Exonic / Missense variant | 0.107 | 0.165 | 0.189 (0.023) | 8.00E-16 |
Chr chromosome, Pos position, Ref reference allele, Alt alternative allele, EAF effect allele frequency, GWAS genome-wide association study, EUR (1KGP) European population of the 1000 Genomes Project, SE standard error.
Fig. 1. Manhattan plots of genome-wide association studies.

Manhattan plots of white matter lesion volume in (a) the JPSC-AD Study and (b) the Meta-analysis (fixed effect model). The red horizontal line indicates P = 5.0 × 10⁻⁸. The blue horizontal line indicates a suggestive level (P = 1.0 × 10⁻⁵). The novel locus (SLC2A12) is highlighted in green.
Table 2.
Lead variants of genome-wide significant loci for white matter hyperintense lesion volume in the JPSC-AD Study and UK Biobank meta-analysis
| Chr:Pos | Location | Lead variant | Ref/Alt | Nearest gene | Annotation | JPSC-AD | UKB | meta Beta (SE) | meta P | P for het | I2 (%) | ||||
|---|---|---|---|---|---|---|---|---|---|---|---|---|---|---|---|
| EAF | Beta (SE) | P | EAF | Beta (SE) | P | ||||||||||
| A) Newly discovered signal from the results of meta-GWAS | |||||||||||||||
| 6:134326285 | 6q23.2 | rs1002559 | C/T | SLC2A12 | Intronic | 0.223 | 0.044 (0.017) | 1.70E-02 | 0.192 | 0.053 (0.010) | 1.53E-07 | 0.050 (0.009) | 6.61E-09 | 0.66 | 0 |
| B) Known signals from the results of meta-GWAS | |||||||||||||||
| 2:43104975 | 2p21 | rs62137163 | T/C | HAAO | Intergenic | 0.007 | 0.095 (0.089) | 2.50E-01 | 0.181 | -0.064 (0.010) | 7.56E-10 | -0.061 (0.010) | 2.10E-09 | 0.07 | 68.3 |
| 2:56150864 | 2p16.1 | rs3762515 | T/C | EFEMP1 | 5 Prime UTR variant | 0.044 | 0.024 (0.035) | 4.50E-01 | 0.097 | 0.146 (0.013) | 5.97E-28 | 0.131 (0.012) | 9.05E-26 | 1.11E-03 | 90.6 |
| 2:188221793 | 2q32.1 | rs36146505 | C/T | CALCRL | Intronic | 0.067 | -0.039 (0.029) | 1.70E-01 | 0.295 | -0.046 (0.009) | 8.92E-08 | -0.046 (0.008) | 3.67E-08 | 0.8 | 0.0 |
| 2:203683990 | 2q33.2 | rs79633844 | G/A | ICA1L | Intronic | 0.005 | -0.132 (0.101) | 1.80E-01 | 0.128 | -0.070 (0.012) | 4.39E-09 | -0.071 (0.012) | 2.18E-09 | 0.54 | 0.0 |
| 3:183373567 | 3q27.1 | rs10470355 | G/A | KLHL24 | Intronic | 0.381 | -0.047 (0.015) | 1.30E-03 | 0.262 | -0.077 (0.009) | 1.20E-17 | -0.069 (0.008) | 3.35E-19 | 0.09 | 66.0 |
| 5:82862328 | 5q14.2-q14.3 | rs35544841 | GA/G | VCAN | Intronic | 0.270 | 0.002 (0.016) | 9.80E-01 | 0.199 | 0.087 (0.010) | 2.13E-18 | 0.064 (0.008) | 4.64E-14 | 8.60E-06 | 95.1 |
| 6:151020020 | 6q25.1 | rs12202497 | T/A | PLEKHG1 | Intronic | 0.344 | 0.025 (0.015) | 9.30E-02 | 0.404 | 0.072 (0.008) | 6.24E-19 | 0.061 (0.007) | 6.48E-18 | 0.01 | 86.9 |
| 8:8729761 | 8p23.1 | rs907183 | C/G | MFHAS1 | Intronic | 0.784 | 0.064 (0.018) | 2.30E-04 | 0.457 | 0.045 (0.008) | 1.32E-08 | 0.048 (0.007) | 2.50E-11 | 0.34 | 0.0 |
| 8:11860251 | 8p23.1 | rs10103228 | G/T | DEFB134 | Intergenic | 0.929 | 0.062 (0.028) | 2.90E-02 | 0.610 | 0.043 (0.008) | 1.23E-07 | 0.044 (0.008) | 1.26E-08 | 0.51 | 0.0 |
| 10:105599770 | 10q24.33 | rs11191822 | G/T | SH3PXD2A | Intronic | 0.650 | -0.061 (0.015) | 2.80E-05 | 0.362 | -0.050 (0.008) | 1.04E-09 | -0.053 (0.007) | 3.17E-13 | 0.52 | 0.0 |
| 10:127675607 | 10q26.2 | rs3812683 | C/A | FANK1 | Intronic | 0.405 | 0.049 (0.015) | 7.60E-04 | 0.417 | 0.039 (0.008) | 9.09E-07 | 0.042 (0.007) | 3.48E-09 | 0.58 | 0.0 |
| 13:111040681 | 13q34 | rs11838776 | A/G | COL4A2 | Intronic | 0.084 | 0.022 (0.026) | 4.40E-01 | 0.279 | 0.057 (0.009) | 1.13E-10 | 0.054 (0.008) | 1.74E-10 | 0.21 | 38.2 |
| 16:51442679 | 16q12.1 | rs1948948 | T/C | SALL1 | Intergenic | 0.888 | -0.017 (0.023) | 5.70E-01 | 0.442 | -0.066 (0.008) | 9.31E-17 | -0.061 (0.008) | 5.24E-16 | 0.04 | 75.3 |
| 16:87237568 | 16q24.2 | rs12928520 | T/C | C16orf95 | Intergenic | 0.155 | 0.093 (0.020) | 2.70E-06 | 0.444 | 0.068 (0.008) | 3.34E-17 | 0.071 (0.007) | 1.02E-21 | 0.25 | 25.8 |
| 17:19194812 | 17p11.2 | rs1969161 | A/G | EPN2 | Intronic | 0.011 | 0.035 (0.070) | 6.90E-01 | 0.814 | 0.068 (0.010) | 2.80E-11 | 0.067 (0.010) | 2.71E-11 | 0.64 | 0.0 |
| 17:43141966 | 17q21.31 | rs4525538 | G/A | NMT1 | Intronic | 0.386 | 0.068 (0.015) | 6.00E-06 | 0.629 | 0.072 (0.008) | 2.17E-18 | 0.071 (0.007) | 5.94E-23 | 0.82 | 0.0 |
| 17:73871773 | 17q25.1 | rs3744020 | A/G | TRIM47 | Intronic | 0.159 | 0.134 (0.020) | 1.70E-11 | 0.188 | 0.145 (0.010) | 4.90E-47 | 0.143 (0.009) | 3.23E-57 | 0.61 | 0.0 |
| X:13808841 | Xp22.2 | rs6527976 | G/A | GPM6B | Intronic | 0.759 | -0.036 (0.014) | 1.11E-02 | 0.602 | -0.043 (0.007) | 7.74E-11 | -0.042 (0.006) | 3.14E-12 | 0.65 | 0.0 |
| X:152601840 | Xq28 | rs5970447 | T/C | ZNF275 | Intronic | 0.324 | -0.010 (0.013) | 4.32E-01 | 0.303 | -0.057 (0.007) | 1.01E-15 | -0.046 (0.006) | 1.06E-13 | 1.71E-03 | 90.1 |
Chr chromosome, Pos position, Ref reference allele, Alt alternative allele, EAF effect allele frequency, het heterogeneity, UKB UK Biobank, SE standard error, GWAS genome-wide association study.
Fig. 2. Regional association plots around SLC2A12.

Regional association plots for a JPSC-AD, b UK Biobank, and c Meta-GWAS generated using LocusZoom. The colors of the plots indicate LDs, from the Japanese reference panels in a and c and from Europeans of the 1000 Genomes Project in b.
We looked up the associations of identified variants (shown in Tables 1 and 2) in the publicly available GWAS summary statistics of the CHARGE Consortium. Of these variants, we identified the associations of the two variants listed in Table 1 and the nine variants in Table 2 in the summary statistics. We confirmed that the lead variants identified in the present study were also strongly associated in the CHARGE Consortium (Supplementary Table 3).
Comparison of effect sizes and signals at associated loci
To assess differences of genetic components associated with WML between JPSC-AD and UK Biobank, we compared the effect size of 20 significantly associated variants in the meta-GWAS (Fig. 3). As a result, the effect sizes of these variants were significantly correlated (Pearson’s r = 0.65, P = 0.002). Among the 20 variants evaluated, effect sizes of 19 variants (95%) were in the same direction (P for sign test < 0.001), although three variants showed significant heterogeneity (P for heterogeneity < 2.5 × 10⁻³ [ = 0.05/20]). Visual inspections of the regional association plots suggested different association signals at three loci (6q25.1 [PLEKHG1], 10q24.33 [SH3PXD2A], and 17q21.31 [NMT1]) between the JPSC-AD and UK Biobank groups (Fig. 4). Among these, the lead variants of NMT1 (near GFAP; rs1126642) and SH2PXD2A (rs11191817) in the JPSC-AD group met the genome-wide significance level (Table 1). Supplementary Table 4 shows the relationship between the JPSC-AD lead variants and UK Biobank lead variants for these three regions. Lead variants of these loci were more than 100 kb apart from each other, and were not in LD in either Japanese or European populations.
Fig. 3. Comparison of effect sizes for white matter lesions between JPSC-AD and UK Biobank.
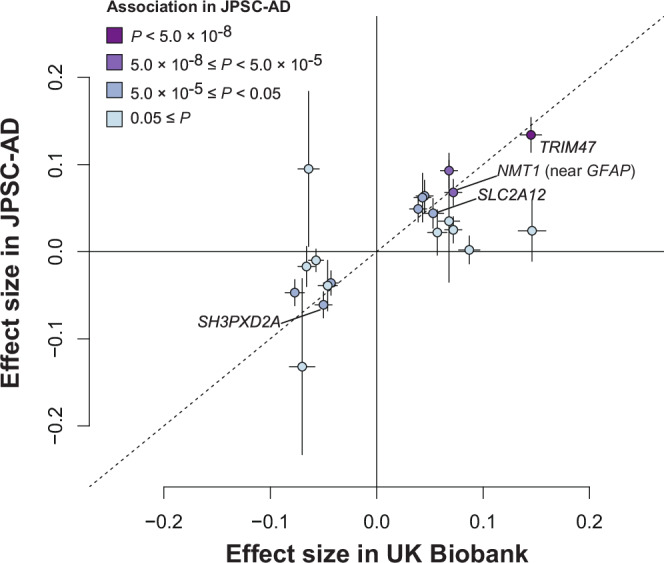
The plot shows the effect sizes of the lead variants of the 20 signals that met the genome-wide significance level (5.0 × 10⁻⁸) in the GWAS meta-analysis. The horizontal axis indicates the beta values in the UK Biobank and the vertical axis denotes the effect sizes in the JPSC-AD GWAS. Nineteen of the 20 variants have concordant positive and negative beta values, with a sign test of P < 0.001. The plots are colored according to their associations in the JPSC-AD GWAS.
Fig. 4. Regional association plots of loci showing different association signals between JPSC-AD and UK Biobank.

Regional association plot around (a) PLEKHG1, (b) SH3PXD2A, and (c) NMT1. Regional association plots for (1) JPSC-AD, (2) UK Biobank and (3) Meta-GWAS, generated using LocusZoom. The colors of the plots indicate LDs, from the Japanese reference panels in (1) and (3) and from Europeans of the 1000 Genomes Project in (2).
To assess whether causal variants of these loci were shared between the JPSC-AD and UK Biobank groups, we performed conditional analyses in the JPSC-AD group by adjusting for the variants that were most strongly associated in the UK Biobank group. We observed that rs1126642 in the GFAP region continued to exhibit genome-wide significance (P = 1.3 × 10⁻¹⁰), and an association was also suggested for rs11191817 in SH3PXD2A (P = 6.5 × 10⁻⁸). In contrast, the association of rs4600514 in TRIM47 was attenuated (P = 8.1 × 10⁻⁶; Supplementary Figs. 3–5).
Annotation and biological interpretation of identified regions
We annotated the variants in LD (r2 > 0.7) with the lead variants of significantly associated loci in both JPSC-AD GWAS and meta-GWAS. Four nonsynonymous variants were found in GFAP, TFPI, B9D1, and TRIM47 (Supplementary Table 5). These variants have not been previously reported, with the exception of TRIM47, p.R187W.
We note that rs1126642 (GFAP, p.D295N) is common in the Japanese population (18% in JPSC-AD); however, the allele frequencies of this variant were rare or low-frequency (<5%) in all non-Asian populations according to the gnomAD browser (https://gnomad.broadinstitute.org/). Next, we considered the functional impact of GFAP, p.D295N using in silico prediction tools (Supplementary Table 5). The majority of the results suggested a deleterious effect for this variant. When we explored the pleiotropic effects of rs1126642 through PheWeb in three large biobanks (Biobank Japan, UK Biobank, and FinnGen; Supplementary Fig. 6), a significant association was only reported in UK Biobank (association with Underlying [primary] cause of death: ICD10: K56.6 Other and unspecified intestinal obstruction; P = 2.1 × 10⁻⁶). Two other nonsynonymous variants, i.e., TFPI, p.N221S and B9D1, p.Y256C, were suggested to have little functional impact (Supplementary Table 5). Since a recent study reported that rs1126642 is associated with expanded perivascular space (EPVS)12, we evaluated the association in the JPSC-AD group, and we successfully confirmed that rs1126642 was associated with EPVS (Beta [SE] = −0.108 [0.020], P = 1.0 × 10⁻⁷). EPVS, like WML, is one of the small vessel diseases. Although its pathophysiology is not well understood, it may have a similar background to WML.
We also considered the functional role of SLC2A12. The allele frequency of the lead variant rs1002559 was similar between JPSC-AD (22%) and UK Biobank (19%). There were no significantly associated phenotypes among the three large biobanks. We found that rs1002559 was reported as eQTL for SLC2A12 in three tissues (Nerve–Tibial, Artery–Aorta, and Artery–Tibial) and one cell-type (Cells–Cultured fibroblasts) in the GTEx project. We assessed the colocalization of associated variants in WML-GWAS in UK Biobank and eQTL analysis (Supplementary Fig. 7), and considered that associations of WML-GWAS were likely to be overlapped with those in the eQTL analysis of Nerve–Tibial (Supplementary Fig. 8).
Genetic correlations between WML and other traits
We examined the genetic correlations between the WML-GWAS and the published GWAS summary statistics of the Biobank Japan project for the five traits with significant correlations described in the previous report8. We observed a significant positive genetic correlation with ischemic stroke (genetic correlation [SE] = 0.511 [0.121], P = 2.48 × 10⁻⁵). No significant genetic correlation with other traits was identified (Supplementary Table 6).
Discussion
In this first large-scale GWAS of WMLs in an Asian population, we identified three loci associated with WMLs in a cohort of older Japanese. A cross-ethnic meta-analysis revealed one novel WML-associated locus (SLC2A12). The functional annotation of the three loci identified in the JPSC-AD GWAS indicated that the likely deleterious variant in GFAP, i.e., p.D259N, is associated with WML, which is common in Asian populations although its allele frequencies are low in non-Asian populations. Comparison of the genetic effects on WML between our study and UK Biobank indicated that the genetic components of WML are shared across populations.
The GWAS of the JPSC-AD participants identified three loci, all of which had already been reported. Although our present findings suggest that there might be different causal variants at SH3PXD2A and NMT1 between Japanese and European populations, our observations support the certainty of the previously reported loci. One of the lead variants was a GFAP protein-altering variant which has not been reported. GFAP is a gene encoding glial fibrillary acidic protein, an astrocyte-specific intermediate diameter filament. The mutations in GFAP are known to cause Alexander’s disease13. The causative variants of Alexander’s disease are reported to cause abnormal aggregation of GFAP in astrocytes, resulting in the appearance of Rosenthal fibers. Considering that the prevalence of Alexander’s disease is very rare (approximately one in 2.7 million people14), p.D259N would not be causative for the disease because the variant is common in East Asians. Given that in silico prediction tools suggested damaging/deleterious effects of GFAP, p.D259N, altered GFAP function could influence the WML volume. Recently, p.D259N has also been reported to be involved in enlarged perivascular spaces of the brain, a type of small vessel disease12. Taken together, these results suggest that GFAP, p.D259N influences small vessels of the brain.
We evaluated genetic correlations between WML and five traits using the summary statistics of our WML-GWAS and GWASs conducted in the Biobank Japan project15, and the results revealed a significant positive genetic correlation between WML and ischemic stroke. Although we evaluated genetic correlations which were reported to be significant in an investigation of Europeans8, we could not replicate the remaining four traits (systolic blood pressure, diastolic blood pressure, body mass index, and smoking). Given that these four phenotypes are epidemiologically known risk factors for WML16, the observed differences may not be due to differences between populations, but rather to differences in sample size, baseline characteristics, and/or covariates. Further large-scale GWASs in the Japanese population or GWASs conducted under conditions similar to those of the JPSC-AD in the European population will help clarify this issue.
Our meta-GWAS identified one previously unreported signal, located on SLC2A12. SLC2A12 encodes a transporter protein, GLUT12. GLUT12 has been shown to be expressed in astrocytes in the brain17. Changes in the expression of GLUT12 may alter glucose metabolism in astrocytes and thereby affect WMLs.
A comparison of GWAS results between JPSC-AD and UK Biobank showed that the effect sizes of associated variants were similar, suggesting that genetic components are generally shared between Japanese and European populations. Although the sample size of our study was not larger than those in previous studies, we could detect the protein-altering variant in GFAP that was specifically common in the Asian population. We also observed that the shapes of the association signals differed between UK Biobank and the JPSC-AD, implying that the causal variants at associated loci differ between Europeans and Asians. These results highlight the value of examining genetic components of complex traits across diverse populations. Our comparison of the effect sizes of 20 variants that reached genome-wide significance in the meta-GWAS detected seven loci whose associations were attenuated in the meta-GWAS compared to those in the UK Biobank alone: HAAO, EFEMP1, VCAN, PLEKHG1, COL4A2, SALL1, and ZNF275. Among these loci, four showed nominal heterogeneity (Phet < 0.05). Although the heterogeneity was not significant, the effects of ICA1L were opposite between the JPSC-AD and UK Biobank. Considering that the associations in the JPSC-AD were not significant (P > 0.05), we speculate that these loci may harbor European-specific causal variants, or there could be differences in the LD structure between the causal variants and lead variants in each population.
The present study has several limitations. First, in the present study, we used FreeSurfer to detect WML, and there is a potential for misclassification when using this software. WML can be easily detected on fluid-attenuated inversion recovery (FLAIR) images due to their good contrast, whereas FreeSurfer relies solely on T1-weighted images for segmentation. In addition, FreeSurfer can underestimate WML18. The possibility that this caused some bias cannot be ruled out. Second, there are differences between the JPSC-AD study and the UK Biobank analysis regarding participant characteristics, genotyping, quality controls, and adjustment factors (Supplementary Table 7). These differences could potentially introduce bias in the comparisons between ethnicities. Third, since there was no dataset for the verification of reproducibility in this study, further replication studies are necessary to assess the strength and reliability of our findings. Fourth, we only looked at total WML and did not examine any sub-classifications, such as deep and periventricular WML.
Methods
Participants
The study design and overall methodology of the JPSC-AD Study have been described in a previous report11. Of the total 11,957 subjects in the JPSC-AD Study, DNA samples were obtained in 10,400 subjects. After excluding 47 people through a quality check of the array data, as well as six people who were outside the Japanese cluster by principal component analysis, 728 people who did not undergo MRI examination, 14 people who had FreeSurfer analysis errors, 29 persons with intracranial volume outliers, 115 persons with more than five site-specific volume outliers, and three persons with missing wm_hypointensities values, a total of 9479 persons were included in the present analysis. The study was approved by the Ethics Review Committee of all collaborative facilities (Kyushu University Institutional Review Board for Clinical Research; Committee of Medical Ethics of Hirosaki University Graduate School of Medicine; Ethical Review Committee Iwate Medical University; Medical ethics committee of Kanazawa University; Human genome/Gene analysis research ethics committee of Kanazawa University, the Keio University School of Medicine, Ethics Committee; The Medical Ethics Review Board of the Ehime University; Research Ethics Committee, Matsue Medical Center, National Hospital Organization; Ethics Committee for Human Genome and Gene Analysis Research at the Faculty of Life Sciences, Kumamoto University; Ethics Committee Tohoku University Graduate School of Medicine; Ethical Review Board of Nakamura Gakuen University; RIKEN Yokohama Ethics Review Committee). Written informed consent was obtained from all participants. This study was performed in accordance with all relevant ethical regulations including the Declaration of Helsinki.
Genotyping
An Illumina Japanese Screening Array was used for genotyping. Gender discrepancy, sample call rate <98%, close relatives, and outliers (distance > 10sd short, 11sd long) were excluded as sample quality checks, and Hardy–Weinberg equilibrium >1.0 × 10⁻⁶, call rate >99%, monomorphic, minor allele count <5, and frequency difference >6% with reference panel were excluded as SNP quality checks. Imputation was performed using Minimac4 v1.0.0. Reference panels included 1,037 whole genome sequences from BioBank Japan and 2504 publicly available whole genome sequences from the 1000 Genomes Project (Phase 3v5)19. As a post-imputation quality control, variants with minor allele frequency (MAF) < 0.5% and R2 ≤ 0.7 were excluded, and 8,495,153 variants were used for association analysis in JPSC-AD.
Brain MRI and WML measurement
3D-T1 weighted images were obtained with 1.5-T or 3-T MRI and segmented with FreeSurfer software (http://surfer.nmr.mgh.harvard.edu/) version 5.3. Log(wm_hypointensities) was used as the WML volume, and standardized residuals with sex, age, squared age, estimated total intracranial volume, and facility dummy variables as covariates were calculated and used as phenotypes. Although the results of previous reports on gender differences in WML are not consistent, many of the results show gender differences20,21. In the JPSC-AD, the geometric mean of WML volume / eTIV was 0.292% for men and 0.264% for women, with significantly greater WML volume in men (P < 0.001). In addition, given that lifestyles and the prevalence of such cardiovascular risk factors vary between men and women, we considered the potential for these environmental factors to indirectly impact WML, and we, therefore, included sex as a covariate to mitigate possible confounding effects. If the residuals for individual data were less than −4 SD or greater than +4 SD from linear regression, these data were considered extreme outliers; participants with extreme outliers in intracranial volume and volumes of at least five brain regions were excluded from the study. Similarly, (right_vessel + left_vessel) /2, calculated in the same manner for the purpose of examining EPVS, was used as the phenotype. The model was
| 1 |
Association analysis
BOLT-LMM (v2.3.5)22 was used for the association analyses, which included the top 10 principle components (PCs) of genotypes estimated by PLINK 1.9 as covariates. Manhattan plots were generated using R version 4.2.0, RStudio Server (2022.12.0 Build 353), and qqman 0.1.8 packages. Regions within 500 K bases before or after the lead variant were considered to be the same loci. Regional association plots were plotted using LocusZoom version 1.323. ANNOVAR Software was used for annotation of variants24. We looked up the variants that showed significant associations in both the GWAS of the JPSC-AD and the meta-GWAS in the publicly available summary statistics of GWAS reported by the CHARGE Consortium (A Multi-Ethnic GWAS Meta-Analysis Of Cerebral White Matter Hyperintensities; https://ftp.ncbi.nlm.nih.gov/dbgap/studies/phs000930/analyses/phs000930.pha004625.txt)25.
Estimation of genetic correlation
We used LDSC26 software to estimate genetic correlations between WML and other traits. We chose traits that were described as significant in the report from the UK Biobank8. For these traits, we obtained summary statistics from pheweb of the Biobank Japan project (https://pheweb.jp/). We calculated the genetic correlations with these results and the JPSC-AD WML-GWAS results, using munge_sumstats.py and ldsc.py. The LDSC software was used to estimate the per-SNP heritability.
Meta-GWAS
We performed a meta-GWAS using the summary statistics of WML GWAS in the UK Biobank (obtained via https://open.win.ox.ac.uk/ukbiobank/big40/release2/stats33k/1437.txt.gz) under the assumption of a fixed-effect model using R without additional packages. The UK Biobank dataset consisted of 33,224 individuals (17,411 women and 15,813 men) with a mean age of 64.2 years (range 46.1–81.8 yrs), of whom 32,114 had WML values. We considered variants that reached genome-wide significance in the meta-GWAS results as significant, and we examined the associations of these variants in the JPSC-AD and considered them to be significantly associated in the Japanese population if the variant was nominally associated in the JPSC-AD (P < 0.05).
Supplementary information
Acknowledgements
This study was supported by the Japan Agency for Medical Research and Development (JP24dk0207053) and Suntory Holdings Limited (Osaka, Japan). The funders had no role in the design of the study, the collection, analysis, and interpretation of data, or the writing of the manuscript. We would like to acknowledge the dedicated efforts and valuable contributions made by all the researchers and investigators in the JPSC-AD Study Group. We also extend our thanks to the participants for contributing their time to the JPSC-AD Study.
Author contributions
Study design, statistical analyses, data interpretation and drafting the manuscript: Y.F. and M.A.; Data collection: Y.F., N.H., T.H., M.S., T.O., J.H., S.M., T.M., K.O., M.M., K.N., J.I., M.T. and T.N.; Genetic data analysis (imputation): T.C. and Y.M.; Brain imaging data analysis: Y. Tatewaki and Y. Taki; Study supervision: T.N. All authors read, provided their critical review of, and approved the final manuscript.
Data availability
The GWAS summary statistics are available via the national NBDC human database (https://humandbs.dbcls.jp/en/) without restriction with accession codes hum0466.v1.gwas.v1. The genotype and phenotype data are not publicly available due to the restriction in the informed consent of research participants. Data are, however, available from the corresponding author upon reasonable request and with permission of the Japan Agency for Medical Research and Development.
Code availability
We used the following software to carry out our analysis: PLINK (https://www.cog-genomics.org/plink2); BOLT-LMM (https://www.hsph.harvard.edu/alkes-price/software/); LDSC (https://github.com/bulik/ldsc); R (https://www.r-project.org/); and LocusZoom (https://github.com/Geeketics/LocusZooms).
Competing interests
Toshiharu Ninomiya reports receiving grants from Suntory Holdings Limited. The other authors have nothing to disclose.
Footnotes
Publisher’s note Springer Nature remains neutral with regard to jurisdictional claims in published maps and institutional affiliations.
These authors contributed equally: Yoshihiko Furuta, Masato Akiyama.
A list of authors and their affiliations appears at the end of the paper.
A full list of members and their affiliations appears in the Supplementary Information.
Contributor Information
Masato Akiyama, Email: akiyama.masato.588@m.kyushu-u.ac.jp.
On behalf of the Japan Prospective Studies for Aging and Dementia (JPSC-AD) Study Group:
Yoshihiko Furuta, Masato Akiyama, Naoki Hirabayashi, Takanori Honda, Mao Shibata, Tomoyuki Ohara, Jun Hata, Chikashi Terao, Yukihide Momozawa, Yasuko Tatewaki, Yasuyuki Taki, Shigeyuki Nakaji, Tetsuya Maeda, Kenjiro Ono, Masaru Mimura, Kenji Nakashima, Jun-ichi Iga, Minoru Takebayashi, and Toshiharu Ninomiya
Supplementary information
The online version contains supplementary material available at 10.1038/s41525-024-00431-x.
References
- 1.Pantoni, L. & Garcia, J. H. Pathogenesis of leukoaraiosis: a review. Stroke28, 652–659 (1997). [DOI] [PubMed] [Google Scholar]
- 2.Bos, D. et al. Cerebral small vessel disease and the risk of dementia: a systematic review and meta-analysis of population-based evidence. Alzheimers Dement14, 1482–1492 (2018). [DOI] [PubMed] [Google Scholar]
- 3.Debette, S. & Markus, H. S. The clinical importance of white matter hyperintensities on brain magnetic resonance imaging: systematic review and meta-analysis. BMJ341, c3666 (2010). [DOI] [PMC free article] [PubMed] [Google Scholar]
- 4.Sachdev, P. S. et al. White matter hyperintensities are under strong genetic influence. Stroke47, 1422–1428 (2016). [DOI] [PubMed] [Google Scholar]
- 5.Fornage, M. et al. Genome-wide association studies of cerebral white matter lesion burden: the CHARGE consortium. Ann. Neurol.69, 928–939 (2011). [DOI] [PMC free article] [PubMed] [Google Scholar]
- 6.Verhaaren, B. F. et al. Multi-ethnic genome-wide association study of cerebral white matter hyperintensities on MRI. Circ. Cardiovasc. Genet8, 398–409 (2015). [DOI] [PMC free article] [PubMed] [Google Scholar]
- 7.Traylor, M. et al. Genetic variation in PLEKHG1 is associated with white matter hyperintensities (n = 11,226). Neurology92, e749–e757 (2019). [DOI] [PMC free article] [PubMed] [Google Scholar]
- 8.Persyn, E. et al. Genome-wide association study of MRI markers of cerebral small vessel disease in 42,310 participants. Nat. Commun.11, 2175 (2020). [DOI] [PMC free article] [PubMed] [Google Scholar]
- 9.Sargurupremraj, M. et al. Cerebral small vessel disease genomics and its implications across the lifespan. Nat. Commun.11, 6285 (2020). [DOI] [PMC free article] [PubMed] [Google Scholar]
- 10.Smith, S. M. et al. An expanded set of genome-wide association studies of brain imaging phenotypes in UK Biobank. Nat. Neurosci.24, 737–745 (2021). [DOI] [PMC free article] [PubMed] [Google Scholar]
- 11.Ninomiya, T. et al. Study design and baseline characteristics of a population-based prospective cohort study of dementia in Japan: the Japan Prospective Studies Collaboration for Aging and Dementia (JPSC-AD). Environ. Health Prev. Med25, 64 (2020). [DOI] [PMC free article] [PubMed] [Google Scholar]
- 12.Duperron, M. G. et al. Genomics of perivascular space burden unravels early mechanisms of cerebral small vessel disease. Nat. Med29, 950–962 (2023). [DOI] [PMC free article] [PubMed] [Google Scholar]
- 13.Brenner, M. et al. Mutations in GFAP, encoding glial fibrillary acidic protein, are associated with Alexander disease. Nat. Genet27, 117–120 (2001). [DOI] [PubMed] [Google Scholar]
- 14.Yoshida, T. et al. Nationwide survey of Alexander disease in Japan and proposed new guidelines for diagnosis. J. Neurol.258, 1998–2008 (2011). [DOI] [PubMed] [Google Scholar]
- 15.Sakaue, S. et al. A cross-population atlas of genetic associations for 220 human phenotypes. Nat. Genet53, 1415–1424 (2021). [DOI] [PubMed] [Google Scholar]
- 16.Jorgensen, D. R. et al. A population neuroscience approach to the study of cerebral small vessel disease in midlife and late life: an invited review. Am. J. Physiol. Heart Circ. Physiol.314, H1117–H1136 (2018). [DOI] [PMC free article] [PubMed] [Google Scholar]
- 17.Kyrtata, N., Emsley, H. C. A., Sparasci, O., Parkes, L. M. & Dickie, B. R. A systematic review of glucose transport alterations in Alzheimer’s disease. Front Neurosci.15, 626636 (2021). [DOI] [PMC free article] [PubMed] [Google Scholar]
- 18.Hotz, I. et al. Performance of three freely available methods for extracting white matter hyperintensities: FreeSurfer, UBO Detector, and BIANCA. Hum. Brain Mapp.43, 1481–1500 (2022). [DOI] [PMC free article] [PubMed] [Google Scholar]
- 19.Akiyama, M. et al. Characterizing rare and low-frequency height-associated variants in the Japanese population. Nat. Commun.10, 4393 (2019). [DOI] [PMC free article] [PubMed] [Google Scholar]
- 20.Wang, L. et al. Sex disparity of cerebral white matter hyperintensity in the hypertensive elderly: the Shanghai Changfeng study. Hum. Brain Mapp.44, 2099–2108 (2023). [DOI] [PMC free article] [PubMed] [Google Scholar]
- 21.Lohner, V. et al. Relation between sex, menopause, and white matter hyperintensities: the Rhineland Study. Neurology99, e935–e943 (2022). [DOI] [PMC free article] [PubMed] [Google Scholar]
- 22.Loh, P. R. et al. Efficient Bayesian mixed-model analysis increases association power in large cohorts. Nat. Genet47, 284–290 (2015). [DOI] [PMC free article] [PubMed] [Google Scholar]
- 23.Pruim, R. J. et al. LocusZoom: regional visualization of genome-wide association scan results. Bioinformatics26, 2336–2337 (2010). [DOI] [PMC free article] [PubMed] [Google Scholar]
- 24.Wang, K., Li, M. & Hakonarson, H. ANNOVAR: functional annotation of genetic variants from high-throughput sequencing data. Nucleic Acids Res.38, e164 (2010). [DOI] [PMC free article] [PubMed] [Google Scholar]
- 25.Rich, S. et al. Rapid evaluation of phenotypes, SNPs and results through the dbGaP CHARGE Summary Results site. Nat. Genet48, 702–703 (2016). [DOI] [PMC free article] [PubMed] [Google Scholar]
- 26.Bulik-Sullivan, B. et al. LD Score regression distinguishes confounding from polygenicity in genome-wide association studies. Nat. Genet47, 291–295 (2015). [DOI] [PMC free article] [PubMed] [Google Scholar]
Associated Data
This section collects any data citations, data availability statements, or supplementary materials included in this article.
Supplementary Materials
Data Availability Statement
The GWAS summary statistics are available via the national NBDC human database (https://humandbs.dbcls.jp/en/) without restriction with accession codes hum0466.v1.gwas.v1. The genotype and phenotype data are not publicly available due to the restriction in the informed consent of research participants. Data are, however, available from the corresponding author upon reasonable request and with permission of the Japan Agency for Medical Research and Development.
We used the following software to carry out our analysis: PLINK (https://www.cog-genomics.org/plink2); BOLT-LMM (https://www.hsph.harvard.edu/alkes-price/software/); LDSC (https://github.com/bulik/ldsc); R (https://www.r-project.org/); and LocusZoom (https://github.com/Geeketics/LocusZooms).