

Abstract

The use of nucleic acid-based detection tools for microorganisms and fungi has become a gold standard. This is particularly the case for wood-decaying fungi like Serpula lacrymans, which are hard to discriminate based on macroscopic and microscopic observations. This dry rot is important to detect as it is particularly destructive in an infested building, which requires immediate action to prevent spreading and significant damage to structural elements. Through the development and optimization of loop-mediated isothermal amplification against S. lacrymans-specific rDNA internal transcribed spacer region, we demonstrate that it is possible to achieve rapid and specific amplification without nonspecific self-amplification in a similar range as real-time quantitative PCR without any necessary DNA isolation using a colorimetric detection assay. Through a combined set of self-amplification minimization along with hand-held sample homogenization, the LAMP assay was optimized to provide a femtogram-range assay capable of confirming identification in a real field sample either predominantly composed of S. lacrymans or containing the fungus while remaining negative when tested on different types of fungi found in basement-collected samples.
Introduction
Serpula lacrymans is a basidiomycete fungus (Agaricomycetes from the Boletales clade) responsible for growing concerns across several countries thanks to its destructiveness toward wood structures.1 Unlike lignivorous fungi grouped under the name of fibrous or soft rot, this fungus is categorized as cubic rot (or dry rot) and is distinguished by its ability to assimilate wood polysaccharides like cellulose without degrading lignin.2 This aggressive process leaves amorphous brown residues and results in infested structures that are fragile and friable. Its viciousness is attributed to its great colonization capabilities by rapid mycelium spreading after sporulation from infected sites.
Colonized buildings and structures often display wood surfaces in contact with damp masonry, particularly in poorly ventilated environments. Still, because of its spreading capacity, infested buildings are often condemned to destruction depending on the extent of damage to the structure. When early detection occurs, the decontamination of structures may be attempted, but success is often limited and depends on the extent of infestation.3
Dry rot is not currently considered a pathogen for humans. Despite the limited published work on the subject, it is presumed that its spores are prone to causing immune sensitization, leading to allergic reactions. This often occurs due to polysensitization, which means sensitization to multiple species that infest environments simultaneously as a result of increased moisture.4 Still, its specific detection is an important aspect since the handling of contaminated material is radically different in confirmed cases of S. lacrymans. Moreover, in some countries/regions, governmental programs are in place to help owners of an S. lacrymans-infested building upon a demonstration of the nature of the fungus.
Testing for dry rot and related fungi is mainly done on a morphological basis by a microbiologist. Visual inspection methods in relation to the site of contamination are often used to confirm the diagnosis since dry rot, particularly S. lacrymans, is often found in unoccupied environments left without maintenance or upkeep, where the presence of water or humidity is persistent. Softwood is more susceptible than hardwood, as expected from the origin of the fungus from coniferous forests.2 For S. lacrymans, the morphological criteria are nonspecific, and the culture methods are often unable to constrain the growth of other species (e.g., Penicillium spp and Aspergillus spp), which takes over the cultures, even if the used agar media are selective. The use of DNA probes, or PCR, is among the most widely used methods allowing the confirmation of its identity.5 For PCR, primers targeting the internal transcribed spacer (ITS) regions, specifically the ITS1 and ITS2 regions that separate the subunits of rDNA (rDNA) of the genome, are commonly used. This is because their variability across different fungal species allows for effective discrimination.6 Other less frequently reported methods involve the analysis of volatile metabolites by mass spectrometry, the use of immunological methods, electrophoretic profiling of protein lysates, or the use of well-trained sniffer dogs.7
PCR methods present clear advantages since primer pairs make amplification specific, along with the possibility of confirming the nature of the fungus by amplicon sequencing. However, PCR also comes with limitations, such as the requirement of purified DNA, particularly from field samples, which can often carry PCR-inhibiting substances (such as wall-cleaning agents and metabolites). Moreover, these assays, either using real-time quantitative PCR (qPCR) or standard PCR, can only be performed in laboratory environments because of the equipment, the latter even requiring gel migration of the resulting amplicons.
Loop-mediated isothermal amplification (LAMP) assays represent an interesting alternative to PCR due to the fact that they can be performed with very simple equipment, as temperature cycling is not required. Moreover, such assays are less prone to being affected by contaminants, making them achievable directly on the field following sample collection without any preceding purification steps.8,9 LAMP assays typically use 4 to 6 primers recognizing up to 8 distinct regions of the intended target DNA sequence to result in a highly specific amplification reaction generating self-looping products mediated by a strand-displacing polymerase active at rather low temperatures (55–65 °C). The design of such assays is often more limited when compared to the simpler PCRs that only require two primers and must take into consideration the likelihood of primer–primer interactions and thus autoamplification. When properly designed, LAMP can be used with simple colorimetric detection to detect DNA amplification and simply be run within 20–30 min inside an insulated water container or simple device maintaining the intended temperature for amplification.8
Methods
S. lacrymans Culture
S. lacrymans (Wulfen: Fries) Schroeter (ATCC strain 34550) was obtained and grown on yeast mold agar containing yeast extract (3 g/L), malt extract (3 g/L), dextrose (10 g /L), peptone (5 g/L), and agar (20 g/L) in a humidified chamber (half-closed jar with humid pads) at room temperature for 7–14 days to obtain mycelium. White mycelium was collected by agar scratching and frozen (−20 °C) in aliquots for further extractions.
DNA Extraction
For mycelium DNA extraction, a FastDNA SPIN kit (MP Biomedicals) was used. About 100 to 200 mg of starting material was dissected and added to a CK28 ceramic bead homogenization tube (Precellys) with 1 mL of CLS-Y buffer. Samples were subjected to homogenization at 6,500g for two rounds of 30 s. Samples were then clarified by centrifugation at 14,000g for 5 min at room temperature. The supernatants were then transferred into a clean tube, and 1 volume of binding matrix slurry was added. Samples were then incubated for 5 min at room temperature with constant agitation. Samples were then loaded on Spin Filter units and centrifuged at 14,000g for 5 min at room temperature. The beads (from the slurry) were then washed with 400 μL of SEWS-M buffer and resuspended by up-and-down aspiration with a micropipette. Tubes were centrifuged at 14,000g for 5 min at room temperature, and the wash procedure was repeated again. DNA was then eluted in a new tube following the addition of 110 μL of DES buffer and warming to 55 °C for 5 min. Eluted DNA was collected by centrifugation at 14,000g for 5 min at room temperature. DNA was cleaned using a DNA Clean UP kit (QIAGEN) following the manufacturer’s procedure. DNA was quantified by spectroscopy using a NanoDrop instrument (Thermo Scientific) and diluted to 10 ng/μL if concentrations were higher.
Quantitative Polymerase Chain Reaction
For qPCRs, we used S. lacrymans-specific primers that targeted rDNA ITS1 and ITS2 sections in 5′ and 3′ of the 5.8S rDNA segment, respectively (forward: 5′-TCCGTAGGTGAACCTGCGG-3′ and antisense: 5′-GAGGAGCCGATGAACAAGAG-3′).8 A positive control was also run concomitantly, consisting of the same reaction but combined with a universal pan-fungus rDNA ITS antisense primer (5′-GCTGCGTTCTTCATCGATGC-3′) used with the same forward primer as above.10 Reactions were conducted with 0.5 μM of each primer and 100 ng – 0.1 pg of purified DNA with SYBR Green (PerfeCTa SYBR Low ROX, Quantabio; reaction size: 20 μL). The thermal cycle used was 1 × (95 °C × 10 min); 40 × (95 °C × 30 s, 55 °C × 60 s, 72 °C × 60 s) on a MX3005P Thermocycler (Agilent). The main amplification products were sequenced by Sanger sequencing for each individual reaction using both forward and reverse primers. ITS amplicon sequences were taxonomically classified using the RDP Classifier using the UNITE Fungal ITS trainset (07–02–2014) as data set (Table S1).11
Loop-Mediated Isothermal Amplification
LAMP assays were designed using LAMP Primer Design (New England Biolabs, v1.3.0). For design, the S. lacrymans DNA sequences were taken from the 5.8S and the ITS2 section of rRNA (ITS between 5.8S and 18S DNA regions). Design parameters and restrictions are found in the Supporting Information. The five best returned sets of sequences were synthesized for LAMP assays (Table 1, Integrated DNA Technologies, USA). Assays (25 μL) were conducted using 0.2 μM for F3/B3 primers, 1.6 μM for Forward Inner Primer (FIP)/Backward Inner Primer (BIP) primers, and 0.4 μM for loop primers (LB/LF) using Isothermal Amplification Buffer (New England Biolabs, USA) and 8 U Bst 2.0 DNA Polymerase (New England Biolabs) supplemented with MgSO4 (final 8 mM MgSO4) and SYBR Safe Dye (Invitrogen, 1:1000 final dilution) and dNTP (1.4 mM each). The final volume was adjusted with molecular-grade water based on the volume of DNA added. The amplifications were conducted in a thermocycling unit or in a qPCR Mx3005p (Agilent Technologies) to monitor SYBR Safe fluorescence emission in real time (each minute). Assays were performed at 65 °C for 30 min alongside a no-template control (NTC). Amplification reactions were then loaded with loading buffer on 1% agarose gel with 1x GelRed and visualized under a UV lamp.
Table 1. S. lacrymans ITS2 LAMP Assays Primers.
| set | name | sequence 5–3′ |
|---|---|---|
| 1 | F3 | GCTCCTTGGTATTCCGAG |
| B3 | ATCACACCGAGACACTGG | |
| FIP | CCAAGCCCACAATCAAAACAAATTGGAGCATGCCTGTTTGAGT | |
| BIP | GCTTGCTGGTGGACTCTTGTTCGCACATCAACCTTTGC | |
| LB | TCGGCTCCTCTGAAATGTATT | |
| 2 | F3 | GTCATTAAATTCTCAACCCCA |
| B3 | CTTGCGACAACGACTGTA | |
| FIP | AGAGGAGCCGATGAACAAGAGGTTTTGATTGTGGGCTTGG | |
| BIP | AATGTATTAGCAAAGGTTGATGTGCGAACACTGCACGTCAGAC | |
| LF | CAGCAAGCCCCCACAA | |
| LB | GAACCAGTGTCTCGGTGTG | |
| 3 | F3 | TGAAGAACGCAGCGAATT |
| B3 | ATTTCAGAGGAGCCGATG | |
| FIP | ATACCAAGGAGCGCAAGGTGAATGTGAATTGCAGATTTTCAGT | |
| BIP | TGAGTGTCATTAAATTCTCAACCCCAACAAGAGTCCACCAGCA | |
| LB | TTTGATTGTGGGCTTGGATTG | |
| 4 | F3 | TGAAGAACGCAGCGAATT |
| B3 | ATTTCAGAGGAGCCGATG | |
| FIP | ATACCAAGGAGCGCAAGGTGAATGTGAATTGCAGATTTTCAGT | |
| BIP | TGAGTGTCATTAAATTCTCAACCCCAACAAGAGTCCACCAGCA | |
| LB | TTTGATTGTGGGCTTGGATTG | |
| 5 | F3 | TGAAGAACGCAGCGAATT |
| B3 | ATTTCAGAGGAGCCGATG | |
| FIP | ATACCAAGGAGCGCAAGGTGAATGTGAATTGCAGATTTTCAGT | |
| BIP | TGAGTGTCATTAAATTCTCAACCCCAACAAGAGTCCACCAGCA | |
| LB | TTTGATTGTGGGCTTGGATTG |
For colorimetric reactions, WarmStart Colorimetric LAMP 2X Master Mix with uracil-DNA glycosylase (UDG) (New England Biolabs) was used. Mixes final concentrations (25 μL reactions) were 1.6 μM for both FIP and BIP primers, 0.2 μM for both primers forward outer (F3), backward outer (B3) primers, and 0.4 μM for loop primers (LF and/or LB), forward and backward when appliable. Table 1 details the primer sequences. Colorimetric assay-based detection was done by eye, comparing NTC with the sample.
Field Samples
Mycelium from field specimens was stored at room temperature for <1 week at 4 °C for a longer time. All samples were screened for S. lacrymans by qPCR and were identified by ITS2 sequencing and classification using RDP (see qPCR section in Methods). No samples with ambiguous ITS sequencing results were used in this study.
Extraction-Free Methods
For direct sample processing without DNA extractions, samples were first humected by adding 15 μL of the indicated buffer (i.e., CLS-Y, TE) per mg of sample. For pellet-mixer-based extraction, a 5 mL Eppendorf tube was used with manual putting with a hand-held motorized pellet mixer (VWR #477447–370) for 30 s. For single-bead disruption extraction, a 1.7 mL screw-cap tube (SC Micro Tube PCR-PT, SARSTEDT #72.693.465) with a single one-fourth″ ceramic sphere (MP BIOMEDICALS #6540424) with manual hand-held vertical agitation for 30 s. MP BIO extraction was done using a tube garnet matrix and one one-fourth″ ceramic sphere (Lysing Matrix A; 2 mL tubes, MP BIOMEDICALS #6910100). For inox-bead-based extraction, a 5 mL Eppendorf tube was used with six 6.0 mm diameter stainless steel beads (Next Advance #SSB60) with manual hand-held vertical agitation for 30 s. Following the agitation, samples were left vertically to decant to pipet supernatant that was further diluted at the indicated fold dilution with water (1:100–10,000) prior to use in the assay. The final conditions of the assay can be found in Table S2.
Results
LAMP Amplification of rRNA ITS2 Allows Detection of S. lacrymans DNA
Since ITS2-specific amplification and sequencing is a suitable method to specifically detect and authenticate S. lacrymans, LAMP assays targeting this segment were designed using DNA sequence from the 5.8S and the ITS2 section of rRNA (ITS between 5.8S and 18S DNA regions). Using isolated gDNA from pure culture of S. lacrymans, the ITS2 LAMP assays (numbered as per Table 1) were tested against varying amounts of gDNA (from 100 ng to 0.1 pg, based on NanoDrop quantitation). From the 5 tested assays, only two successfully amplified the DNA (Figure 1).
Figure 1.

LAMP assay screening with purified Serpula lacrymansgDNA Agarose gel electrophoresis of LAMP reactions for the indicated assays with the indicated gDNA input (with 10-fold dilutions). For the amplifying assay, the time to fluorescence thresholds of real-time monitored reactions (1 Ct = 1 min) were plotted in histograms., the time to fluorescence thresholds of real-time monitored reactions.
Although Assays #1 and #2 were effective at amplifying S. lacrymans gDNA, they both indicated basal amplification in NTC blanks, as visible on the gels and from positivity in blanks (Figure 1). This likely translates into the higher reaction efficiency observed for Assay #1 compared to Assay #2. This is typical from LAMP primers which tend to self-interact because of high Mg2+ ion concentrations and Bst DNA polymerase ability to extend from 3′ mismatches. To minimize the likelihood of self-hybridization, the LAMP assays were tested with increasing reaction temperatures. The reactions were also performed with a reaction buffer supplemented with DMSO (2% final concentration) to optimize the assays. DMSO is since long known to improve the DNA amplification reaction and reaction specificity by decreasing inter- and intrastrand annealing, which destabilize secondary structure formation.12,13 Assays were run against S. lacrymans gDNA (10 pg) along with NTC blanks, and both time to positivity thresholds (Figure 2A) and false-positive (positive NTC rates; Figure 2B) were graphed.13,14 Based on the observed time to positivity, DMSO addition (2%) did not inhibit Assay #1 reaction at 65 and 67 °C but displayed significant inhibition at 69 °C (5% DMSO being strongly inhibiting in all cases, data not displayed on graphs). Still, the addition of 2% DMSO reduced greatly self-amplification (reducing rates from ∼50 to ∼25%), just like working at 67 °C (reducing rates to below 20% and <10% when combined with 2% DMSO). For Assay #2, increasing the temperature did not reduce self-amplification. Nevertheless, the addition of 2% DMSO strongly inhibited self-amplification for this assay, bringing the rates from ∼16% to below 3% when performed at 65 °C (Figure 2B).
Figure 2.

LAMP assays optimization. (A) Time to positivity of LAMP reactions with the indicated adjustment (either isothermal temperature or addition of 2% DMSO) all done using 1 ng purified gDNA from cultured S. lacrymans to monitor reaction efficiencies. Data are means ± SD. (B) False positive statistics for the same reaction conditions based on NTC providing Ct-value <30, within 30 min of amplification. The fractions above each bar indicate the number of the false positive/NTC reaction.
rRNA ITS2 LAMP Assay Is Capable of Detecting S. lacrymans in Field Samples
To examine the specificity of the Assay #2 LAMP reaction, DNA isolated from field samples was characterized as being either predominantly composed or partially composed of S. lacrymans, as well as with negative samples from which major fungi were identified by ITS2 sequencing (Figure 3). The use of Assay #2 in real-time monitored reactions to obtain Ct values both without (Figure 3A) and with 2% DMSO (Figure 3B) showed that S. lacrymans field samples were detected with Ct values very similar to those of pure culture gDNA in both conditions. Field samples containing, but not exclusively composed of S. lacrymans, were also positive within <21 min. Still, negative samples (5/26) showed amplification prior to the completion of the 30 min assay without DMSO, whereas all were negative in the presence of DMSO. This suggests that these false positives were likely the result of LAMP primer self-amplification and not nonspecific amplification (Figure 2).
Figure 3.

LAMP assays optimization using purified gDNA Time to positivity of LAMP reactions performed with 100 pg of purified gDNA of either pure S. lacrymans, S. lacrymans field sample (either predominantly or partially composed of S. lacrymans; based on ITS2 amplicon sequencing), or negative samples (labeled as Other). Assays were performed at 65 °C (A) without DMSO or (B) with 2% DMSO. Each data indicates an individual sample (n = 4, 10, 2, and 26, respectively, for each category). If no amplification was observed, a value of 30 was plotted. For the amplified samples, the rDNA ITS2-derived taxonomical classification alignment results are indicated next to the plotted values.
rRNA ITS2 Colorimetric LAMP Assay Is Capable of Detecting S. lacrymans in Unprocessed Field Samples
With the goal of generating a LAMP assay capable of detecting S. lacrymans directly in field samples, which are much more complex and contaminated, not only with other sources of DNA (e.g., bacterial, wood, and other species of fungi) but also potential enzyme inhibitors, the assay was converted into a colorimetric assay to avoid the need of fluorescence detection, which requires lab equipment. First, the optimized Assay #2 was tested using pH-based visual colorimetric detection using purified gDNA from S. lacrymans (Figure 4A). The optimized assay worked and quickly depicted (within 20 min) the presence of S. lacrymans gDNA. Moreover, the 2% DMSO-containing assay resulted in faster detection than the initial assay lacking DMSO, as it achieved already visually acidified pH within 20–25 min instead of 30 min (Figure 4A–B).
Figure 4.

Colorimetric LAMP assays performance using purified DNA. (A) Pictures of reaction tubes showing the amplification over time monitored by pH changes in the tube. (B) Evolution of the colorimetric signal at different time points. (C) Colorimetric reaction monitoring (in terms of % of sample changing color at a given time point) for the indicated DNA amount (in pg).
To validate that the colorimetric version of the optimized assay was still as specific as the fluorescence-based assay, the field sample gDNA used in Figure 3C was also tested in the colorimetric assay (Figure 4C). As indicated on the histogram displaying sample positivity over time, the assay quickly amplified S. lacrymans samples (within 20 min) with starting material as low as 10–100 pg of DNA, whereas it remained negative for all negative samples tested.
To further evaluate the performance of the assay facing unpurified DNA, 9 different field samples ranging from wet mycelium to decayed wood clumps and dry samples (all already known to be positive for S. lacrymans) were used for quick (30 s) hand-held extraction using light physical techniques. These extraction-free homogenization methods employed either CLS-Y buffer (Yeast and Fungi lysis buffer, from MP BIO), which is a cell lysis solution used for the isolation of genomic DNA from yeast, algae, and fungi, or simple Tris–EDTA (TE) buffer. For adequate comparison, all samples were weighted, and for each mg of material, 15 μL of buffer was added prior to homogenization using either (i) a battery-powered pellet mixer, (ii) tubes with a single 1″ceramic bead, (iii) MP BIO tubes (which contain a garnet matrix and a single one-fourth″ ceramic sphere), as well as (iv) simple tubes with six 6 mm stainless steel beads (see Methods for details). Following 30 s of vertical hand shaking or pellet mixing in buffer, samples were left to decant, and the supernatant was evaluated for fungi gDNA by RT-qPCR. As indicated in Figure 5A, all methods resulted in the presence of fungi DNA in the buffer after manual homogenization without notable difference between CLS-Y and TE buffers. Without consideration for the sample DNA concentrations, supernatants from each sample processed with each of the 4 methods were transferred in a clean tube for dilutions with water (serial from 100 to 10,000 folds) to see how sensitive the assay was (assuming a sample of ∼15 mg of material, the 10,000-folds represent a dilution in a total of ∼2 L of water). Figure 5C–F illustrates the colorimetric assay results with these 4 methods.
Figure 5.

Extraction-free colorimetric LAMP detection of S. lacrymans. (A) DNA-release yield of hand-held extraction of 9 different field samples (all positive for S. lacrymans from qPCR data) in CLS-Y and TE buffer determined by universal fungi DNA RT-qPCR along a standard curve of S. lacrymans purified gDNA tested. Data are mean ± SEM with individual data shown as dots. (B) Standard curve and qPCR amplification plot of the different quantities of gDNA used for the histogram shown in panel A. (C) Colorimetric assay performance at detecting S. lacrymans gDNA in the decanted supernatant of the 4 different hand-held extraction methods in either CLS-Y or TE buffer according to the dilution performed in pure water for the pellet mixer, (D) single bead-containing disruption tubes, (E) MP BIO extraction tubes, and (F) stainless steel beads (6 mm). Data are the percentage of positive samples at the indicated dilution, and the number in the bars is the plotted percentages.
For the 4 methods used, samples homogenized in CLS-Y buffer were those with the lowest positivity rates compared to those obtained with TE buffer. Neither buffer resulted in significant inhibition of the LAMP assay when tested alone (data not shown). This may be indicative of a higher extraction rate for reaction inhibitors from field samples, as denoted by the higher rate of positivity with this buffer in diluted samples, the 1/1000 dilution compared to the 1/100 for the early time point (15 min) from the single bead extraction method. Both pellet-mixer and stainless bead extraction methods yielded the highest positivity rates (8/9 overall positive samples), but the stainless bead homogenization method resulted in higher positivity rates at the highest dilutions. The sole sample not being amplified by the assay was not amplified under any of the conditions tested. This sample was particularly humid, which may have contributed to decay during storage and underestimation of material weight during sample preparation. For these reasons, the method selected was the use of TE buffer with stainless steel beads. In TE buffer, this homogenization method coupled with LAMP yielded 89% (8/9) positive rate within 20 min with a minimum of 1 pg fungal DNA (or 0.1 pg of S. lacrymans DNA), whereas in CLS-Y buffer, only 78% (7/9) were amplified.
LAMP Detects S. lacrymans with Comparable Sensitivity as qPCR
To examine the degree of sensitivity of (i) the colorimetric LAMP assay, as opposed to (ii) standard qPCR detection and (iii) the same LAMP assay using intercalating dye detected by fluorescence detection (in a qPCR thermocycler), different input DNA was tested alongside. Isolated DNA from pure S. lacrymans culture was used as standards for each method (curve and solid data point on Figure 6), along with either DNA isolated from five distinct field samples predominantly consisting of S. lacrymans. A part of each of these samples was also processed with the extraction-free stainless steel beads method with TE buffer for colorimetric LAMP-based detection. Quantitative PCR (qPCR) was used to determine both fungal DNA and S. lacrymans DNA concentrations (like in Figure 5B) in the homogenate supernatants to calculate the input DNA (in ng). Interestingly, all methods could detect up to the femtogram range. At first glance, the colorimetric method seemed slightly more sensitive (Figure 6), as it provided a positive response in fewer minutes than the fluorescence-based method. This difference is likely only attributable to the fact that colorimetric detection is visual, whereas the fluorescence readout instead relied on time to threshold determination (like in a standard qPCR procedure in a real-time thermocycling unit).
Figure 6.

Sensitivity comparison between detection methods. Ct values (for qPCR) or minute to positivity (for LAMP reaction) for the different input DNA. Input DNA is based on NanoDrop spectrometric determination for purified samples and from a qPCR against rDNA along a standard curve of purified S. lacrymans DNA (see Figure 5B) for the unpurified field samples. Lines are semilog curve fit on purified S. lacrymans for each method. Data are mean ± SEM of n = 3 for pure S. lacrymans and from n = 7 different field samples predominantly composed of S. lacrymans.
Based on these results, the colorimetric method using stainless beads and TE buffer was used on several field samples known to be negative for S. lacrymans (based on qPCR detection) and having identification obtained from 18S DNA regions rRNA amplicon sequencing, as shown in Table 2. From all 20 samples tested, none were positive.
Table 2. Field Samples Analyzed with Colorimetric LAMP.
| fungus ID | positivity |
|---|---|
| Serpula pulverulenta | 0/5 |
| Fibrosporia vaillantii | 0/1 |
| Fibrosporia gossypium | 0/1 |
| Penicillium bialowiezense | 0/2 |
| Penicillium miczynskii | 0/1 |
| Tapinella panuoides | 0/1 |
| Aspergilus vitricola | 0/1 |
| Tramates versicolor | 0/1 |
| Gloeophyllum trabeum | 0/1 |
| Polyporales sp | 0/1 |
| Xylodon sp | 0/1 |
| Microthecium sp | 0/1 |
| Mortierella sp | 0/1 |
| Coniophora puteana | 0/2 |
Discussion
When compared to regular molecular amplification techniques, LAMP has a lot to offer in terms of sensitivity, rapidity, specificity, and most importantly, technical simplicity.13 Whenever a given molecular species, which can be either DNA- or RNA-based thanks to LAMP procedures coupled with reverse transcription, is being developed, examples of LAMP-assay development can replace, and in some cases outmatch, standard PCR or qPCR-based assays (Figure 7). Such LAMP assays are extremely useful when it comes to early detection that may translate into faster action or a better chance of circumventing a given process, particularly in setups without direct access to a rapid and automated laboratory, such as most hospitals, for example. This can include nonmedical field applications such as crop fields for mildew detection, rooftop cooling towers for pathogen accumulation, forests for infected trees, and food processing factories for foodborne pathogens, to state some examples. Herein, we documented the first, to our knowledge, development of an LAMP assay specifically designed to detect S. lacrymans among fungi. Thanks to a substantial collection of well-characterized field samples, we were able to focus on samples collected in the same environment as the specimens for which this assay is intended. Relying solely on purified fungi would have introduced artificial conditions, and the strains would not have as closely resembled those found in collected field samples.
Figure 7.
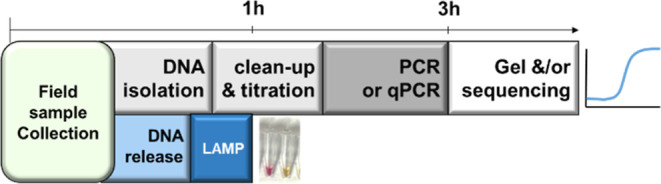
qPCR- and LAMP-based workflows. Graphical representation of the steps from sample to results of both types of assays. Transport from field to laboratory is not indicated but is mandatory for qPCR but not for LAMP.
Detection of S. lacrymans is mostly performed in buildings following observation of fungal contamination since dry rot fungi can be devastating for buildings, especially if the extent of the contaminated surface requires treatments that are more expensive than the value of the building itself. Under favorable conditions, dry rot fungi can grow rapidly at a rate of approximately 4 to 80 mm per day.15 Additionally, this fungus can remain dormant for up to 10 years, and its spores can have a lifespan of up to 20 years.16 Possible building treatments include bagging, which involves heating the contaminated space to 50 °C for 16 h and fungicidal treatment. To treat contaminated buildings, dry rot fungus must thus be identified quickly before it leads to the decomposition of materials.
Since S. lacrymans is difficult to identify by its appearance, as it can take on various forms, it is frequent that some homeowners wait for it to evolve before acting and asking for expertise, leaving more time for spreading and therefore impacting structure condition. Upon being noticed and sampled, often by a specialist, the fungus sample is transported from the site to a laboratory for processing, and then the results are communicated to the property owners often within a few weeks. Additionally, in some cases, some sample contaminants may hinder the PCR, leading to additional delays. This often results in lesser screened samples, as such a process comes with significant expenses. Therefore, having a sensitive assay that can be conducted on-site is likely to guarantee a more efficient and straightforward elimination process, minimizing the need for large-scale chemical treatments and thus less adverse environmental impacts. Therefore, not only would it help prevent further damage, but it would also facilitate timely insurance claims for damage repairs, potentially leading to better coverage and less financial strain on property owners.
When compared to PCRs, the most recurrent limitation of the LAMP assay is the nonspecific self-amplification. Thanks to proper primer design, but most importantly, enhancing agents, it is possible to minimize this aspect without compromising the assay efficacy.14 Here, in the context of assay optimization, increased running temperature was not effective, whereas the addition of DMSO (significantly reduced the nonspecific amplification when the LAMP reaction was performed at 65 °C; Figure 2). Just like commonly used PCR enhancers such as betaine or formamide, DMSO acts by reducing the possibility of secondary structure formation in DNA, which is mostly driven by high G-C content DNA stretches, therefore preventing self-hybridization/priming. As it negatively affects DNA hybridization, it is not surprising that adding DMSO tended to reduce amplification efficacy, particularly when the temperature was increased (Figure 2A). Thanks to already optimized LAMP enzymes and reaction buffers, where MgSO4 and other components are already balanced for optimized reaction speed, LAMP reactions are reliable and efficient. Some mixes, like the colorimetric one used here, even contain UDG, which degrades uracil-containing-DNA at ambient temperature (thus from synthesis in the presence of dUTP used in LAMP and PCR), characteristic of contaminating amplified products that can carry over on lab material, while being inactivated upon heating. Such additives are ideal to maintain the accuracy and reliability of LAMP assays, especially in high-throughput or diagnostic settings.
With regard to specificity (negative when truly negative) and sensitivity (positive when truly positive) of the developed LAMP assay, our data suggest a specificity of 100% (Table 2) and a sensitivity of 88–100% (Figure 5F). These data are comparable to reported values in the literature. They are indeed close to those obtained with a fluorescence-based LAMP for Fusarium oxysporum in banana field soils (92–100%, with similar sensitivity to established qPCR) or a colorimetric LAMP against Citrus Bacterial Canker-causing Xanthomonas specie (1 pg sensitivity by visual determination) with 100% sensitivity in field samples.17,18 Among other comparable assays described are a Candidatus Liberibacter asiaticus-detecting LAMP in combination with lateral flow dipstick (10 pg sensitivity with purified gDNA) or a phytosanitary LAMP assay for the detection of Xanthomonas gardneri (which is in the low picogram range).19,20 Interestingly, a field deployable LAMP assay developed to detect Dickeya dianthicola in artificially infected potatoes used a similar sample preparation as in this study.21 Although they did not conduct specificity and sensitivity calculations apart from serial dilutions of purified gDNA (limit identified at 1 pg), their method was 100% consistent with qPCR data, just like ours.
In our case, comparing the sensitivity of the current optimized LAMP assay compared to qPCR, the use of fluorescence to establish the signal suggests that both methods are just as sensitive against purified DNA samples from the nanogram down to the femto-range (Figure 6). In the low femtogram range, qPCR sensitivity is exceeding LAMP without sample preparation. Still, the sensitivity of LAMP is largely sufficient since mycelium samples provide ample material for amplification, as denoted by the capacity of amplifying from largely diluted samples (Figure 5). The sensitivity obtained with this current colorimetric assay is in the same range as some already developed for the qPCR of another strain of Serpula; Serpula himantioides, whose sensitivity level of 160 copies/μL (using a plasmid) was reported using the real-time PCR assay.22 This is hard to compare to data in weight-based units since the number of rDNA copies is variable across eucaryotes.23 Assuming a median number of 82 copies (14–1442 copies) per genome in fungi and a genome of 42.7 Mbs for S. lacrymans, this would translate to ∼1 –10 pg DNA/copies (0.3–300 pg/copies based on the distribution between 14 – 1442 copies across fungi), therefore making the assay just as sensible as qPCR, like our data are supporting in Figure 6.24
Although quantitative PCR is often used for detecting fungi and other organisms due to its ability to provide a rapid positive result without gel analysis, its quantitative features are frequently overlooked in cases where species confirmation, such as identifying S. lacrymans, is the primary goal. In these instances, a quantitative response is generally unnecessary as field samples typically consist of mycelium collected directly from surfaces. Such LAMP assays represent a valuable type of assay by being instrument-free, particularly with the possibility of using along with hand-held extraction-free procedures like we performed. To further optimize the developed assay into a field convenient one, although the current protocol is executable with very little, if any, lab equipment, developing a lyophilizable LAMP assay with reagents already in the test tube for rapid preparation and heating in a simple, portable, and self-powered heat block would be further enhanced it is field deployable and makes decision time much shorter when facing contamination.25
Acknowledgments
Mycelium field specimens were kindly provided by Air-Diagnostic Inc.
Glossary
Abbreviations
- BIP
Backward Inner Primer
- Ct
cycle threshold
- FIP
Forward Inner Primer
- ITS
internal transcribed spacer
- LAMP
loop-mediated isothermal amplification
- NTC
no template control
- qPCR
quantitative PCR
- rDNA
rDNA
- TE
Tris–EDTA
Supporting Information Available
The Supporting Information is available free of charge at https://pubs.acs.org/doi/10.1021/acsomega.4c05509.
ITS amplicon sequences and alignments for the field samples used in this study (PDF)
Author Contributions
All authors have given approval to the final version of the manuscript.
This work was supported by the Ministère de l’Éducation du Québec (Programme d’Aide à la Recherche et au Transfert (PART) - Volet innovation technologique; PART-IT; Grant # 11736) to F.C. and Y.B.
The authors declare no competing financial interest.
Supplementary Material
References
- Palfreyman J. W.; White N. A.; Buultjens T.; Glancy H. The impact of current research on the treatment of infestations by the dry rot fungus Serpula lacrymans. Int. Biodeterior. Biodegrad. 1995, 35 (4), 369–395. 10.1016/0964-8305(95)00064-3. [DOI] [Google Scholar]
- Watkinson S.; Eastwood D. Serpula lacrymans, wood and buildings. Adv. Appl. Microbiol. 2012, 78, 121–149. 10.1016/B978-0-12-394805-2.00005-1. [DOI] [PubMed] [Google Scholar]
- Schmidt O. Indoor wood-decay basidiomycetes: damage, causal fungi, physiology, identification and characterization, prevention and control. Mycol. Prog. 2007, 6 (4), 261–279. 10.1007/s11557-007-0534-0. [DOI] [Google Scholar]
- a Bryant D. H.; Rogers P. Allergic alveolitis due to wood-rot fungi. Allergy Asthma Proc. 1991, 12, 89. 10.2500/108854191779011855. [DOI] [PubMed] [Google Scholar]; b Forkel S.; Beutner C.; Schröder S. S.; Bader O.; Gupta S.; Fuchs T.; Schön M. P.; Geier J.; Buhl T. Sensitization against fungi in patients with airway allergies over 20 years in Germany. Int. Arch. Allergy Appl. Immunol. 2021, 182 (6), 515–523. 10.1159/000512230. [DOI] [PMC free article] [PubMed] [Google Scholar]
- Schmidt O. Molecular methods for the characterization and identification of the dry rot fungus Serpula lacrymans. Holzforschung 2000, 54 (3), 221–228. 10.1515/HF.2000.038. [DOI] [Google Scholar]
- Horisawa S.; Sakuma Y.; Doi S. Qualitative and quantitative PCR methods using species-specific primer for detection and identification of wood rot fungi. J. Wood Sci. 2009, 55, 133–138. 10.1007/s10086-008-1011-3. [DOI] [Google Scholar]
- Schmidt O.; Gaiser O.; Dujesiefken D. Molecular identification of decay fungi in the wood of urban trees. Eur. J. For. Res. 2012, 131, 885–891. 10.1007/s10342-011-0562-9. [DOI] [Google Scholar]
- Mori Y.; Kanda H.; Notomi T. Loop-mediated isothermal amplification (LAMP): recent progress in research and development. J. Infect. Chemother. 2013, 19 (3), 404–411. 10.1007/s10156-013-0590-0. [DOI] [PMC free article] [PubMed] [Google Scholar]
- Dhama K.; Karthik K.; Chakrabort S.; Tiwari R.; Kapoor S.; Kumar A.; Thomas P. Loop-mediated isothermal amplification of DNA (LAMP): a new diagnostic tool lights the world of diagnosis of animal and human pathogens: a review. Pak. J. Biol. Sci. 2014, 17 (2), 151–166. 10.3923/pjbs.2014.151.166. [DOI] [PubMed] [Google Scholar]
- White T. J.; Bruns T.; Lee S.; Taylor J. Amplification and direct sequencing of fungal ribosomal RNA genes for phylogenetics. PCR Protoc.: Guide Methods Appl. 1990, 18 (1), 315–322. 10.1016/B978-0-12-372180-8.50042-1. [DOI] [Google Scholar]
- Wang Q.; Garrity G. M.; Tiedje J. M.; Cole J. R. Naive Bayesian classifier for rapid assignment of rRNA sequences into the new bacterial taxonomy. Appl. Environ. Microbiol. 2007, 73 (16), 5261–5267. 10.1128/AEM.00062-07. [DOI] [PMC free article] [PubMed] [Google Scholar]
- Winship P. R. An improved method for directly sequencing PCR-amplified material using dimethyl sulphoxide. Nucleic Acids Res. 1989, 17 (3), 1266. 10.1093/nar/17.3.1266. [DOI] [PMC free article] [PubMed] [Google Scholar]
- Kim S.-H.; Lee S.-Y.; Kim U.; Oh S.-W. Diverse methods of reducing and confirming false-positive results of loop-mediated isothermal amplification assays: A review. Anal. Chim. Acta 2023, 1280, 341693. 10.1016/j.aca.2023.341693. [DOI] [PubMed] [Google Scholar]
- Wang D.-G.; Brewster J. D.; Paul M.; Tomasula P. M. Two methods for increased specificity and sensitivity in loop-mediated isothermal amplification. Molecules 2015, 20 (4), 6048–6059. 10.3390/molecules20046048. [DOI] [PMC free article] [PubMed] [Google Scholar]
- Bravery A.; Grant C. Studies on the growth of Serpula lacrymans (Schumacher ex Fr.) Gray. Mater. Org. 1985, 20 (3), 171–191. [Google Scholar]
- Schmidt O.Wood and Tree Fungi; Springer, 2006. [Google Scholar]
- Zhang X.; Zhang H.; Pu J.; Qi Y.; Yu Q.; Xie Y.; Peng J. Development of a real-time fluorescence loop-mediated isothermal amplification assay for rapid and quantitative detection of Fusarium oxysporum f. sp. cubense tropical race 4 in soil. PLoS One 2013, 8 (12), e82841 10.1371/journal.pone.0082841. [DOI] [PMC free article] [PubMed] [Google Scholar]
- Rigano L. A.; Marano M. R.; Castagnaro A. P.; Do Amaral A. M.; Vojnov A. A. Rapid and sensitive detection of citrus bacterial canker by loop-mediated isothermal amplification combined with simple visual evaluation methods. BMC Microbiol. 2010, 10, 176–178. 10.1186/1471-2180-10-176. [DOI] [PMC free article] [PubMed] [Google Scholar]
- Stehlíková D.; Beran P.; Cohen S. P.; Čurn V. Development of real-time and colorimetric loop mediated isothermal amplification assay for detection of Xanthomonas gardneri. Microorganisms 2020, 8 (9), 1301. 10.3390/microorganisms8091301. [DOI] [PMC free article] [PubMed] [Google Scholar]
- Rigano L. A.; Malamud F.; Orce I. G.; Filippone M. P.; Marano M. R.; Do Amaral A. M.; Castagnaro A. P.; Vojnov A. A. Rapid and sensitive detection of Candidatus Liberibacter asiaticus by loop mediated isothermal amplification combined with a lateral flow dipstick. BMC Microbiol. 2014, 14, 86–89. 10.1186/1471-2180-14-86. [DOI] [PMC free article] [PubMed] [Google Scholar]
- Ocenar J.; Arizala D.; Boluk G.; Dhakal U.; Gunarathne S.; Paudel S.; Dobhal S.; Arif M. Development of a robust, field-deployable loop-mediated isothermal amplification (LAMP) assay for specific detection of potato pathogen Dickeya dianthicola targeting a unique genomic region. PLoS One 2019, 14 (6), e0218868 10.1371/journal.pone.0218868. [DOI] [PMC free article] [PubMed] [Google Scholar]
- Haraguchi R.; Hirao T.; Yamada T. Detection and Quantification of Serpula himantioides in the Wood of Chamaecyparis pisifera Butt Rot Trees by Real-Time PCR. Forests 2022, 13 (9), 1429. 10.3390/f13091429. [DOI] [Google Scholar]
- a Prokopowich C. D.; Gregory T. R.; Crease T. J. The correlation between rDNA copy number and genome size in eukaryotes. Genome 2003, 46 (1), 48–50. 10.1139/g02-103. [DOI] [PubMed] [Google Scholar]; b Il’in I. V. Repeated genes in eukaryotes. Mol. Biol. 1982, 16 (2), 229–257. [PubMed] [Google Scholar]
- Lofgren L. A.; Uehling J. K.; Branco S.; Bruns T. D.; Martin F.; Kennedy P. G. Genome-based estimates of fungal rDNA copy number variation across phylogenetic scales and ecological lifestyles. Mol. Ecol. 2019, 28 (4), 721–730. 10.1111/mec.14995. [DOI] [PubMed] [Google Scholar]
- Chen H.-W.; Ching W.-M. Evaluation of the stability of lyophilized loop-mediated isothermal amplification reagents for the detection of Coxiella burnetii. Heliyon 2017, 3 (10), e00415 10.1016/j.heliyon.2017.e00415. [DOI] [PMC free article] [PubMed] [Google Scholar]; a Aoki M. N.; Prado N. O.; Lalli L. A.; Blanes L.; Zanette D. L. Lyophilization of molecular biology reactions: a review. Mini-Rev. Med. Chem. 2023, 23 (4), 480–496. 10.2174/1389557522666220802144057. [DOI] [PubMed] [Google Scholar]
Associated Data
This section collects any data citations, data availability statements, or supplementary materials included in this article.