Abstract
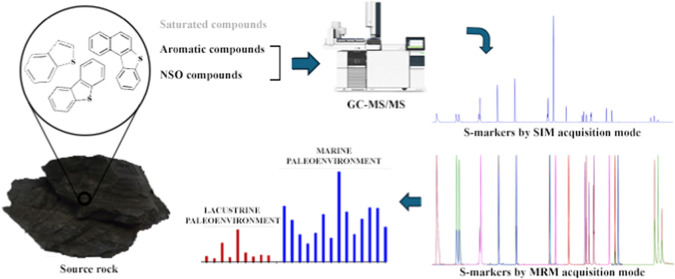
This study employed organic sulfur markers (S-markers) associated with geochemistry parameters to evaluate the paleoenvironment of different depositional settings in 24 samples collected in vertical sections of outcrops of the Candeias and Barreirinha Formations in Recôncavo and Amazon basins, respectively. A total of twenty-one S-markers from benzothiophene (BT), dibenzothiophene (DBT), and benzonaphtothiophenes (BNT) classes were optimized and quantified by gas chromatography-triple quadrupole mass spectrometry (GC–MS/MS). S-markers efficiently evaluated and differentiated the depositional paleoenvironment in the source rocks based on the individual compound, in cross-validation with saturated biomarkers, and associated with parameters such as total organic carbon (TOC) and Rock-Eval pyrolysis. Samples from the lacustrine environment presented low concentrations of BT, DBT, and BNT, and samples from the marine environment showed high BT, DBT, and BNT concentrations. The variations in ∑DBT and TOC indicated that the quantity and/or the type of organic matter exert some control over the distribution of DBTs. Although the formations are from different paleoenvironments, the organic matter input was similar, as indicated by high proportions of 1,2-BNT and 2,1-BNT relative to 2,3-BNT, thus characterizing the algal input with a microbial contribution for both sites. The sum of the BNTs was directly related to the amounts of amorphous organic matter (AOM) in the vertical distribution of outcrops. These results are in accordance with the finding that BNTs may originate from the microbial activity. The DBT/Phen vs pristane/phytane (Pr/Ph) relationship attested to differences in the redox conditions of the depositional paleoenvironments of the formations under study. The 4,6-DMDBT/2,4,6-TMDBT and 2,4,6-TMDBT/(2,4,7 + 2,4,8)-TMDBT ratios indicated immaturity for hydrocarbon generation.
1. Introduction
Sulfur is an abundant heteroatom in fossil fuels with total concentrations usually less than 4.0%. The polycyclic aromatic sulfur heterocycle (PASH) structures are the most abundant form of organic sulfur in crude oils and source rocks and include benzothiophenes (BTs), dibenzothiophenes (DBTs), benzonaphthothiophenes (BNTs), and their C1–C3 alkyl derivatives.1 In geochemistry studies, the PASHs have been used as markers (S-markers) to assess the depositional paleoenvironment, maturity degree, migration, and organic facies from crude oils and source rock extracts.1−3
S-markers provide a convenient way to correlate oils with source rocks, to assess facies, organic matter input, and depositional paleoenvironment conditions. For example, the abundance of dibenzothiophenes (e.g., DBT and methyl-DBTs) in oils from different sedimentary environments increases in the order of freshwater < saline < hypersaline facies.4 For the benzonaphthothiophenes and their isomers (C1-BNTs, C2-BNTs, and C3-BNTs), the abundances in crude oils and source rocks of terrigenous origin are lower than marine equivalents.4−7 In addition, due to their stability in high temperatures, S-markers can be ideally used to assess the state of maturity.8,9 However, the studies based on S-markers to assess paleodepositional settings are limited.2,10−12
Saturated hydrocarbons, such as n-alkanes, pristane, phytane, hopanes, and steranes, are biomarkers conventionally employed in geochemistry studies to provide information about the origin and depositional paleoenvironment of the organic matter.13 These compounds determine the relationship between crude oil and residual organic matter in source rocks all over the world. In Brazil, the oils and source rocks from the Recôncavo and Amazon basins have already been characterized in terms of their paleoenvironment using different biomarkers.14−18 However, biomarkers may be affected by biodegradation, water washing, and thermal alteration.19,20 In these cases where parameters are not sufficiently diagnostic, S-markers can provide a better application.7,21 Therefore, the combined information based on the cross-validation of saturated biomarkers and S-markers allows a more accurate evaluation of source rocks’ depositional paleoenvironments.
In the Amazon Basin, the Barreirinha Formation is known as the primary hydrocarbon source rock composed of dark gray to black shale. Data from saturated biomarkers indicate that these black shales, highly enriched in organic matter, were deposited in a marine paleoenvironment.22,23 In the Recôncavo basin, as biomarker data indicate, the Candeias Formation is recognized as a hydrocarbon source rock deposited in a lake context with good organic matter preservation.14,15,24 Considering that the two sedimentary basins were deposited in different paleoenvironments (marine and lacustrine), a detailed study based on specific S-markers using these basins as a model can be an excellent tool for paleodepositional assessment.
Determination of S-markers in crude oils is made primarily by gas chromatography coupled to mass spectrometry (GC–MS) in the selected ion monitoring (SIM) mode.1 However, it is necessary to perform previous laborious fractionation steps, and there are limitations to the identification of compounds with the same mass fragment ions. The gas chromatography coupled to triple quadrupole spectroscopy (GC–MS/MS) is able to increase the selectivity and sensitivity for S-markers because it eliminates the background interference. The GC–MS/MS has been proven to good performance in the analysis of individual S-markers in petroleum samples.25−29 However, a limited number of compounds was evaluated, and the geochemistry interpretation of results was not the aim of those studies.
This work aimed to employ S-markers in combination with geochemistry parameters to assess the depositional paleoenvironment of source rocks of different origins. A GC–MS/MS method was optimized to determine twenty-one S-markers in source rock extracts. Interpretations focused on individual and diagnostic ratios from S-markers were used, for the first time, to analyze differences and similarities between the geological formations under study and to interpret the paleoenvironment conditions of their depositional settings.
2. Geological Settings
2.1. Amazon Basin
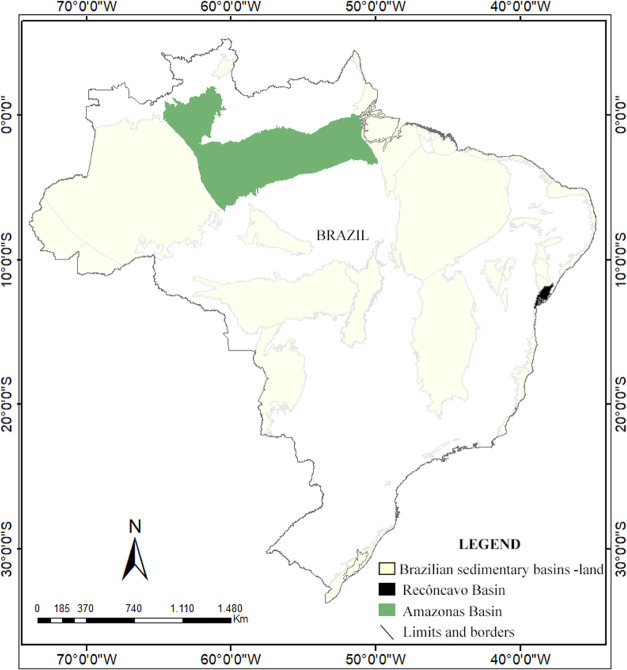
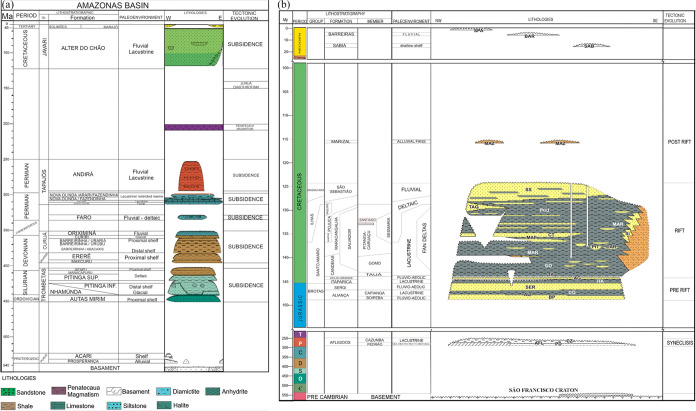
The Amazon basin is located in the northern region of Brazil (Figure 1), covering part of the states of Amazon and Pará, with an area of approximately 500,000 km2. It is classified as a Paleozoic basin of the intracratonic syneclisis type, whose sedimentation began in the Paleozoic and lasted until the Mesozoic,16,17 as seen on the stratigraphic chart of the basin (Figure 2a).
Figure 1.
Map of Brazilian terrestrial sedimentary basins highlighting the Recôncavo and Amazon basins.
Figure 2.
Stratigraphic charts: (a) Amazon basin. (b) Recôncavo basin, adapted from refs (17,34).
The deposition of the Barreirinha Formation is associated with a rapid relative sea level rise that occurred when the South American Platform underwent a major marine transgression in Frasnian.30 The initial depositional phase of this formation is represented by a thick section of radioactive black shales (dark gray, laminated, fissile, and bituminous) denoted as the abacaxis member, which is considered the primary hydrocarbon source rock in the Amazon basin. The abacaxis member is overlapped by two other members: Urubu (dark gray shales) and Uraria (gray shales and dark to light siltstones).30 Previous studies indicate that the Barreirinha Formation is the carrier of marine organic matter, with average TOC contents between 2 and 3%, mostly type II kerogen, and varying levels of thermal maturation.16,23
2.2. Recôncavo Basin
The Recôncavo basin covers approximately 11,500 km2 from Bahia state in Brazil (Figure 1) and corresponds to the southern portion of the Recôncavo-Tucano-Jatobá Rift (RTJ). The RTJ system developed in the Cretaceous can be interpreted as an aulacogen segment associated with South Atlantic Rift.31
The deposition of the Candeias Formation, recognized as source rocks in the Recôncavo basin, occurred with increased tectonic activity added to the predominance of climate humidification, generating conditions for the development of deep lakes, which marked the beginning of the rift phase in the Berriasian (Figure 2b). In this scenario, initially there was the transgression generating the dark pelite of the Tauá Member, which is overlapped by gray-green shale with carbonatic intercalation of the Gomo Member.32 Various geochemical evaluation studies in Candeias Formation have been performed, including the identification of strata with multiple amounts of total organic carbon (TOC), suggesting internal faciological changes in this geological formation.14,15,24,33
Thus, the Candeias Formation is defined as a thick section of dark-green, gray shales, with subordinate intersperses of limestone and dolomites, locally encompassing bodies of massive and/or stratified sandstones.24,34 According to Amaral et al.15 the Candeias shales (Gomo Member) are bearers of amorphous organic matter (AOM) with intense fluorescence, average total organic carbon (TOC) content of approximately 3% and kerogen type I, with a high potential for hydrocarbon generation.
3. Materials and Methods
3.1. Sampling
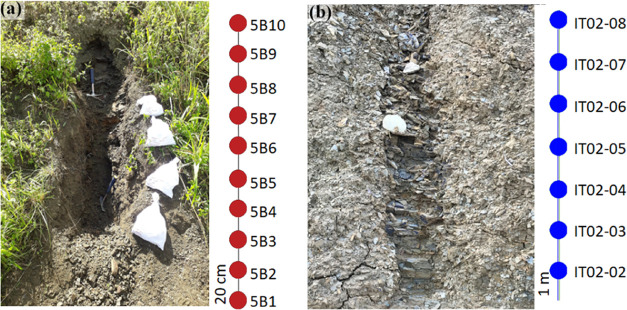
Samples in the Recôncavo basin were collected from an outcrop on the side of highway BR 324, km 557, in the municipality of Santo Amaro, Bahia, Brazil. The sampling was carried out every 20 cm for a total of 10 samples (labeled 5B1 to 5B10, Figure 3a), to investigate possible vertical variations of the geochemical parameters.
Figure 3.
Sampling points with vertical spacing in outcrops of the Candeias (a) and Barreirinha (b) formations.
Two outcrops of the Amazon basin were selected, identified as IT02 and IT06 (representative image of the IT02 outcrop in Figure 3b), and both were collected vertically with a spacing of 1 m at different points (n = 14) along the BR 230 highway in the Rurópolis municipality, Pará state, Brazil. Figure 3 shows the sampling in the Recôncavo basin (Figure 3a) and a representative outcrop of the Amazon basin (Figure 3b). The collection procedure was the same for all of the outcrops. The initial layers of altered rocks were removed, digging deep enough (between 1 and 2 m) to reach below the weathering zone to access examples of source rocks without alteration/oxidation features.
3.2. Extraction of Soluble Organic Matter
Prior to extraction, the rock samples were ground with an agate mortar and pestle, pulverized in a Retsch planetary ball mill (Retsch, PM 400, Haan, Germany) and subsequently sieved through a steel mesh sieve with an opening of 0.180 mm (80 mesh), and stored in glass recipients.
Accelerated solvent extraction (Dionex ASE 350, Thermo Scientific, Massachusetts) was employed to obtain the soluble organic matter present in rock samples.35 Initially, 50 g of sample and 10 g of diatomaceous earth, a dehumidifying agent (Celite 545, Exodo Cientfica, Brazil), were added to metal extractor cells. Thus, the system was heated at 75 °C at a pressure of 5 × 10⁶ Pa for 15 min using 150 mL of dichloromethane. The procedure was repeated three times to ensure that all soluble organic matter compounds were extracted. Then, the source rock extract was concentrated (solvent evaporated) using a rotary evaporator (R-100, Buchi, Meierseggstrasse, Switzerland).
3.3. Fractionation of Soluble Organic Matter
The extracts were fractionated by open column chromatography using silica as the stationary phase (ASTM D2007-11).36 The saturated hydrocarbon fractions were eluted with 25 mL of n-hexane, and the aromatic hydrocarbon fractions containing the S-markers were eluted with 30 mL of n-hexane:DCM (4:1, v/v) and 30 mL of DCM:methanol (4:1, v/v). All fractions were concentrated in a rotary evaporator (Model R-210 Labortechnik, AG Switzerland) and transferred to 2 mL vials.
3.4. GC–MS/MS Analyses of S-Markers
The GC–MS/MS analyses of the S-markers were performed on an Agilent 7890B gas chromatograph equipped with a split/splitless injector, a DB5MS column (5% phenylmethylpolysiloxane, 30 m × 0.25 mm internal diameter ×0.25 μm film thickness) coupled to an Agilent 7000C mass spectrometer (Santa Clara, CA). The GC operating conditions are as follows: the oven temperature was held isothermally at 100 °C for 2 min, ramped to 310 °C at 5 °C min–1, and held isothermal for 1.5 min. Helium was used as the carrier gas with a constant flow rate of 1.0 mL min–1. The MS was operated in the electron ionization (EI) mode at 70 eV, ion source at 280 °C, and injector and transfer line temperature of 300 °C.29
3.4.1. MS/MS Optimization
The MS/MS transitions for some BTs, DBTs, and BNTs were determined by Sampaio et al.29 However, in the present study, the number of compounds was twenty-one and tested the collision energy (CE) for each individual S-marker. Thus, to optimize the multiple reaction monitoring (MRM) conditions for the compounds used in this study, a full scan and product ion scan (PIS) were performed in MS/MS. Initially, the mass spectra of all individual standards were obtained in the full scan mode (m/z mass range 45–450), and the fragments with the highest abundance for each one were selected, observing their retention times. Windows were defined based on the retention times of the compounds of interest in the SIM mode. The PIS was selected using collision energy variation from 5 to 60 eV (5, 10, 20, 30, 40, 50, and 60 eV). The product ions exhibiting the highest sensitivity were selected as quantification ions, whereas those exhibiting the second highest sensitivity were selected as qualification ions. Thus, two transitions were defined in the MRM mode under optimized collision energies.
For the method optimization, the following individual standards were employed at a concentration of 100 ug L–1: benzothiophene (BT), 2-methylbenzothiophene (2-MBT), 3-methylbenzothiophene (3-MBT), 2,4-dimethylbenzothiophene (2,4-DMBT), 2,6-dimethylbenzothiophene (2,6-DMBT), 2,3,4-trimethylbenzothiophene (2,3,4-TMBT), 2,5,7-trimethylbenzothiophene (2,5,7-TMBT), dibenzothiophene (DBT), dibenzothiophene-d8 (DBT-d8), phenanthrene (Phen), 4-methyldibenzothiophene (4-MDBT), 1-methyldibenzothiophene (1-MDBT), 2,8-dimethyldibenzothiophene (2,8-DMDBT), 4,6-dimethyldibenzothiophene (4,6-DMDBT), 2,4-dimethyldibenzothiophene (2,4-DMDBT), 1,4-dimethyldibenzothiophene (1,4-DMDBT), 3,6/2,6-dimethyldibenzothiophene (3,6/2,6-DMDBT), 2,4,7-trimethyldibenzothiophene (2,4,7-TMDBT), 4,6-diethyldibenzothiophene (4,6-DEDBT), benzo[b]naphto[1,2-d]thiophene (BNT- 1,2), benzo[b]naphtho[2,1-d]thiophene (BNT-2,1), and benzo[b]naphtho[2,3-d]thiophene (BNT-2,3).
For BT, DBT-d8, 3-MBT, 2,4-DMBT, 2,3,4-TMBT, DBT, Phen, 4-MDBT, 1-MDBT, 4,6-DMDBT, 2,4-DMDBT, 1,4-DMDBT, 2,4,7-TMDBT, 4,6-DEDBT and BNT-1,2 the same MRM transitions defined by Sampaio et al.29 were employed. For 2-MBT, 2,6-DMBT, 2,5,7-TMBT, 2,8-DMDBT, 3,6/2,6-DMDBT, BNT-2,1 and BNT-2,3, the MS/MS conditions were optimized and definite.
3.5. Total Organic Carbon, Total Sulfur, and Rock-Eval Pyrolysis
The TOC content was determined from 1.0 g of each sample (80 mesh) subjected to acid digestion (HCl, 37%) to carbonate removal and measured using a LECO 628CN Elementary Analyzer. Total sulfur contents were performed on the LECO 628S Elementary Analyzer. Rock-Eval analysis was performed using a Rock-Eval 6 instrument according to the procedure proposed by Behar et al.37 The parameters included 100 mg of each sample (0.177 mm) added to a tin device. Analyses were previously performed by Amaral et al. and Góes et al.15,23
3.6. Biomarkers Analysis
Saturated biomarkers were previously analyzed in a gas chromatograph coupled to a mass spectrometer (GC/MS-DSM5977A, Agilent) using a DB-5MS capillary column (60 m × 0.25 mm × 0.25 μm). Helium was used as the carrier gas at a flow of 1 mL min–1. The samples were diluted in hexane at 0.05 mg for each 1 mL of solvent. The injection volume was 1 μL in the splitless mode. The oven temperature program was from 60 to 310 °C with a heating rate of 2 °C min–1. The following ions were monitored in MS: m/z 217 (steranes), m/z 191 (terpanes), and m/z 259 (tetracyclic polyprenoids and diasteranes).15,23
3.7. Palynofacies
The palynofacies analysis was carried out qualitatively and quantitatively15,23 by counting 300 organic components (amorphous organic matter, phytoclasts, and palynomorphs) on each slide using a Zeiss Axio Imager A2m microscope, equipped with a white (halogen) light source (from a 12 V/100 W halogen lamp with stabilized current) and a UV light (fluorescence) source (from a high-pressure 100 W mercury lamp with stabilized current). Counting was performed under 20 times magnification following the procedure proposed by Tyson.60 Qualitatively, organic matter was evaluated for the degree of preservation, appearance, color, presence, and intensity of fluorescence under excitation with UV/blue-violet light.
4. Results and Discussion
4.1. Identification and Quantification of S-Markers by GC–MS/MS
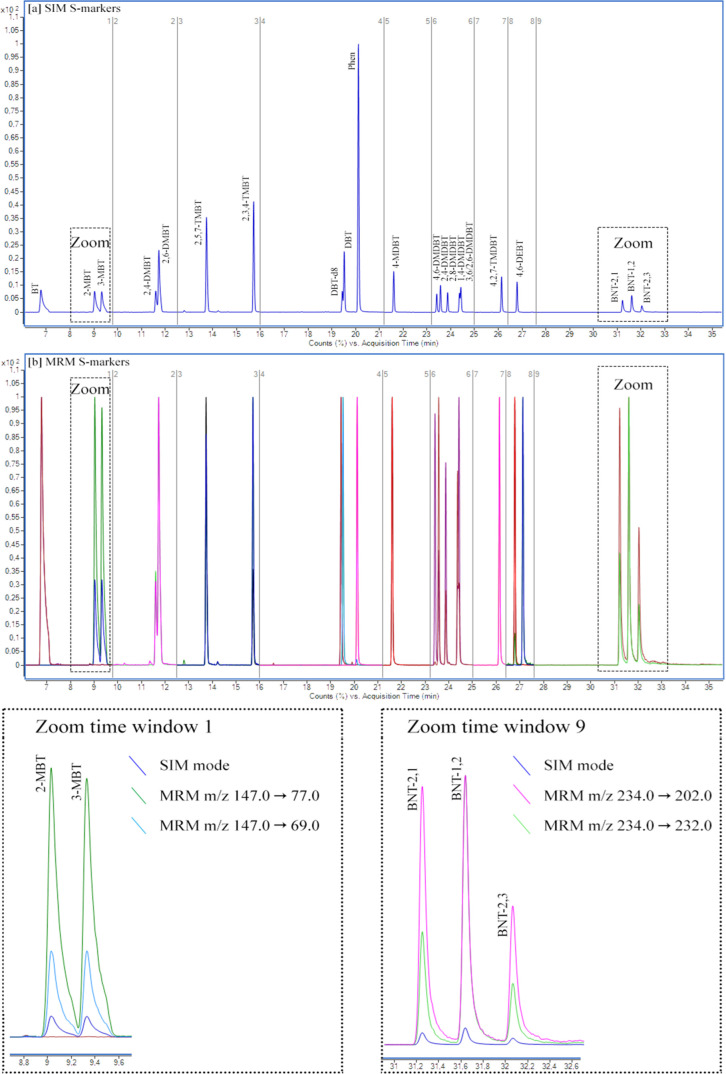
The critical parameters for the identification and quantification of compounds in the GC–MS/MS method include the choice of the precursor ion and the product ion for each MRM transition with specific collision energy (CE). The more intense ion in the mass spectrum was chosen as the precursor ion, and the two fragment ions with the highest response were selected as the product ion. For example, m/z 147 → 77 and 147 → 69 were used for MBTs (Sampaio et al.,29) and substantially reduced the baseline level with the signal-to-noise ratio increased approximately 10 times when compared to GC–MS (m/z 147) (Figure 4).
Figure 4.
Chromatograms of S-markers in (a) SIM mode and (b) MRM mode. Different colors in (b) and (c) refer to individual MRM transitions.
The optimized GC–MS/MS conditions for the analysis of 21 standards of S-markers are summarized in Table 1, including the retention times (Rt), window widths, quantification and confirmation transitions, and collision energies (CE).
Table 1. Summary of Optimized MRM Transitions Used for Quantifying S-Marker Compounds.
| window | Rt | quantification
transition |
confirmation
transition |
|||||
|---|---|---|---|---|---|---|---|---|
| S-markers | (±Rt min) | (min) | precursor ion (m/z) | product ion (m/z) | CEb (eV) | precursor ion (m/z) | product ion (m/z) | CEb (eV) |
| BT | 4.00–10.00 | 6.77 | 134 | 89 | 20 | 134 | 69 | 20 |
| 2-MBTa | 4.00–10.00 | 9.03 | 147 | 77 | 30 | 147 | 69 | 30 |
| 3-MBT | 4.00–10.00 | 9.32 | 147 | 77 | 40 | 147 | 69 | 30 |
| 2,4-DMBT | 10.00–12.00 | 11.60 | 162 | 161 | 20 | 162 | 128 | 40 |
| 2,6-DMBTa | 10.00–12.00 | 11.73 | 162 | 161 | 20 | 162 | 147 | 30 |
| 2,5,7-TMBTa | 12.00–17.00 | 13.73 | 176 | 161 | 20 | 176 | 128 | 40 |
| 2,3,4-TMBT | 12.00–17.00 | 15.71 | 176 | 161 | 20 | 176 | 175 | 40 |
| DBT-d8 | 17.00–21.00 | 19.44 | 192 | 146 | 30 | 192 | 160 | 40 |
| DBT | 17.00–21.00 | 19.52 | 184 | 139 | 30 | 184 | 152 | 20 |
| Phen | 17.00–21.00 | 20.12 | 178 | 176 | 30 | 178 | 152 | 40 |
| 4-MDBT | 21.00–23.00 | 21.60 | 198 | 197 | 30 | 198 | 165 | 30 |
| 4,6-DMDBT | 23.00–25.00 | 23.41 | 212 | 197 | 20 | 212 | 211 | 40 |
| 2,4-DMDBT | 23.00–25.00 | 23.57 | 212 | 211 | 20 | 212 | 197 | 40 |
| 2,8-DMDBTa | 23.00–25.00 | 23.87 | 212 | 197 | 40 | 212 | 211 | 50 |
| 1,4-DMDBT | 23.00–25.00 | 24.37 | 212 | 211 | 20 | 212 | 197 | 40 |
| 3,6/2,6-DMDBTa | 23.00–25.00 | 24.48 | 212 | 197 | 30 | 212 | 211 | 30 |
| 2,4,7-TMDBT | 25.00–30.00 | 26.13 | 226 | 211 | 20 | 226 | 225 | 40 |
| 4,6-DEDBT | 25.00–30.00 | 26.79 | 240 | 210 | 20 | 240 | 225 | 40 |
| BNT-2,1a | 30.00–45.50 | 31.22 | 234 | 202 | 30 | 234 | 189 | 40 |
| BNT-1,2 | 30.00–45.50 | 31.61 | 234 | 202 | 40 | 234 | 189 | 30 |
| BNT-2,3a | 30.00–45.50 | 32.04 | 234 | 202 | 30 | 234 | 189 | 40 |
Compounds optimized in this study.
Collision energy.
The concentration of S-markers obtained from source rock extracts by optimized conditions of GC–MS/MS are shown in Table 2. In general, higher concentrations were found in samples from the Barreirinha Formation. The 2,6-DMBT was the compound with the lowest concentration (nd to 0.01 μg g–1 for 5B-06), while 2 + 3MDBT showed the highest concentration (1938 μg g–1 to IT06-59).
Table 2. Concentrations of Sulfur Markers Applied to This Study (μg g–1 of Extract) in Samples from the Recôncavo (5B) and Amazon Basins (IT)a.
| Recôncavo basin | ||||||||||
|---|---|---|---|---|---|---|---|---|---|---|
| S-marker | 5B-01 | 5B-02 | 5B-03 | 5B-04 | 5B-05 | 5B-06 | 5B-07 | 5B-08 | 5B-09 | 5B-10 |
| BT | 0.08 | 0.02 | 0.03 | 0.75 | 0.35 | 0.16 | 0.37 | 0.41 | 0.16 | 1.26 |
| 2-MBT | 0.04 | 0.01 | nd | 0.02 | 0.01 | 0.10 | 0.01 | 0.01 | nd | 0.02 |
| 3-MBT | 0.04 | 0.01 | 0.01 | 0.02 | 0.05 | 0.14 | 0.01 | 0.01 | nd | nd |
| 2,4-DMBT | 0.01 | nd | nd | 0.01 | 0.01 | 0.01 | 0.01 | 0.01 | nd | 0.01 |
| 2,6-DMBT | nd | nd | nd | nd | nd | 0.01 | nd | nd | nd | nd |
| 2,5,7-TMBT | 0.15 | 0.04 | 0.06 | 0.10 | 0.26 | 0.24 | 0.08 | 0.18 | 0.01 | 0.09 |
| 2,3,4-TMBT | 0.01 | nd | nd | 0.01 | 0.01 | nd | nd | nd | nd | nd |
| DBT | 0.10 | 0.08 | 0.33 | 0.20 | 0.18 | 0.24 | 0.24 | 0.25 | 0.17 | 0.23 |
| Phen | 0.64 | 0.92 | 5.83 | 0.95 | 0.82 | 1.30 | 0.57 | 0.43 | 0.28 | 0.36 |
| 1-MDBT | 0.18 | 0.15 | 0.64 | 0.23 | 0.23 | 0.37 | 0.19 | 0.17 | 0.13 | 0.26 |
| (2 + 3)-MDBT | 0.15 | 0.07 | 0.39 | 0.15 | 0.13 | 0.22 | 0.12 | 0.05 | 0.07 | 0.10 |
| 4-MDBT | 0.22 | 0.16 | 0.62 | 0.34 | 0.30 | 0.58 | 0.25 | 0.22 | 0.17 | 0.19 |
| 4,6-DMBT | 0.05 | 0.03 | 0.08 | 0.05 | 0.06 | 0.07 | 0.05 | 0.05 | 0.04 | 0.13 |
| 2,3-DMBT | 0.05 | 0.04 | 0.03 | 0.07 | 0.04 | 0.02 | 0.05 | 0.05 | 0.12 | 0.20 |
| 2,4-DMBT | 0.05 | 0.05 | 0.19 | 0.07 | 0.05 | 0.19 | 0.04 | 0.02 | 0.03 | 0.02 |
| 2,8-DMBT | 0.04 | 0.02 | 0.07 | 0.04 | 0.06 | 0.06 | 0.04 | 0.05 | 0.04 | 0.05 |
| 1,4-DMBT | 0.02 | 0.01 | 0.01 | 0.04 | 0.03 | 0.01 | 0.02 | 0.02 | 0.01 | 0.05 |
| 3,6/2,6-DMBT | 0.03 | nd | 0.04 | 0.04 | 0.03 | 0.15 | 0.06 | 0.04 | 0.02 | 0.03 |
| 2,4,6-TMDBT | 0.10 | 0.04 | 0.24 | 0.19 | 0.16 | 0.25 | 0.20 | 0.17 | 0.23 | 0.25 |
| 2,4,7-TMDBT | 0.13 | 0.06 | 0.18 | 0.19 | 0.18 | 0.17 | 0.15 | 0.14 | 0.14 | 0.23 |
| 2,4,8-TMDBT | 0.10 | 0.04 | 0.18 | 0.14 | 0.12 | 0.18 | 0.11 | 0.10 | 0.10 | 0.16 |
| 4,6-DEBT | nd | nd | nd | 0.01 | nd | nd | nd | nd | nd | nd |
| BNT-2,1 | 0.79 | 0.39 | 0.55 | 2.07 | 1.85 | 0.89 | 1.25 | 2.22 | 3.01 | 3.62 |
| BNT-1,2 | 0.02 | 0.01 | 0.02 | 0.05 | 0.05 | 0.02 | 0.03 | 0.04 | 0.02 | 0.08 |
| BNT-2,3 | 0.02 | 0.01 | 0.01 | 0.07 | 0.08 | 0.06 | 0.09 | 0.14 | 0.13 | 0.16 |
| Amazon basin | ||||||||||||||
|---|---|---|---|---|---|---|---|---|---|---|---|---|---|---|
| S-marker | IT02-02 | IT02-03 | IT02-04 | IT02-05 | IT02-06 | IT02-07 | IT02-08 | IT06-54 | IT06-55 | IT06-56 | IT06-57 | IT06-58 | IT06-59 | IT06-60 |
| BT | 7.18 | 0.39 | 5.44 | 4.44 | 3.08 | 14.20 | 5.09 | 10.90 | 11.43 | 11.83 | 11.54 | 9.43 | 15.54 | 10.46 |
| 2-MBT | 0.47 | 0.07 | 7.89 | 3.85 | 1.90 | 2.34 | 6.07 | 2.87 | 3.78 | 4.48 | 3.88 | 3.39 | 2.56 | 4.76 |
| 3-MBT | 4.23 | 0.45 | 34.94 | 11.43 | 8.89 | 17.98 | 23.43 | 41.42 | 30.55 | 20.02 | 26.94 | 29.68 | 22.19 | 26.98 |
| 2,4-DMBT | 0.40 | 0.22 | 0.91 | 1.66 | 1.81 | 8.94 | 3.04 | 0.52 | 0.69 | 0.79 | 0.46 | 0.28 | 3.50 | 0.58 |
| 2,6-DMBT | 0.27 | 0.08 | 0.79 | 0.71 | 0.53 | 0.87 | 0.71 | 0.56 | 0.59 | 0.48 | 0.56 | 0.18 | 0.71 | 0.30 |
| 2,5,7-TMBT | 46.79 | 8.12 | 198 | 205.7 | 217 | 73.73 | 49.82 | 89.22 | 89.43 | 105 | 90.69 | 41.18 | 113 | 53.33 |
| 2,3,4-TMBT | 4.37 | 0.69 | 9.50 | 9.89 | 10.04 | 14.34 | 10.53 | 25.77 | 22.56 | 21.36 | 15.96 | 5.72 | 23.19 | 13.88 |
| DBT | 306 | 60.25 | 631 | 637 | 639 | 845 | 892 | 1135 | 1061 | 700 | 759 | 369 | 1103 | 728 |
| Phen | 2133 | 168 | 2779 | 2620 | 2474 | 3147 | 2358 | 2626 | 2384 | 2293 | 2261 | 1269 | 2891 | 2398 |
| 1-MDBT | 979 | 84.95 | 1088 | 1139 | 1197 | 1680 | 1490 | 1646 | 1334 | 1248 | 1135 | 1117 | 1486 | 1291 |
| (2 + 3)-MDBT | 1022 | 89.28 | 1160 | 1200 | 1294 | 1649 | 1601 | 1938 | 1675 | 1644 | 1441 | 1245 | 1665 | 1333 |
| 4-MDBT | 867 | 80.65 | 987 | 1007 | 1100 | 1603 | 1349 | 1602 | 1441 | 1372 | 1317 | 1103 | 1220 | 1207 |
| 4,6-DMBT | 91.31 | 7.91 | 91.51 | 101 | 107 | 166 | 118 | 154 | 134 | 124 | 124 | 121 | 147 | 128 |
| 2,3-DMBT | 30.73 | 2.70 | 36.29 | 47.43 | 49.46 | 40.81 | 22.70 | 32.32 | 40.29 | 41.64 | 38.44 | 27.51 | 61.03 | 32.15 |
| 2,4-DMBT | 89.68 | 6.07 | 73.95 | 81.96 | 87.05 | 139 | 117 | 129 | 120 | 106 | 101 | 91.13 | 98.32 | 97.01 |
| 2,8-DMBT | 57.45 | 1.99 | 30.50 | 41.47 | 68.29 | 105 | 90.48 | 110 | 95.64 | 74.76 | 78.37 | 67.61 | 84.67 | 76.03 |
| 1,4-DMBT | 52.76 | 3.16 | 50.64 | 51.96 | 56.62 | 81.09 | 68.49 | 84.58 | 76.56 | 67.50 | 67.64 | 67.52 | 79.68 | 56.07 |
| 3,6/2,6-DMBT | 213 | 12.39 | 164 | 179 | 222 | 317 | 271 | 316 | 314 | 257 | 237 | 225.8 | 255 | 217 |
| 2,4,6-TMDBT | 71.55 | 4.42 | 57.34 | 59.64 | 68.78 | 105 | 19.84 | 112 | 87.86 | 74.52 | 75.93 | 77.77 | 82.04 | 85.13 |
| 2,4,7-TMDBT | 102 | 6.51 | 81.16 | 86.86 | 107 | 155 | 21.99 | 144 | 136 | 106 | 102 | 112 | 127 | 124 |
| 2,4,8-TMDBT | 106 | 6.12 | 73.82 | 87.96 | 94.36 | 153 | 39.65 | 150 | 134 | 108 | 99.65 | 96.93 | 109 | 110 |
| 4,6-DEBT | 1.50 | 0.10 | 1.24 | 1.36 | 1.63 | 2.39 | 1.97 | 2.49 | 2.25 | 1.82 | 1.74 | 1.64 | 1.71 | 1.65 |
| BNT-2,1 | 77.36 | 4.54 | 71.74 | 72.06 | 73.41 | 78.23 | 61.43 | 92.43 | 91.14 | 90.44 | 90.39 | 85.40 | 82.26 | 77.90 |
| BNT-1,2 | 44.92 | 2.44 | 38.40 | 44.43 | 47.01 | 61.96 | 45.35 | 55.72 | 53.44 | 52.71 | 49.61 | 46.63 | 48.66 | 48.20 |
| BNT-2,3 | 18.45 | 1.21 | 21.39 | 26.43 | 27.78 | 30.49 | 20.10 | 25.21 | 23.46 | 19.86 | 26.90 | 30.22 | 28.05 | 23.19 |
nd = not detected.
Throughout the literature, it is uncommon to find geochemistry studies aimed at the quantification of individual S-markers by GC–MS.38−41 The results are mainly expressed as the sum of classes10,7,12,42,43 or in area percentage values3,25,44 because of the commercial limitations and the high cost associated with acquiring the standards. However, GC–MS is not sufficiently selective for S-markers since coelutions with matrix compounds with the same m/z might interfere.1,45
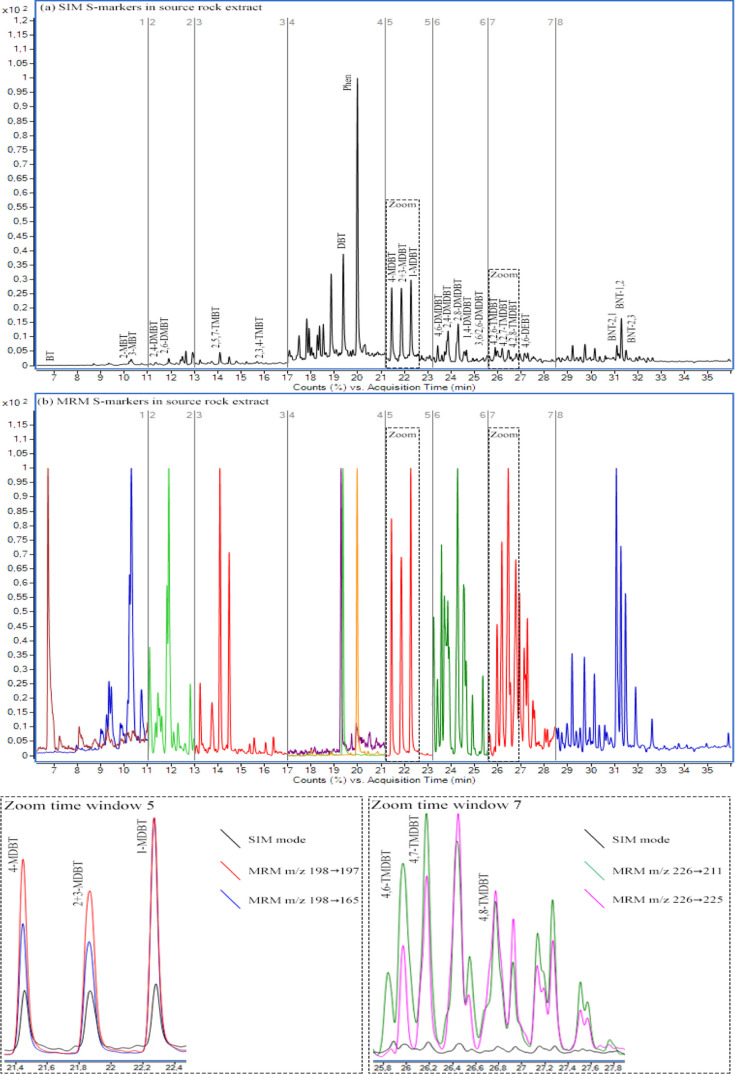
A representative chromatogram of a source rock extract sample is shown in Figure 5. The triple quadrupole analyzer is considered one of the best alternatives to analyze S-markers.1,29 It minimizes interference by improving the selectivity based on the selection of appropriate precursor and product ions (Figure 5a). In addition, a significant decrease of chemical noise in the chromatogram is obtained when compared to that in the SIM mode (Figure 5b). Thus, thanks to the improved sensitivity, performing reliable determination of S-markers at trace levels, as those required in geochemistry studies is feasible.
Figure 5.
GC–MS/MS chromatogram of S-markers in source rock extract by the (a) SIM and (b) MRM mode.
4.2. Paleoenvironment Interpretation Based on S-Markers
4.2.1. Origin of Organic Matter
The concentrations of BT, DBT, BNT, and its alkylated homologues in source rock extracts and crude oils have been employed to evaluate organic matter origin.44,46 The highest concentrations of these compounds are found in samples of marine origin compared to those of continental origin.12,47
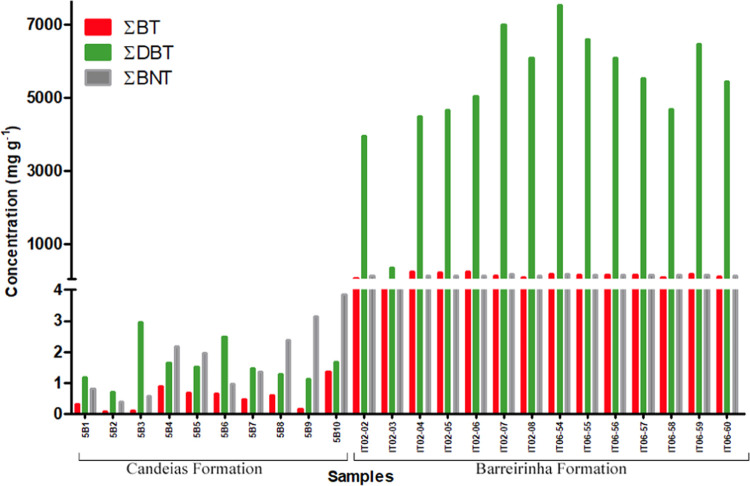
The concentrations of individual S-markers in samples from the Recôncavo and Amazon basins were different (Table 2 and Figure 6). High concentrations of BT, DBT, and BNT, consistent with a marine paleoenvironment, were observed in the Barreirinha Formation. In contrast, low concentrations of these compounds were found in the Candeias Formation, which are typical of a continental freshwater paleoenvironment.
Figure 6.
Histogram of the concentrations of benzothiophenes (∑BT), dibenzothiophenes (∑DBT), and benzonaphthothiophenes (∑BNT) in the samples.
The differentiation of sedimentary paleoenvironments obtained by S-markers was confirmed by biomarkers, such as hopane/sterane (HOP/STE) (Figures S1–S4) and polyprenoids and diasteranes (TPP/TPP + DIA) ratios (Table S1). The palynofacies based on the relative proportions between amorphous organic matter (AOM), palynomorphs, and phytoclasts (Table S1) also confirmed the S-markers data. HOP/STE ratios greater than 5 and the presence of Botryococcus algae indicated that the organic matter present in the Candeias Formation had a lacustrine origin.15 In addition, values of HOP/STE were lower than 5, and the types of palynomorph found indicate the Barreirinha Formation’s marine origin.23
Another evaluation of the origin of organic matter based on S-markers is by DBTs, where the highest concentrations of these compounds are present in oils and extracts from source rocks of marine origin, compared to those of freshwater lacustrine origin.10 The classical biomarkers such as HOP/STE and TPP/[TPP + DIA] ratios are frequently employed to evaluate origin, where lake environments usually present values greater than 5 for the HOP/STE ratio and greater than 0.4 for the TPP/[TPP + DIA], while marine environments generally present values lower than 5 for the HOP/STE ratio and lower than 0.4 for the TPP/[TPP + DIA] ratio.13
The relationships between ∑DBT versus HOP/STE (Figure 7a) and TPP/[TPP + DIA] (Figure 7b) showed a good distinction between the depositional paleoenvironments. Samples from the Candeias Formation presented the lowest concentrations of ∑DBT and highest values for HOP/STE and TPP/[TPP + DIA] ratios, which are the characteristics of a freshwater lacustrine paleoenvironment.10,13 Samples from the Barreirinha Formation presented the highest concentrations of DBT and lower values for the HOP/STE and TPP/[TPP + DIA] ratios, typical of a marine paleoenvironment.
Figure 7.
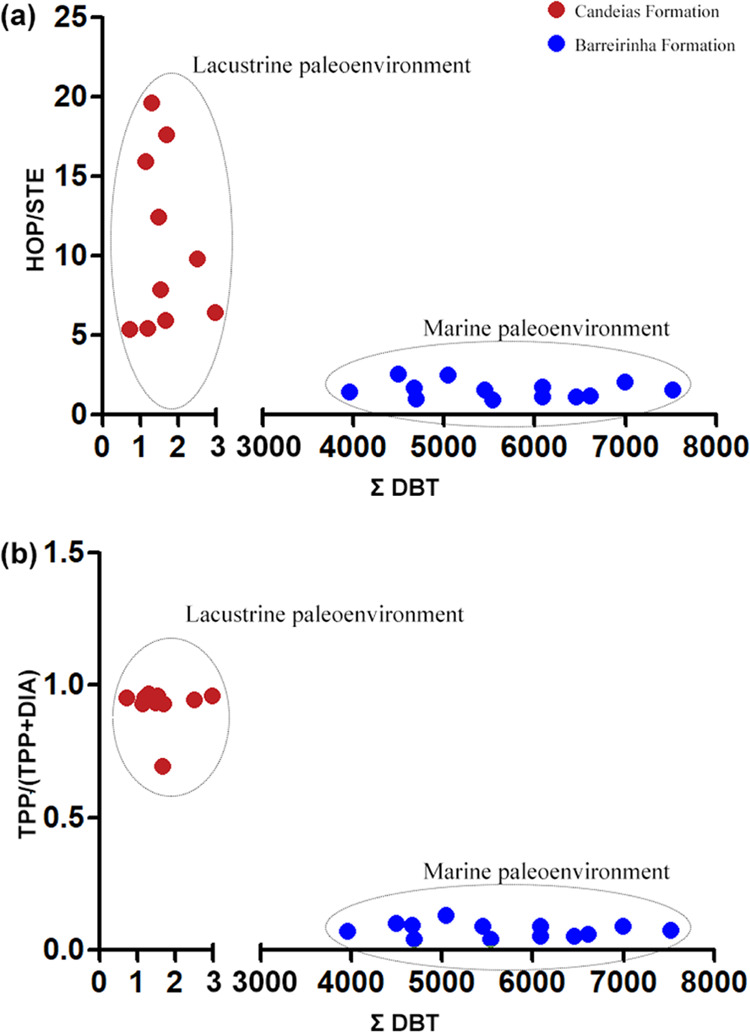
Relationships between: (a) dibenzothiophenes (∑DBT) and the hopanes/steranes (HOP/EST) ratio and (b) TPP/TPP + DIA ratio of samples from the Candeias Formation (Recôncavo basin) and Barreirinha Formation (Amazon basin). Red dotted points are Candeias Formation. Blue dotted points are the Barreirinha Formation.
According to the theory of bacterial sulfate reduction, organosulfur compounds are formed from the production of inorganic sulfur by bacteria during diagenesis.1 In general, samples from the Candeias Formation show indications of a high microbial contribution (high values for the HOP/STE ratio) and low concentrations of organosulfur compounds. In this case, the low S-markers concentrations are due to the low availability of sulfate ions in the freshwater lacustrine environment.48
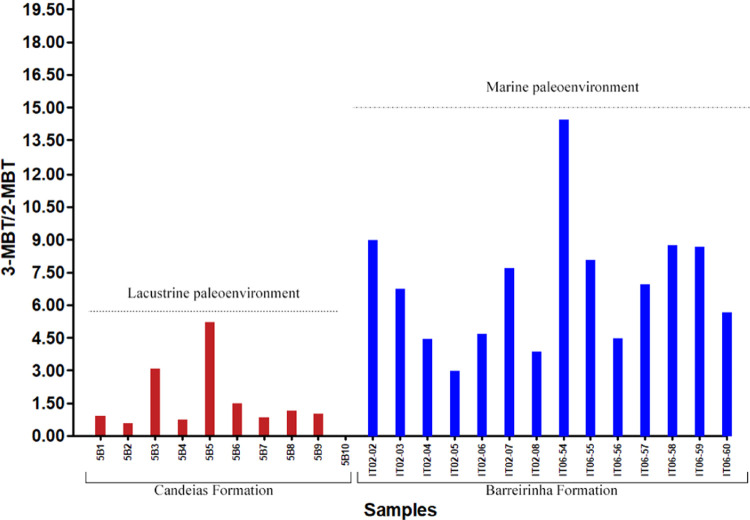
The BT class distribution can be applied to evaluate differences in source material/depositional paleoenvironment and/or maturity.47 All samples analyzed in this study are thermally immature (as will be discussed in subsection 4.5); thus, the differences in BT and alkyl-BT concentrations reflect different depositional paleoenvironments. For example, the 3-MBT/2-MBT ratio allows close inspection of the data to evaluate crude oils from different paleoenvironments.12,49 The application of this ratio (Figure 8) in samples indicates the predominance of the lacustrine paleoenvironment in the Candeias Formation (values ≤ 5.22, average of 1.50) and marine paleoenvironment in the Barreirinha Formation (values ≤ 14.42, average of 6.88).
Figure 8.
3-MBT/2-MBT ratio for depositional paleoenvironment interpretations of samples from the Candeias Formation (Recôncavo basin) and Barreirinha Formation (Amazon basin).
In the outcrops, vertical variations in the concentrations of BTs and, consequently, in the values of the 3-MBT/2-MBT ratio are observed. Such variations may reflect changes over the time of sediment deposition of the geological formations in question. However, this fact has not been completely understood since no correlations were observed between the concentrations of BTs and other geochemical parameters, such as TOC, Rock-Eval pyrolysis data, or saturated biomarkers data.
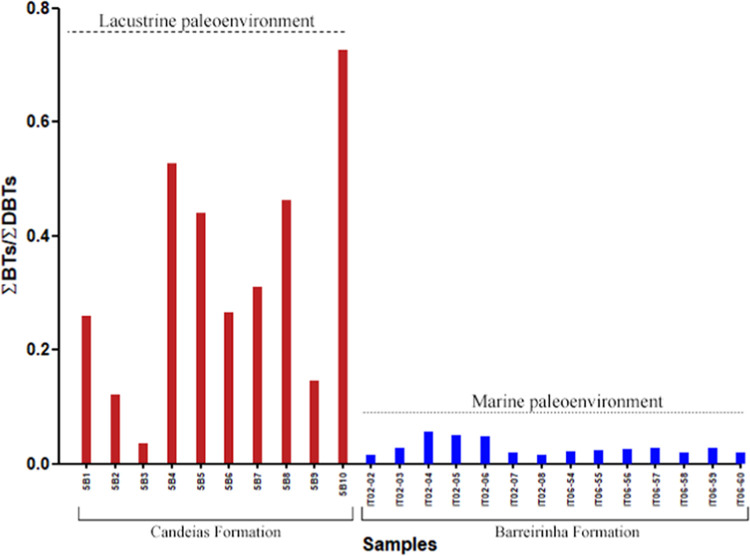
BTs/DBTs ratio >3 indicates marine paleoenvironments, from 1 to 3 marine or lacustrine paleoenvironments, and <1 suggests lacustrine paleoenvironments.8 DBTs are predominant over BTs for the entire set of samples studied (Figure 6). However, the application of the ∑BTs/∑DBTs ratio to the samples (Figure 9) exhibits contradictory values to those reported previously,8 with marine samples showing the lowest values (<0.2). This behavior can be explained by the influence of the depositional paleoenvironment on these compounds, where higher concentrations of DBTs result in lower values in the ∑BTs/∑DBTs ratio in samples from marine paleoenvironment (Barreirinha Formation). Thermochemical sulfate reduction (TSR) associated with relatively high temperatures between 100 and 180 °C can be the abiotic alteration process responsible for the high DBT values observed in the Barreirinha Formation samples.
Figure 9.
∑BTs/∑DBTs ratio for depositional paleoenvironment interpretations of samples from the Candeias Formation (Recôncavo basin) and Barreirinha Formation (Amazon basin).
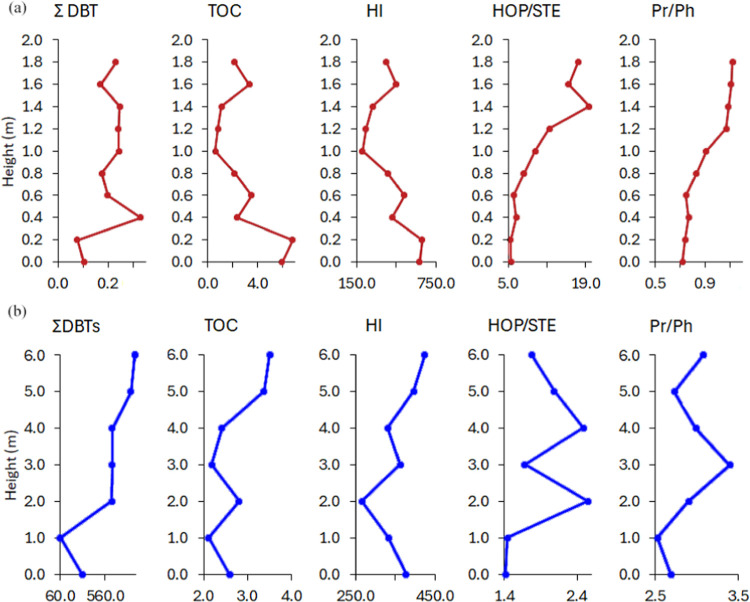
The variations in ∑DBT and TOC in the outcrop of the Candeias Formation show an inversely proportional relationship, while in the Barreirinha Formation, there is a proportional increase in DBT and TOC (Figure 10a,b). These results could indicate that the source of organic matter exerts some control over the distribution of DBTs. On the other hand, in the evaluation of the ∑DBT with the geochemical parameters such as hydrogen index (HI), HOP/STE, and Pr/Ph the vertical variations do not agree. Thus, there is uncertainty as to whether the DBT is predominantly controlled by environmental, source, or both factors.
Figure 10.
Vertical variations to ∑BNT, TOC, HI, HOP/STE, and Pr/Ph ratios from the (a) Candeias Formation and (b) Barreirinha Formation. For individual values, see Table S2.
4.3. Input of Organic Matter
The evaluation of organic matter input by S-markers can amplify the interpretations generated from saturated biomarkers already extensively described in the literature. Therefore, combining S-markers with biomarkers and other geochemical data allows for increased interpretations of organic matter input into depositional environments.
Although BNTs have no confirmed origin, a previous study carried out under aerobic conditions indicated that they could be microbially produced from BNT with Pseudomonas.50 Recent studies have affirmed the possibility that BNTs originate from microbial action.51−53 In the evaluation of the vertical variations in two outcrops (Figure 11), there is a similarity in the distribution of the sum of BNTs to the amounts of AOM, which is congruent with the idea that BNTs can come from microbial activity. Furthermore, the DBT/Phen ratio, which can provide information about the Eh conditions of depositional paleoenvironments,10 shows different behavior in the outcrops (Table 3). For the Candeias Formation (Figure 11a), the DBT/Phen ratio varies proportionally with the BNTs and AOM values. In contrast, for the Barreirinha Formation (Figure 11b), the DBT/Phen ratio varies inversely with the other factors under analysis. This behavior may be indicative that BNTs are generated from the AOM under varying Eh conditions (anoxic for the Candeias Formation and suboxic for the Barreirinha Formation).
Figure 11.
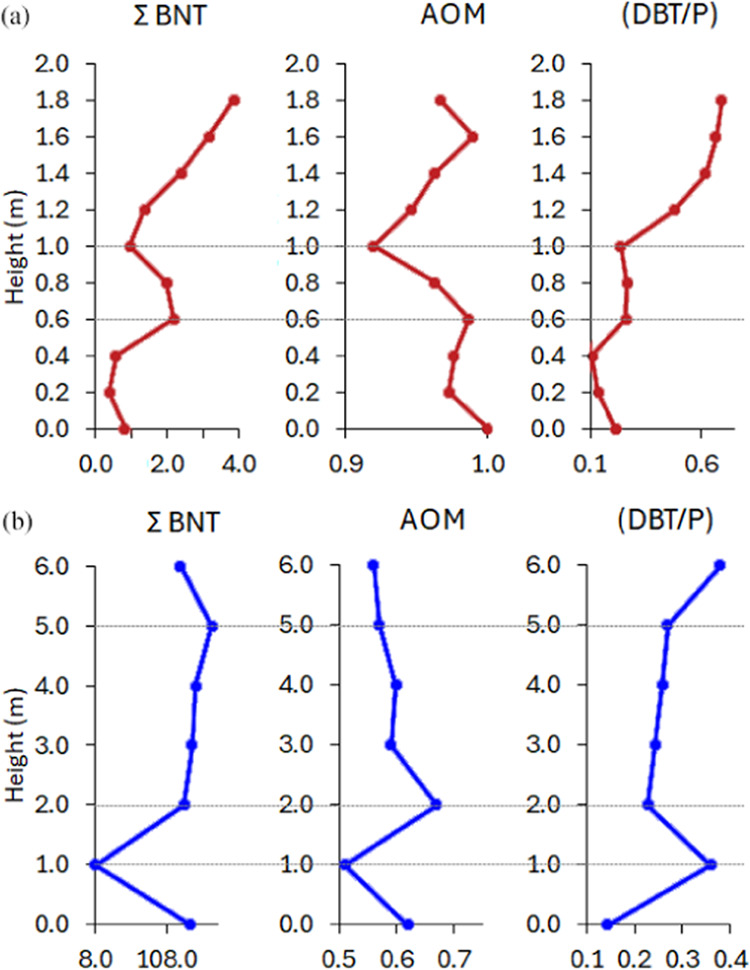
Vertical variations to BNTs, AOM, and DBT/Phen ratios from (a) Candeias Formation and (b) Barreirinha Formation.
Table 3. Classification of Depositional Paleoenvironments According to the Redox Condition.
| zone | redox conditions | [Fe]/[S] | Pr/Ph | DBT/Phen |
|---|---|---|---|---|
| 1A, 1B | anoxic/sulfidica | [Fe] < [S] | <1 | >1 |
| 2 | anoxic/fermentative | [Fe] > [S] | <1 | <1 |
| 1A, 1B, 2 | anoxic/hypersaline | variable | <0.4 | variable |
| 3 | anoxic/nonsulfidica | [Fe] > [S] | 1–3 | <1 |
| 4 | periodically oxic or dysoxic | [Fe] ≫ [S] | >3 | <1 |
The term sulfidic refers to conditions where free H2Sn species are present. [Fe] represents the concentration of iron capable of reacting with reduced sulfur to form iron sulfides. [S] represents the concentration of reduced sulfur capable of reacting with iron to form iron sulfides. Adapted from Hughes et al.10
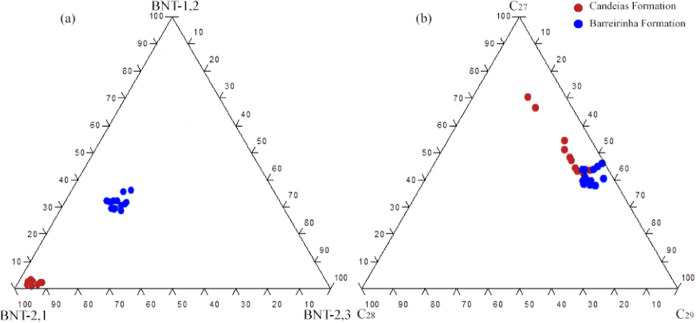
In this sense, the abundance of BNTs suggests a microbial contribution to the source rocks that expelled the oils. The concentrations of BNTs in samples are very different (Figure 6), and their relative proportions allow the assessment of the type of organic matter in the depositional paleoenvironment. The BNT concentrations indicate diverse microbial participation in the alteration of the samples. The ternary diagram (Figure 12a) shows the BNTs isomers with the distribution of samples into two groups. In addition, the chart from regular steranes C27, C28, and C29 (Figure 12b) indicates the presence of different organic matter inputs and algae inputs (relative proportion of C27 sterane). The C29 concentration in samples indicate terrestrial material imputs.54,55
Figure 12.
Ternary diagrams for input evaluation. (a) Isomeric distribution of benzothiophenes and (b) distribution of regular steranes C27, C28, and C29 for samples.
The C27/C29 steranes ratio (Figure 12b) indicates inputs of algal and terrigenous material predominant in the Candeias and Barreirinha Formations, respectively. However, the results of the relative proportions of BNT (Figure 12a) indicate an isomeric differentiation among the samples under study. The benzo[b]naphtho[2,1-d]thiophene isomer is present in higher concentrations in samples from the Candeias Formation of freshwater lacustrine origin (Figure 12a). The predominance of the benzo[b]naphtho[1,2-d]thiophene isomer is noted in the Barreirinha Formation, of marine origin (Figure 12a). This observation indicates that the isomeric distribution of BNTs has the potential to distinguish marine and nonmarine depositional environments. Therefore, the benzonaphthothiophenes isomers differences may be associated with different origins (marine or lacustrine) or different oxygenation conditions in depositional paleoenvironments, a fact that alters microbial production56
4.4. Depositional Paleoenvironment Conditions
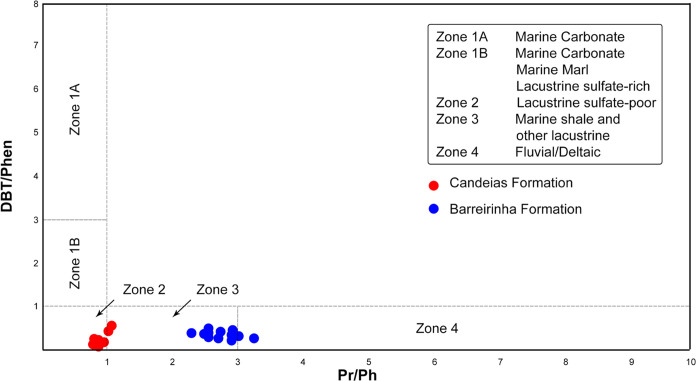
The DBT/Phen ratio, together with the Pr/Ph ratio (Figure 13), provides a powerful way to classify source rock depositional paleoenvironments relative to their most important microbiological and chemical processes.10 Applying the relationship between the DBT/Phen and Pr/Ph ratios for the samples from both Formations (Candeias and Barreirinha) indicates zones 2 and 3 as defined by Hughes et al.10 These zones distinguish the depositional paleoenvironments of the samples in studies compatible with the interpretations already made: lacustrine paleoenvironment for samples from the Candeias Formation and marine paleoenvironment for samples from the Barreirinha Formation.
Figure 13.
Cross plot of pristane/phytane (Pr/Ph) vs dibenzothiophene/phenanthrene (DBT/PHEN). Red dot points are Candeias Formation. Blue dot points are Barreirinha Formation.
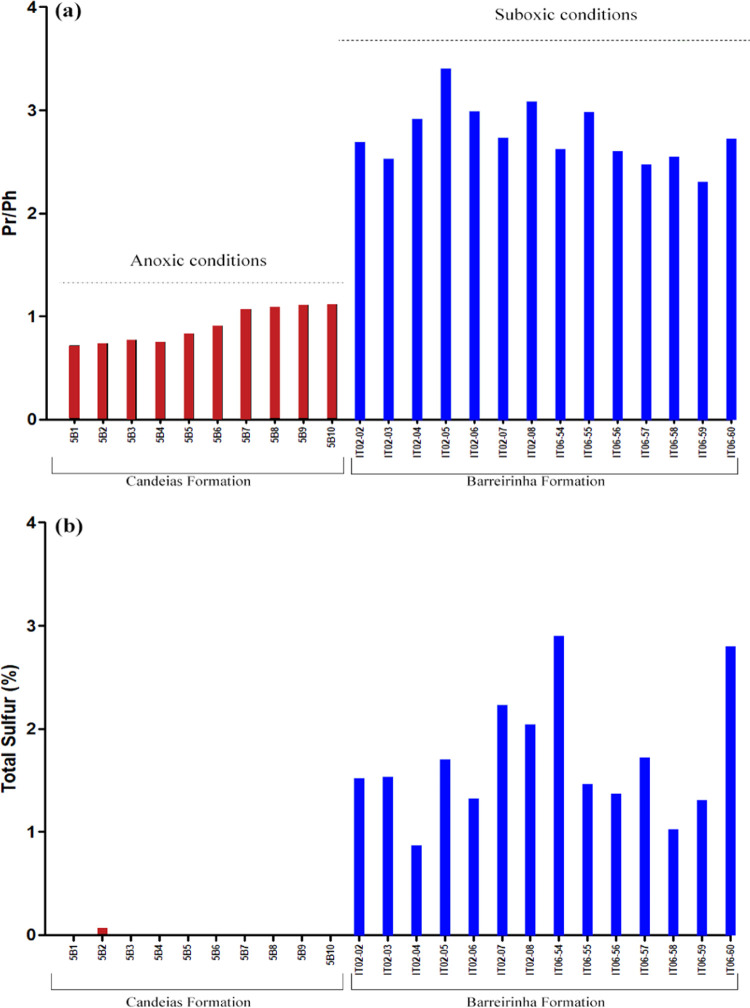
The isoprenoids Pr/Ph ratio indicates oxidizing (Pr/Ph > 1) or reducing (Pr/Ph < 1) conditions of the depositional paleoenvironment of the organic matter.13 In Figure 14a, the differences between the samples from the Candeias Formation (deposited under more reducing conditions) and the Barreirinha Formation (deposited under more oxidizing conditions) confirm the previous depositional conditions observed.
Figure 14.
(a) values for the pristane/phytane ratio (Pr/Ph) and (b) total sulfur for the samples of Candeias and Barreirinha Formations applied to evaluate the depositional paleoenvironmental conditions of these formations. For individual values, see Table S2.
Variations in the values for the Pr/Ph ratio can be noted in the vertical sections of the outcrops (Figure 14a). In the Candeias Formation, values grade linearly from base to top, with 0.72 at the base and 1.12 at the top. In the outcrops of the Barreirinha Formation, greater vertical variations are observed with values varying between 2.30 and 3.40 (Table S2). Although values greater than 1 were noted in all outcrops studied, due to the good preservation of organic matter, depositional paleoenvironments with these high values were interpreted as presenting suboxic conditions.
The DBT/Phen ratio also reflects the availability of reactive sulfur, primarily hydrogen sulfide (H2S), and polysulfides (H2Sn), for interaction with organic matter.10 Candeias and Barreirinha Formations had low values for this ratio (Figure 14b).
Deposited in a freshwater lacustrine context, samples from the Candeias Formation present low values for the DBT/Phen ratio (Table S3) due to the sulfate concentration in freshwater that varies between ∼10 and 500 μM, which is many times lower than in seawater (28 mM).57 In this case, the low Eh may be caused by fermentation and not sulfate reduction.48 Therefore, Pr/Ph < 1 and DBT/Phen <1 may be due to fermentation under low sulfate concentrations.
Barreirinha Formation samples have high values of total sulfur (Figure 14b), originating from the reduction of sulfate present in the marine paleoenvironment. However, the DBT/Phen ratio values for these samples are low (Table S3). This behavior is similar to a previous study with crude oils, where levels of organic sulfides were higher than thiophenes.58 Furthermore, Barreirinha Formation source rocks were deposited under conditions of sulfate reduction, and the supply of reactive iron was greater than that of the sulfide. The presence of pyrite in samples from the Barreirinha Formation is geological evidence of this process.23
The DBT/Phen values for the outcrops remain between 0 and 1 along the vertical sections, varying between 0.06 and 0.64 in the Candeias Formation and between 0.14 and 0.44 in the Barreirinha Formation. Therefore, it is possible to classify the samples in zones 2 (Candeias Formation) and 3 (Barreirinha Formation), according to the proposed by Hughes et al.10 (Table 4).
Table 4. Diagnostic Ratios of Sulfur Markers and Biomarkers Used to Evaluate Thermal Maturation in the Outcrop Samples.
| Candeias
formation |
||||||||||
|---|---|---|---|---|---|---|---|---|---|---|
| ratio | 5B01 | 5B02 | 5B03 | 5B04 | 5B05 | 5B06 | 5B07 | 5B08 | 5B09 | 5B10 |
| 4,6-DMDBT/2,4,6-TMDBT | 0.35 | 0.57 | 0.45 | 0.25 | 0.34 | 0.43 | 0.34 | 0.34 | 0.32 | 0.55 |
| 2,4,6-TMDBT/2,4,7 + 2,4,8-TMDBT | 0.43 | 0.42 | 0.68 | 0.56 | 0.54 | 0.72 | 0.76 | 0.69 | 1.01 | 0.65 |
| Ts/Ts + Tm | 0.03 | 0.05 | 0.02 | 0.02 | 0.05 | 0.02 | 0.02 | 0.01 | 0.03 | 0.04 |
| Tmax (°C) | 434 | 437 | 438 | 438 | 436 | 412 | 414 | 416 | 415 | 415 |
| Barreirinha formation | ||||||||||||||
|---|---|---|---|---|---|---|---|---|---|---|---|---|---|---|
| IT02-02 | IT02-03 | IT02-04 | IT02-05 | IT02-06 | IT02-07 | IT02-08 | IT06-54 | IT06-55 | IT06-56 | IT06-57 | IT06-58 | IT06-59 | IT06-60 | |
| ratio | 0.89 | 1.21 | 1.13 | 1.16 | 1.00 | 1.07 | 5.37 | 1.07 | 0.99 | 1.17 | 1.22 | 1.08 | 1.16 | 1.03 |
| 4,6-DMDBT/2,4,6-TMDBT | 0.34 | 0.35 | 0.37 | 0.34 | 0.34 | 0.34 | 0.32 | 0.38 | 0.32 | 0.35 | 0.38 | 0.37 | 0.35 | 0.36 |
| 2,4,6-TMDBT/2,4,7 + 2,4,8-TMDBT | 0.16 | 0.17 | 0.16 | 0.13 | 0.14 | 0.15 | 0.17 | 0.15 | 0.16 | 0.15 | 0.17 | 0.02 | 0.14 | 0.17 |
| Ts/Ts + Tm | 435 | 436 | 433 | 437 | 436 | 434 | 433 | 426 | 434 | 434 | 428 | 427 | 429 | 425 |
| Tmax (°C) | ||||||||||||||
4.5. Thermal Maturation
Sulfur compounds are good markers of the thermal maturation stage due to their highest stability at elevated temperatures.8,9 Generally, the concentrations of BTs, DBTs, and BNTs increase with thermal maturation. Diagnostic ratios such as 4,6-DMDBT/2,4,6-TMDBT and 2,4,6-TMDBT/(2,4,7 + 2,4,8)-TMDBT are employed to evaluate this parameter.1
The low values of the S-markers ratios (Table 2) for all samples analyzed indicated that they are thermally immature, in accordance with the interpretations reported in the literature for these compounds.49,59 In addition, low values of the ratio Ts/(Ts + Tm) and Tmax values less than 440 °C confirm the thermal immaturity of the samples for hydrocarbon generation.13
In addition, there is a correlation between the maturation values tested in kerogen samples (evaluated by Tmax from Rock-Eval pyrolysis) and the values calculated from molecular parameters. For the entire set of samples, the Tmax values are low (less than 440 °C), ranging between 412 and 438 °C for the samples from the Candeias Formation and between 425 and 437 °C for the samples from the Barreirinha Formation. The ratio of biomarkers Ts/(Ts + Tm) also shows low values for the samples under study, attesting to thermal immaturity of the samples for hydrocarbon generation.13
Although they allow the same interpretation regarding thermal immaturity, the values calculated from the molecular ratios are not directly proportional to the Tmax values, indicating that both analyses must be performed in such a way that they corroborate the other.
5. Conclusions
The application of GC–MS/MS instead of GC–MS for individual quantification of twenty-one S-markers allowed an increase in the reliability and accuracy of data results. The results obtained by S-markers allowed us to evaluate and prove distinctions and similarities between the source rocks, defining the origin of organic matter, the organic matter input, the depositional paleoenvironment conditions, and the level of thermal maturity of the samples.
The samples from the Recôncavo basin, of lacustrine origin, have lower concentrations of BT, DBT, and BNT, while samples from the Amazon basin, of marine origin, present high concentrations of these compounds. There is an inversely proportional relationship between variations in ∑DBT and TOC in the outcrop of the Candeias Formation, while in the Barreirinha Formation, this proportion increases. This observation is indicative that the source of organic matter exerts some control of the distribution of DBTs.
The relative proportions of the BNT-2,1, BNT-1,2, and BNT-2,3 isomers, in addition to the C27, C28, and C29 regular steranes, indicated that the inputs of algal and terrigenous materials were predominant in the Candeias and Barreirinha Formations, respectively, with different levels of microbial participation. In addition, in the vertical variations of the outcrops, there is a similarity in the distribution of the sum of BNTs with the amounts of AOM, which indicates that BNTs can come from microbial activity.
Similarities between DBT/Phen concentrations and Pr/Ph values indicated that S-markers are affected by the conditions of the depositional paleoenvironments. Candeias Formation presented low values for the DBT/Phen and Pr/Ph ratios due to the absence of sulfate in the paleodepositional environment and the fermentation of organic matter. Although the source rocks of the Barreirinha Formation were formed under conditions of sulfate reduction, the supply of reactive iron exceeded that of sulfide, resulting in the predominant formation of pyrite.
The thermal maturity was evaluated using Tmax values from Rock-Eval pyrolysis from kerogen samples, and the molecular values were calculated using S-markers. Low values to ratios 4,6-DMDBT/2,4,6-TMDBT and 2,4,6-TMDBT/(2,4,7 + 2,4,8)-TMDBT associated with low values to Tmax (less than 440 °C) indicated that the Formations are thermally immature for hydrocarbon generation.
Acknowledgments
This study was supported by the ANP R&D project, registered as ANP No 20075-8, “Project Petroleum Systems Research in Brazilian Sedimentary basins” (UFBA/Shell Brasil/ANP), sponsored by Shell Brasil under the ANP R&D levy as “Compromisso de Investimentos com Pesquisa e Desenvolvimento” and financed in part by the CAPES—Finance Code 001. The authors also acknowledge the scholarships supported by Conselho Nacional de Desenvolvimento Científico e Tecnologico (CNPq) Public call no 23/2018—Programa Doutorado Acadêmico para Inovação (process 142495/2019-0).
Supporting Information Available
The Supporting Information is available free of charge at https://pubs.acs.org/doi/10.1021/acsomega.4c07344.
Palynofacies data, saturated biomarkers, and BNTs concentrations in samples (Table S1); TOC, total sulfur, Rock-Eval pyrolysis parameters (Table S2); diagnostic ratios and concentration of saturated and S-markers in samples (Table S3); GC–MS chromatograms of the biomarkers in saturated fractions (Figures S1–S4) (PDF)
The Article Processing Charge for the publication of this research was funded by the Coordination for the Improvement of Higher Education Personnel - CAPES (ROR identifier: 00x0ma614).
The authors declare no competing financial interest.
Supplementary Material
References
- Oliveira L. M. L. d.; Amaral D. N.; Ferreira K. L. A.; Souza C. S.; Hadlich G. M.; Machado M. E. Polycyclic aromatic sulfur heterocycles used as molecular markers in crude oils and source rocks. Org. Geochem. 2023, 178, 104571 10.1016/j.orggeochem.2023.104571. [DOI] [Google Scholar]
- Radke M.; Vriend S. P.; Schaefer R. G. Geochemical of lower toarcian source rocks from NW Germany: Interpretation of aromatic and saturated hydrocarbons in relation to depositional environment and maturation effect. J. Pet. Geol. 2001, 24, 287–307. 10.1111/j.1747-5457.2001.tb00676.x. [DOI] [Google Scholar]
- Asif M.; Fazeelat T. Petroleum geochemistry of the Potwar Basin, Pakistan: II—Oil classification based on heterocyclic and polycyclic aromatic hydrocarbons. Appl. Geochem. 2012, 27, 1655–1665. 10.1016/j.apgeochem.2012.04.006. [DOI] [Google Scholar]
- Hughes W. B.Use of Thiophenic Organosulfur Compounds in Characterizing Crude Oil Derived from Carbonate Versus Siliciclastic Sources. In Petroleum Geochemistry and Source Rock Potential of Carbonate Rocks; AAPG, Studies in Geology, 1984; pp 181–196. [Google Scholar]
- Kohnen M. E. L.; Peakman T. M.; Sinninghe Damsté J. S.; de Leeuw J. W. Identification and occurrence of novel C36–C54 3,4-dialkylthiophenes with an unusual carbon skeleton in immature sediments. Org. Geochem. 1990, 16, 1103–1113. 10.1016/0146-6380(90)90146-Q. [DOI] [Google Scholar]
- Pu F.; Philp R. P.; Li Z. X.; Ying G. G. Geochemical characteristics of aromatic hydrocarbons of crude oils and source rocks from different sedimentary environments. Org. Geochem. 1990, 16, 427–435. 10.1016/0146-6380(90)90059-9. [DOI] [Google Scholar]
- Huang H.; Pearson M. J. Source rock palaeoenvironments and controls on the distribution of dibenzothiophenes in lacustrine crude oils, Bohai Bay Basin, eastern China. Org. Geochem. 1999, 30, 1455–1470. 10.1016/S0146-6380(99)00126-6. [DOI] [Google Scholar]
- Radke M. Application of aromatic compounds as maturity indicators in source rocks and crude oils. Mar. Pet. Geol. 1988, 5, 224–236. 10.1016/0264-8172(88)90003-7. [DOI] [Google Scholar]
- Yang S.; Li M.; Liu X.; Han Q.; Wu J.; Zhong N. Thermodynamic stability of methyldibenzothiophenes in sedimentary rock extracts: Based on molecular simulation and geochemical data. Org. Geochem. 2019, 129, 24–41. 10.1016/j.orggeochem.2018.10.012. [DOI] [Google Scholar]
- Hughes W. B.; Holba A. G.; Dzou L. I. P. The ratios of dibenzothiophene to phenanthrene and pristane to phytane as indicators of depositional environment and lithology of petroleum source rocks. Geochim. Cosmochim. Acta 1995, 59, 3581–3598. 10.1016/0016-7037(95)00225-O. [DOI] [Google Scholar]
- Sivan P.; Datta G. C.; Singh R. R. Aromatic biomarkers as indicators of source, depositional environment, maturity and secondary migration in the oils of Cambay Basin, India. Org. Geochem. 2008, 39, 1620–1630. 10.1016/j.orggeochem.2008.06.009. [DOI] [Google Scholar]
- El Nady M. M.; Harb F. M. Significance of aromatic hydrocarbons in recognizing source depositional environments and maturation of some Egyptian crude oils. Energy Sources, Part A 2009, 31, 773–782. 10.1080/15567030701715906. [DOI] [Google Scholar]
- Peters K. E.; Walters C. C.; Moldowan J. M.. The Biomarker Guide: Biomarkers and Isotopes in the Environment and Human History; Cambridge University Press, 2005. [Google Scholar]
- Balbinot M.; Kalkreuth W. Organic geochemistry and petrology of the Gomo Member, Recôncavo Basin, Brazil. Int. J. Coal Geol. 2010, 84, 286–292. 10.1016/j.coal.2010.09.008. [DOI] [Google Scholar]
- Amaral D. N. d.; Cerqueira J. R.; Andrade C. L. N.; Ribeiro H. J. P. S.; Garcia K. S.; Miranda F. L. C.; Oliveira O. M.; Queiroz A. F.; Santos L. C. L. Paleoenvironmental characterization of a Lower Cretaceous section of the Recôncavo Basin, Bahia, Brazil. Braz. J. Geol. 2020, 50, e20190058 10.1590/2317-4889202020190058. [DOI] [Google Scholar]
- Souza I. M. F.; Cerqueira J. R.; Garcia K. S.; Ribeiro H. J. P. S.; Oliveira O. M. C.; Queiroz F. S.; Teixeira L. S. G. Geochemical characterization and origin of kerogens from source-rock of Devonian in the Amazonas Basin, Brazil. J. South Am. Earth Sci. 2021, 111, 103437 10.1016/j.jsames.2021.103437. [DOI] [Google Scholar]
- Cunha P. R. C.; Melo J. H. G.; Silva O. B. Bacia do Amazonas. Bol. Geocienc. Petrobras 2007, 15, 227–251. [Google Scholar]
- Morais E. T.; Barberes G. A.; Souza I. V. A. F.; Leal F. G.; Guzzo J. V. P.; Spigolon A. L. D. Pearson correlation coefficient applied to petroleum system characterization: The case study of Potiguar and Reconcavo Basins, Brazil. Geosciences 2023, 13, 282 10.3390/geosciences13090282. [DOI] [Google Scholar]
- Jiang W.; Li Y.; Xiong Y. Reservoir alteration of crude oils in the Junggar Basin, northwest China: Insights from diamondoid indices. Mar. Pet. Geol. 2020, 119, 104451 10.1016/j.marpetgeo.2020.104451. [DOI] [Google Scholar]
- Alkhafaji M. W. Biomarker assessment of oil biodegradation, water washing, and source rock characteristics of oil seeps from the Foothill Zone along the Tigris River, Northern Iraq. J. Pet. Sci. Eng. 2021, 197, 107946 10.1016/j.petrol.2020.107946. [DOI] [Google Scholar]
- Wang Q.; Huang H.; Zheng L. Thermal maturity parameters derived from tetra-,penta-substituted naphthalenes and organosulfur compounds highly mature sediments. Fuel 2021, 288, 119626 10.1016/j.fuel.2020.119626. [DOI] [Google Scholar]
- Loboziak S.; Melo J. G.; Matsuda N. S.; Quadros L. P. Miospore biostratigraphy of the type Barreirinha Formation (Curuá Group, upper Devonian) in the Tapajos river area, Amazon Basin, North Brazil. Bull. Cent. Rech. Explor.-Prod. Elf-Aquitaine 1997, 21, 187–205. [Google Scholar]
- Góes V. C. M.; Costa A. B.; De Andrade C. L. N.; Cerqueira J. R.; da Silva A. S.; Garcia K. S.; Queiroz A. F.; Ribeiro H. J. P. S.; Dino R. Hydrocarbon source potential and paleodepositional environment of the (Devonian) Barreirinha formation on the south edge of the Amazonas basin border, Brazil. J. South Am. Earth Sci. 2022, 115, 103722 10.1016/j.jsames.2022.103722. [DOI] [Google Scholar]
- Penteado H. L. B.; Behar F. Geochemical characterization and compositional evolution of the Gomo Member source rocks in the Recôncavo Basin, Brazil. AAPG Memoir 2000, 73, 179–194. [Google Scholar]
- Chiaberge S.; Fiorani T.; Cesti P. Methyldibenzothiophene isomer ratio in crude oils: Gas chromatography tandem mass spectrometry analysis. Fuel Process. Technol. 2011, 92, 2196–2201. 10.1016/j.fuproc.2011.07.011. [DOI] [Google Scholar]
- Franchina F. A.; Machado M. E.; Tranchida P. Q.; Zini C. A.; Caramão E. B.; Mondello L. Determination of aromatic sulphur compounds in heavy gas oil by using (low-)flow modulated comprehensive two-dimensional gas chromatography-triple quadrupole mass spectrometry. J. Chromatogr. A 2015, 1387, 86–94. 10.1016/j.chroma.2015.01.082. [DOI] [PubMed] [Google Scholar]
- Sørensen L.; Meier S.; Mjøs S. A. Application of gas chromatography/tandem mass spectrometry to determine a wide range of petrogenic alkylated polycyclic aromatic hydrocarbons in biotic samples. Rapid Commun. Mass Spectrom. 2016, 30, 2052–2058. 10.1002/rcm.7688. [DOI] [PubMed] [Google Scholar]
- Mei M.; Bissada K. A.; Malloy T. B.; Darnell L. M.; Szymcyk E. B. Improved method for simultaneous determination of saturated and aromatic biomarkers, organosulfur compounds and diamondoids in crude oils by GC–MS/MS. Org. Geochem. 2018, 116, 35–50. 10.1016/j.orggeochem.2017.09.010. [DOI] [Google Scholar]
- Sampaio F. X. A.; Garcia K. S.; de Souza Queiroz A. F.; Machado M. E. Determination of organic sulfur markers in crude oils by gas chromatography triple quadrupole mass spectrometry. Fuel Process. Technol. 2021, 217, 106813 10.1016/j.fuproc.2021.106813. [DOI] [Google Scholar]
- Caputo M. V.Stratigraphy, Tectonics, Paleoclimatology and Paleogeography of Northern Basins of Brazil. Ph.D. Thesis, University of California: CA, 1984. [Google Scholar]
- Milhomem P. S.; Maman E. J.; Oliveira F. M.; Carvalho M. S. S.; Lima W. S.. Bacias sedimentares brasileiras: Bacia do Recôncavo; Fundação Paleontológica Phoenix, 2003. [Google Scholar]
- Caixeta J. M.; Bueno G. V.; Magnavita L. P.; Feijo F. J. Recôncavo, Tucano and Jatoba Basins. Bol. Geocienc. Petrobras 1994, 8, 163–172. [Google Scholar]
- Mello M. R.; Koutsoukos E. A.; Mohriak W. U.; Bacoccoli G.. Selected Petroleum Systems in Brazil: Chapter 31: Part V. Case Studies-Western Hemisphere; Memoir, 1994. [Google Scholar]
- Silva O. B.; Caixeta J. M.; Milhomem P. S. Bacia do Recôncavo. Bol. Parana. Geocienc. 2007, 15, 423–431. [Google Scholar]
- Machado M. E.; Fontanive F. C.; de Oliveira J. V.; Caramão E. B.; Zini C. A. Identification of organic sulfur compounds in coal bitumen obtained by different extraction techniques using comprehensive two-dimensional gas chromatography coupled to time-of-flight mass spectrometric detection. Anal. Bioanal. Chem. 2011, 401, 2433–2444. 10.1007/s00216-011-5171-4. [DOI] [PubMed] [Google Scholar]
- ASTM D2007-11 Standard test method for characteristic groups in rubber extender and processing oils and other petroleum-derived oils by the clay-gel absorption chromatographic method.
- Behar F.; Beaumont V.; De B.; Penteado H. L. Rock-Eval 6 Technology: Performances and Developments. Oil Gas Sci. Technol. 2001, 56 (2), 111–134. [Google Scholar]
- Andersson J. T.; Schmid B. Polycyclic aromatic sulfur heterocycles IV. Determination of polycyclic aromatic compounds in a shale oil with the atomic emission detector. J. Chromatogr. A 1995, 693, 325–338. 10.1016/0021-9673(94)01111-Q. [DOI] [Google Scholar]
- Li M.; Wang T.; Liu J.; et al. Total alkyl dibenzothiophenes content tracing the filling pathway of condensate reservoir in the Fushan Depression, South China Sea. Sci. China, Ser. D: Earth Sci. 2008, 51, 138–145. 10.1007/s11430-008-6025-6. [DOI] [Google Scholar]
- Li M.; Wang T. G.; Shi S.; Liu K.; Ellis G. S. Benzo[b]naphthothiophenes and alkyl dibenzothiophenes: Molecular tracers for oil migration distances. Mar. Pet. Geol. 2014, 57, 403–417. 10.1016/j.marpetgeo.2014.06.012. [DOI] [Google Scholar]
- Shi S.; Chen J.; Zhu L.; Wang T. Selective biodegradation of dibenzothiophene and alkyl dibenzothiophenes in crude oils from the Linpan oilfield, Bohai Bay basin, eastern China. J. Asian Earth Sci. 2022, 7, 100078 10.1016/j.jaesx.2021.100078. [DOI] [Google Scholar]
- Wang G.; Wang T. G.; Simoneit B. R.; Zhang L.; Zhang X. Sulfur rich petroleum derived from lacustrine carbonate source rocks in Bohai Bay Basin, East China. Org. Geochem. 2010, 41, 340–354. 10.1016/j.orggeochem.2009.12.010. [DOI] [Google Scholar]
- Barakat A. O.; Mostafa A. R.; El-Gayar M. S.; Omar M. F. Significance of thiophenic compounds distribution in correlating crude oils into source related types. Pet. Sci. Technol. 2017, 35, 1888–1895. 10.1080/10916466.2017.1369114. [DOI] [Google Scholar]
- Chakhmakhchev A.; Suzuki N. Saturate biomarkers and aromatic sulfur compounds in oils and condensates from different source rock lithologies of Kazakhstan, Japan and Russia. Org. Geochem. 1995, 23, 289–299. 10.1016/0146-6380(95)00018-A. [DOI] [Google Scholar]
- Hegazi A. H.; Andersson J. T. Limitations to GC–MS determination of sulfur-containing polycyclic aromatic compounds in geochemical, petroleum, and environmental investigations. Energy Fuels 2007, 21, 3375–3384. 10.1021/ef700362v. [DOI] [Google Scholar]
- Han Y.; Horsfield B.; Curry D. J. Control of facies, maturation and primary migration on biomarkers in the Barnett Shale sequence in the Marathon 1 Mesquite well, Texas. Mar. Pet. Geol. 2017, 85, 106–116. 10.1016/j.marpetgeo.2017.04.018. [DOI] [Google Scholar]
- Fan P.; Philp R. P.; Li Z. X.; Ying G. G. Geochemical characteristics of aromatic hydrocarbons in crude oils and source rocks from different sedimentary environments. Org. Geochem. 1990, 61, 427–435. [Google Scholar]
- Deming J. W.; Baross J. A.. The Early Diagenesis of Organic Matter: Bacterial Activity. In Organic Geochemistry: Principles and Applications; Springer US: Boston, MA, 1993; pp 119–144. [Google Scholar]
- Hegazi A. H.; Andersson J. T.; El-Gayar M. S. Application of gas chromatography with atomic emission detection to the geochemical investigation of polycyclic aromatic sulfur heterocycles in Egyptian crude oils. Fuel Process. Technol. 2004, 85, 1–19. 10.1016/S0378-3820(03)00093-6. [DOI] [Google Scholar]
- Kropp K. G.; Gonçalves J. A.; Andersson J. T.; Fedorak P. M. Microbially mediated formation of benzonaphthothiophenes from benzo[b]thiophenes. Appl. Environ. Microbiol. 1994, 60, 3624–3631. 10.1128/aem.60.10.3624-3631.1994. [DOI] [PMC free article] [PubMed] [Google Scholar]
- Li M.; Wang T. G.; Simoneit B. R.; Shi S.; Zhang L.; Yang F. Qualitative and quantitative analysis of dibenzothiophene, its methylated homologues, and benzonaphthothiophenes in crude oils, coal, and sediment extracts. J. Chromatogr. A 2012, 1233, 126–136. 10.1016/j.chroma.2012.01.086. [DOI] [PubMed] [Google Scholar]
- Zhao Q.; Qin S.; Zhao C.; Sun Y.; Panchal B.; Chang X. Origin and geological implications of super high sulfur-containing polycyclic aromatic compounds in high-sulfur coal. Gondwana Res. 2021, 96, 219–231. 10.1016/j.gr.2021.04.012. [DOI] [Google Scholar]
- Wang X.; Li M.; Yang T.; Zeng B.; Shi Y.; Liu X.; Tang Y. Identification, distribution and geochemical significance of benzo[b] naphthofurans and benzo[b]naphthothiophenes in source rocks from the Beibuwan Basin, South China Sea. Chem. Geol. 2023, 626, 121454 10.1016/j.chemgeo.2023.121454. [DOI] [Google Scholar]
- Mello M. R.; Gaglianone P. C.; Brassell S. C.; Maxwell J. R. Geochemical and biological marker assessment of depositional environments using Brazilian offshore oils. Mar. Pet. Geol. 1988, 5, 205–223. 10.1016/0264-8172(88)90002-5. [DOI] [Google Scholar]
- Waples D. W. Biomarkers for geologists-a practical guide to the application of steranes and triterpanes in petroleum geology. Chap. 1991, 2, 5–10. [Google Scholar]
- Ourisson G.; Albrecht P.; Rohmer M. The microbial origin of fossil fuels. Sci. Am. 1984, 251, 44–51. 10.1038/scientificamerican0884-44.6441250 [DOI] [Google Scholar]
- Holmer M.; Storkholm P. Sulphate reduction and sulphur cycling in lake sediments: A review. Freshwater Biol. 2001, 46, 431–451. 10.1046/j.1365-2427.2001.00687.x. [DOI] [Google Scholar]
- Waldo G. S.; Carlson R. M.; Moldowan J. M.; Peters K. E.; Penner-Hahn J. E. Sulfur speciation in heavy petroleums: information from X-ray absorption near-edge structure. Geochim. Cosmochim. Acta 1991, 55, 801–814. 10.1016/0016-7037(91)90343-4. [DOI] [Google Scholar]
- Li M.; Zhong N.; Shi S.; Zhu L.; Tang Y. The origin of trimethyldibenzothiophenes and their application as maturity indicators in sediments from the Liaohe Basin, East China. Fuel 2013, 103, 299–307. 10.1016/j.fuel.2012.09.027. [DOI] [Google Scholar]
- Tyson R. V.Sedimentary Organic Matter: Organic Facies and Palynofacies; Chapman & Hall: London, 1995; p 615. ISBN 978-94-011-0739-6. [Google Scholar]
Associated Data
This section collects any data citations, data availability statements, or supplementary materials included in this article.


