

Key Points
Question
Does thrice-weekly symptom screening with symptom feedback and symptom management care pathways reduce total symptom burden as measured by the Symptom Screening in Pediatrics Tool (SSPedi), compared with usual care, among pediatric patients newly diagnosed with cancer?
Findings
The total 8-week SSPedi score (range, 0-60) was significantly better with symptom screening compared with usual care (7.9 vs 11.4, respectively; adjusted mean difference, −3.8).
Meaning
Among pediatric patients newly diagnosed with cancer, symptom screening with symptom feedback and symptom management care pathways was associated with improved total SSPedi scores compared with usual care.
Abstract
Importance
Pediatric patients with cancer commonly experience severely bothersome symptoms. The effectiveness of routine symptom screening with symptom feedback and symptom management care pathways is unknown.
Objective
To determine whether thrice-weekly symptom screening with symptom feedback and management care pathways, compared with usual care, improves overall self-reported symptom scores measured by the Symptom Screening in Pediatrics Tool (SSPedi) in pediatric patients with cancer.
Design, Setting, and Participants
This cluster randomized trial enrolled participants between July 2021 and August 2023 from 20 pediatric cancer centers in the US. Patients newly diagnosed with cancer aged 8 to 18 years receiving any cancer treatment were included. Twenty sites were randomized to provide symptom screening (n = 10) vs usual care (n = 10); 221 participants were enrolled at intervention sites and 224 participants at control sites. The date of final follow-up was October 18, 2023.
Intervention
Symptom screening included providing thrice-weekly symptom screening prompts to participants, email alerts to the health care team, and locally adapted symptom management care pathway implementation.
Main Outcomes and Measures
The primary outcome was self-reported total SSPedi score at week 8 (range, 0-60; higher scores indicate more bothersome). Secondary outcomes were Patient-Reported Outcomes Measurement Information System Fatigue score (mean [SD] score, 50 [10]; higher scores indicate more fatigue), Pediatric Quality of Life 3.0 Acute Cancer Module scores (range, 0-100; higher scores indicate better health), symptom documentation and interventions at week 8, and unplanned health care encounters.
Results
A total of 445 participants (median [range] age, 14.8 [8.1-18.9] years; 58.9% males) were enrolled. The mean (SD) 8-week SSPedi score was 7.9 (7.2) in the symptom screening group vs 11.4 (8.7) in the usual care group. Symptom screening was associated with significantly better 8-week total SSPedi scores (adjusted mean difference, −3.8 [95% CI, −6.4 to −1.2]) and less bothersome individual symptoms, with 12 of 15 symptoms being statistically significantly reduced. There was no difference in fatigue or quality of life. The mean (SD) number of emergency department visits was 0.77 (1.12) in the symptom screening group and 0.45 (0.81) in the usual care group. There were significantly more emergency department visits in the symptom screening group (rate ratio, 1.72 [95% CI, 1.03-2.87]).
Conclusions
Symptom screening with symptom feedback and symptom management care pathways was associated with improved symptom scores and increased symptom-specific interventions. Future work should integrate symptom screening into routine clinical care.
Trial Registration
ClinicalTrials.gov Identifier: NCT04614662
This randomized cluster trial examines whether thrice-weekly symptom screening with symptom feedback and management care pathways, compared with usual care, improves overall self-reported symptoms in pediatric patients with cancer.
Introduction
Pediatric patients with cancer experience severely bothersome symptoms.1,2,3,4,5,6,7,8 Two approaches that may improve symptom control are routine symptom screening9 and clinical practice guideline–consistent care. To enable symptom screening, the Symptom Screening in Pediatrics Tool (SSPedi)10 and Supportive care Prioritization, Assessment and Recommendations for Kids (SPARK) were developed.11 SSPedi is a validated self-report symptom assessment tool for patients aged 8 to 18 years receiving cancer treatments. SPARK is a web application that enables access to SSPedi, generates symptom reports, and distributes reports to the health care team. To increase guideline-consistent care, a process was developed to create and locally adapt symptom management care pathways.12,13
In this cluster randomized clinical trial (RCT), the primary objective was to determine whether thrice-weekly symptom screening with symptom feedback and symptom management care pathways, compared with usual care, improves overall self-reported symptom scores in pediatric patients with cancer at 8 weeks.
Methods
This cluster RCT included patients from 20 pediatric oncology sites in the US (eTable 1 in Supplement 2). Sites were randomized to either intervention (symptom screening) or control groups. The intervention included participant prompts to complete symptom screening 3 times weekly via SPARK, provision of symptom reports to the health care team, and implementation of locally adapted care pathways for symptom management. The control group received usual care. The study was approved by The Hospital for Sick Children’s research ethics board, the Western institutional review board, and institutional review boards from all participating sites. Patients and their guardians provided informed written consent and assent as appropriate. The study was registered with ClinicalTrials.gov (NCT04614662). This report follows the CONSORT reporting guideline for RCTs. The trial protocol is provided in Supplement 1.
Participants
English- or Spanish-speaking pediatric patients newly diagnosed with cancer aged 8 to 18 years who were planned to undergo any chemotherapy, radiotherapy, or operation were eligible for inclusion. Participants were enrolled within 28 days after treatment initiation or cancer diagnosis, whichever occurred later. Exclusion criteria were recurrent disease, second malignancy, cognitive disability (attending lower than second grade or equivalent), or visual impairment (cannot see SPARK even with corrective lens). Cancer treatment may have begun prior to enrollment.
Procedures
Randomization
Once a site agreed that it would comply with both intervention and control group procedures, regulatory approvals were obtained and the site was randomized. Randomization was stratified on 2 site characteristics split at their medians: anticipated number of eligible patients who speak English or Spanish and historical percentage of patients with private insurance. Randomization sequence was computer-generated (block size of 2: 1 intervention and 1 control) and concealed from all participants and the health care and research teams. Once 2 or 4 sites within a stratum were ready for randomization, they were randomized in the order they became ready. Randomization of sites occurred from March 26, 2021, to February 17, 2022.
Site Preparation and Patient Enrollment
Before patient enrollment could be activated at the recently randomized intervention and control sites within each stratum, intervention sites had to accomplish 2 tasks: email configuration and care pathway adaptation. First, email configuration was required because patient symptom reports were distributed to the health care team by emails generated from that institution’s email domain. This approach was taken to reduce the likelihood that users would mistake the emails as spam. Configuration was accomplished in collaboration with each institution’s information technology team. Second, care pathway adaptation was required; the procedures used to develop template care pathways based on clinical practice guidelines12 and to adapt them for each intervention institution in consideration of their values, preferences, and resources have been previously described.13 Overall, 40.8% of template care pathway statements were adopted, 48.7% were adapted, and 6.4% were rejected across all intervention sites. eTable 2 in Supplement 2 shows examples of locally adapted care pathway statements for each SSPedi symptom and eTable 3 in Supplement 2 shows decisions made by individual intervention sites. The percentage of statements rejected ranged from 3.7% to 18.5% per site. The finalized care pathways were uploaded to SPARK.
Once these 2 steps were completed, the recently randomized intervention and control sites proceeded concurrently to activate their site to enrollment. Eligible participants were sequentially identified by site personnel with a goal to approach all potentially eligible patients. Those who declined to complete SSPedi and other patient-reported outcomes were asked if they would permit medical record review only. Demographic characteristics, including sex, age, race, ethnicity, cancer diagnosis, metastatic disease, planned or received treatment (chemotherapy, radiotherapy, or surgery), inpatient at enrollment, first language, and family socioeconomic information were collected from the participant’s family and medical record. Race and ethnicity were collected by parent report.
Intervention
Soon after site activation, the finalized locally adapted care pathways were widely disseminated to health care professionals and an implementation toolkit was provided to promote care pathway–consistent care. Sites could choose from the following items: training slides; materials that displayed a QR code to the local care pathways, including posters, pens, booklets, stickers, and magnets; and instruction for creating a shortcut to the local care pathways on devices or computers. These care pathways were in place before patients were enrolled and for the entire study duration.
Enrolled participants were prompted to complete symptom screening 3 times weekly via SPARK. Participants selected whether they wanted to receive reminders by text or email and whether they wanted a guardian to receive a concurrent reminder. They also chose the days and times of reminders. Participants used their own smartphone, tablet, or computer to perform symptom screening. If participants did not have a device, one was loaned to them for the study duration.
If participants reported at least 1 severely bothersome symptom (score of 3 or 4 on a scale ranging from 0-4), a symptom report containing the SSPedi symptom bar graph11 was emailed to the health care team. The local health care team determined who would receive the emails and the recipient(s) could change over time for an individual participant. The report included a link to the locally adapted symptom management care pathways.
Evaluations
For both groups, patient-reported outcomes consisting of SSPedi, Patient-Reported Outcomes Measurement Information System (PROMIS) Fatigue scale, and Pediatric Quality of Life (PedsQL) 3.0 Acute Cancer Module were administered in person or remotely by site clinical research associates at baseline, week 4 (±1 week), and week 8 (±1 week). Symptom documentation and interventions were abstracted from the medical record using procedures we developed.1 Abstractions were performed in duplicate by 2 independent clinical research associates. Findings were compared and disagreements were resolved by consensus. An arbitrator (L.S.) resolved cases in which consensus could not be achieved. Unplanned health care encounters were also abstracted from the medical record. At weeks 4 and 8, guardians were asked about health care visits to ensure that encounters outside the primary institution were captured.
Outcomes
The primary outcome was the 8-week self-reported total SSPedi score, which is the sum of the 15 SSPedi item scores. The total score ranges from 0 (no bothersome symptoms) to 60 (most bothersome symptoms). The recall period is “yesterday or today.” SSPedi is reliable, valid, and responsive to change in patients receiving cancer treatments aged 8 to 18 years.10 The designated 4- and 8-week SSPedi scores were obtained on the day the other patient-reported outcomes were obtained to distinguish SSPedi as an outcome rather than as part of the intervention.
Secondary outcomes were the 15 self-reported individual SSPedi symptom scores (range, 0-4), fatigue, and quality of life. Fatigue was measured using PROMIS Ped Bank v2.0–Fatigue scale (scaled to have mean [SD] score of 50 [10] against the US general population),14 where the recall period was the last 7 days. It is reliable and valid in patients with cancer aged 8 to 18 years.15 Higher scores indicate more fatigue. Quality of life was measured using the PedsQL 3.0 Acute Cancer Module, which produces 8 domain scores on a scale ranging from 0 to 100,16 where the recall period was the last 7 days. It is reliable and valid in patients with cancer aged 8 to 18 years.16 Higher scores indicate better health. All measures are validated for use in English and Spanish language.17,18
Other secondary outcomes were symptom documentation, symptom interventions (prophylactic or therapeutic), and the number of unplanned health care encounters (emergency department visits, unplanned clinic visits, and unplanned hospitalizations) over the 8-week period. For documentation and interventions, the abstraction window was a 3-day period extending from 1 day before to 1 day after the 4- and 8-week assessment points. Two intervention types were evaluated. Any intervention, regardless of attribution, was abstracted from a list of potential, previously defined interventions for specific symptoms.1 For example, acetaminophen was considered an intervention for pain even if it was administered for fever or an unknown reason and a child life specialist visit was considered an intervention for sadness, anxiety, and anger, regardless of visit reason. In contrast, a symptom-specific intervention was abstracted where the clinical documentation clearly noted that provision was for that symptom. These outcomes were specific to each of the 15 SSPedi symptoms and were binary variables (yes or no).
Statistical Analysis
The primary outcome was the 8-week total SSPedi score. We planned to enroll 444 participants to achieve 85% power assuming a minimal clinically important difference of 3, within-cluster SD of 8.8, intracluster correlation coefficient of 0.021 (all based on data from the SSPedi validation study),10 α = .05, a baseline covariate explaining 20% of variance, and 10% missing data.
The primary analysis used the patient-level 8-week total SSPedi score as the outcome in a mixed linear regression model with a random effect for site; fixed effects for treatment assignment, patient age (8-10, 11-14, and 15-18 years), and diagnosis group (leukemia/lymphoma, solid tumor and brain tumor); and 2 binary fixed effects at the cluster level for randomization stratification variables (see Supplement 2). The treatment effect was expressed as the covariate-adjusted mean difference between the groups with the 95% CI. The P value was based on the difference in mean week-8 score, not a difference in mean change in score. We did not plan to adjust the model for baseline total SSPedi score because some care pathway interventions might affect symptoms prior to enrollment and the baseline score may already reflect some benefit of the cluster’s treatment assignment. However, a sensitivity analysis that adjusted for baseline total SSPedi score was performed. We also evaluated the change in score (baseline to week 8) in a fully adjusted model that included baseline as recommended to control for potential imbalance.19,20,21 To account for potential differential enrollment of patients only undergoing an operation (who might not be cared for by oncology teams) between intervention vs control sites, we conducted a sensitivity analysis restricted to patients who received systemic chemotherapy. An ad hoc analysis also compared baseline total SSPedi score between the groups using the fully adjusted model.
For the secondary analysis comparing 8-week individual SSPedi symptoms in which each was considered an ordinal outcome (scored 0-4), a mixed effects proportional odds model was fit with random effect for site and fixed effects for treatment assignment and the 2 stratification variables. The treatment effect was expressed as the odds ratio (OR) with the 95% CI. The secondary outcomes of 8-week PROMIS Fatigue scale and PedsQL 3.0 Acute Cancer Module domain scores were analyzed using the same approach as the primary outcome.
For comparing secondary outcomes of documentation of symptoms, any intervention, and symptom-specific intervention between groups, we fit a mixed or fixed effects logistic regression model (details in eText in Supplement 2). Treatment effects were estimated using the OR and 95% CI. We took 3 approaches to this analysis. The first compared documentation and interventions for all participants. However, symptoms might be less common in the symptom screening group if the approach was effective at reducing symptoms. Thus, we also compared documentation and interventions among participants with a symptom-specific SSPedi score greater than or equal to 1 (any degree of bother) and greater than or equal to 3 (severely bothersome). The denominators in these analyses differed by symptom.
For secondary outcomes of unplanned health care encounters, the number of events per patient was counted over the 8-week period and compared between groups using mixed effects Poisson regression analyses, with a random effect for site and fixed effects for the 2 stratification variables. Robustness of these results was checked through analogous negative binomial models (eText in Supplement 2).
We did not plan interim or subgroup analyses. If more than 10% of data were missing, we planned multiple imputation. Sensitivity analyses and approach to missing data are shown in eFigure 1 in Supplement 2. The statistical analysis plan was uploaded to ClinicalTrials.gov before the analysis began. All analyses were performed using R, version 4.3.2 (R Foundation). All tests of significance were 2-sided and a P value <.05 was considered statistically significant.
Results
Between July 27, 2021, and August 22, 2023, a total of 687 patients were assessed for eligibility, 530 were approached, and 445 were enrolled: 221 at intervention sites and 224 at control sites. Fifteen enrolled as medical record review–only participants. Figure 1 illustrates site randomization, enrollment, and flow through the trial. The eText in Supplement 2 shows comparisons of those who agreed vs declined participation and those excluded due to physician preference. There was no significant difference in the percentage of patients who declined participation between intervention and control sites (16.6% vs 15.5%; P = .81). The number of missing 8-week SSPedi scores was 38 of 445 (8.5%) overall and 23 of 430 (5.3%) among nonmedical record review–only participants. The observed posterior distribution of intracluster correlation coefficient for 8-week total SSPedi scores was a median of 0.06 (95% credible interval, 0.01-0.16) and the coefficient of variation of site size was 0.61.
Figure 1. Site Randomization, Enrollment, and Flow Through the Trial of Symptom Screening.

SSPedi indicates Symptom Screening in Pediatrics Tool.
aRandomization was stratified by anticipated number of eligible patients who speak English or Spanish and historical percentage of patients with private insurance.
bThose who declined to contribute patient-reported outcomes were asked if they would permit medical record review only.
Table 1 shows baseline participant characteristics; the median (range) age was 14.8 (8.1-18.9) years and 262 participants (58.9%) were male. eTable 4 in Supplement 2 shows reasons participants stopped conducting symptom screening or providing study observations. Only 1 participant did not complete the planned observations. eTable 5 in Supplement 2 shows the number of participants who completed the SSPedi and other patient-reported outcomes at weeks 4 and 8. In the symptom screening group, the numbers of participants who competed the SSPedi were 216 at baseline, 208 at week 4, and 198 at week 8. In the usual care group, the numbers of participants who completed the SSPedi were 213 at baseline, 207 at week 4, and 209 at week 8.
Table 1. Baseline Demographic Characteristics by Group.
| Characteristic | No. (%) | |
|---|---|---|
| Symptom screening (n = 221) | Usual care (n = 224) | |
| Sex | ||
| Male | 133 (60.2) | 129 (57.6) |
| Female | 88 (39.8) | 95 (42.4) |
| Age, median (range), y | 15.0 (8.1-18.9) | 14.7 (8.1-18.9) |
| Age group, y | ||
| 8-10 | 33 (14.9) | 37 (16.5) |
| 11-14 | 77 (34.8) | 85 (37.9) |
| 15-18 | 111 (50.2) | 102 (45.5) |
| Racea | n = 177 | n = 183 |
| American Indian or Alaska Native | 2 (1.1) | 4 (2.2) |
| Asian | 13 (7.3) | 7 (3.8) |
| Black or African American | 13 (7.3) | 14 (7.7) |
| Native Hawaiian or Other Pacific Islander | 14 (7.9) | 1 (0.5) |
| White | 113 (63.8) | 145 (79.2) |
| More than 1 race | 22 (12.4) | 12 (6.6) |
| Ethnicity | n = 208 | n = 202 |
| Hispanic or Latino | 85 (40.9) | 63 (31.2) |
| Not Hispanic or Latino | 123 (59.1) | 139 (68.8) |
| First language English or Spanish | 211 (95.5) | 197 (87.9) |
| Inpatient at enrollment | 88 (39.8) | 88 (39.3) |
| Preferred language for patient-reported outcomes | ||
| English | 203 (91.9) | 201 (89.7) |
| Spanish | 13 (5.9) | 12 (5.4) |
| Not applicable or not availableb | 5 (2.3) | 11 (4.9) |
| Guardian married | 138 (62.4) | 141 (62.9) |
| Guardian employed full or part time | 125 (56.6) | 127 (56.7) |
| Guardian graduated from college or higher | 120 (54.3) | 133 (59.4) |
| Annual household income ≥$60 000 | 78 (35.3) | 103 (46.0) |
| Cancer diagnosis | ||
| Leukemia | 89 (40.3) | 62 (27.7) |
| Solid tumor | 73 (33.0) | 86 (38.4) |
| Lymphoma | 50 (22.6) | 61 (27.2) |
| Brain tumor | 9 (4.1) | 15 (6.7) |
| Metastatic disease | 45 (20.4) | 80 (35.7) |
| Cancer diagnosis to enrollment, median (IQR), d | 23 (16-29) | 21 (13-28) |
| Planned or received treatment | ||
| Chemotherapy | 210 (95.0) | 207 (92.4) |
| Radiotherapy | 20 (9.0) | 18 (8.0) |
| Surgical procedure | 23 (10.4) | 36 (16.1) |
Race and ethnicity were collected by parent report using limited categories; choosing more than 1 race was an option.
Preferred language for patient-reported outcomes was not applicable for participants enrolled as medical record review only and was not available for the 1 participant who withdrew from the study immediately after enrollment.
The mean (SD) 8-week SSPedi score was 7.9 (7.2) in the symptom screening group and 11.4 (8.7) in the usual care group. Table 2 and eTable 6 in Supplement 2 show that the adjusted 8-week total SSPedi scores were significantly better in the intervention group than in the control group (adjusted mean difference, −3.8 [95% CI, −6.4 to −1.2]; P = .007). Sensitivity analyses did not alter these findings (eFigure 1 in Supplement 2). eTable 7 in Supplement 2 shows that the baseline total SSPedi scores were significantly better in the intervention group (adjusted mean difference, −1.8 [95% CI, −3.5 to −0.1]; P = .04). Symptom screening improved 8-week total SSPedi scores even after inclusion of baseline SSPedi score in the model (eFigure 1 in Supplement 2). More specifically, when comparing the difference in scores from baseline between groups, symptom screening remained associated with better outcomes (mean difference, −3.0 [95% CI, −5.2 to −0.8]).
Table 2. Primary and Secondary Patient-Reported Outcomes at Baseline and Week 8 by Groupa.
| Baseline | Week 8 | Mean difference or odds ratio (95% CI)b | Adjusted P valuec |
||||
|---|---|---|---|---|---|---|---|
| Symptom screening (n = 216) | Usual care (n = 213) | Symptom screening (n = 198) | Usual care (n = 209) | Unadjusted | Adjusted | ||
| Primary outcome | |||||||
| Total SSPedi score, mean (SD)a | 11.8 (8.2) | 13.5 (8.2) | 7.9 (7.2) | 11.4 (8.7) | −3.7 (−6.3 to −1.1) | −3.8 (−6.4 to −1.2) | .007 |
| Secondary outcomes | |||||||
| Severely bothersome SSPedi symptoms (score of 3-4), No. (%) | |||||||
| Feeling disappointed or sad | 12 (5.6) | 15 (7.0) | 5 (2.5) | 11 (5.3) | 0.46 (0.24 to 0.89) | 0.46 (0.26 to 0.83) | .01 |
| Feeling scared or worried | 11 (5.1) | 23 (10.8) | 6 (3.0) | 7 (3.3) | 0.58 (0.38 to 0.88) | 0.57 (0.38 to 0.85) | .005 |
| Feeling cranky or angry | 9 (4.2) | 10 (4.7) | 5 (2.5) | 12 (5.7) | 0.43 (0.29 to 0.63) | 0.43 (0.29 to 0.63) | <.001 |
| Problems with thinking or remembering things | 15 (6.9) | 11 (5.2) | 7 (3.5) | 14 (6.7) | 0.60 (0.38 to 0.95) | 0.62 (0.42 to 0.90) | .01 |
| Changes in how your body or face look | 23 (10.6) | 24 (11.3) | 4 (2.0) | 21 (10.0) | 0.51 (0.30 to 0.89) | 0.52 (0.31 to 0.88) | .01 |
| Feeling tired | 57 (26.4) | 74 (34.7) | 28 (14.1) | 52 (24.9) | 0.52 (0.36 to 0.74) | 0.52 (0.36 to 0.74) | <.001 |
| Mouth sores | 8 (3.7) | 12 (5.6) | 0 (0.0) | 8 (3.8) | 0.49 (0.28 to 0.86) | 0.48 (0.27 to 0.85) | .01 |
| Headache | 8 (3.7) | 21 (9.9) | 10 (5.1) | 10 (4.8) | 0.60 (0.41 to 0.89) | 0.61 (0.41 to 0.90) | .01 |
| Hurt or pain (other than headache) | 10 (4.6) | 16 (7.5) | 11 (5.6) | 11 (5.3) | 0.70 (0.48 to 1.03) | 0.69 (0.47 to 1.01) | .06 |
| Tingly or numb hands or feet | 10 (4.6) | 11 (5.2) | 4 (2.0) | 10 (4.8) | 0.76 (0.50 to 1.15) | 0.76 (0.50 to 1.15) | .19 |
| Throwing up or feeling like you may throw up | 23 (10.6) | 29 (13.6) | 19 (9.6) | 27 (12.9) | 0.81 (0.50 to 1.34) | 0.80 (0.51 to 1.26) | .34 |
| Feeling more or less hungry than you usually do | 49 (22.7) | 51 (23.9) | 15 (7.6) | 35 (16.7) | 0.63 (0.43 to 0.94) | 0.63 (0.44 to 0.90) | .01 |
| Changes in taste | 31 (14.4) | 34 (16.0) | 11 (5.6) | 25 (12.0) | 0.56 (0.33 to 0.93) | 0.56 (0.34 to 0.90) | .02 |
| Constipation | 16 (7.4) | 20 (9.4) | 2 (1.0) | 9 (4.3) | 0.53 (0.27 to 1.06) | 0.55 (0.31 to 0.95) | .03 |
| Diarrhea | 18 (8.3) | 10 (4.7) | 4 (2.0) | 6 (2.9) | 0.38 (0.19 to 0.75) | 0.37 (0.19 to 0.73) | .004 |
| Other PROs | n = 216 | n = 213 | n = 202 | n = 209 | |||
| PROMIS Fatigue scores, mean (SD)a | 53.9 (12.1) | 54.6 (12.1) | 49.3 (13.3) | 49.8 (12.9) | −0.5 (−3.5 to 2.4) | −0.7 (−4.0 to 2.5) | .64 |
| PedsQL 3.0 domain score, mean (SD)a | |||||||
| Pain and hurt | 69.8 (26.6) | 68.8 (24.8) | 76.2 (26.5) | 76.1 (24.2) | −0.1 (−6.1 to 6.0) | 0.2 (−5.9 to 6.2) | .95 |
| Nausea | 73.9 (23.4) | 69.2 (20.7) | 71.1 (23.1) | 70.4 (23.3) | 0.9 (−5.7 to 7.6) | 1.3 (−4.9 to 7.6) | .66 |
| Procedural anxiety | 66.4 (30.3) | 62.8 (29.1) | 75.8 (27.9) | 71.1 (26.1) | 3.5 (−4.5 to 11.4) | 3.0 (−4.5 to 10.5) | .41 |
| Treatment anxiety | 77.7 (26.3) | 76.0 (23.4) | 83.9 (22.2) | 80.4 (23.0) | 2.9 (−3.4 to 9.3) | 2.9 (−3.4 to 9.1) | .34 |
| Worry | 64.7 (26.6) | 62.8 (22.8) | 72.9 (24.4) | 69.5 (24.4) | 3.1 (−2.8 to 9.1) | 3.6 (−2.4 to 9.6) | .22 |
| Cognitive problems | 70.3 (21.2) | 69.1 (20.6) | 75.3 (21.5) | 74.5 (21.4) | 0.9 (−5.4 to 7.2) | 1.2 (−5.5 to 7.9) | .71 |
| Perceived physical appearance | 74.7 (25.0) | 73.2 (26.4) | 77.6 (23.8) | 77.3 (24.6) | 0.2 (−5.1 to 5.4) | 0.6 (−5.0 to 6.1) | .83 |
| Communication | 77.8 (21.3) | 73.2 (21.7) | 79.6 (21.2) | 77.8 (21.2) | 1.8 (−2.6 to 6.3) | 1.8 (−3.1 to 6.6) | .45 |
Abbreviations: PedsQL, Pediatric Quality of Life Inventory; PROMIS, Patient-Reported Outcomes Measurement Information System; SSPedi, Symptom Screening in Pediatrics Tool.
The 8-week self-reported total SSPedi score (range, 0-60; higher scores indicate more bothersome symptoms) is the sum of 15 SSPedi item scores (range, 0-4); recall period is “yesterday or today.” Fatigue was measured using PROMIS v2.0–Fatigue (recall period of past 7 days); higher scores represent more fatigue. Quality of life was measured using the PedsQL 3.0 Acute Cancer Module, which produces 8 domain scores on a scale ranging from 0-100 (recall period of past 7 days). Higher scores indicate better health.
Estimated difference between the groups in 8-wk outcomes treated as continuous variables. Unadjusted models included only the stratification variables used for randomization (number of patients with cancer and percentage of patients with private insurance). Adjusted models: for continuous outcomes, treatment effect is the covariate-adjusted mean difference using a mixed linear regression model with a random effect for site, fixed effects for treatment assignment, patient age and diagnosis group and 2 binary fixed effects at the cluster level for stratification variables; for individual SSPedi symptoms, treatment effect is the odds ratio using a mixed effects proportional odds model with a random effect for site and fixed effects for treatment assignment and 2 stratification variables.
Based on the difference in mean 8-week score, not a difference in mean change in score.
Table 2, Figure 2, and eTable 8, eTable 9, and eFigure 2 in Supplement 2 show comparisons of individual SSPedi symptoms between groups. Symptom screening reduced the odds of higher scores for all symptoms; this reduction was statistically significant for 12 of 15 symptoms. Table 2 also shows that there was no significant difference in PROMIS Fatigue scores between the groups. Table 2 and eFigure 3 in Supplement 2 show that all adjusted mean differences for PedsQL 3.0 Acute Cancer Module domain scores were greater than 0, although none were statistically significant.
Figure 2. Symptoms Included in SSPedi by Group at Baseline and Week 8.
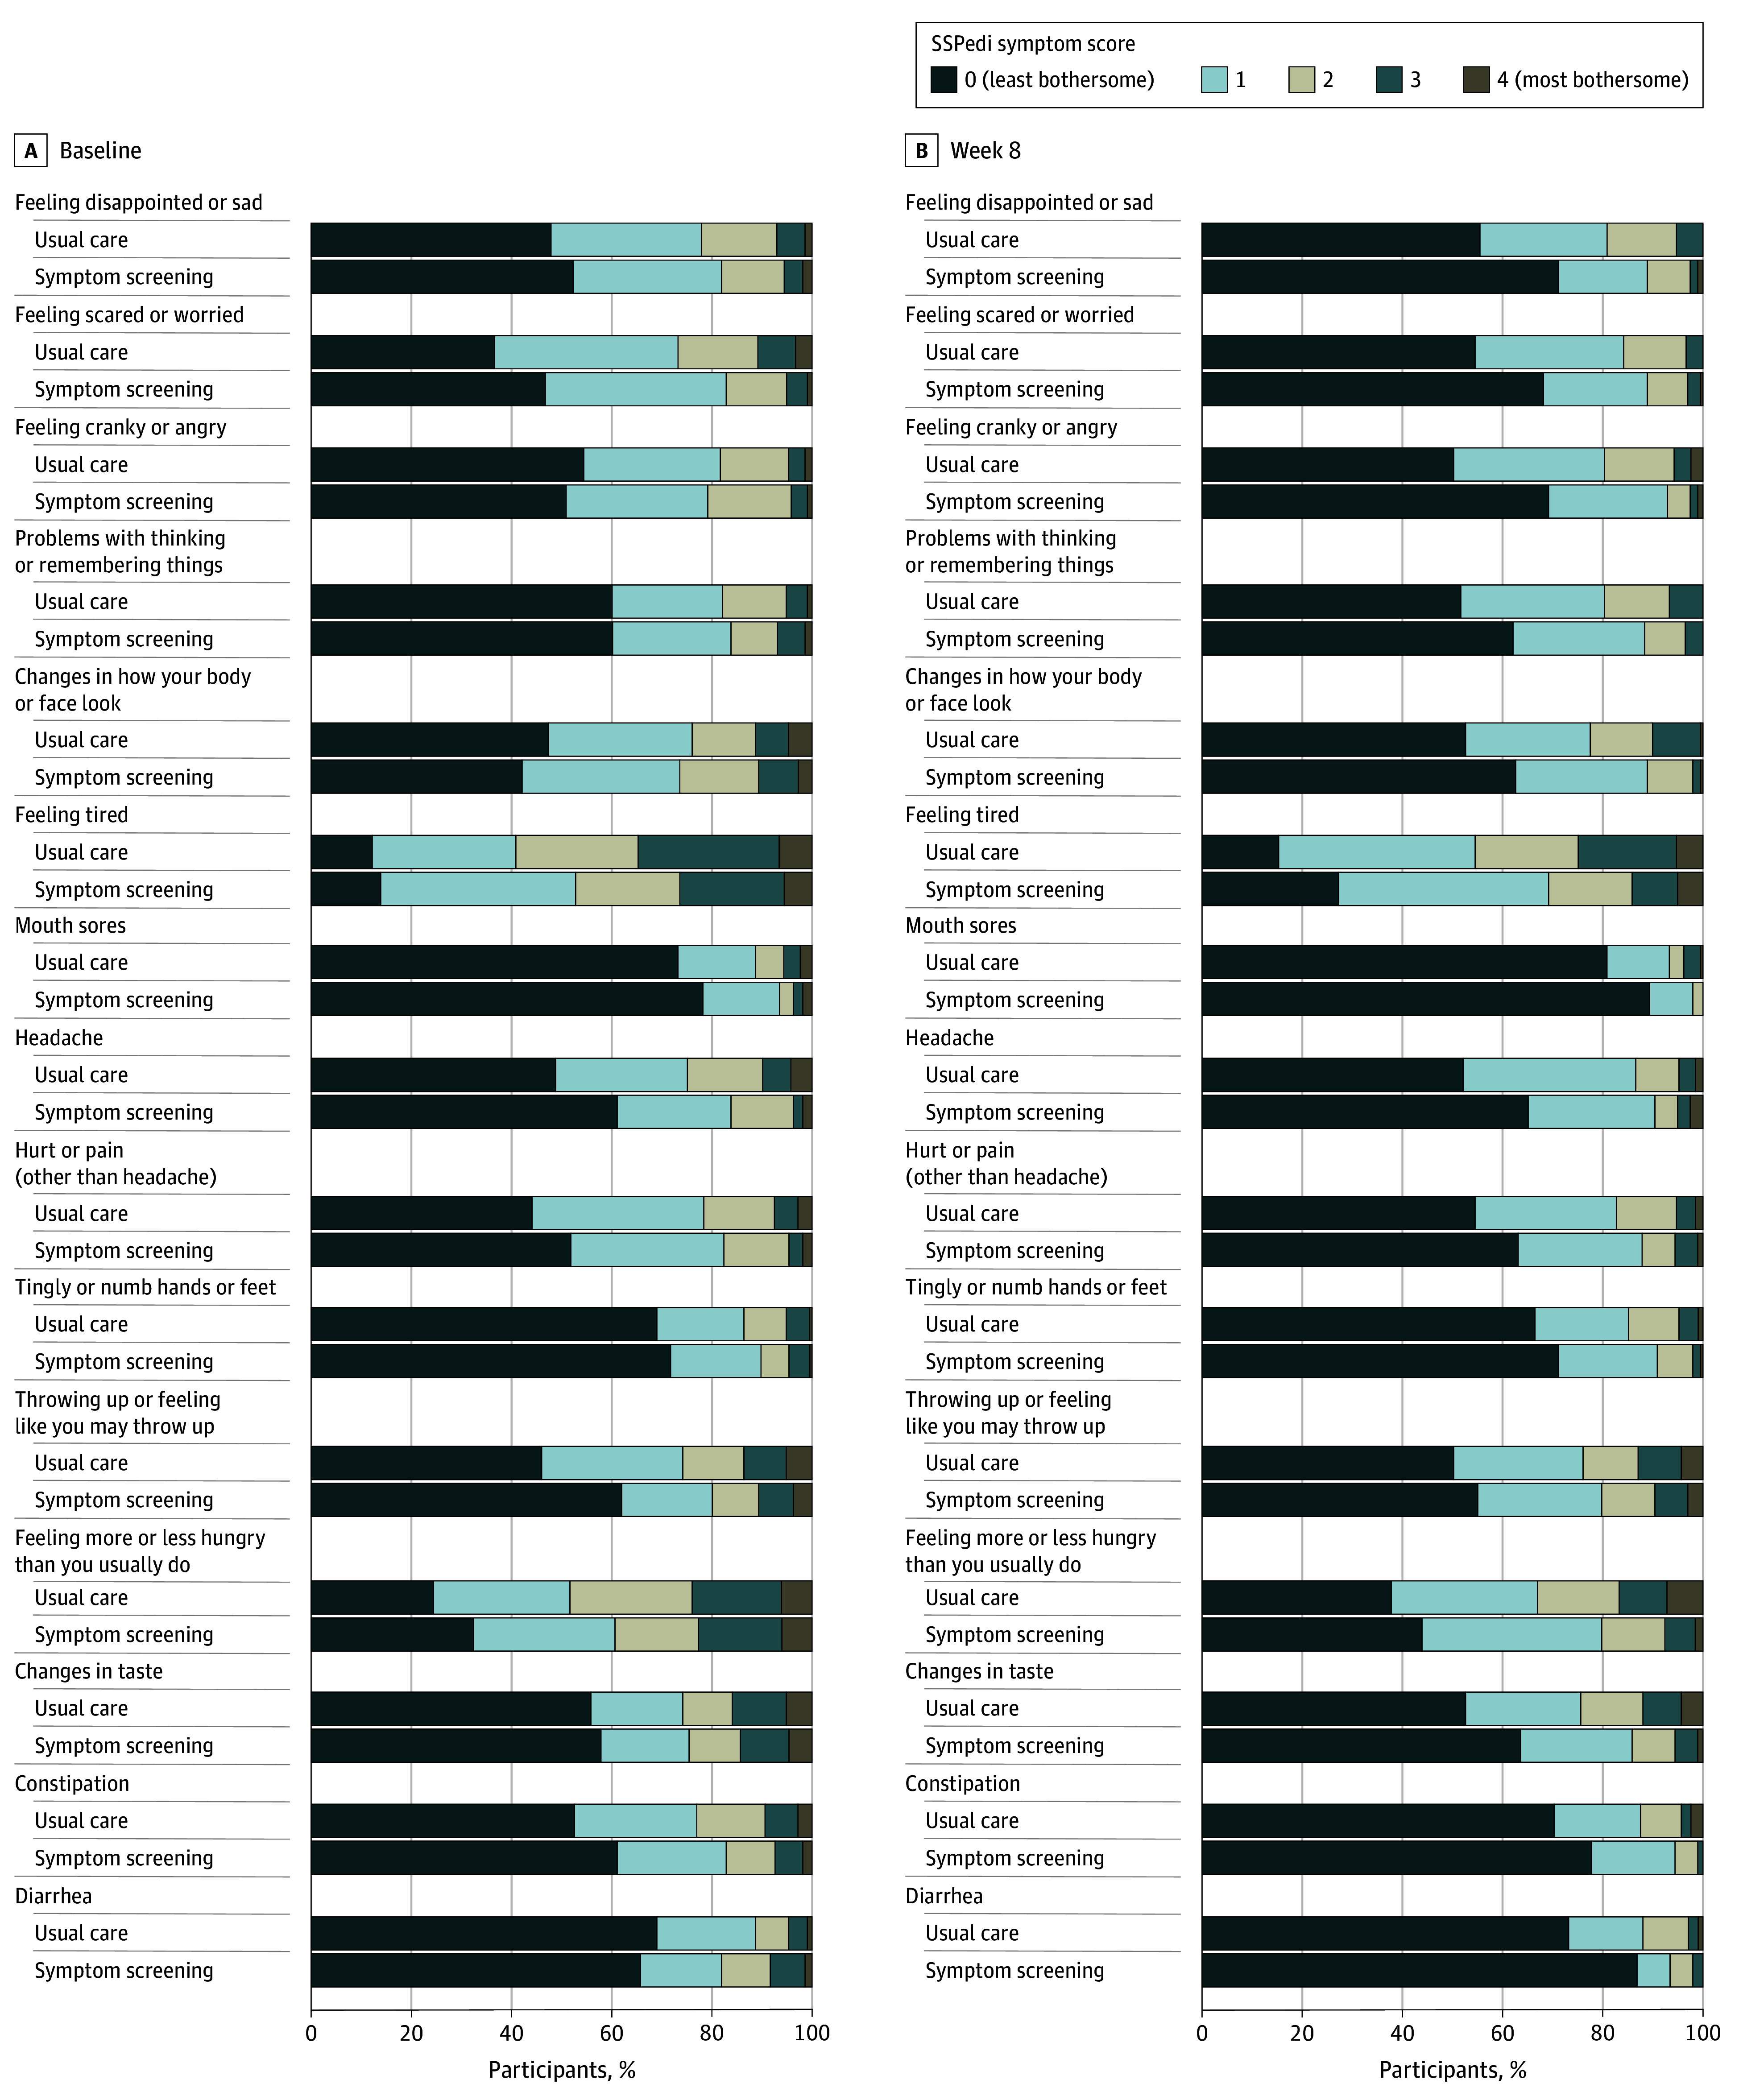
The number of participants is 198 in the symptom screening group and 209 in the usual care group. The 15 individual Symptom Screening in Pediatrics Tool (SSPedi) symptoms were scored from 0 to 4, where 0 indicates “not at all bothered” and 4 indicates “extremely bothered.” The recall period is “yesterday or today.”
eTables 10 and 11 in Supplement 2 show results related to symptom documentation, any intervention, and symptom-specific interventions. Among the symptom screening and usual care groups, fatigue (43/220 [19.5%] vs 61/224 [27.2%]) and changes in hunger (22/220 [10.0%] vs 37/224 [16.5%]) were documented in the symptom screening and usual care groups. Documentation was significantly more common in the usual care group for these symptoms (P = .04 for fatigue and P = .03 for changes in hunger). Further, intervention was provided in the symptom screening and usual care group for sadness (52/220 [23.6%] vs 82/224 [36.6%]) and anxiety (54/220 [24.5%] vs 96/224 [42.9%]) but was significantly more common in the usual care group for these symptoms (P = .05 for sadness and P = .01 for anxiety).
Symptom-specific interventions (provision clearly for the symptom) were provided for pain (40 patients [18.2%] in the symptom screening group vs 9 [4.0%] in the usual care group), peripheral neuropathy (8 patients [3.6%] in the symptom screening group), changes in hunger (10 [4.5%] in the symptom screening group), and constipation (15 [6.8%] in the symptom screening group vs 5 [2.2%] in the usual care group). Among those with any symptoms, symptom-specific interventions were provided for pain (25/73 [34.2%] vs 5/95 [5.3%]), peripheral neuropathy (6/57 [10.5%] vs 0/70), and changes in hunger (6/111 [5.4%] vs 0/130) in the symptom screening and usual care groups. Further, among those with severely bothersome symptoms, symptom-specific interventions were provided for feeling sad (4/5 [80.0%] vs 2/11 [18.2%]) and nausea and vomiting (7/19 [36.8%] vs 2/27 [7.4%]) in the symptom screening and usual care group. Overall, symptom-specific intervention was significantly more common in the symptom screening group for pain, peripheral neuropathy and changes in hunger among all participants and among those with SSPedi score greater than or equal to 1. Symptom-specific intervention was also more common in the symptom screening group for constipation among all participants and for sadness, pain, and nausea/vomiting among those with SSPedi score greater than or equal to 3.
Table 3 and eTable 12 in Supplement 2 show the comparison of unplanned health care encounters between the groups. The mean (SD) number of emergency department visits was 0.77 (1.12) in the symptom screening group and 0.45 (0.81) in the usual care group. There were significantly more emergency department visits in the intervention group than the usual care group (rate ratio, 1.72 [95% CI, 1.03-2.87]), with no significant differences in unplanned clinic visits and hospitalizations.
Table 3. Number of Unplanned Health Care Encounters by Groupa.
| Unplanned encounter type | Symptom screening (n = 220) | Usual care (n = 224) | Absolute difference (95% CrI)b | Rate ratio (95% CI)b | Adjusted P value |
|---|---|---|---|---|---|
| Total emergency department visits and unplanned clinic visits and admissions | |||||
| Mean (SD) | 1.82 (2.34) | 1.12 (1.62) | 6.13 (−1.56 to 14.51) | 1.46 (0.97 to 2.19) | .07 |
| Rate per 100 patient-weeks | 22.8 | 14.0 | |||
| No. of encounters, No. (%) | |||||
| 0 | 95 (43.2) | 117 (52.2) | |||
| 1 | 22 (10.0) | 40 (17.9) | |||
| 2 | 42 (19.1) | 34 (15.2) | |||
| 3 | 22 (10.0) | 11 (4.9) | |||
| 4 | 17 (7.7) | 11 (4.9) | |||
| 5 | 5 (2.3) | 6 (2.7) | |||
| ≥6 | 17 (7.7) | 5 (2.2) | |||
| Emergency department visits | |||||
| Mean (SD) | 0.77 (1.12) | 0.45 (0.81) | 3.38 (−0.57 to 7.94) | 1.72 (1.03 to 2.87) | .04 |
| Rate per 100 patient-weeks | 9.6 | 5.6 | |||
| No. of encounters, No. (%) | |||||
| 0 | 126 (57.3) | 155 (69.2) | |||
| 1 | 49 (22.3) | 48 (21.4) | |||
| 2 | 25 (11.4) | 14 (6.2) | |||
| 3 | 12 (5.5) | 5 (2.2) | |||
| 4 | 7 (3.2) | 1 (0.4) | |||
| 5 | 0 | 1 (0.4) | |||
| ≥6 | 1 (0.5) | 0 | |||
| Unplanned clinic visits | |||||
| Mean (SD) | 0.40 (1.09) | 0.24 (0.58) | −0.01 (−3.23 to 3.04) | 1.01 (0.41 to 2.50) | .99 |
| Rate per 100 patient-weeks | 5.1 | 3.0 | |||
| No. of encounters, No. (%) | |||||
| 0 | 174 (79.1) | 182 (81.2) | |||
| 1 | 27 (12.3) | 34 (15.2) | |||
| 2 | 11 (5.0) | 5 (2.2) | |||
| ≥3 | 8 (3.6) | 3 (1.3) | |||
| Unplanned hospital admissions | |||||
| Mean (SD) | 0.65 (0.93) | 0.43 (0.81) | 2.28 (−0.59 to 5.16) | 1.40 (0.96 to 2.03) | .08 |
| Rate per 100 patient-weeks | 8.1 | 5.4 | |||
| No. of encounters, No. (%) | |||||
| 0 | 130 (59.1) | 161 (71.9) | |||
| 1 | 51 (23.2) | 40 (17.9) | |||
| 2 | 28 (12.7) | 13 (5.8) | |||
| 3 | 8 (3.6) | 9 (4.0) | |||
| 4 | 3 (1.4) | 1 (0.4) | |||
Abbreviations: CrI, credible interval.
No participant had less than 8 weeks of follow-up.
Treatment effect was the rate ratio with 95% CI estimated using mixed effects Poisson regression with treatment, random effect for site, and 2 stratification variables based on the anticipated number of eligible patients who speak English or Spanish and historical percentage of patients with private insurance. The absolute rate difference per 100 patient-weeks was estimated by marginalizing over a mixed effects Poisson regression that included only treatment and a random effect for site.
Discussion
In this cluster RCT, symptom screening with provision of symptom reports to the health care team and locally adapted symptom management care pathway implementation significantly reduced overall symptom scores compared with usual care. The study provides high-quality evidence that an intervention including symptom screening improves symptom control, a finding consistent with adult clinical trials.9,22,23
Although symptom screening improved SSPedi symptoms, it did not improve PROMIS Fatigue or PedsQL domain scores. This may have occurred because these instruments measure different constructs: SSPedi focuses on degree of symptom-related bother, while PROMIS and PedsQL focus on symptom frequency. Increased documentation and any intervention for some symptoms in participants in the usual care group suggest they were experiencing more symptoms compared with those in the symptom screening group. It is also possible that repeated administration of SSPedi leads to habituation and decreased symptom perception. Alternatively, simply administering SSPedi repeatedly may reduce bothersome symptoms, which could, in itself, make the intervention worthwhile even if the desired outcome was achieved via a different mechanism than originally hypothesized.
The number of participants in the symptom screening group who received care pathway–consistent interventions was surprisingly low. It was previously demonstrated that interventions are rare for symptom management in patients with pediatric cancer overall.1 It is possible that low rates of care pathway–consistent care were observed because SSPedi symptoms are not prioritized by clinicians or because sites’ care pathway implementation efforts were inadequate. This suggests that symptom control needs to be explicitly prioritized by institutional leadership and that achievement of care pathway–consistent supportive care delivery requires purposeful, targeted implementation that includes systems for tracking symptoms, rates of care pathway-consistent intervention, and associated patient outcomes.24
This study used SSPedi as both the intervention and outcome. The primary rationale was that the purpose of the intervention was to reduce symptom bother rather than frequency or severity. SSPedi was the only validated instrument to measure this construct in a fashion suitable for pediatric patients when the study was developed,25 justifying this approach.
The symptom screening group was more likely to receive symptom-specific intervention, but also visited the emergency department more often. It was anticipated that symptom screening would identify symptoms early and result in prompt management. Thus, it was hypothesized that symptom screening would reduce unplanned encounters. The contrasting finding suggests that symptoms that require medical attention are being identified more frequently, likely by parents, with symptom screening. Although this result was unexpected, it does not influence the interpretation of the study outcomes and results. Future work should focus on better symptom prevention strategies and better outpatient supports to reduce emergency department visits.
In the original statistical analysis plan, it was hypothesized that baseline total SSPedi score might reflect the cluster’s treatment assignment because care pathway implementation could reduce symptoms prior to enrollment. The analysis shows that baseline total SSPedi score was significantly better in the intervention group, suggesting that exposure to care pathways independently improves symptoms.
Strengths of this study include the cluster RCT design, the pairing of symptom identification and management, and use of 2 reviewers to abstract documentation and interventions from the medical records.
Limitations
This study has several limitations. First, although a reduction in total SSPedi scores of 3.8 associated with the intervention was demonstrated, more work is required to better understand the clinical relevance of SSPedi score differences. Second, granular interventions, such as specific medication administrations at baseline or follow-up, were not compared. Third, documentation and interventions were measured during a 3-day window around 4- and 8-week assessments. It is possible that documentation and intervention rates outside of these windows would have shown divergence between the groups.
Conclusions
Symptom screening with symptom feedback and symptom management care pathways improved SSPedi scores and increased symptom-specific interventions among pediatric patients with cancer. These findings provide strong support for integrating symptom screening and care pathways into routine clinical care.
Trial protocol
eTable 1: Participating Sites
eTable 2: Number of Care Pathway Template Statements and Examples of Statements and Local Adaptations for each SSPedi Symptom
eTable 3: Distribution of Care Pathway Adaptation Decisions by Site
eTable 4: Reasons Off-Protocol (Symptom Screening Only) and Off-Study (Both Groups)
eTable 5: Number of Participants Remaining on Study and Completing SSPedi and other PROs at Baseline, Week 4 and Week 8
eTable 6: Fully Adjusted Primary Analysis of the Week-8 Total SSPedi Score
eTable 7: Fully Adjusted Analysis of Baseline Total SSPedi Score
eTable 8: Absolute Risk Difference in Week-8 Severely Bothersome Symptoms
eTable 9: Primary and Secondary Patient-Reported Outcomes by Week 4 and Group
eTable 10: Symptom Documentation and Interventions by Group at Week 8
eTable 11: Whether Interventions Provided were Consistent with Adapted Care Pathways for Intervention Sites at Week 8
eTable 12: Analysis of Healthcare Encounters Using Poisson Regression and Negative Binomial Models
eFigure 1: Sensitivity Analyses and Approach to Missing Data
eFigure 2: Association between Symptom Screening Intervention and Higher (Worse) SSPedi Score for each Symptom included in SSPedi at Week 8
eFigure 3: Summary of Adjusted Estimates for Acute Cancer PedsQL Domain Scores at Week 8
eText
References
Data sharing statement
References
- 1.Hyslop S, Davis H, Duong N, et al. Symptom documentation and intervention provision for symptom control in children receiving cancer treatments. Eur J Cancer. 2019;109:120-128. doi: 10.1016/j.ejca.2019.01.002 [DOI] [PubMed] [Google Scholar]
- 2.Hyslop S, Tomlinson D, Baggott C, et al. Feeling scared or worried self-report in children receiving cancer treatments using the Symptom Screening in Pediatrics Tool (SSPedi). Support Care Cancer. 2021;29(6):3137-3144. doi: 10.1007/s00520-020-05818-x [DOI] [PubMed] [Google Scholar]
- 3.Johnston DL, Hyslop S, Tomlinson D, et al. Describing symptoms using the Symptom Screening in Pediatrics Tool in hospitalized children with cancer and hematopoietic stem cell transplant recipients. Cancer Med. 2018;7(5):1750-1755. doi: 10.1002/cam4.1433 [DOI] [PMC free article] [PubMed] [Google Scholar]
- 4.Loves R, Plenert E, Tomlinson V, et al. Changes in hunger among pediatric patients with cancer and hematopoietic stem cell transplantation recipients. Support Care Cancer. 2020;28(12):5795-5801. doi: 10.1007/s00520-020-05425-w [DOI] [PubMed] [Google Scholar]
- 5.Loves R, Plenert E, Tomlinson V, et al. Changes in taste among pediatric patients with cancer and hematopoietic stem cell transplantation recipients. Qual Life Res. 2019;28(11):2941-2949. doi: 10.1007/s11136-019-02242-5 [DOI] [PubMed] [Google Scholar]
- 6.Loves R, Tomlinson D, Baggott C, et al. Taste changes in children with cancer and hematopoietic stem cell transplant recipients. Support Care Cancer. 2019;27(6):2247-2254. doi: 10.1007/s00520-018-4509-2 [DOI] [PubMed] [Google Scholar]
- 7.Tomlinson D, Baggott C, Dix D, et al. Severely bothersome fatigue in children and adolescents with cancer and hematopoietic stem cell transplant recipients. Support Care Cancer. 2019;27(7):2665-2671. doi: 10.1007/s00520-018-4555-9 [DOI] [PubMed] [Google Scholar]
- 8.Tomlinson D, Chakkalackal L, Calligan M, et al. Symptom documentation and intervention in paediatric cancer care-association with severity: observational study. BMJ Support Palliat Care. 2024;13(e3):e1265-e1271. doi: 10.1136/spcare-2022-003874 [DOI] [PubMed] [Google Scholar]
- 9.Basch E, Deal AM, Kris MG, et al. Symptom monitoring with patient-reported outcomes during routine cancer treatment: a randomized controlled trial. J Clin Oncol. 2016;34(6):557-565. doi: 10.1200/JCO.2015.63.0830 [DOI] [PMC free article] [PubMed] [Google Scholar]
- 10.Dupuis LL, Johnston DL, Baggott C, et al. Validation of the Symptom Screening in Pediatrics Tool in children receiving cancer treatments. J Natl Cancer Inst. 2018;110(6):661-668. doi: 10.1093/jnci/djx250 [DOI] [PMC free article] [PubMed] [Google Scholar]
- 11.Cook S, Vettese E, Soman D, et al. Initial development of Supportive care Assessment, Prioritization and Recommendations for Kids (SPARK), a symptom screening and management application. BMC Med Inform Decis Mak. 2019;19(1):9. doi: 10.1186/s12911-018-0715-6 [DOI] [PMC free article] [PubMed] [Google Scholar]
- 12.Tomlinson D, Robinson PD, Gibson P, et al. Creating and adapting an infection management care pathway in pediatric oncology. Support Care Cancer. 2022;30(10):7923-7934. doi: 10.1007/s00520-022-07216-x [DOI] [PubMed] [Google Scholar]
- 13.Vettese E, Sherani F, King AA, et al. Symptom management care pathway adaptation process and specific adaptation decisions. BMC Cancer. 2023;23(1):350. doi: 10.1186/s12885-023-10835-0 [DOI] [PMC free article] [PubMed] [Google Scholar]
- 14.Health Measures . PROMIS. Updated March 27, 2023. Accessed January 8, 2023. https://www.healthmeasures.net/explore-measurement-systems/promis
- 15.Hinds PS, Nuss SL, Ruccione KS, et al. PROMIS pediatric measures in pediatric oncology: valid and clinically feasible indicators of patient-reported outcomes. Pediatr Blood Cancer. 2013;60(3):402-408. doi: 10.1002/pbc.24233 [DOI] [PubMed] [Google Scholar]
- 16.Varni JW, Burwinkle TM, Katz ER, Meeske K, Dickinson P. The PedsQL in pediatric cancer: reliability and validity of the Pediatric Quality of Life Inventory Generic Core Scales, Multidimensional Fatigue Scale, and Cancer Module. Cancer. 2002;94(7):2090-2106. doi: 10.1002/cncr.10428 [DOI] [PubMed] [Google Scholar]
- 17.Larouche V, Revon-Rivière G, Johnston D, et al. Translating the Symptom Screening in Pediatrics Tool (SSPedi) into French and among French-speaking children receiving cancer treatments, evaluating understandability and cultural relevance in a multiple-phase descriptive study. BMJ Open. 2020;10(4):e035265. doi: 10.1136/bmjopen-2019-035265 [DOI] [PMC free article] [PubMed] [Google Scholar]
- 18.Plenert E, Grimes A, Sugalski A, et al. Translating the Symptom Screening in Paediatrics Tool (SSPedi) into North American Spanish and Among Spanish-speaking children receiving cancer treatments: evaluating understandability and cultural relevance in a multiple-phase descriptive study. BMJ Open. 2020;10(11):e037406. doi: 10.1136/bmjopen-2020-037406 [DOI] [PMC free article] [PubMed] [Google Scholar]
- 19.Vickers AJ, Altman DG. Statistics notes: analysing controlled trials with baseline and follow up measurements. BMJ. 2001;323(7321):1123-1124. doi: 10.1136/bmj.323.7321.1123 [DOI] [PMC free article] [PubMed] [Google Scholar]
- 20.Vickers AJ. The use of percentage change from baseline as an outcome in a controlled trial is statistically inefficient: a simulation study. BMC Med Res Methodol. 2001;1(1):6. doi: 10.1186/1471-2288-1-6 [DOI] [PMC free article] [PubMed] [Google Scholar]
- 21.Clifton L, Clifton DA. The correlation between baseline score and post-intervention score, and its implications for statistical analysis. Trials. 2019;20(1):43. doi: 10.1186/s13063-018-3108-3 [DOI] [PMC free article] [PubMed] [Google Scholar]
- 22.Mooney K, Berry DL, Whisenant M, Sjoberg D. Improving cancer care through the patient experience: how to use patient-reported outcomes in clinical practice. Am Soc Clin Oncol Educ Book. 2017;37:695-704. doi: 10.1200/EDBK_175418 [DOI] [PubMed] [Google Scholar]
- 23.Basch E, Schrag D, Henson S, et al. Effect of electronic symptom monitoring on patient-reported outcomes among patients with metastatic cancer: a randomized clinical trial. JAMA. 2022;327(24):2413-2422. doi: 10.1001/jama.2022.9265 [DOI] [PMC free article] [PubMed] [Google Scholar]
- 24.Sugalski AJ, Lo T, Beauchemin M, et al. Facilitators and barriers to clinical practice guideline-consistent supportive care at pediatric oncology institutions: a Children’s Oncology Group study. Implement Sci Commun. 2021;2(1):106. doi: 10.1186/s43058-021-00200-2 [DOI] [PMC free article] [PubMed] [Google Scholar]
- 25.Tomlinson D, Dupuis LL, Gibson P, et al. Initial development of the Symptom Screening in Pediatrics Tool (SSPedi). Support Care Cancer. 2014;22(1):71-75. doi: 10.1007/s00520-013-1945-x [DOI] [PubMed] [Google Scholar]
Associated Data
This section collects any data citations, data availability statements, or supplementary materials included in this article.
Supplementary Materials
Trial protocol
eTable 1: Participating Sites
eTable 2: Number of Care Pathway Template Statements and Examples of Statements and Local Adaptations for each SSPedi Symptom
eTable 3: Distribution of Care Pathway Adaptation Decisions by Site
eTable 4: Reasons Off-Protocol (Symptom Screening Only) and Off-Study (Both Groups)
eTable 5: Number of Participants Remaining on Study and Completing SSPedi and other PROs at Baseline, Week 4 and Week 8
eTable 6: Fully Adjusted Primary Analysis of the Week-8 Total SSPedi Score
eTable 7: Fully Adjusted Analysis of Baseline Total SSPedi Score
eTable 8: Absolute Risk Difference in Week-8 Severely Bothersome Symptoms
eTable 9: Primary and Secondary Patient-Reported Outcomes by Week 4 and Group
eTable 10: Symptom Documentation and Interventions by Group at Week 8
eTable 11: Whether Interventions Provided were Consistent with Adapted Care Pathways for Intervention Sites at Week 8
eTable 12: Analysis of Healthcare Encounters Using Poisson Regression and Negative Binomial Models
eFigure 1: Sensitivity Analyses and Approach to Missing Data
eFigure 2: Association between Symptom Screening Intervention and Higher (Worse) SSPedi Score for each Symptom included in SSPedi at Week 8
eFigure 3: Summary of Adjusted Estimates for Acute Cancer PedsQL Domain Scores at Week 8
eText
References
Data sharing statement