

SUMMARY
Ischemic stroke and cerebral amyloid angiopathy (CAA) pose significant challenges in an aging population, particularly in post-stroke recovery. Using the 5xFAD mouse model, we explore the relationship between CAA, ischemic stroke, and tissue recovery. We hypothesize that amyloid-beta accumulation worsens stroke outcomes by inducing blood-brain barrier (BBB) dysfunction, leading to impaired neurogenesis. Our findings show that CAA exacerbates stroke outcomes, with mice exhibiting constricted BBB microvessels, reduced cerebral blood flow, and impaired tissue recovery. Transcriptional analysis shows that endothelial cells and neural progenitor cells (NPCs) in the hippocampus exhibit differential gene expression in response to CAA and stroke, specifically targeting the phosphatidylinositol 3-kinase (PI3K) pathway. In vitro experiments with human NPCs validate these findings, showing that disruption of the CXCL12-PIK3C2A-CREB3L2 axis impairs neurogenesis. Notably, PI3K pathway activation restores neurogenesis, highlighting a potential therapeutic approach. These results suggest that CAA combined with stroke induces microvascular dysfunction and aberrant neurogenesis through this specific pathway.
Graphical abstract

In brief
Osborne et al. use the 5xFAD mouse model to show that cerebral amyloid angiopathy impairs stroke recovery by disrupting the interaction between blood-brain barrier endothelial cells and hippocampal NPCs. Mechanistically, they demonstrate that reactivating the PI3K/CREB pathway stimulates adult neurogenesis, suggesting potential therapeutic strategies to enhance tissue recovery post stroke.
INTRODUCTION
The growing aging population has significantly increased the prevalence of neurological diseases, particularly stroke and amyloid pathologies such as cerebral amyloid angiopathy (CAA), which presents a serious public healthcare challenge. As people live longer, the incidence of stroke and amyloid-related conditions naturally rises, affecting both brain degeneration and vascular health. Stroke remains one of the most critical rehabilitative challenges, as treatments often come too late, resulting in lasting brain damage. CAA, marked by amyloid-beta (Aβ) deposits around blood vessels in the brain, further complicates stroke recovery by affecting blood flow and cognitive function.
CAA is not just associated with normal aging but can accelerate neurological decline, especially in regions such as the hippocampus, which is vital for memory and learning. The accumulation of Aβ in the brain’s vasculature increases the risk of microinfarcts, delayed recovery after a stroke, and cognitive impairment.1 This is especially evident in more advanced stages of CAA, where amyloid buildup in the hippocampus exacerbates cognitive decline.2 Several studies have shown the cooccurrence of CAA and Alzheimer’s disease (AD). In terms of domain-specific performance, CAA is correlated with decreased executive function in individuals with AD and stroke, with the presence of ischemic lesions underscoring most of the impaired cognitive processing.3The combined effect of CAA and stroke results in worsened outcomes due to reduced blood flow, contributing to impaired neurogenesis and increasing the risk of dementia. While past studies have focused mainly on the hemorrhagic effects of CAA, recent research highlights the importance of understanding its ischemic manifestations.4,5
Amyloid accumulation in CAA compromises the architecture of cerebral vessels, impairing recovery by restricting blood flow and essential nutrients needed for tissue repair.6 The integrity of vessel wall architecture is crucial for post-stroke tissue recovery since cerebral blood flow (CBF) is critical for the delivery of nutrients and proper growth signaling cues required for the repair of damaged tissue and cells. This cerebral hypoperfusion is a common factor in both AD and stroke, leading to cognitive decline and increased dementia risk.7,8 However, the interaction between ischemic stroke and CAA remains poorly understood, especially in terms of their mutual impact on neurogenesis near the blood-brain barrier (BBB).
Our current understanding of brain homeostasis and neural plasticity suggests that neurogenesis occurs in the adult brain. Adult neurogenesis is considered a crucial regulator of neuroplasticity and repair, serving as a pivotal element in learning and memory functions.9,10 Neurogenic niches facilitating adult neurogenesis originate from precursor cells, specifically neural progenitor cells (NPCs), located in various regions of the brain, including the sub-granular zone (SGZ) and the dentate gyrus (DG) in the hippocampus. The newly derived neurons (Neus) are incorporated into normal hippocampal structures and participate in learning and memory tasks.11–13 Many proliferative NPCs are communicating with the cerebral vasculature, either through physical contact with vessels lacking pericytes (PCs) and integrin-mediated signaling pathways or through secreted growth factors and other ligands.14,15 Thus, the integrity of the brain endothelium is vital for the normal self-renewal, proliferation, and migration of NPCs into mature Neus.16
In our study, we hypothesized that Aβ accumulation in the cerebral vasculature worsens stroke outcomes by disrupting the BBB and interfering with neurogenesis. Using the 5xFAD mouse model, which mimics amyloid buildup, we examined the combined effects of CAA and ischemic stroke. Our research shows that the presence of both conditions exacerbates tissue damage, leads to greater BBB dysfunction, and impairs neuronal recovery. Through single-cell RNA sequencing (scRNA-seq) of brain tissue, we identified specific molecular changes in both NPCs and endothelial cells (ECs) of the BBB, highlighting pathways critical for growth, migration, and repair after injury.17
Although there is no definitive treatment for CAA-related stroke damage, our findings provide new insights into how CAA and stroke interact, offering potential targets for future therapies. Given that most patients with AD also present with CAA, addressing the dual impact of these conditions could inform better treatments for both diseases.
RESULTS
CAA differentially worsens ischemia and delays tissue recovery after stroke
To study the effects of human amyloid plaques in the brain and their effect on post-stroke recovery in the microvasculature, we utilized 5xFAD mice expressing human amyloid precursor protein (APP) and presenilin 1 (PSEN1) mutations crossbred with a congenic C57BL/6J genetic background. The 5xFAD mice were bred and used at 12 months of age to closely match a model of age-related human CAA.18 The mice were randomly assigned to four treatment groups: (1) APPswWT; huPSEN1WT/sham (wild-type [WT] sham); (2) APPswWT; huPSEN1WT/middle cerebral artery occlusion (MCAO) (WT MCAO); (3) APPswHet; huPSEN1Het/sham (5xFAD sham); and (4) APPswHet; huPSEN1Het/MCAO (5xFAD MCAO). The heterozygous genotype was used as a less severe phenotype for plaque accumulation instead of homozygous. The stroke treatment groups were exposed to a 60-min transient ischemia using the MCAO and the mice were analyzed for phenotypical differences at 24 h and 7 days post stroke to assess the acute recovery phase of cerebral ischemia in the presence and absence of CAA (Figure 1A). Previously, our lab has shown that infarct size in mice is the most severe between days 4 and 7 post MCAO, so we validated and extended this observation in our current analysis.19 As hypothesized, a significant drop in the doppler readout was found immediately after MCAO. Interestingly, reperfusion of CBF was significantly increased in WT mice compared to 5xFAD in the ipsilateral hemisphere (Figures 1B and S1A). Both occlusion and reperfusion time points were measured in the amyloid-expressing mice; however, a significant drop in percentage of reperfusion CBF was observed in 5xFAD mice, indicating an impairment in vascular recovery after infarct in the 5xFAD mice compared to the WT mice (Figures 1C and 1D). To examine if the expression of amyloid impacts infarct size post stroke, we performed 2,3,5-triphenyltetrazolium chloride (TTC) staining on the mouse brains at 24 h and 7 days post stroke (Figures 1E and S1B, respectively). No statistically significant change in infarct size was observed 24 h post stroke between 5xFAD and WT mice, indicating similar levels of acute tissue damage post stroke (Figure S1C). Although infarct size was not appreciably different at 24 h post stroke between the 5xFAD and WT mice, the 5xFAD mice had significantly larger infarcts 7 days post stroke compared to the WT mice, suggesting that 5xFAD mice have a diminished repair response to the tissue injury (Figures 1F and 1G). These results indicate that amyloid burden due to CAA exacerbates infarct size and delays spontaneous tissue recovery over 7 days compared to 24 h. Physically, the mice in the stroke groups showed a significant increase in their weight loss up to 7 days post stroke compared to sham (Figure S1E). Mortality rates is an important predictor for recovery outcomes, with a high continuous excess risk of death in the acute and subacute time points.20 Therefore, we measured mortality differences due to each genotype and found a significantly greater likelihood of death in the 5xFAD MCAO group compared to WT, supporting the hypothesis that CAA reduces the brain’s plasticity and spontaneous recovery following a stroke (Figure S1F). Thioflavin S (ThioS) fluorescence, a pan-amyloid marker, was found exclusively in the 5xFAD brain for both the sham and MCAO treatments (Figures 1H and 1I). The presence of Aβ in the cortex and hemisphere was elevated in the 5xFAD sham group compared to 5xFAD MCAO, while the hippocampus displayed lower plaques counts (Figure 1J). Interestingly, the ipsilateral hemisphere displayed a slightly lower level of amyloid plaque load compared to contralateral hemisphere on average, indicating possible increased clearance of plaques due to neuroinflammatory levels post stroke. The observed phenomenon might result from severe ischemia in the brain, which leads to a chain reaction where hypoxia triggers an increase in brain inflammation and causes macrophages to remove the Aβ proteins at an accelerated rate.
Figure 1. CAA differentially affects ischemia and delays tissue recovery after stroke.

Mice from 5xFAD and WT littermates at 12 months of age were subjected to a transient MCA occlusion for 60 min and analyzed for post-stroke recovery characteristics.
(A) Diagram showing an overview of mouse experiments where cognitive decline increases with age. At the time of MCAO, we aim to study the difference in cognition and tissue recovery over an acute time of 24 h and 7 days.
(B) Cerebral blood flow (CBF) was measured with laser doppler and calculated as a percentage of baseline before MCAO, during the occlusion, and 24 h post MCAO. xy plots are mean ± SD.
(C and D) CBF flux showed a non-significant difference between each genotype during the occlusion period (WT n = 6; 5xFAD n = 6). At 24 h after stroke, CBF flux was documented and the reperfusion flux of WT mice (n = 4) at 12 months of age was significantly higher than the reperfusion flux of 5xFAD mice (n = 5) examined by laser doppler. *p = 0.021; two-tailed Student’s t test. Box-and-whisker plots are show minimum to maximum with all points.
(E) Infarct size was quantified using TTC staining in the brains of WT +/− MCAO and 5xFAD +/− MCAO mice (n = 5–7 mice per group) at 12 months of age, 7 days post MCAO.
(F) Total infarct volume (mm3) in the brains of WT and 5xFAD sham mice (n = 6 mice per group) and WT MCAO mice (n = 5 mice), and 5xFAD MCAO mice (n = 7 mice) were quantified 7 days post stroke. ****p < 0.0001; ordinary one-way analysis of variance (ANOVA) with Tukey’s post hoc test.
(G) Comparison of infarct volume in WT MCAO or 5xFAD MCAO mice (n = 4–7 mice per group) 24 h post stroke and 7 days post stroke **p < 0.01; two-way ANOVA. NS, not significant.
(H) ThioS (cyan) is depicted in the coronal whole-brain section from 5xFAD sham mouse. Scale bar, 2,000 μm.
(I) ThioS (cyan) is depicted in the coronal whole-brain section from 5xFAD MCAO mouse. Scale bar, 2,000 μm.
(J) Heatmap displaying the amyloid burden quantified by ThioS count averages in different regions of the brain as follows: Hippo, hippocampus; Hemi, hemisphere. Amyloid was exclusively observed with thioflavin S staining in the brains of 5xFAD mice. Similar results were observed in at least four independent experiments.
Amyloid worsens post-ischemic stroke functional recovery in mice
Studies show that CAA-induced alterations in brain perfusion and structural damage contribute to cognitive decline and functional impairments in affected individuals.21 To examine how amyloid burden impacts brain functional recovery, we performed behavioral and neuro-assessment studies on mice. Animals were subjected to MCAO, and behavioral testing and/or neurodeficit scores were assessed at days 1, 2, 3, 4, 5, 6, and 7 post MCAO (Figure 2A). Significant differences in neurodeficit score, which primarily assesses motor function, were detected between sham and ischemic stroke-induced mice at 24 h post stroke regardless of the genotype (Figure 2B). Although the WT mice subjected to ischemic stroke (WT MCAO) largely recovered their functionally by day 7, similar to the sham treatment levels, the 5xFAD mice subjected to ischemic stroke (5xFAD MCAO) had significantly reduced functional recovery over the same time course (Figure 2C). Since the neuroscores on the 5xFAD mice failed to recover following stroke induction (5xFAD MCAO), we assessed the mice for additional behavioral parameters at the 7-day post-stroke time point. To examine the short-term memory of the mice, they were subjected to a Y-maze, which specifically evaluates spatial reference memory in the hippocampus.22 This test proved to be very challenging since the 5xFAD mice, regardless of the presence of a stroke, had deficits in spontaneous alternations and novel arm recognition compared to the WT mice (Figure 2D). For spontaneous alternations, the 5xFAD groups clustered together and showed a clear trend of being significantly lower than WT mice whether they were subjected to ischemic stroke or not (Figure 2E). When we calculated the novel arm recognition in a Y-maze test, a similar trend was observed where 5xFAD groups showed a decreased trend in an initial test of memory (Figures 2F and S2E). The open-field test was conducted to assess locomotor and anxiety behaviors (Figure 2G). We observed the inner area of the arena, distance traveled, and clockwise and anticlockwise rotations. We found that the 5xFAD mice led to increased levels of thigmotaxis compared to WT mice as assessed by the decreased percentage of time spent inside the inner zone of the arena (Figure 2H). In fact, the 5xFAD MCAO mice spent significantly less time in the inner zone of the arena than the WT mice (both sham and MCAO) and the 5xFAD sham groups. This indicates an increase in anxiogenic behavior that may be partially due to CAA but is heightened by the combination of CAA and MCAO. It is important to note that the percentage of time spent in the arena was not affected by the amount of distance traveled due to some animals having a stroke since all animals exhibited similar ambulatory ability (Figure 2I). Additionally, anticlockwise rotations were also observed to be significantly higher in both stroke groups, regardless of amyloid burden, indicating that these groups did have a left-sided ischemic stroke (Figure S1D). Learning and memory deficit improvement testing was conducted using the novel object recognition (NOR); however, a high in-group variability of this experiment precluded significantly different results, except for the 5xFAD MCAO group as compared to the 5xFAD sham group in percentage of exploration time (Figures S2A–S2D). Taken together, behavioral testing indicated that amyloid burden due to CAA (i.e., the 5xFAD mice) can markedly impair post-stroke functional recovery.
Figure 2. Amyloid accelerates post-ischemic stroke functional recovery in mice.

(A) The neurodeficit score (neuroscore) of each mouse was monitored over time post treatment for up to 7 days. xy plots are mean ± SD.
(B) Neuroscore analysis was quantified 24 h post stroke. For WT sham n = 11 mice, 5xFAD sham n = 10 mice, WT MCAO n = 28 mice, 5xFAD MCAO n = 26 mice.
(C) Neuroscore analysis was quantified 7 days post stroke. For WT sham n = 11 mice, 5xFAD sham n = 7 mice, WT MCAO n = 11 mice, 5xFAD MCAO n = 9 mice.
(D) Y-maze spontaneous alternation performance of WT and 5xFAD mice exposed to stroke were tracked using Any-Maze software tracking of the mouse for the duration of the test (green lines). The novel arm for the test is indicated by the top left arm of the Y.
(E) Analyses of the number of spontaneous alternations performed by each mouse in the Y-maze was quantified. n = 8 mice per group.
(F) Analyses of the percentage of entries into the novel arm of the Y-maze test after a new arm is introduced. n = 8 mice per group.
(G) Anxiety behavior of WT and 5xFAD mice +/− MCAO examined by open-field tests. Any-Maze software was used to track the motion of the mouse within the arena (green lines).
(H) The ratio of time spent in the middle of the arena during the open-field test was calculated for the mice. n = 8 mice per group.
(I) The distance traveled by each mouse was quantified and plotted in total meters walked during the open-field test duration.
The effect of cerebrovascular CAA on hippocampal transcriptomic signatures post stroke
To delineate the molecular mechanisms by which CAA affects neurological pathways post-stroke, scRNA-seq was performed on the isolated hippocampus of WT and 5xFAD mouse brains 7 days post MCAO or sham treatment, GEO: GSE266033 (Figure 3A). Specifically, we were interested in examining vascular functionality and neurogenesis recovery in response to stroke and CAA. Since the hippocampus is the primary brain region involved in memory and learning functions, as well as one of the principal locations for adult neurogenesis, we restricted our analysis to this region of the brain. We first performed canonical correlation analysis of all four groups (WT sham, WT MCAO, 5xFAD sham, and 5xFAD MCAO) to identify common sources of variation, followed by integration analysis to identify cell clusters and conserved cell-type markers.23–26 The same cell clusters were identified in all four groups in which conserved cell markers were observed by the top differentially expressed genes (DEGs) (Figure S3A). In total, 18 cell clusters were identified in the hippocampus at a resolution of 0.2. This includes perivascular macrophages (PVMs) and microglia, oligodendrocytes (OLs), astrocytes (ACs), ECs), myeloid cells (MCs), PCs, Neus, lymphoid cells (LCs), and NPCs (Figures 3B and S4A). These clusters were manually identified based on their expression of key cell-specific markers (Figures 3C and S4B). A high amount of DEGs was observed across all pairwise comparisons for each group (Figures S5A–S5D). We focused our initial analysis on those genes that were differentially expressed between WT MCAO and 5xFAD MCAO to better understand the effect of Aβ oligomers on post-stroke recovery in hippocampal functions. We found that ACs, PVMs, and OLs had the highest number of DEGs. In particular, the AC cluster 1 (AC1), OL clusters (OL1 and OL2), and PVMs (PVM1) had the largest number of DEGs (Figure S4C). We also found a high amount of variability in cell cluster proportions when we separated based on treatment (Figure S5E) and genotype (Figure S5F). This was particularly evident in the elevated cell proportions in the AC and PVM clusters in 5xFAD and MCAO groups as denoted by the red dots compared to blue in each Uniform Manifold Approximation and Projection (UMAP). While inflammatory responses are known to be elevated in stroke and Alzheimer’s models, we were interested in how the cerebral microvasculature communicates with NPCs in neurogenic niches within the hippocampus. As such, we analyzed the EC cluster to understand the phenotypical changes in the microvasculature that communicate with surrounding cells of the BBB. In the endothelial cluster from 5xFAD MCAO mice, we observed an upregulation of genes involved in IL-2/STAT5 signaling (Gadd45b, Nfkbiz, Spp1, Cst7), complement cascade (C1qa, Spock2, Irf7, Ctsd), coagulation (C1qa, Sparc, Crip2), myogenesis (Sparc, Gadd45b, Igfbp7), and hypoxia (Fosl2) compared to WT MCAO. Conversely, genes involved in modifying p53 pathway (Tsc22d1), heme metabolism (Tfrc, Bsg), and transforming growth factor (TGF)-beta signaling (Id1) were downregulated in 5xFAD MCAO compared to WT MCAO mice (Figures 3D, 3E, and 3G). Pathway analysis (Gene Ontology [GO] term enrichment) revealed the top upregulated pathways in 5xFAD MCAO endothelial clusters, including neuroinflammatory response, activation of immune response, macrophage activation, microglial cell activation, glial cell activation, synapse pruning, and cell junction disassembly (C1qa, Cd200, Cst7, Tyrobp, and Fosl2). We validated that Tyrobp was upregulated in isolated microvessels of 5xFAD mice compared to WT using RNAscope (Figure S6A). Notably, the top downregulated pathways in 5xFAD MCAO compared to WT MCAO mice included endothelium development, endothelial cell development, regulation of stem cell proliferation, endothelial cell differentiation, and stem cell proliferation (Sox18, Id1, Trfc, Ccl4, and Cxcl12) (Figures 3F and 3G). Multiple genes previously identified in endothelial cell-to-cell vascular signaling transcriptomes (for example, Sox18, Id1, and Trfc) were downregulated in the 5xFAD MCAO mice (Figures 3D–3G). For cell signaling, Cxcl12 is a critical chemokine implicated in the pathogenesis of hypoxia and contributes to the proper regulation of neurotransmission, neurotoxicity, and neuroglial interactions. Of critical importance is the signaling of this chemokine from the BBB to surrounding cells, including NPCs. Our data reveal a noteworthy downregulation of the gene Cxcl12 in the EC cluster of 5xFAD MCAO (Ppadj = 0.0573), coupled with an upregulation of Ccl4 (Padj = 0.0525). Notably, Ccl4 is a chemokine implicated in recruiting immune cells during inflammation or damage. Although these genes fall slightly outside the conventional p-value cutoff, the inclusion of additional animal groups in future studies may shed further light on the significance of these chemokines in BBB modulation, cellular signaling, and the process of neurorecovery.
Figure 3. The effect of cerebrovascular CAA on hippocampal transcriptomic signatures post stroke.
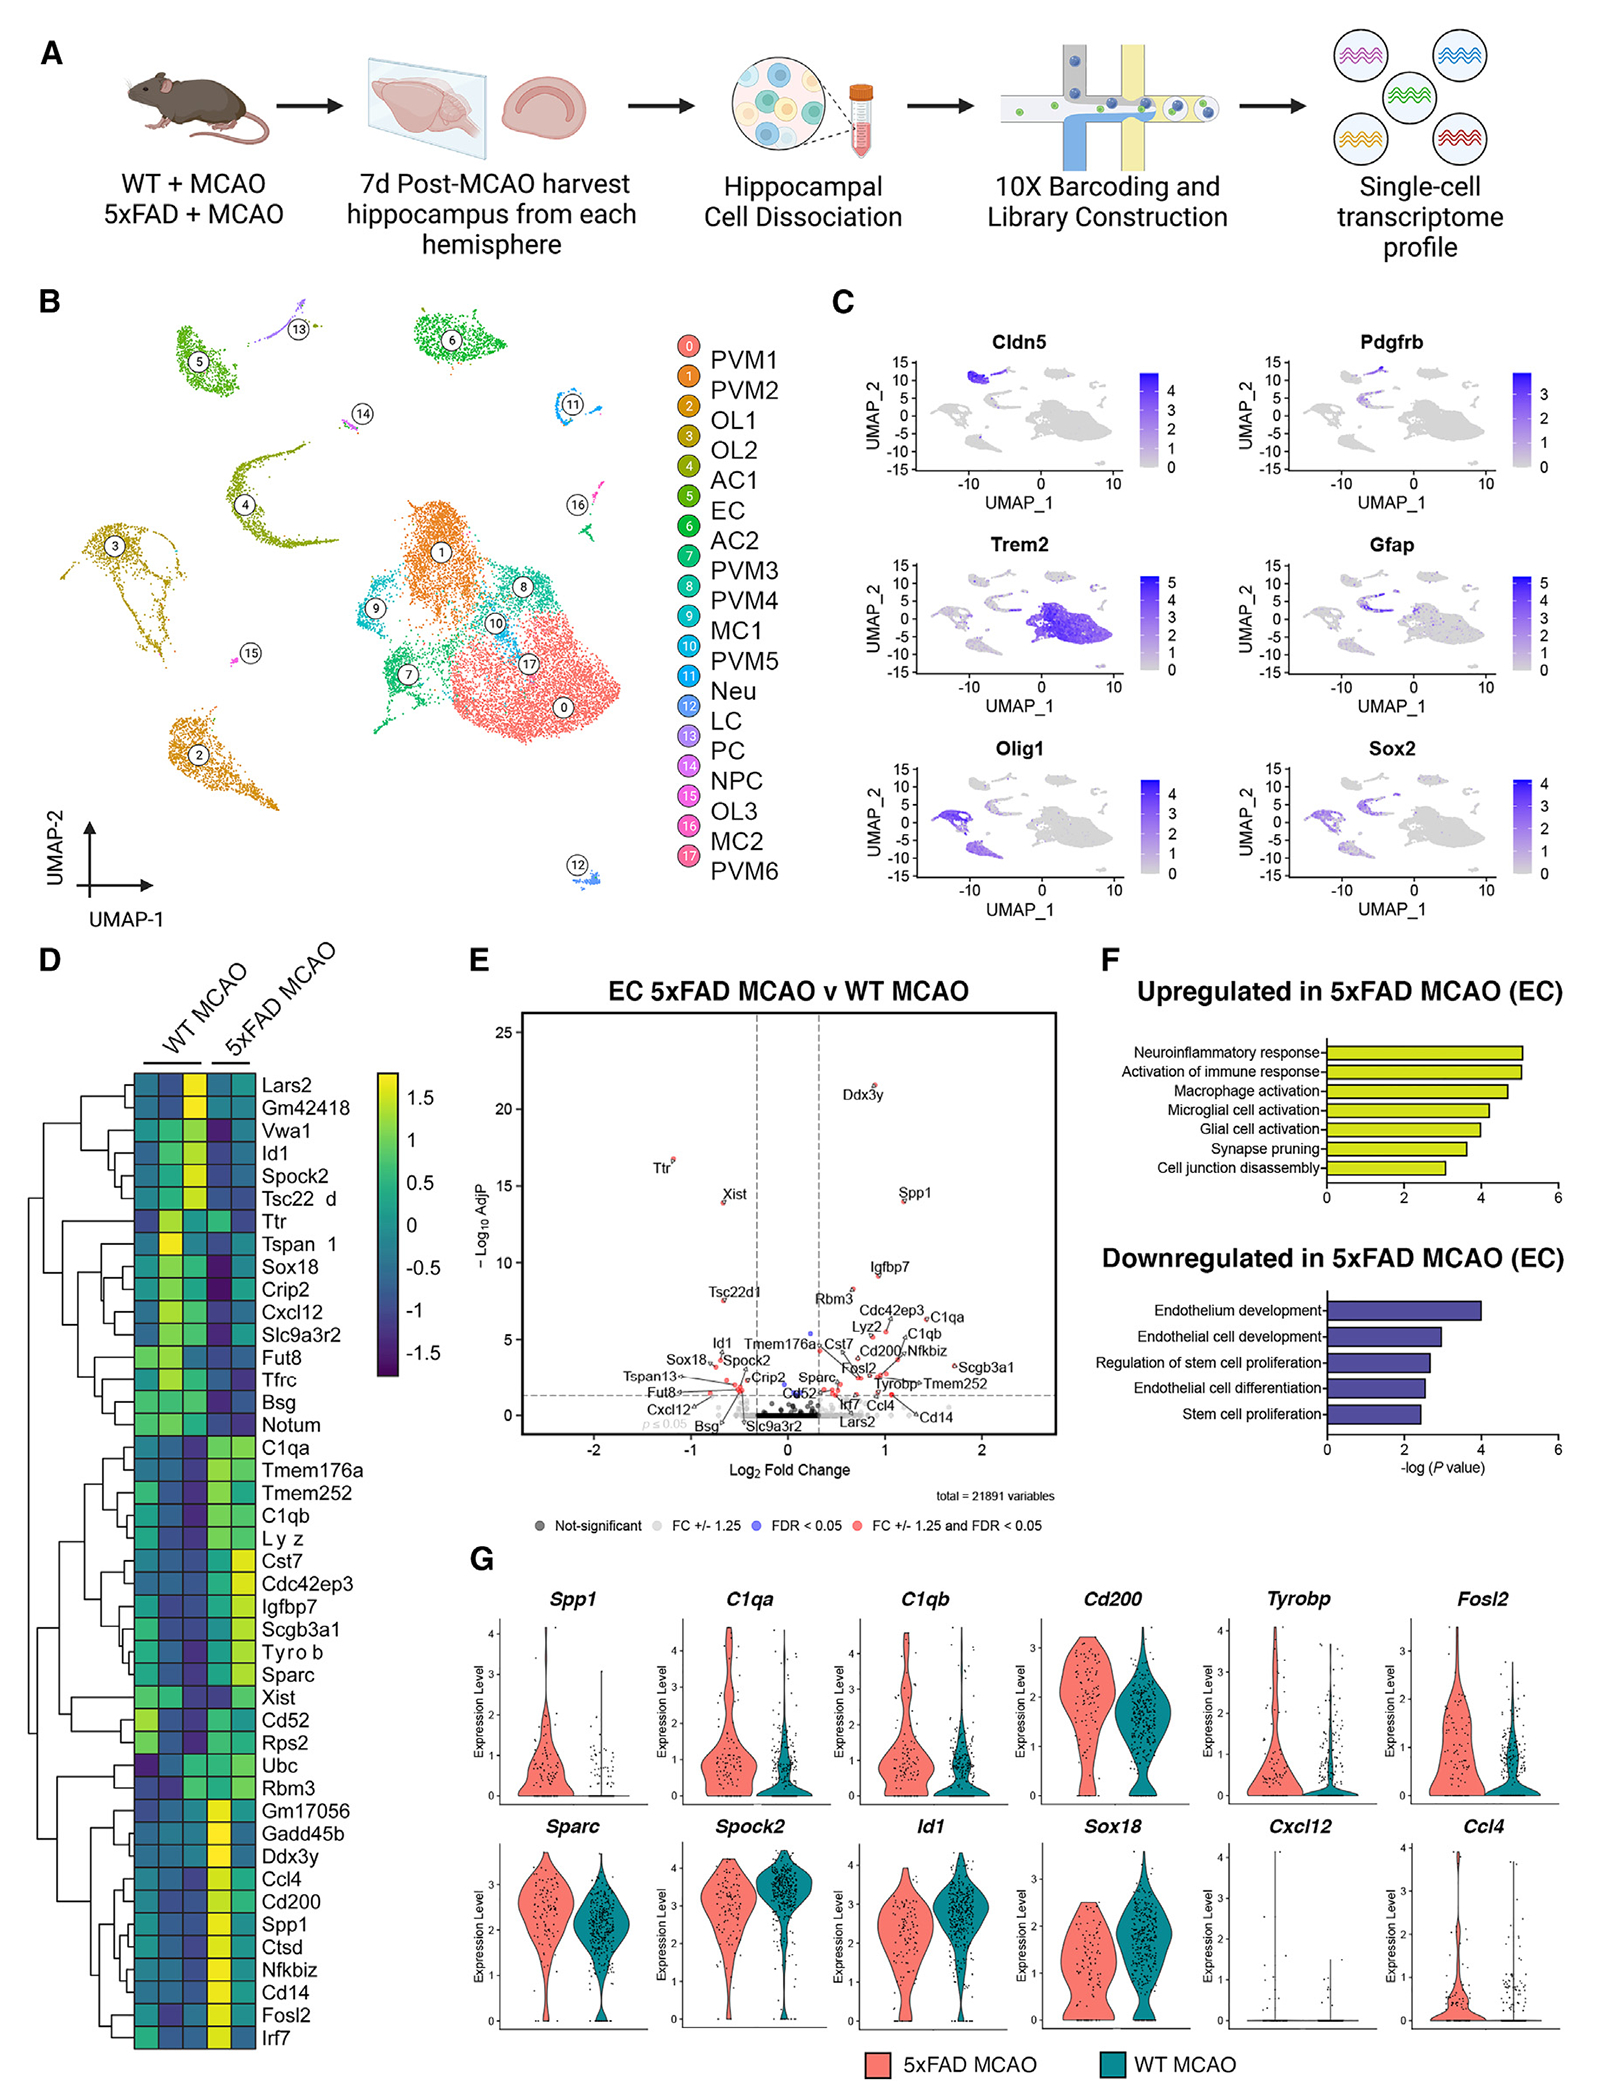
(A) Brain hippocampal tissue WT MCAO (n = 3 mice) and 5xFAD MCAO mice (n = 2 mice) at 12 months of age and 7 days post MCAO were subjected to scRNA-seq. Diagram showing an overview of the scRNA-seq experiment. The contralateral hippocampus was used as an internal sham control for all analyses.
(B) UMAP visualization of 18,186 isolated cells at 0.2 resolution from 12-month-old mice (n = 2 or 3 mice per group). Similar clusters are merged to show the annotated cell types within the same cluster. AC, astrocytes; LC, leukocytes; MC, myeloid cells; Neu, neurons; NPC, neural progenitor cells; OL, oligodendrocytes; PC, pericytes; PVM, perivascular macrophages.
(C) UMAP plots with each cell cluster highlighted in purple corresponding to a ubiquitous marker used to identify that cluster.
(D) Heatmap revealing the scaled expression of DEGs in ECs from WT MCAO and 5xFAD MCAO mice.
(E) Volcano plot depicting the top upregulated and downregulated genes in EC population in WT MCAO compared to 5xFAD MCAO. Genes that are significant at a p value ≤0.05 and log fold change ≥1.25 are portrayed in red.
(F) GO pathway analysis for upregulated (yellow) or downregulated (purple) genes in the EC cluster of 5xFAD MCAO mice. Bars show −log10(p).
(G) Violin plots showing the mean and variance differences between WT MCAO and 5xFAD MCAO ECs for genes regulating blood vessel morphogenesis (Sox18, ID1) regulation of Neu death (C1QA, TYROBP, CD200), and chemokine signaling (Cxcl12, Ccl4).
CAA promotes constricted microvasculature pathology in ECs and increases microvascular dysfunction post stroke
In the endothelial cluster from the sham (WT vs. 5xFAD) pairwise comparison, the most significant differential pathways were directly related to oxidative stress (reactive oxygen species [ROS]), interleukin (IL) 2/STAT5 signaling, complement, p53 signaling, and angiogenesis (Figure S5A). GO analysis demonstrated observed common dysregulated pathways in microglial cell activation, regulation of calcium-mediated signaling, positive regulation of Neu death, synapse pruning, positive regulation of calcium-mediated signaling, L-glutamate transmembrane transport, and negative regulation of MC differentiation. Importantly, previous studies have shown a rise of calcium levels in PCs in response to ROS leading to vessel constriction.27,28 Reduced CBF, due to possible vessel constriction, is a common hallmark of AD, possibly due to chronic amyloid exposure. Research shows that brain ECs can also sense and relay growth signals and chemokine factors between the blood and the brain.29 Therefore, we isolated mouse microvessels to analyze the vascular architecture and integrity of ECs post stroke. We examined the BBB integrity in WT and 5xFAD mice at 12 months of age and 7 days post MCAO or sham treatment by analyzing the tight junction (TJ)-associated proteins claudin-5 (CLDN5) and occludin (OCCLN), and scaffold protein zonula occludens 1 (ZO1) in ECs co-stained with basement membrane marker, lectin (Figure 4A). Immunostaining demonstrated that the levels of ZO1 and OCCLN were significantly reduced in WT MCAO and 5xFAD MCAO mice compared to WT sham and 5xFAD sham (Figures 4B and 4C). We also observed a significant decrease in CLDN5 exclusively in the 5xFAD MCAO group compared to sham mice (Figure 4D). These results show that the integrity of the TJs that assemble the BBB are compromised in 5xFAD MCAO mice. Further morphological analysis of the lectin-positive microvessels showed an increase in constriction of isolated cerebral microvasculature that was dependent on the genetic background (i.e., in the 5xFAD mice regardless of the stroke treatment compared to the WT mice) (Figure 4E). After disruption of the BBB, blood components and coagulation factors have been observed to infiltrate the brain.30 To investigate the impact of stroke and CAA on brain vascular permeability, we assessed the leakage of blood plasma glycoprotein into the brain by probing for fibrinogen, a reliable marker of compromised BBB integrity.31 We found an elevated presence of fibrinogen in the whole-brain ipsilateral hemisphere of 5xFAD MCAO mice compared to all other groups at 24 h post MCAO (Figure 4F). However, these levels of fibrinogen returned to baseline at 7 days (Figure 4I). These results show that BBB leakage due to both stroke and CAA can spontaneously recover after 7 days. PCs are critical regulators of the endothelial membrane integrity maintenance and have also been implicated in controlling CBF.32 Therefore, we assessed platelet-derived growth factor receptor beta (PDGFRβ)-positive PC protein expression in the ipsilateral hemispheres. We found a significant decrease in PDGFRβ expression at 7 days post MCAO (Figure 4J) in the 5xFAD MCAO mice compared to 24-h recovery (Figure 4G). This may be indicative of a compensatory mechanism in regaining BBB homeostasis after injury, which may contribute to the observed reduced CBF perfusion post stroke and further impair autoregulation. Importantly, the levels of CD31 protein expression, a marker for ECs, was not significantly altered, across any of the groups, indicating that the drop in other cellular markers is not necessarily due to a decrease in overall vessel membrane (Figures 4H and 4K). Dysregulation of vascular tone has been demonstrated to lead to decreased cerebrovascular reactivity and hypoperfusion, which in turn may exacerbate the accumulation of brain Aβ plaques. Studies show that human brain capillaries are constricted due to amyloid plaque-mediated signaling pathways.33 We confirmed our results from mice in postmortem human brain samples of the hippocampus (Figures 4L, S7A, and S7C). Five human postmortem slices from healthy individuals and five with clinical CAA were immunostained with CD31 and DAPI (Figure 4M). Careful attention was paid to identify microvasculature within the hippocampus that were less than 10 μm (yellow arrow) compared to larger brain arteriole/venules (white arrow) greater than 10 μm in diameter for this analysis (Figure S7B). Through this analysis, we found that there was a significant decrease in the vessel diameter of human microvessels in the CAA hippocampus compared to those from healthy control individuals (Figure 4N). Brain slices were also co-stained with CD31, Aβ40, and DAPI to visualize plaques that co-localized around the blood vessels (Figure S7D). Next, we validated the decreased CBF and perfusion in WT and 5xFAD mice ex vivo. Using computed tomography angiography (CTA), we evaluated the vascular structure surrounding the brain in mice. By employing Microfil contrast, we were able to visualize the head’s vasculature, where we observed a lack of successful vessel perfusion in 5xFAD mice compared to WT controls, particularly around the region of the brain parenchyma, which corresponds to vascularization by the middle cerebral artery (MCA) (Figure 5A). We used this region of interest (ROI) to measure perfusion volume. Notably, 5xFAD mice exhibited a significantly reduced perfusion volume as compared to WT mice (Figure 5B). To corroborate our findings from the microvessel data presented in Figure 4, we further analyzed the arterial vessel diameter to determine if vascular constriction was evident in larger vessels. We focused the blue segmentation on the circle of Willis (CoW) and major arteries implicated in our MCAO model (Figure 5C). Interestingly, in the 5xFAD model, the segmentation was constrained due to reduced perfusion success. We also observed “blebbing” at the ends of vessels, indicative of contrast bubbles, where increased pressure buildup could potentially lead to vessel rupture or blebbing (Figure 5D). We initially hypothesized that this phenomenon could be due to the increased constriction of arteries as they transition into microvessels, leading to impaired perfusion and elevated pressure, which can cause vessel rupture. Cross-sectional analysis revealed no significant differences in arterial diameter between the groups (Figure 5E). This suggests that the observed reduction in CBF and perfusion in 5xFAD mice is likely due to constriction at the level of the small capillaries and microvessels within the BBB, rather than the larger arteries supplying the brain.
Figure 4. CAA promotes constricted microvasculature pathology in ECs and increases microvascular dysfunction post stroke.

(A) Isolated microvessels from brain hemispheres of WT and 5xFAD mice with or without stroke subjected to co-immunostaining for lectin (ECs), CLDN5, OCCLN, and ZO-1 (TJ proteins). Scale bar for all images, 20 μm.
(B) Quantification of total ZO-1 normalized to lectin fluorescence in the microvessels (n = 5 mice per group). *p < 0.05, **p < 0.01.
(C) Quantification of total OCCLN normalized to lectin fluorescence in the microvessels (n = 5 mice per group). *p < 0.05.
(D) Quantification of total CLDN5 normalized to lectin fluorescence in the microvessels (n = 5 mice per group). *p < 0.05, **p < 0.01.
(E) The vessel diameter was quantified in isolated mouse microvessels by taking the average of six random measurements per six microvessels per mouse (n = 5 mice per group). ***p < 0.001, ****p < 0.0001.
(F–H) Mouse whole-brain homogenates from the ipsilateral hemispheres were quantified for protein via western blot analyses at 24 h post MCAO. The total levels of fibrinogen/GAPDH (WT sham, n = 8; WT MCAO, n = 9; 5xFAD sham, n = 7; 5xFAD MCAO, n = 9), PDGFRβ/GAPDH (WT sham, n = 6; WT MCAO, n = 6; 5xFAD sham, n = 6; 5xFAD MCAO, n = 6), and CD31/GAPDH (WT sham, n = 4; WT MCAO, n = 5; 5xFAD sham, n = 4; 5xFAD MCAO, n = 5) signals were quantified. *p < 0.05.
(I–K) Mouse whole-brain homogenates from the ipsilateral hemispheres were quantified for protein via western blot analyses at 7 days post MCAO. The total levels of fibrinogen/GAPDH (WT sham, n = 4; WT MCAO, n = 4; 5xFAD sham, n = 5; 5xFAD MCAO, n = 5), PDGFRβ/GAPDH (WT sham, n = 4; WT MCAO, n = 4; 5xFAD sham, n = 5; 5xFAD MCAO, n = 4), and CD31/GAPDH (WT sham, n = 4; WT MCAO, n = 4; 5xFAD sham, n = 5; 5xFAD MCAO, n = 5) signals were quantified. *p < 0.05, **p < 0.01.
(L) Graphical depiction of a human brain with an inset of how microvessel cross-sections were quantified within the hippocampal samples using ImageJ.
(M) Postmortem human brain tissue from healthy individuals and individuals with CAA were co-immunostained with CD31 and DAPI in the region of the DG of the hippocampus. Scale bar, 60 μm.
(N) Quantification of vessel diameters in postmortem human brain microvessels were averaged across five individuals per disease and plotted. *p < 0.05.
Figure 5. Microfil contrast-enhanced CTA shows decreased vascular perfusion of 5xFAD mice compared to WT controls.

(A) CTA images of all vascular structures within the skull of WT and 5xFAD mice. Differences in the perfusion of the contrast agent into the brain were observed between the two groups, denoted by the blue arrow. CTA images of each respective mouse had the background vascular structures removed except the tongue and brain to highlight these ROI for analysis.
(B) Perfusion volume was calculated by analyzing the volume of contrast agent that successfully perfused the brain during CTA. n = 12 mice per group. *p < 0.05; paired two-tailed Student’s t test.
(C) Segmentation ROI of the brain vasculature of the CoW including anterior cerebral artery (ACA) and middle cerebral arteries (MCA). Red lines denote areas where cross-sectional diameters were measured.
(D) Segmentation highlighting variation in the perfusion of the vasculature within the brain for the two models in the CoW.
(E) Analysis of the arterial cross-sectional diameters for the 5xFAD and WT animal models at the ACA and MCA. n = 3 mice per genotype.
Stroke differentially downregulates chemokine response and neurogenesis in NPCs exposed to CAA
Having confirmed that ischemic stroke exacerbates BBB dysfunction in 5xFAD mice, we shifted our analysis to how stroke differentially affects 5xFAD mice compared to the sham condition (5xFAD sham versus 5xFAD MCAO). Given the interdependence between the integrity of ECs and NPCs within the neurogenic niches of the hippocampus for the appropriate provision of growth and proliferation cues, our next investigation focused on analyzing the transcriptional changes within the NPC cluster. Although the NPCs only compromise ~0.5% of the total number of cells in our single-cell analysis, they have a significant impact on the health and functionality of the hippocampus (Figure S4D). Overall, there was a consistent downregulation of significant DEGs in the NPC cluster from 5xFAD MCAO mice compared to their sham-treated counterparts (Figure 6A), in particular genes involved in Neu projection guidance (Cxcl12, Scn1b), vascular associated smooth muscle contraction (Pik3c2a), Neu development (Rab6b), epidermal growth factor receptor signaling (Pik3c2a), DNA metabolic processes (Kin, Nudt1), lipid droplet assembly (Pnpla2), RNA processing (Ddx23), cellular transportation (Pom121), and regulation of DNA-templated transcription (Creb3l2), which stands for cAMP response element-binding protein (Figure 6B). GO term enrichment and gene set enrichment analyses (GSEAs) revealed downregulated pathways in 5xFAD MCAO NPC clusters, including blood vessel EC migration, positive regulation of cell projection organization, dendritic cell apoptotic process, neuronal action potential propagation, phosphatidylinositol-3-phosphate biosynthetic process, EC migration, induction of positive chemotaxis, axon guidance, and positive regulation of calcium ion transport (Figure 6C). Of note, all the DEGs involved in the NPC cluster were downregulated. These data support our hypothesis that amyloid exacerbates ischemic stroke tissue recovery by downregulating pathways important for NPC growth, proliferation, and migration in cells within the BBB neurovascular unit of the hippocampus. Next, immunohistochemistry was used to validate the downregulation of Cxcl12, a critical chemoattractant directly proportional to reduced oxygen tension as well as the regulation of neuroinflammatory responses, in the cerebral tissue from 5xFAD mice post stroke compared to 5xFAD sham (Figures 6D and 6E).34 Results were normalized to the fluorescence level of CD31 staining in the slices since the chemokine is also produced and secreted from microvascular ECs in the brain. After confirming a decrease in Cxcl12 signaling, we also observed a decrease in expression of the doublecortin (DCX) protein in the brain tissue located near the hippocampus, indicating a lower amount of actively proliferating progenitor cells (Figures 6D and F). Next, we decided to silence specific genes in the phosphatidylinositol 3-kinase (PI3K) pathway that proved important for NPC growth and proliferation to confirm our single-cell results, specifically CXCL12, PIK3C2A, and CREB3L2. These genes have proved crucial for pathways involved in cell survival, stemness, and chemotaxis.35–37 We transfected human NPCs (ReN) with small interfering RNA (siRNA) specific to Cxcl12, Pik3c2a, Creb3l2, and scrambled for a negative control. Total RNA expression was assessed post transfection to verify the efficiency of siRNAs targeting Cxcl12 (Figure S9A), Pik3c2a (Figure S9B), and Creb3l2 (Figure S9C). Upon successful silencing, ReN cells were imaged on an Incucyte starting at 24 h, equivalent to t = 0 h, up to 16 h post transfection (Figure 6G). We analyzed the neurite extensions, in blue, normalized to the cell cluster area, in green, over 16 h (Figure 6H). Our results indicate a significant reduction in the rate of neurite length per cell-body cluster area following silencing of Cxcl12, with further reductions observed in downstream silencing of genes Pik3c2a and Creb3l2. Silencing of Pik3c2a and Creb3l2 underscores their pivotal role in governing cell growth and preserving stem cell characteristics, illustrated by the impact on neurite length and cell-body cluster area observed. In addition to the proliferation health of NPCs, neuroinflammation has been shown to play an important role in the maintenance of brain homeostasis in neurodegenerative diseases. Using western blotting and immunohistochemistry, we examined the impact of CAA and stroke at 24 h and 7-day post-stroke recovery on the neuroinflammatory markers glial fibrillary protein (GFAP), Iba-1, and NeuN. At 24 h post treatment, the GFAP-positive astrogliosis was significantly increased in the 5xFAD MCAO mice at 24 h compared to WT sham and WT MCAO groups (Figure S8D). Although the 5xFAD MCAO mice showed elevated amount of GFAP+ expression compared to the other treatment groups after 7 days, including the 5xFAD sham mice (Figures S8A–S8C, and S8G). Similarly, Iba1-positive microgliosis was significantly increased in 5xFAD MCAO mice compared to WT MCAO at 24 h compared to WT sham and 5xFAD sham at 7 days post stroke (Figures S8A–S8C, S8E, and S8H). No significant changes in the NeuN levels were detected in the brains of the mice at 24 h and 7 days post treatment (Figures S8F and S8I). Altogether, these results suggest that the comorbidity of CAA and ischemic stroke in the brain promotes neuroinflammatory responses in the brain along with an increase of vessel-associated gliosis, which potentially compromises barrier integrity, cerebrovascular functions, and proper cellular communication after injury.
Figure 6. Stroke differentially downregulates chemokine response and neurogenesis in neural progenitor cells with CAA.

(A) Volcano plot illustrating the downregulated genes in the NPC cluster from 5xFAD MCAO mice compared to 5xFAD sham mice. Genes significant at a p value <0.05 and log fold change ≥1.25 are portrayed in red.
(B) Violin plots showing the mean and variance differences between 5xFAD MCAO and 5xFAD sham NPCs for genes regulating Neu projection guidance (Cxcl12, Scn1b), PI3K/AKT signaling pathway (Pik3c2a, Creb3l2), and RNA processing (Ddx23, Kin).
(C) GO pathway analyses for downregulated genes in the NPC population of the 5xFAD MCAO mice. Bars show −log10(p).
(D) Brain sections from 5xFAD sham or 5xFAD MCAO mice (sham, n = 3 mice; MCAO, n = 3 mice) at 12 months of age were subjected to co-immunostaining for Cxcl12 (red) and CD31 (green), or DCX (blue), NeuN (green), and DAPI (cyan).
(E) The ratio of Cxcl12/CD31 signal was quantified. **p = 0.0011, two-tailed Student’s t test. Scale bar, 50 μm.
(F) The relative fluorescent count signal of DCX per DAPI+ cell was quantified from brain sections of mice. *p = 0.0223.
(G) Incucyte ZOOM analysis of NPC neurogenesis over 16 h. ReN cells were exposed to siRNA-CXCL12, siRNA-PIK3C2A, siRNA-CREB3L2, or scrambled siRNA for 24 h before imaging in the incucyte. Representative images from time points 0 and 16 h after siRNA transfection were taken, where blue indicates neurite extensions and green represents cell bodies. Scale bar, 100 μm.
(H) Quantification of Incucyte images demonstrates the change in rate of neurite length per cell-body cluster area. Graphs represent the average of individual pictures taken in 16 image grids over 16 h. Additionally, t = 0 h corresponds to the first image taken after a 24-h transfection with siRNA on the graph. xy plot is mean ± SEM. **p = 0.0058, ***p = 0.0007, ****p < 0.0001; †††p = 0.0001, ††††p < 0.0001; ‡‡‡‡p < 0.0001; ####p < 0.0001; ordinary two-way ANOVA with multiple comparisons.
Differential recovery of 5xFAD neurogenesis post stroke compared to WT with AE-18
Previous studies strongly suggest that PI3K/AKT is the signaling pathway responsible for the activation of late-phase gene expression involved in neuronal differentiation, neurogenesis, and neuroprotection in vitro.38 However, whether our specific pathway from the scRNA-seq data of ECs and NPCs (CXCL12 > PI3K > CREB) can help mediate post-stroke recovery in an amyloid mouse model remains unclear.39 Therefore, utilizing our 5xFAD mouse model, we administered a PI3K/Akt/CREB activator (AE-18) by oral gavage at 10 mg/kg once daily for 7 days post MCAO and assessed functional recovery, infarct size, and neurogenesis (Figure 7A). Interestingly, after daily exposure to AE-18, we found that the infarct sizes of both WT and 5xFAD mice were significantly reduced in volume, whereas administration of corn oil alone neither improved nor worsened stroke infarct size relative to our initial findings (Figures 7B and 7C). Importantly, we noted a consistent trend between WT MCAO and 5xFAD MCAO treated with corn oil, with the 5xFAD mice exhibiting a significantly larger stroke volume. To assess motor function improvement post stroke, we documented a daily neuroscore for 7 days post stroke with the administration of AE-18 or corn oil. The percentage change in neuroscore was quantified and demonstrated a recovery in the AE-18 groups compared to 5xFAD MCAO + corn oil (Figure 7D). The line graph illustrates the daily neuroscores for each group throughout the 7-day recovery period; it is evident that the 5xFAD MCAO + corn oil group does not exhibit a significant recovery in functional improvement compared to the other groups (Figure S9D). Since mortality is important for post-stroke outcomes, we also measured the percentage survival of WT and 5xFAD mice administered the corn oil or AE-18 treatment. Indeed, the chance of survival for WT + AE-18 and 5xFAD + AE-18 after 7 days was improved using a Kaplan-Meier product limit estimate compared to WT + corn oil and 5xFAD + corn oil indicated by the non-significant difference comparison between all groups (Figure S9E). Monitoring mouse weight in surgical experiments is crucial for assessing recovery and survival outcomes. Fluctuations in weight can serve as indicators of overall health and well-being following surgical interventions. A decline in weight may signify post-operative complications, such as infection or poor wound healing, while an increase in weight may suggest successful recovery and adaptation to experimental conditions. We measured the pre and post weights of mice used in this experiment at pre-MCAO and 7 days post MCAO before euthanasia, respectively. A pairwise analysis demonstrated that the AE-18 mouse groups lost weight post MCAO, but not to the same significance as mouse groups treated with corn oil post MCAO (Figure S9F). Together, our results indicate that administration of AE-18 as a therapeutic post stroke differentially improves brain recovery, survival outcomes, and neurogenesis in a 5xFAD mouse model post stroke. Finally, we assessed neurogenesis capability of cells in the hippocampus post stroke with the AE-18 activator. On the last 2 days of corn oil or AE-18 treatment, mice were injected with bromodeoxyuridine (BrdU) once per day to label actively proliferating immature versus mature proliferating cells, as previously described.40 The brains were then co-immunostained with NeuN (green) for mature Neus, DCX (dark blue) for immature Neus, and DAPI (Figure 7E). Interestingly, the BrdU/DCX double-positive cells were present in higher amounts in the corn oil groups compared to mice that received the AE-18 activator, confirming the immature proliferation state of these NPCs within the SGZ of the hippocampus (Figures 7F and 7G). Contrastingly, double-positive immunoreactivity for BrdU and NeuN was significantly higher in mice treated with the AE-18 activator, suggesting an acceleration in the proliferation and differentiation cycle of NPCs, resulting in a greater number of cells maturing into Neus (Figures 7F and H).
Figure 7. Differential recovery of 5xFAD neurogenesis post stroke compared to WT with AE-18 activator.

(A) Diagram showing an overview of the mouse experiments. We subjected 12-month-old WT and 5xFAD mice to MCAO. Following treatment, mice were administered AE-18 or corn oil once per day up to 7 days post stroke before analyses. Additionally, BrdU was administered for the last 2 days for neurogenesis experiments.
(B) After 7 days, infarct size was quantified using TTC staining in the brains of WT MCAO and 5xFAD MCAO mice (corn oil, n = 6–8 mice per group; AE-18, n = 7–8 mice per group) at 12 months of age.
(C) Total infarct volumes (mm3) in the brains of WT MCAO + corn oil (n = 8 mice), 5xFAD MCAO + corn oil mice (n = 6 mice), WT MCAO + AE-18 mice (n = 8 mice), and 5xFAD MCAO + AE-18 mice (n = 7 mice) were quantified 7 days post MCAO and drug administration.
(D) The difference (Δ) in neurodeficit scores was quantified from baseline to 7 days post MCAO and drug administration. n = 7–8 mice per group.
(E) 5xFAD and WT mice were injected i.p. with BrdU once a day for the last 2 days of oral gavage treatment before being sacrificed. Brain sections were immunostained with NeuN, DCX, BrdU, and DAPI to verify the presence of actively proliferating NPCs and maturing Neus. Scale bar, 20 μm.
(F) Visualization of proliferating NPCs within the SGZ of the hippocampus. Red arrowheads indicate co-localization of either DCX/BrdU-positive cells in the corn oil groups or NeuN/BrdU-positive cells in the AE-18 groups. Inset images display each respective overlap. Scale bar, 20 μm.
(G) The relative numbers of DCX and BrdU-double-positive cells were counted in each group in the SGZ. n = 2 or 3 mice per group.
(H) To label proliferating NPCs that matured into Neus, the relative numbers of NeuN and BrdU-double-positive cells were counted in each group in the SGZ. n = 2 or 3 mice per group. All bar plots are mean ± SEM. *p < 0.05, **p < 0.01, ***p < 0.001, ****p < 0.0001; ordinary one-way ANOVA with Tukey’s post hoc test.
DISCUSSION
Research has consistently identified CAA as a risk factor associated with a range of vascular issues, cognitive impairments, and the occurrence of white-matter microinfarcts.6 In our study, we used the 5xFAD mouse model to replicate CAA and induced ischemic strokes via MCAO. We investigated behavioral changes and cell-specific transcriptional responses, focusing on brain recovery, BBB disruption, and neurogenesis post injury. While our research highlights the importance of these responses, the exact molecular mechanisms of cerebral dysregulation after stroke and CAA, especially at a single-cell level in the hippocampus, remain unclear. Behavioral studies assessed deficits in motor function, memory, spatial awareness, anxiety, and learning, while scRNA-seq transcriptomics provided detailed insights into cell responses and the delayed recovery mechanisms in CAA and stroke. This is particularly relevant as most of the patients with AD also exhibit CAA, suggesting that the pathologies of CAA are intrinsically linked to AD treatment strategies.
CAA and stroke
Utilizing a mouse model appropriate for chronic Aβ deposition around the cerebral vasculature is important to replicate clinical pathologies. Interestingly, it has been shown in a mouse model that Aβ plaques are found accumulating on cerebral blood vessels after middle cerebral artery occlusion.41 In our model, mice at 12 months of age developed substantial plaque load to mimic CAA, and ischemic stroke was induced via MCAO to observe the compounding effects of both diseases on recovery. Aβ oligomers are known to induce damage to cells in the brain and act as an impairing factor in ischemic events; however, this mechanism of action is unknown. We have characterized how cerebral Aβ plaques in the 5xFAD model typically co-localize with a network of microvessels, indicating potential for vascular dysfunction and compromised integrity of the BBB.42,43 The presence of Aβ plaques in cortical vessel walls is a hallmark of CAA and has been shown to increase the risk for white-matter hyperintensities and microinfarcts.44 While we do not posit that CAA can cause larger ischemic strokes, the overlap of the chronic damage induced is a risk factor for individuals who may potentially have a stroke and then effective recovery. The ongoing vascular damage caused by CAA can impede the brain’s repair processes, making tissue recovery more challenging. The repeated occurrence of microinfarcts in the context of CAA can lead to a progressive loss of brain function and complicate the recovery of affected tissues. Furthermore, the presence of CAA indicates a vascular system that is under constant strain, limiting the brain’s resilience to new injuries and reducing the effectiveness of the natural recovery mechanisms. Our study confirms that CAA exacerbates stroke outcomes by impeding tissue repair and recovery, as shown by our behavioral analysis. This correlates with other research suggesting a direct association between hippocampal cognitive deficits and CAA in human clinical trials.45 The hippocampus-dependent behavioral responses observed in our mouse model mirror these human findings, reinforcing the model’s relevance.
The BBB and chronic hypoperfusion
Single-cell transcriptomics revealed that CAA and ischemic stroke combined have a specific genetic signature. Specifically, the endothelial-specific gene responses indicate dysregulation in endothelium development, stem cell proliferation, and a subsequent increase in neuroinflammation, immune response, and synapse pruning. Among DEGs downregulated in ECs after ischemic stroke and CAA, Sox18 and Cxcl12 are among the factors that directly affect EC communication and vascular endothelium development. It is critical to understand that a reduction in Cxcl12 signaling originating from the ECs is a key element in facilitating intracellular communication in the brain.46 Recently, studies have shown that increased Aβ deposition is also associated with vascular dysfunction.47 Aβ oligomers are known to induce damage to cells in the brain and act as a damaging factor in ischemic events; however, this mechanism of action is unknown. Our data demonstrate a key mechanism underlying vascular disease and dysregulation is the EC barrier itself. Neuroinflammatory processes are well studied when it comes to CAA, AD, and stroke; however, their downstream chronic effects have not been well elucidated at the BBB. Cerebral hypoperfusion and BBB dysfunction have been implicated in CAA pathogenesis, where PCs are shown as being the regulators of vasoconstriction and dilation.48–50 To explore the potential pathological mechanisms by which CAA disrupts brain functions, we investigated the cerebrovascular architecture of mice at 12 months of age. TJ expression of the vascular endothelium was significantly decreased in 5xFAD MCAO groups, coupled with an increase in the blood plasma marker fibrinogen. Fascinatingly, in the study involving 5xFAD mice, the cerebrovascular phenotype displayed a notable reduction in vessel diameter compared to that of WT mice. This constriction indicates a limitation in CBF and the subsequent replenishment of nutrients to the affected tissue. A portion of this vascular constriction can be attributed to the action of PCs within the BBB. In our study with 5xFAD mice, there was a significant reduction in PC expression observed 7 days following a stroke, highlighting their crucial role in sustaining the integrity of the BBB and thereby reinforcing the argument that brain injury may be exacerbated in this model. Notably, PCs are involved in various critical functions beyond BBB maintenance, including regulating vessel dilation, capillary stalling, and the overall resistance of the cerebrovascular system.51 Indeed, PCs have been implicated in not only BBB integrity but regulating vessel dilation, capillary stalling, and overall cerebrovascular resistance.33,52 Considering the brain uses 20% of the energy supply in the body, it is necessary for blood to supply this energy source.53 Typically, a loss of 30%–50% of blood flow results in myelinated axon damage, spatial memory deficits, inflammation, synapse loss, and neuronal damage.54,55 An increase to 80% decrease of blood flow results in anoxic depolarization and tissue death.56 In combination with postmortem human hippocampal brain slices, restricted BBB vasculature was evident in a genotypic-dependent manner. Taken together, our results demonstrate that Aβ pathogenesis may exacerbate hypoxia and induce vascular dysregulation, therefore limiting spontaneous tissue recovery after injury. This suggests that interventions aimed at repairing the BBB or inducing cerebrovascular perfusion are critical post stroke in people with CAA and should prompt further translational studies to determine if noninvasive imaging of brain ischemia can be used as a predictive factor for recovery after stroke and the development of specific tailored treatments when worst outcomes are expected.
Neurogenic niches
Evidence indicates the critical role of the BBB in maintaining the NPC pool and in proper neurogenesis. Neurogenic niches are localized around the brain microvasculature. Studies support these findings by indicating a lining of Nestin+ cells along the brain microvessels near the hippocampus in mice.10,57 These NPCs can directly contact the endothelium in areas lacking AC endfeet and PC coverage, suggesting that the brain endothelium is an essential matrix and source of external cues for NPCs. The BBB endothelium is believed to create a microenvironment that mediates progenitor cell trafficking and migration by providing external signage as guidance cues. One of the mechanisms is the binding of endothelium-produced CXCL12 to CXCR4 on NPCs for enhanced attachment of NPCs to ECs, which then provide growth factors for NPC survival and proliferation.58–60 While the biology of NPCs in human adult brain is not fully understood, it is believed that the newly derived Neus may be incorporated into neuronal networks.11 Additionally, ECs have been implicated in releasing soluble growth factors that stimulate self-renewal of neural stem cells and enhance neuronal production.9 This strongly supports our hypothesis that tissue damage resulting from ischemic stroke and Aβ deposition may critically alter BBB microvasculature and impair neurogenesis. One of the cell types that can be affected by Aβ are NPCs that are in the perivascular niches, which are near brain vascular structures; therefore, we shifted our experiments to study the transcriptomics and molecular signatures in NPCs in 5xFAD MCAO mice. Most importantly, the top downregulated DEGs were Cxcl12, Pik3c2a, and Creb3l2. We confirmed the downregulation of the protein of Cxcl12 and noticed a substantial decrease followed by a reduction in DCX+ cells and increase in neuroinflammatory response. With these findings, it becomes apparent that there exists a connection facilitating cerebral vascular communication from the BBB to NPCs in the hippocampus, relevant in the contexts of stroke and CAA. Any disruption in this signaling pathway could significantly affect NPC proliferation and migration.
Neurogenesis near the BBB
The BBB is a fundamental player in intercellular communication, responsible for many growth-signaling cues to surrounding cells. Importantly, adult neurogenesis has been shown to occur in adult humans and animals, indicating its potential for spontaneous growth after damage.61 However, it has been shown that Aβ plaques do have a damaging effect on proper development of Neus.62 Studies have demonstrated that Cxcl12 expression increases the adhesion, migration, and homing of circulating Cxcr4-positive progenitor cells to ischemic tissue. Blockade of Cxcl12 in ischemic tissue or Cxcr4 on circulating cells prevents progenitor cell recruitment to sites of injury. Cxcl12 is important within the central nervous system (CNS) vasculature for these reasons in regulating NPC occupancy within perivascular spaces; however, there are implications in overactivation of this pathway that may lead to certain forms of cancer.63 In the absence of solely administering chemokines as a therapeutic mechanism, we sought to activate the PI3K and CREB pathway, which was downregulated in our single-cell data from NPCs. We aimed to recover the ischemic injury that was enhanced in the presence of CAA using the PI3K/Akt/CREB activator.64 Growing evidence indicates that, in certain cell types and tissues, the PIK3CA gene, responsible for encoding the p110alpha catalytic subunit of PI3K, can undergo amplification, leading to constitutive activation of PI3K pathways, such as cell growth.65 PI3K and CREB have previously been studied to activate hippocampal NPCs’ proliferative and differentiation capabilities.66,67 Additionally, PI3K treatment has been shown in mouse models to reduce blood clotting after arterial injuries.68 By upregulating brain-derived neurotrophic factor via the PI3K/Akt/CREB pathway, we demonstrated a reduction in stroke infarct size, increased functional recovery, and reduced mortality after 7 days. Furthermore, we observed a significant increase in NeuN/BrdU-positive cells following stroke when using the activator, compared to DCX/BrdU-positive cells in the control group. This suggests that the life cycle of NPCs is accelerated, resulting in a greater number of cells maturing into Neus rather than remaining in the immature phase. Taken together, our data suggest that CAA and stroke promotes the dysregulation of proper growth signaling from ECs to NPCs, as well as the autocrine signaling of NPCs for migration and growth intracellularly. This research posits that, in our 5xFAD mouse model, plaques may hinder the recovery of infarct regions after a stroke, a consequence of compromised BBB integrity and microvascular dysfunction. These factors collectively disrupt regional communication that activates neurogenesis, further impeding recovery post stroke. Although vasoactive agents capable of dilating blood vessels might restore blood flow to the impacted areas, their effectiveness would likely require prolonged and preventive use. Consequently, the immediate activation of a pathway that counteracts delayed neurogenesis presents a more effective therapeutic strategy for enhancing the rehabilitation of patients post stroke as demonstrated with our PI3K/CREB activator.
Limitations of the study
While there is no current strategy to fully treat ischemic stroke damage or Aβ accumulation in the brain, our project lays a foundation for alleviating long-term CNS consequences of these conditions. However, the study has limitations. Amyloid deposition tends to occur at advanced stages in humans, while our human samples showed early-onset CAA. The 5xFAD mice, which display Aβ from 2 months of age, were used at 12 months to model chronic conditions. Our scRNA-seq data were limited to two small cell populations, restricting the number of reads per gene. Additionally, due to high costs, we had only three mice per group, and one 5xFAD MCAO mouse did not survive to the 7-day mark, leaving only two mice in that group. Although our results were promising, we could not definitively measure Cxcl12 levels due to a p value of 0.0573. The 5xFAD model, which includes multiple mutations leading to accelerated Aβ aggregation and plaque formation, is valuable but may not fully represent the spectrum of AD seen in humans. Future studies should explore broader implications and consider other animal models to gain a more comprehensive understanding of AD pathology.
RESOURCE AVAILABILITY
Lead contact
Further information and requests for resources and reagents should be directed to and will be fulfilled by the lead contact, Michal Toborek (mtoborek@med.miami.edu).
Materials availability
This study did not generate any new or unique reagents.
Data and code availability
All raw fastq data files from 5xFAD mouse scRNA-seq were deposited into GEO under accession GSE266033.
This paper does not report original code.
Any additional information required to reanalyze the data reported in this work paper is available from the lead contact upon request.
STAR★METHODS
EXPERIMENTAL MODEL AND STUDY PARTICIPANT DETAILS
Mice
All animal used in the studies were 12-month-old male and female mice. All animals were housed and operated on in an AAALAC accredited facility at the University of Miami. Animal procedures were conducted in accordance with protocols approved by the University of Miami Institutional Animal Care and Use Committee (IACUC) and in accordance with the National Institutes of Health (NIH) guidelines for the care and use of laboratory animals. B6.Cg-Tg(APPSwFlLon, PSEN1*M146L*L286V)6799Vas/Mmjax mice (referred to as 5xFAD) were obtained from The Jackson Laboratory (USA) to establish a local breeding colony on a C57BL/6J background. Breeding was performed in-house using a strategy of hemizygous females crossed with wild type males. Animals used for experimentation were either wild type (WT) or heterozygous (5xFAD). Experimental mice were housed in the vivarium on a 12h light/dark cycle, were housed as littermates 2–5 mice per cage, and had access food and water ad libitum. Breeder cages were housed with 1–2 females and 1 male per cage only. Animals were genotyped with appropriate PCR assays (Transnetyx) resulting in mice hemizygous for the 5xFAD transgenes (APPswHet; huPSEN1Het). The offspring that did not carry the human APP and PSEN1 mutations, were used as wild-type controls (APPswWT;huPSEN1WT). Mice were randomly chosen for MCAO induction at 12 months of age. Surgeons and experimenters were blinded to both genotype (WT vs. 5xFAD) and treatment groups (Sham vs. MCAO) and a power analysis was performed to determine an appropriate sample size. All experiments were performed using male and female mice. Both sexes were used for analysis.
Human tissue samples and postmortem information
Formalin fixed human postmortem tissue used for immunohistochemistry was provided by the National Institutes of Health NeuroBioBank (University of Miami, Miami, FL, USA), referred to as the UM Brain Endowment Bank. For histological analyses, five human hippocampus samples were obtained from patients with early-onset CAA and AD. Five age-matched control hippocampus samples were also acquired from individuals that were clinically free of any brain diagnosis and had no diagnostic pathology present upon examination postmortem by confirmed with neuropathological examination of the postmortem brain. Standardized measurements of brain weight (grams), low postmortem interval (hours between death and placement of brain in a cold room or upon ice), age (between 55 and 65 y.o.), sex (male and female), and clinical brain diagnosis, were requested for each sample in the experiment. Brains from male and female donors were used for all analyses. All individuals signed informed consent forms approved by the respective university or institutional ethics boards.
Cell line
ReNcell CX human neural progenitor cells were purchased from Millipore. ReN cells were grown on 20 mg/mL purified mouse laminin coated tissue culture plates in ReNcell NSC Maintenance Medium supplemented with 20 ng/mL basic fibroblast growth factor 1 and 20 ng/mL of epidermal growth factor at 37°C and 5% CO2. Cells were used in experiments when they reached 80% confluence, about 3–4 days after seeding.
METHOD DETAILS
Middle cerebral artery occlusion
Ischemic stroke was induced by the middle cerebral artery occlusion (MCAO) in 12-month-old mice to understand how increasing cerebrovascular Aβ affects ischemic stroke recovery. Briefly, mice were anesthetized with isoflurane in oxygen. The ventral region of the neck was shaved and both sides of the neck were prepared in case one artery could not be accessed. The entire area was scrubbed with betadine three times, alternating with 70% alcohol. A midline neck incision was made using meticulous microdissection under the operation microscope; the common carotid artery (CCA) and the internal carotid artery (ICA) were isolated. A silicone-coated filament (Doccol) was inserted into the middle cerebral artery (MCA) via the CCA and ICA, blocking the blood flow to the MCA for 60 min. Stroke was confirmed by measuring cerebral blood flow by lase Doppler flowmetry. A drop to ~30% of the baseline signal was indicative of a successful procedure. The filament was then removed, allowing for tissue reperfusion. To evaluate infarct volume, brains will be harvested, sectioned using a 1 mm brain matrix (Braintree Scientific), and stained with 2% TTC. The images were captured by a digital camera (Nikon) and infarct volume was calculated using ImageJ based on the infarct volume per mm3. In addition, sham controls were utilized in which the same surgical procedure was used, but no stroke induced. Post-operative care directly followed our MCAO procedure. To reduce pain, the opioid analgesic, (SR)-buprenorphine (0.1 mg/g body weight was administered). All stroke or sham procedures were performed at 12 months of age, and the surgeon was blinded to its genetic code.
Oral gavage and intraperitoneal (I.P.) injection
For oral gavage, the average weight of the animals was taken, and the appropriate dosing volume was determined. Using a gavage tube (18-20G feeding tubes about 1.5 inches in length with a rounded tip) placed in the diastema of the mouth, the tube was gently advanced along the upper palate until the esophagus. Next, we administered PI3K/Akt/CREB activator 1 (AE-18) compound (MedChemExpress) at 10 mg/kg every day for the first 7 days post stroke, i.e., during the acute recovery. To label proliferating cells, mice were injected i.p. with 100 mg/kg of bromodeoxyuridine (BrdU) once a day for the last two days of oral gavage treatment of AE-18 or corn oil before euthanasia.
Laser doppler
To monitor cerebral blood flow, a Laser Doppler (Moor LDI V3.01, Moor Instruments Inc. Delaware) was be used to monitor the change in cerebral blood flow of the whole brain comprising of the blood supply from the ipsilateral MCA and the contralateral hemisphere. Subjects were examined at 3 different timepoints for assessment of baseline (t = 0 h), occlusion (t = 1 h), and reperfusion (t = 24 h). Occlusion of the MCA was confirmed by a sharp decrease of cortical blood flow, where a drop of 30% of the baseline signal was indicative of a successful procedure. The Doppler shift is proportional to a blood flow-related variable and is expressed in arbitrary perfusion units (PU). The data are collected by a computer and are visualized as a two-dimensional color-coded image representing varying degrees of blood flow over the scanned area. The mean blood flow is computed to yield an average of pixels in a region of interest within the scanned area with the software provided by the manufacturer (Moor Software V.3.01). The size of the scanned brain area was determined individually using respective ROI’s controlling for area in each mouse. One picture took approximately 1min using a scan resolution of 4ms per pixel at a distance of 56cm from the skull. To account for interobserver variability, images were analyzed by two different observers. Flux values corresponding to baseline were obtained from the image taken before MCAO and were subtracted from all measurements obtained during and after surgery. Flux values were expressed as changes from baseline.
Behavioral testing and analysis
Behavioral testing was conducted in a double-blind manner using established methodology. Performance in open field, Y-maze, and Novel Object Recognition was performed serially at baseline, 24 h, and 7 days post-stroke corresponding to acute lesion and initial recovery. Additionally, neurodefecit score was recorded using an established scale that assesses animal condition, behavior, and motor functions using 14 evaluation criteria for every day post-MCAO until sacrifice on day 7.69 Novel object recognition was performed once at 53 weeks of age, corresponding to 7 days post-stroke. At the conclusion of the study, results were unblinded and analyzed using Any-Maze software and video tracking analysis. Animals with missing data at any time point were excluded from the analysis. A repeated-measure two-way ANOVA with Tukey’s post hoc test using alpha of 0.05 was applied for open field, spontaneous alternation testing, and novel objection recognition. Performance on all tasks was initially analyzed irrespective of sex.
Open field (OF)
In brief, mice were placed in a white box (40 cm L × 40 cm W × 40 cm H) for 10 min to assess locomotor function, anxiety, and video-taped for 10 min. Videos were scored for % time in the inner area of the arena, distance traveled, clockwise and anticlockwise rotations.
Novel object recognition (NOR)
The novel object recognition test, including habituation, training, and probe trial, was conducted for 3 days according to previously described methods.70 On the first day, all mice were exposed individually to the test box (40 × 40 × 40 cm) for 10 min to habituate to the test environment without any objects. On the second day, the animals were placed again in the box to explore two identical familiar objects for 10 min. In the probe test, 7 days after the procedure was performed, the animals were placed in the box, one object was exchanged with a novel object of a different shape but a similar texture, and the mice were given 10 min to examine the items. All items and surfaces were cleaned with 70% ethanol to remove olfactory cues and residual odors between tests. The exploration time was recorded using a video camera, and the percentage of exploration time of the novel object was determined according to the following equation: (Tnovel)/(Tnovel + Tfamiliar) × 100. In this behavioral test, the total exploration time (Tnovel + Tfamiliar) was expected to be >10 s in the probe trial; if the total exploration time was less than 10 s, this mouse was not included in the analysis.
Y-maze test
The Y-maze test was performed 7 days post-stroke. The Y-maze was a Y-shaped maze 40 cm long and 3 cm wide with 15-cm-high walls where the arms are 120° angles from each other. Two forms of the Y-maze test were conducted: spontaneous alternations and recognition. For spontaneous alternations, mice were put into the entry arm of the maze and allowed to explore freely. The numbers of entries and the sequence of entered arms were automatically recorded for 5 min using the Any Maze software. A spontaneous alternation was defined as entries into three different arms (A, B, or C) consecutively (i.e., ABC, CAB, or BCA, but not CAC or ABA). The Y-maze arms were thoroughly cleaned with 70% ethanol to remove residual olfactory cues after each test. The calculation for analysis was defined as follows: percent alternation = (number of consecutive alternations)/(total arm entries −2) × 100. In addition, the number of total arm entries served as an indicator of locomotor activity for the Y-maze recognition test. For novel arm recognition, one arm of the Y-Maze is blocked off and the animal is allowed to explore the other two arms for 5 min. The animal’s memory function is tested when the animal is returned to the maze with all arms open and monitored for the tendency to spend time in the new arm or the known arms for an additional 5 min.
Immunohistochemistry
Mouse brain tissue
At the completion of the procedure, sham or MCAO, mice used for immunohistochemistry were euthanized and transcardially perfused with PBS followed by cold 4% paraformaldehyde (PFA). Following rapid decapitation, the brain was carefully removed from the skull and post-fixed overnight in PFA, followed by a dehydration step for 48h in 30% sucrose. The next day, whole brains were frozen in O.C.T. Compound (Tissue-Tek) and cryosectioned in series of 30 mm-thick floating sections. For Thioflavin-S (ThioS) staining, the free-floating sections were first washed with 1X PBS, followed by washes using a graded series of ethanol (100%, 95%, 70%, 50%) for 3 min each. The sections were then incubated at room temperature in the dark in 0.5% ThioS in 50% ethanol for 10 min. The 0.5% solution of ThioS in 50% ethanol was made with dH2O and filtered through a 0.22mm filter, shielded from light. Finally, sections were washed with 50% ethanol (3 × 5 min) and one final 1X PBS wash (3 × 5 min). Following ThioS staining, or if the slides were not stained with ThioS, the standard staining procedure was followed. Free-floating brain sections are washed with 1X PBS (3 × 5 min) and permeabilized using 0.1% Triton X-100 for 1H. Next, sections were immersed in NATS blocking solution (20% FBS, 0.5% tween 20 in 1X PBS) overnight at 4°C. Primary antibodies and dilutions were applied the next day as follows: anti-ionized calcium-binding adapter molecule 1 (Iba1; 1:1000; Fisher Scientific), neuronal nuclei (NeuN; 1:500 Abcam), anti-glial fibrillary protein (GFAP; 1:1000; 3670 Cell Signaling), Lycopersicon Esculentum (Tomato) Lectin (LEL, TL), DyLight 488 (1:200; Vector Laboratories) anti-Claudin-5 (claudin-5; 1:500 Cell Signaling), anti-Occludin (Occln; 1:500 Cell Signaling), anti-zonula occludens-1 (ZO-1; 1:500 Fisher Scientific), anti-doublecortin (DCX; 1:200 Santa Cruz), anti-BrdU (1:200, Abcam), and anti-CXCL12/SDF-1 (Cxcl12; 1:500 RD Systems). The next day, sections were rinsed in 1X PBS and then incubated with goat anti-rabbit IgG (1:500; Fisher Scientific), goat anti-mouse IgG (1:500; Fisher Scientific), or goat anti-rat IgG (1:500; Fisher Scientific) for 1h at room temperature. After, sections were free floated in 1X PBS and mounted on Superfrost Plus Gold slides (Fisher Scientific), mounted with ProLong Diamond antifade mountant (Fisher Scientific) or Fluoromount-G with DAPI (Fisher Scientific), dried overnight, and imaged. For BrdU co-immunostaining, a DNA hydrolysis step was added after permeabilization but before blocking. Sections were incubated with 1 M HCl for 30 min at RT, followed by incubation with 0.1 M sodium borate buffer for 30 min. Afterward, the PBS-rinsed sections were blocked in NATS overnight, as described above. Images were acquired using a confocal microscope.
Human brain tissue specimens
Postmortem brain samples with case details, tissue region, age of the subject, and gender are provided in Figure S7C. The samples were supplied by the NIH NeuroBioBank at the University of Miami Brain Endowment Bank. Tissue specimens were dissected from by an expert neuropathologist.71 The tissue sections were then taken from the hippocampus formation, which included the entorhinal cortex, the Cornu Ammonis (CA) regions CA1–CA3, the subiculum, and the dentate gyrus (DG). Under the supervision of a trained Brain Bank histologist, sections were embedded in paraffin blocks on a Leica Tissue-Tek Processor (Leica Biosystems). Next, paraffin-embedded blocks were sectioned at a 20-μm thickness using a Leica RM2245 microtome (Leica Microsystems Ltd.) then mounted on glass slides. After deparaffinization steps using xylene and ethyl alcohol, endogenous peroxidase activity was blocked using 3% hydrogen peroxide (H2O2) for 10 min. Sections were immersed in preheated 10 mM citric acid, pH 6.0, for 30 min and cooled in 98% formic acid for 5 min. Slides were blocked in 5% normal whole goat serum (Vector Laboratories) for 20 min before being incubated overnight at 4°C in a solution of mouse anti-CD31 antibody (1:500), rabbit anti-β-Amyloid (1:500). The next day, slides were incubated in anti-mouse IgG Alexa 594 (1:500) and anti-rabbit IgG Alexa 488 (1:500) secondary antibody in PBS for 1 h. Finally, the sections were dehydrated, cleared in xylene, and cover slipped with fluoromount-G with DAPI (Fisher Scientific), dried overnight, and imaged. All immunofluorescence imaging was taken on the Olympus FluoView 1200 Laser Scanning Confocal Microscope (Olympus, Center Valley, PA, USA).
Microvessel isolation and quantification with RNAscope
Following MCAO and recovery, mice were euthanized followed by perfusion with ice-cold PBS and rapid decapitation. Microvessels were collected as previously described.72 Briefly, the brain was removed from the skull and the brain stem and olfactory bulbs were thrown away. Additionally, the brain was bisected into hemispheres based on stroke location (0.5 - 1g by weight) and snap frozen in liquid nitrogen. Brain tissue was homogenized in cold isolation buffer B (102 mM NaCl, 4.7 mM KCl, 2.5 mM CaCl2, 1.2 mM KH2PO4, 1.2 mM MgSO4, 15 mM HEPES, 25 mM NaHCO3, 10 mM glucose, 1 mM sodium pyruvate) supplemented with protector RNase inhibitors (Sigma). The suspension was transferred with 26% dextran (MW, 150 kDa) in isolation buffer and placed in a rotating incubator at 5,800 × g for 20 min at 4°C. The pellets were resuspended with cold isolation buffer and filtered through a 300 μm (Fisher Scientific), and a 120 μm (Merck) nylon mesh filter successively to remove large undigested fragments. The filtered homogenates were spun at 1,500 × g for 10 min at 4°C and then resuspended in 200 mL of isolation Buffer B. From the 200 mL microvessel suspension, carefully pipette 7 mL vertically across a clean Superfrost charged slide. Using a plastic coverslip, gently smear the suspension across the glass slide. Next, place the prepared slides in a slide staining jar and wash with 1X PBS. Next, transfer the slides into a new jar containing 10% formalin for 30 min at room temperature. Following this, repeat with a 1X PBS wash. Finally, dehydrate the slides by transferring into a new slide staining jar containing 50 mL of 50% EtOH >50 mL of 70% EtOH >50 mL of 100% EtOH >50 mL of 100% EtOH for 10 min each. Microvessels were quantified via immunohistochemistry or RNAscope. RNA in situ hybridization (ISH) was performed using the RNAScope Multiplex Fluorescent Detection kit v2 (Advanced Cell Diagnostics). The RNAscope experiment was carried out according to the manufacturer’s instructions. In this protocol, RNAs of interest are selectively probed and fluorescently labeled. RNA probes used in this experiment were: PECAM-1 (ACD), TYROBP (ACD). At the end of signal development, slides were stained with fluorophores (ACD, Opal 520 and 570). Lastly, sections were mounted using ProLong Gold Antifade Mountant solution (Fisher Scientific). Image acquisition was done on an Olympus FluoView 1200 Laser Scanning Confocal Microscope (Olympus, Center Valley, USA). Images at 100× objective were loaded into FIJI. To measure the microvessel diameter, a minimum of 6 random lines were drawn in ImageJ perpendicular to the vessel axis at random on different parts of the same vessel. For full quantification, multiple images from different mice per experiment were used and averaged for a data point. The average length was calculated from the measurements and plotted on a graph.73
Computed tomography angiogram perfusion
Mice were administered 200 μL of a 1000 U/mL heparin solution via IP injection 5 min before the perfusion experiment began. Next, mice were first perfused with 30–40 mL of PBS with 10 U/mL heparin heated to 37°C at a rate of 5 mL/min using a peristaltic pump. A total of 7.225 mL of the MICROFIL contrast agent (1.5 mL of microfil, 5.5 mL of diluent, and 225 μL of curing agent) was then perfused at a flow rate of 2.0 mL/min). The brain was removed from the skull and stored in 10% formalin for 24 h, then placed in decalcifying solution for another 24 h prior to imaging. Images were reconstructed and videos generated using HOROS software, segmentation was performed using Imalytics, and vasculature cross section analysis was performed using ImageJ.
Quantification of Aβ plaque pathology
Aβ plaque load was determined using FIJI analysis. We chose to examine the plaque accumulation through coronal planes of the frontal cortex that closely aligned with the area of the ischemic infarct, which has a high density of axonal projections. Additionally, we focused our analysis to the specific regions of interest (ROIs): hippocampus, cortex, hemisphere, and whole brain (3–6 images per animal). Images were captured at 4× magnification and stitched together using the FluoView image software (Olympus, USA). Whole brain images were then analyzed by two blind raters in ImageJ to manually delineate the right (contralateral) and left (ipsilateral) hemispheres, as well as the region of the cortex and hippocampus. The hemispheres were assigned based on a small hole made in the contralateral brain hemisphere’s striatum before cryosectioning. These measurements were assessed independently for each animal. Plaque densities measured as: Aβ plaque staining as a percentage of mean intensity to total (ROI) area, and the number of total plaques per ROI which were quantified and compared by genotype and procedure type.
Single-cell tissue dissection and dissociation
Brain dissection and hippocampal cell dissociation were performed in 6 separate experiments. In each experiment we utilized the contralateral hemisphere as an internal control for each biological replicate. No randomization or blinding were performed during sample collection as no comparisons of different conditions were performed. For single-cell dissociation of the hippocampus, the mice were anesthetized with isoflurane, and the brain was quickly removed and transferred into ice-cold Hibernate A medium (Fisher Scientific) under a dissection microscope and then subjected to tissue dissociation. Hippocampal tissues were enzymatically digested using the Adult Brain Dissociation kit (Miltenyi Biotec) and mechanically disrupted with the gentleMCAS Dissociator according to the manufacturer’s instructions. Briefly, tissue from each sample as loaded into a C tube with Enzyme 1 and 2. Tissue was subsequently dissociated on the gentleMACS Octo Dissociator with Heaters for 20–100 mg tissue. Following dissociation, samples were strained through a 70μm filter with dPBS and centrifuged at 300 g × 10 min at 4°C. The supernatant was removed, and the tissue was resuspended in an appropriate amount of dPBS (<400mg, 1550 μL). Next, Debris Removal Solution was added (<400mg, 450μL) and overlaid with dPBS being careful not to disrupt the lower layer and centrifuged at 3000 g × 10 min at 4°C. We found that using ½ acceleration and deceleration for specific brain regions to form undisturbed phase separations. After removing the top two layers and adding fresh dPBS, the cells were spun at 1000 g × 10 min and re-suspended in 0.2 mL of dPBS with 0.05% BSA. A 15-μL cell suspension was stained with trypan blue, and the live cells were counted. In all samples, cells were greater than 90% viable. During the entire procedure, the tissues and cells were kept in ice-cold solutions.
Single-cell RNA sequencing of the mouse hippocampal cell population
The cell suspension was diluted with DPBS containing 0.05% BSA for single-cell capture. Cell suspensions were assessed using the Nexcelom Cellometer K2. The suspensions were prepped following 10X Genomics Chromium Next GEM Single Cell 3’ Reagent Kits v3.1 User Guide. Briefly, cells are partitioned into nanoliter gel beads-in-emulsion (GEMs). A pool of ~3,500,000 10x Genomics barcodes are used to index each individual cell separately and uniquely. Libraries are then created and sequenced on the Illumina Novaseq 6000, with 10x barcodes used to assign reads back to individual partitions, and therefore, to each individual cell. More than 10,000 single-cell events derived from hippocampal cells of mice were captured for recovery.
Single-cell RNA sequencing analysis
Single-cell libraries were constructed according to the manufacturer’s instructions and were sequenced on the Illumina NovaSeq 6000 sequencer targeting an average depth of 100,000 reads per cell for 8,000 cells. The single cell sequencing preprocessing was performed using the 10x Genomics Cell Ranger Single Cell Software Suite (v6.0.2). Briefly, raw sequencing data were demultiplexed, aligned to the mouse genome mm10, and the reads aligned to each gene were counted. Downstream processing was performed using the Seurat R package for single cell analysis v4.4.0 implemented in R v4.3.0.74 Data processing steps included removal of the 5% of cells with the highest and lowest feature counts and cells with >10% mitochondrial RNA reads to remove potential low-quality cells and doublets. Log normalization of expression was performed followed by integration of all samples as previously described.75 Principal component analysis to identify variation between samples revealed that more than 99% of variability was captured in the first 30 components. Thus, clustering was performed with 30 PCs and visualized using Uniform Manifold Approximation and Projection (UMAP) dimension reduction. The function ‘FindConservedMarkers’ was used to identify cluster-specific genes that were conserved across conditions. Cell clusters were manually annotated as specific cell types based on the literature and the datasets for murine cell taxonomy. Differentially expressed genes (DEG) between groups within each cluster were identified using the ‘FindMarkers’ function using the MAST test which employs a generalized linear model framework using cell detection rate across groups as a co-variate and has low error and false discovery rates in comparison with other single nuclei differential expression methods.76,77 GO pathway analysis of DEGs from each cluster was performed using both the hypergeometric test (equivalent to Fisher’s exact test) and the GSEA. GO and pathway annotations were derived from the GO Biological Process 2023. Relevant terms were selected and shown in the figures.
Protein extraction and western blotting
At the time of euthanasia, mice were transcardially perfused with ice-cold saline followed by rapid decapitation. Whole brains were harvested quickly and divided into hemispheres based on contralateral and ipsilateral regions, immediately frozen in liquid nitrogen, and stored in the −80°C freezer until further processing. Whole brain tissues or cells were homogenized in modified radioimmunoprecipitation (RIPA) lysis buffer (Fisher Scientific) plus protease and phosphatase inhibitor cocktails (Fisher Scientific). Tissue homogenates were centrifuged and protein concentration in the resulting tissue or cell lysate was measured using the Pierce BCA assay kit (Scientific). Samples were prepared using RIPA diluent and sodium dodecyl sulfate (SDS). Then, 30 μg (whole brain) of total protein was loaded per lane on 4–20% midi-PROTEAN TGX Stain-Free polyacrylamide precast gels (Bio-Rad Laboratories) and transferred to a nitrocellulose membrane using the Trans-Blot Turbo Transfer System (Bio-Rad Laboratories). Membranes were blocked using 5% bovine serum albumin (BSA) blocking buffer for 24 h at 4°C. The next day, blots were incubated overnight at 4°C with primary antibodies diluted in 5% BSA as follows: PDGF Receptor beta (PDGFRβ; 1:1000 Santa Cruz), CD31 (CD31; 1:1000 Cell Signaling), fibrinogen (fibrinogen; 1:1000 Abcam), anti-ionized calcium-binding adapter molecule 1 (Iba1; 1:1000 Cell Signaling), neuronal nuclei (NeuN; 1:1000 Abcam), anti-glial fibrillary protein (GFAP; 1:1000; Cell Signaling). Blots were washed three times using Tris-buffered saline with 0.1% Tween 20 (TBS-T) before incubation with secondary antibody at room temperature for 1 h as follows: IRDye 680RD Goat anti-rabbit (1:10,000; Licor), IRDye 800CW Goat anti-mouse (1:10,000; Licor). Analysis of GAPDH (Novus Biologicals, Cat# NB600-502FR or Cat# NB600-5021) was performed as an internal control and for sample normalization. Bands were imaged with the Odyssey CLX Imaging System (LICOR) and signal quantification was performed with Image Studio 4.0 software (LICOR).
Gene silencing
ReN cells were seeded in a 6-well culture plate coated with laminin and immediately transfected using Amaxa Nucleofector Technology and the Basic Nucleofector Kit.78 For gene silencing, cells were transfected with 0.5 μg per 106 cells of the following small interfering RNA (siRNA): 3 unique 27mer SDF1 (CXCL12)-siRNAs 3 unique 27mer PI3KC2A-siRNAs, 3 unique 27mer CREB3L2-siRNAs, or trilencer-27 universal scrambled (SCR) silencer siRNA duplex as a negative control.
IncuCyte ZOOM
ReN cells were allowed to grow overnight for 24 h after transfection with gene silencing siRNA. After 24 h, the plates were placed in an incubator with the IncuCyte Zoom system. This began the analysis of neurogenesis at time = 0h post-transfection. The Incucyte ZOOM automated cell imaging system was used to automatically acquire kinetic data every 4 h to assess neurite outgrowth and neurogenesis. Images were taken every 4 h for 16 h. Neurotrack software was used to quantify neuron cell-body clusters, neurite branch points, and neurite branch points per cell-body area. Three separate experiments were run to obtain each data point on the graph.
Quantitative PCR
Total RNA was isolated from cell culture lysates using RNeasy mini kit according to the manufacturer’s instructions. Total nucleic acid concentrations were quantified using the Nanodrop 2000. RT-PCR was performed with a total of 100 ng of RNA using the qScript XLT 1-Step RT-qPCR ToughMix Low ROX reaction mix and the Applied Biosystems 7500 system. TaqMan Gene Expression Assays and the following primers were utilized: Hs01592193_m1: Creb3l2 primer; Hs00904054_m1: Pik3c2a primer; Hs03676656_mH: Cxcl12 primer. Human GAPDH was used as an endogenous control for sample normalization. PCR product specificity was determined using melting curve assessment and gene expression differences were determined using the ΔΔCt method.
QUANTIFICATION AND STATISTICAL ANALYSIS
Using G*Power v.3.1 software,79 we performed an a priori sample size calculation for each outcome measurement, utilizing variances from preliminary MCAO mouse model studies. The study was powered at 80% to detect a 25% difference between genotype and treatment groups (α = 0.05). At least 6 mice per group were required for infarct volume and neurobehavioral deficit measurements, while 3–5 mice per group were needed for molecular studies. All mice were randomly assigned to treatment groups, with data collection and analysis conducted in a blinded fashion. Exact n values, statistical comparisons, and significance levels for each experiment are detailed in the figure legends. Statistical comparisons between two groups were evaluated using unpaired, two-tailed Student’s t-tests, with a p value of <0.05 considered statistically significant. For comparisons between three or more groups, we used one-way ANOVA followed by Tukey’s multiple comparison analysis. A Kaplan-Meier test was used to determine statistical significance between survival curves. Behavioral, biochemical, and immunohistological data were analyzed using either Student’s t-test, one-way ANOVA, or two-way ANOVA, with Bonferroni’s and Tukey’s post hoc tests employed to examine biologically relevant interactions from the two-way ANOVA. All data are presented as mean ± standard error of the mean (SEM) unless otherwise noted. Statistical significance is denoted as *p < 0.05, **p < 0.01, ***p < 0.001, and ****p < 0.0001 unless otherwise noted.
Supplementary Material
KEY RESOURCES TABLE
| REAGENT or RESOURCE | SOURCE | IDENTIFIER |
|---|---|---|
| Antibodies | ||
| Anti-Iba1 polyclonal antibody, Rabbit (IHC) | Fisher Scientific | Cat # PA5-27436; RRID: AB_2544912 |
| Anti-NeuN antibody, Rat (IHC) | Abcam | Cat # ab279297; RRID: AB_3095692 |
| Anti-GFAP antibody, Mouse (IHC/WB) | Cell Signaling | Cat # 3670; RRID: AB_561049 |
| Anti-claudin 5 antibody, Rabbit (IHC) | Cell Signaling | Cat # 49564S; RRID: AB_3065250 |
| Anti-occludin antibody, Rabbit (IHC) | Cell Signaling | Cat # 91131S; RRID: AB_2934013 |
| Anti-zonula occludens-1 antibody, Mouse (IHC) | Fisher Scientific | Cat # 33-9100; RRID: AB_2533147 |
| Anti-doublecortin/DCX antibody (E–6), Mouse (IHC) | Santa Cruz | Cat # sc-271390; RRID: AB_10610966 |
| Anti-CXCL12/SDF1 antibody, Mouse (IHC) | RD Systems | Cat # MAB350-SP; RRID: AB_2088149 |
| Alexa Fluor® 594 Anti-BrdU antibody [BU1/75 (ICR1)] | Abcam | Cat # ab220076; RRID: AB_2819150 |
| Goat anti-Rabbit IgG (H + L) Cross-Adsorbed Secondary Antibody, Alexa Fluor™ 594 (IHC) | Fisher Scientific | Cat # A11012; RRID: AB_2534079 |
| Goat anti-Rat IgG2b Heavy Chain Secondary Antibody, FITC (IHC) | Fisher Scientific | Cat # NB7129; RRID: AB_524584 |
| Goat anti-Mouse IgG (H + L) Cross-Adsorbed Secondary Antibody, Alexa Fluor™ 488 (IHC) | Fisher Scientific | Cat # A11001: RRID: AB_2534069 |
| Donkey anti-Goat IgG (H + L) Cross-Absorbed Secondary antibody, Alexa Fluor™ 647 (IHC) | Fisher Scientific | Cat # A21447; RRID: AB_2535864 |
| Anti-CD31 (PECAM-1) (89C2) Mouse mAb (IHC/WB) | Cell Signaling | Cat # 3528S; RRID: AB_2160882 |
| Anti-β-Amyloid (1–40) (D8Q7I) Rabbit mAb (IHC) | Cell Signaling | Cat # 12990S; RRID: AB_2798082 |
| Lycopersicon Esculentum (Tomato) Lectin (LEL, TL), DyLight® 488 | Vector Laboratories | Cat # DL-1174-1; RRID: AB_2336404 |
| Goat anti-Mouse IgG (H + L) Highly Cross-Adsorbed Secondary Antibody, Alexa Fluor 594 | Fisher Scientific | Cat # A11032; RRID: AB_2534091 |
| Goat anti-Rabbit IgG (H + L) Highly Cross-Adsorbed Secondary Antibody, Alexa Fluor 488 | Fisher Scientific | Cat # A11034; RRID: AB_2576217 |
| Iba1/AIF-1 Rabbit mAb (WB) | Cell Signaling | Cat # 17198S; RRID: AB_2820254 |
| Anti-PDGF Receptor beta/PDGFR-β Antibody (D-6) (WB) | Santa Cruz | Cat # SC-374573; RRID: AB_10990921 |
| Anti-Fibrinogen beta chain antibody (WB) | Abcam | Cat # ab137830; RRID: AB_ |
| Recombinant Anti-NeuN antibody [EPR12763] - Neuronal Marker | Abcam | Cat # ab177487; RRID: AB_2532109 |
| GAPDH Antibody (6C5cc) [DyLight 755] | Novus Biologicals | Cat # NB600-502IR; RRID: AB_3195204 |
| GAPDH Antibody (6C5cc) [DyLight 680] | Novus Biologicals | Cat # NB600-502FR; RRID: AB_3195201 |
| IRDye® 800CW Goat anti-Rabbit IgG Secondary Antibody | Licor | Cat # 926-32211; RRID: AB_621843 |
| IRDye® 680RD Goat anti-Rabbit IgG Secondary Antibody | Licor | Cat # 926-68071; RRID: AB_10956166 |
| IRDye® 680RD Goat anti-Mouse IgG Secondary Antibody | Licor | Cat # 926-68070; RRID: AB_10956588 |
| IRDye® 800CW Goat anti-Mouse IgG Secondary Antibody | Licor | Cat # 926-32210; RRID: AB_621842 |
| Biological samples | ||
| Five CAA/AD human hippocampus samples (formalin fixed) | University of Miami Brain Endowment Bank (NIH NeuroBioBank) | NIH Request #2648 |
| Five healthy human control hippocampus samples (formalin fixed) | University of Miami Brain Endowment Bank (NIH NeuroBioBank) | NIH Request #2648 |
| Chemicals, peptides, and recombinant proteins | ||
| O.C.T. Compound | Sakura | Cat # 4583 |
| Thioflavin S | AAT Bioquest, Inc | Cat # 23059 |
| 2,3,5- triphenyltetrazolium chloride (TTC) | Biosynth | Cat # T-6940 |
| AE-18 | MedChemExpress | Cat # HY-151527 |
| Triton X-100 | Sigma | Cat # 93443-100mL |
| Hoechst 33342, Trihydrochloride, Trihydrate - 10 mg/mL Solution in Water | Fisher Scientific | Cat #H3570 |
| BrdU (5-bromo-2′-deoxyuridine), Thymidine analog (ab142567 | Abcam | Cat # ab142567 |
| ProLong™ Diamond Antifade Mountant | Fisher Scientific | Cat #P36965 |
| Fluoromount-G™ Mounting Medium, with DAPI | Fisher Scientific | Cat # 00-4959-52 |
| Normal Saline | G-Biosciences | Cat # 786-561 |
| Paraformaldehyde solution 4% in PBS, 1 L | Santa Cruz Biotechnology | Cat # SC-281692 |
| Sucrose | Sigma | Cat #S0389-5KG |
| Bovine Serum Albumin (BSA) | Sigma | Cat # A7906-500G |
| RIPA Lysis Buffer System | Fisher Scientific | Cat # 89900 |
| Protease Inhibitor | Sigma | Cat # 11836153001 |
| Laemmli (6X, SDS-Sample Buffer, Reducing) | Boston Bioproducts | Cat # BP-111R |
| NewBlot™ Nitro Stripping Buffer for Nitrocellulose Membranes | Licor | Cat # 928-40030 |
| Hibernate™-A Medium | Fisher Scientific | Cat # A1247501 |
| Precision Plus Protein Dual Color Standards, 500 μL | Bio-rad | Cat # 1610374 |
| Precision Plus Protein Kaleidoscope Standards | Bio-Rad | Cat # 1610375 |
| Pierce™ 20X TBS Buffer | Fisher Scientific | Cat # 28358 |
| 10x Tris/Glycine/SDS | BioRad | Cat # 1610772 |
| Corn oil | Sigma | Cat #C8267-500ML |
| Complete™ Protease Inhibitor Cocktail | Sigma | Cat # 11697498001 |
| Normal Whole Goat Serum | Vector Laboratories | Cat # 101098-382 |
| NaCl | Sigma | Cat #S9888-25G |
| KCl | Sigma | Cat #P3911-25G |
| CaCl2 | Sigma | Cat #C4901-100G |
| KH2PO4 | Sigma | Cat #P0662-25G |
| MgSO4 | Sigma | Cat # 208094-500G |
| HEPES | Sigma | Cat #H3375-25G |
| NaHCO3 | Sigma | Cat #S5761-500G |
| Glucose | Sigma | Cat #G8270-100G |
| Sodium Pyruvate | Sigma | Cat #P2256-25G |
| Dextran from Leuconostoc mesenteroides (150k kDa) | Sigma | Cat #D4876-500G |
| Opal 570 | Akoya Biosciences | FP1488001KT |
| Opal 520 | Akoya Biosciences | FP1487001KT |
| Protector RNase Inhibitor | Sigma | 3335402001 |
| Fetal Bovine Serum (FBS) | ATCC | Cat # 30-2020 |
| Tween 20 | Fisher Scientific | Cat #J20605-AP |
| Laminin, mouse purified | Sigma-Aldrich | Cat # CC095 |
| ReNcell NSC Maintenance Medium | Sigma-Aldrich | Cat# SCM005 |
| Fibroblast growth factor basic, human recombinant | Sigma-Aldrich | Cat # GF003AF |
| Epidermal growth factor | Sigma-Aldrich | Cat # GF144 |
| Critical commercial assays | ||
| Chromium Single Cell 3′ Reagent Kit v.3.1 | 10x Genomics | Cat# PN-1000121 |
| Pierce BCA Protein Assay Kit | Fisher Scientific | Cat# 23225 |
| Adult Brain Dissociation Kit, mouse, and rat | Miltenyi Biotec | Cat # 130107677 |
| RNAscope™ Multiplex Fluorescent Reagent kit V2 | Advanced Cell Diagnostics | Cat # 323100 |
| RNeasy Kit | Qiagen | Cat # 74104 |
| qScript XLT 1-Step RT-qPCR ToughMix Low ROX | QuantBio | Cat # 95133-100 |
| Basic Nucleofector Kit for Primary Mammalian Endothelial Cells | Lonza | Cat # VPI-1001 |
| Deposited data | ||
| Raw scRNAseq data | This paper | [GEO]: [GSE266033] |
| Experimental models: organisms/strains | ||
| B6.Cg-Tg(APPSwFlLon, PSEN1*M146L*L286V) 6799Vas/Mmjax (5xFAD) | Jackson Laboratory | 034840-JAX; RRID: MMRRC_034840-JAX |
| Experimental models: cell lines | ||
| ReNcell CX Human Neural Progenitor Cell Line | Sigma-Aldrich | Cat # SCC007 |
| Oligonucleotides | ||
| RNAscope™ Probe- Mm-Tyrobp-C3 | Advanced Cell Diagnostics | Cat # 408191-C3 |
| RNAscope™ Probe- Mm-Pecam1 (CD31) | Advanced Cell Diagnostics | Cat # 316721 |
| Cxcl12 primer | Fisher Scientific | Cat # Hs03676656_mH |
| Pik3c2a primer | Fisher Scientific | Cat # Hs00904054_m1 |
| Creb3l2 primer | Fisher Scientific | Cat # Hs01592193_m1 |
| Human GAPDH Primer | Fisher Scientific | Cat # 4310884E |
| SDF1 (CXCL12) Human siRNA Oligo Duplex | Origene | Cat # SR304303 |
| Pik3c2a Human siRNA Oligo Duplex | Origene | Cat # SR303516 |
| Creb3l2 (CXCL12) Human siRNA Oligo Duplex | Origene | Cat# SR312107 |
| Trilencer-27 Universal scrambled negative control siRNA duplex | Origene | Cat # SR0004 |
| Software and algorithms | ||
| GraphPad Prism Version 9 | GraphPad | https://www.graphpad.com/scientificsoftware/prism/ |
| FIJI/ImageJ | NIH | https://imagej.net/software/fiji/downloads |
| Any-Maze Software | Any-Maze | https://www.any-maze.com/ |
| FluoView Image Software | Olympus | https://www.olympus-lifescience.com/ |
| Biorender | Biorender Inc. | https://www.biorender.com/ |
| Image Studio 4.0 software | LICOR | N/A |
| CellRanger v6.0.2 | 10X Genomics | https://www.10xgenomics.com/support/software/cell-ranger/latest/getting-started/cr-what-is-cell-ranger |
| Seurat R toolkit for single cell genomics | Sajita Lab | https://github.com/satijalab/seurat/releases/tag/v4.4.0 |
| Incucyte 2023A Software | Sartorius | https://downloads.essenbioscience.com/get/incucyte-2023a-rev1-updater |
| G*Power v.3.1 software | Heinrich Heine Universität Düsseldorf | https://www.psychologie.hhu.de/arbeitsgruppen/allgemeine-psychologie-und-arbeitspsychologie/gpower |
| Moor Software V.3.01 | Moor Instruments Inc. | N/A |
| Other | ||
| 7-0 fine MCAO suture Re L45 PK5 | Doccol | Cat # 701945PK5Re |
| 7-0 large MCAO suture Re L45 PK5 | Doccol | Cat # 702145PK5Re |
| 7-0 large MCAO suture Re L45 PK5 | Doccol | Cat # 702245PK5Re |
| 7-0 Max MCAO suture Re L45 PK5 | Doccol | Cat # 702345PK5Re |
| 7-0 medium MCAO suture Re L45 PK5 | Doccol | Cat # 702045PK5Re |
| Trans-Blot Turbo Midi nitrocellulose transfer packs | Bio-Rad | Cat # 1704159 |
| 4-20% Mini-PROTEAN® TGX Stain-Free™ Protein Gels, 10 well, 50 μL | Bio-Rad | Cat # 4568094 |
| Laser Doppler Moor LDI V3.01 | Moor Instruments Inc. | N/A |
| Fisherbrand™ Tissue Path Superfrost™ Plus Gold Slides | Fisher Scientific | 22–035813 |
| Olympus FluoView 1200 Laser Scanning Confocal Microscope | Olympus | N/A |
| Leica Tissue-Tek Processor | Leica Biosystems | N/A |
| Leica RM2245 microtome | Leica Microsystems Ltd | N/A |
| CryoStar NX70 | Fisher Scientific | N/A |
| 300 mm filter | Fisher Scientific | Cat # NC1480938 |
| 120 mm filter | Merck | Cat # NY2H09000 |
| Nexcelom Cellometer K2 | Nexcelom | N/A |
| Illumina Novaseq 6000 | Novogen Co. Ltd. | N/A |
| Animal feeding needle, non-sterile, reusable, type 304 SS | Sigma | Cat # CAD7911 |
| Nanodrop 2000 | ThermoFisher Scientific | N/A |
| Incucyte ZOOM | Sartorius | N/A |
Highlights.
Function and tissue recovery after ischemic stroke are significantly impaired in 5xFAD mice
Changes in the BBB reduce blood flow and reperfusion capability in the 5xFAD genotype
Transcriptomic analysis links endothelial cells and hippocampal NPCs via the PI3K pathway
Activation of the PI3K pathway rescues neurogenesis in 5xFAD mice post stroke
ACKNOWLEDGMENTS
This work was supported in part by the National Institutes of Health (MH072567, MH122235, MH128022, DA 059849, DA050528, DA044579, and HL126559). O.M.O. was co-supported by the National Institute of Neurological Disorders and Stroke (NINDS) and the National Institute on Aging (NIA) of the National Institutes of Health under award number NS125905. The content is solely the responsibility of the authors and does not necessarily represent the official views of the National Institutes of Health. O.N. was supported by the Research Supplement to Promote Diversity in Health-Related Research Program from the National Institute on Drug Abuse (NIDA) of the National Institutes of Health under award number DA050528-02S1. S.T. was supported by that National Institute of Allergy and Infectious Diseases of the National Institutes of Health (NIAID) grant P30AI073961. A.V.M. and L.M.T. were supported by NIH grant DP1-DA051828. We would like to thank the Cancer Modeling Shared Resource (CMSR) at the University of Miami Miller School of Medicine for support with imaging studies. The use of the CMSR was supported by the NCI-funded Sylvester Comprehensive Cancer Center (P30CA240139). We would also like to thank the Brain Endowment Bank at the University of Miami for providing human brain specimens and histology services, the Sequencing Core at the John P. Hussman Institute for Human Genomics sequencing core facility for sample preparation and next-generation sequencing, and the HIHG Statistical and Bioinformatics Consulting Core.
Footnotes
DECLARATION OF INTERESTS
The authors declare no competing interests.
SUPPLEMENTAL INFORMATION
Supplemental information can be found online at https://doi.org/10.1016/j.celrep.2024.114848.
REFERENCES
- 1.Hecht M, Krämer LM, von Arnim CAF, Otto M, and Thal DR (2018). Capillary cerebral amyloid angiopathy in Alzheimer’s disease: association with allocortical/hippocampal microinfarcts and cognitive decline. Acta Neuropathol. 135, 681–694. 10.1007/s00401-018-1834-y. [DOI] [PubMed] [Google Scholar]
- 2.Pfeifer LA, White LR, Ross GW, Petrovitch H, and Launer LJ (2002). Cerebral amyloid angiopathy and cognitive function: the HAAS autopsy study. Neurology 58, 1629–1634. 10.1212/wnl.58.11.1629. [DOI] [PubMed] [Google Scholar]
- 3.Case NF, Charlton A, Zwiers A, Batool S, McCreary CR, Hogan DB, Ismail Z, Zerna C, Coutts SB, Frayne R, et al. (2016). Cerebral Amyloid Angiopathy Is Associated With Executive Dysfunction and Mild Cognitive Impairment. Stroke 47, 2010–2016. 10.1161/strokeaha.116.012999. [DOI] [PubMed] [Google Scholar]
- 4.McCarron MO, Nicoll JA, Ironside JW, Love S, Alberts MJ, and Bone I (1999). Cerebral Amyloid Angiopathy–Related Hemorrhage. Stroke 30, 1643–1646. 10.1161/01.STR.30.8.1643. [DOI] [PubMed] [Google Scholar]
- 5.Rivier CA, Kamel H, Sheth KN, Iadecola C, Gupta A, de Leon MJ, Ross E, Falcone GJ, and Murthy SB (2024). Cerebral Amyloid Angiopathy and Risk of Isolated Nontraumatic Subdural Hemorrhage. JAMA Neurol. 81, 163–169. 10.1001/jamaneurol.2023.4918. [DOI] [PMC free article] [PubMed] [Google Scholar]
- 6.Reijmer YD,van Veluw SJ, and Greenberg SM (2016). Ischemic brain injury in cerebral amyloid angiopathy. J. Cereb. Blood Flow Metab 36, 40–54. 10.1038/jcbfm.2015.88. [DOI] [PMC free article] [PubMed] [Google Scholar]
- 7.Sun X, He G, Qing H, Zhou W, Dobie F, Cai F, Staufenbiel M, Huang LE, and Song W (2006). Hypoxia facilitates Alzheimer’s disease pathogenesis by up-regulating BACE1 gene expression. Proc. Natl. Acad. Sci. USA 103, 18727–18732. 10.1073/pnas.0606298103. [DOI] [PMC free article] [PubMed] [Google Scholar]
- 8.Bracko O, Cruz Hernández JC, Park L, Nishimura N, and Schaffer CB (2021). Causes and consequences of baseline cerebral blood flow reductions in Alzheimer’s disease. J. Cereb. Blood Flow Metab 41, 1501–1516. 10.1177/0271678x20982383. [DOI] [PMC free article] [PubMed] [Google Scholar]
- 9.Shen Q, Goderie SK, Jin L, Karanth N, Sun Y, Abramova N, Vincent P, Pumiglia K, and Temple S (2004). Endothelial cells stimulate self-renewal and expand neurogenesis of neural stem cells. Science 304, 1338–1340. 10.1126/science.1095505. [DOI] [PubMed] [Google Scholar]
- 10.Shen Q, Wang Y, Kokovay E, Lin G, Chuang SM, Goderie SK, Roysam B, and Temple S (2008). Adult SVZ stem cells lie in a vascular niche: a quantitative analysis of niche cell-cell interactions. Cell Stem Cell 3, 289–300. 10.1016/j.stem.2008.07.026. [DOI] [PMC free article] [PubMed] [Google Scholar]
- 11.Deng W, Aimone JB, and Gage FH (2010). New neurons and new memories: how does adult hippocampal neurogenesis affect learning and memory? Nat. Rev. Neurosci 11, 339–350. 10.1038/nrn2822. [DOI] [PMC free article] [PubMed] [Google Scholar]
- 12.Drew LJ, Fusi S, and Hen R (2013). Adult neurogenesis in the mammalian hippocampus: why the dentate gyrus? Learn. Mem 20, 710–729. 10.1101/lm.026542.112. [DOI] [PMC free article] [PubMed] [Google Scholar]
- 13.Mu Y, and Gage FH (2011). Adult hippocampal neurogenesis and its role in Alzheimer’s disease. Mol. Neurodegener 6, 85. 10.1186/1750-1326-6-85. [DOI] [PMC free article] [PubMed] [Google Scholar]
- 14.Tata M, and Ruhrberg C (2018). Cross-talk between blood vessels and neural progenitors in the developing brain. Neuronal Signal. 2, Ns20170139. 10.1042/ns20170139. [DOI] [PMC free article] [PubMed] [Google Scholar]
- 15.Paredes I, Himmels P, and Ruiz de Almodóvar C (2018). Neurovascular Communication during CNS Development. Dev. Cell 45, 10–32. 10.1016/j.devcel.2018.01.023. [DOI] [PubMed] [Google Scholar]
- 16.Palmer TD, Willhoite AR, and Gage FH (2000). Vascular niche for adult hippocampal neurogenesis. J. Comp. Neurol 425, 479–494. . [DOI] [PubMed] [Google Scholar]
- 17.Osborne OM, Naranjo O, Heckmann BL, Dykxhoorn D, and To-borek M (2023). Anti-amyloid: An antibody to cure Alzheimer’s or an attitude. iScience 26, 107461. 10.1016/j.isci.2023.107461. [DOI] [PMC free article] [PubMed] [Google Scholar]
- 18.Forner S, Kawauchi S, Balderrama-Gutierrez G, Kramár EA, Matheos DP, Phan J, Javonillo DI, Tran KM, Hingco E, da Cunha C, et al. (2021). Systematic phenotyping and characterization of the 5xFAD mouse model of Alzheimer’s disease. Sci. Data 8, 270. 10.1038/s41597-021-01054-y. [DOI] [PMC free article] [PubMed] [Google Scholar]
- 19.Bertrand L, Méroth F, Tournebize M, Leda AR, Sun E, and Toborek M (2019). Targeting the HIV-infected brain to improve ischemic stroke outcome. Nat. Commun 10, 2009. 10.1038/s41467-019-10046-x. [DOI] [PMC free article] [PubMed] [Google Scholar]
- 20.Brønnum-Hansen H, Davidsen M, and Thorvaldsen P; Danish MONICA Study Group (2001). Long-Term Survival and Causes of Death After Stroke. Stroke 32, 2131–2136. 10.1161/hs0901.094253. [DOI] [PubMed] [Google Scholar]
- 21.Boyle PA, Yu L, Nag S, Leurgans S, Wilson RS, Bennett DA, and Schneider JA (2015). Cerebral amyloid angiopathy and cognitive outcomes in community-based older persons. Neurology 85, 1930–1936. 10.1212/wnl.0000000000002175. [DOI] [PMC free article] [PubMed] [Google Scholar]
- 22.Kraeuter AK,Guest PC,and Sarnyai Z (2019).The Y-Maze for Assessment of Spatial Working and Reference Memory in Mice. Methods Mol. Biol 1916, 105–111. 10.1007/978-1-4939-8994-2_10. [DOI] [PubMed] [Google Scholar]
- 23.Yang HS, Onos KD, Choi K, Keezer KJ, Skelly DA, Carter GW, and Howell GR (2021). Natural genetic variation determines microglia heterogeneity in wild-derived mouse models of Alzheimer’s disease. Cell Rep. 34, 108739. 10.1016/j.celrep.2021.108739. [DOI] [PMC free article] [PubMed] [Google Scholar]
- 24.Beuker C, Schafflick D, Strecker J-K, Heming M, Li X, Wolbert J, Schmidt-Pogoda A, Thomas C, Kuhlmann T, Aranda-Pardos I, et al. (2022). Stroke induces disease-specific myeloid cells in the brain parenchyma and pia. Nat. Commun 13, 945. 10.1038/s41467-022-28593-1. [DOI] [PMC free article] [PubMed] [Google Scholar]
- 25.Zhong S, Ding W, Sun L, Lu Y, Dong H, Fan X, Liu Z, Chen R, Zhang S, Ma Q, et al. (2020). Decoding the development of the human hippocampus. Nature 577, 531–536. 10.1038/s41586-019-1917-5. [DOI] [PubMed] [Google Scholar]
- 26.Marques S, Zeisel A, Codeluppi S, van Bruggen D, Mendanha Falcão A, Xiao L, Li H, Häring M, Hochgerner H, Romanov RA, et al. (2016). Oligodendrocyte heterogeneity in the mouse juvenile and adult central nervous system. Science 352, 1326–1329. 10.1126/science.aaf6463. [DOI] [PMC free article] [PubMed] [Google Scholar]
- 27.Borysova L, Wray S, Eisner DA, and Burdyga T (2013). How calcium signals in myocytes and pericytes are integrated across in situ microvascular networks and control microvascular tone. Cell Calcium 54, 163–174. 10.1016/j.ceca.2013.06.001. [DOI] [PMC free article] [PubMed] [Google Scholar]
- 28.Gonzales AL, Klug NR, Moshkforoush A, Lee JC, Lee FK, Shui B, Tsoukias NM, Kotlikoff MI, Hill-Eubanks D, and Nelson MT (2020). Contractile pericytes determine the direction of blood flow at capillary junctions. Proc. Natl. Acad. Sci. USA 117, 27022–27033. 10.1073/pnas.1922755117. [DOI] [PMC free article] [PubMed] [Google Scholar]
- 29.Holgado BL, Martínez-Muñoz L, Sánchez-Alcañiz JA, Lucas P, Pérez-García V, Pérez G, Rodríguez-Frade JM, Nieto M, Marín O, Carrasco YR, et al. (2013). CXCL12-Mediated Murine Neural Progenitor Cell Movement Requires PI3Kβ Activation. Mol. Neurobiol 48, 217–231. 10.1007/s12035-013-8451-5. [DOI] [PubMed] [Google Scholar]
- 30.McLarnon JG (2021). A Leaky Blood-Brain Barrier to Fibrinogen Contributes to Oxidative Damage in Alzheimer’s Disease. Antioxidants 11, 102. 10.3390/antiox11010102. [DOI] [PMC free article] [PubMed] [Google Scholar]
- 31.Petersen MA, Ryu JK, and Akassoglou K (2018). Fibrinogen in neurological diseases: mechanisms, imaging and therapeutics. Nat. Rev. Neurosci 19, 283–301. 10.1038/nrn.2018.13. [DOI] [PMC free article] [PubMed] [Google Scholar]
- 32.Naranjo O, Torices S, Clifford PR, Daftari MT, Osborne OM, Fattakhov N, and Toborek M (2022). Pericyte infection by HIV-1: a fatal attraction. Retrovirology 19, 27. 10.1186/s12977-022-00614-3. [DOI] [PMC free article] [PubMed] [Google Scholar]
- 33.Nortley R, Korte N, Izquierdo P, Hirunpattarasilp C, Mishra A, Jaunmuktane Z, Kyrargyri V, Pfeiffer T, Khennouf L, Madry C, et al. (2019). Amyloid β oligomers constrict human capillaries in Alzheimer’s disease via signaling to pericytes. Science 365, eaav9518. 10.1126/science.aav9518. [DOI] [PMC free article] [PubMed] [Google Scholar]
- 34.Ceradini DJ, Kulkarni AR, Callaghan MJ, Tepper OM, Bastidas N, Kleinman ME, Capla JM, Galiano RD, Levine JP, and Gurtner GC (2004). Progenitor cell trafficking is regulated by hypoxic gradients through HIF-1 induction of SDF-1. Nat. Med 10, 858–864. 10.1038/nm1075. [DOI] [PubMed] [Google Scholar]
- 35.Guo F, Wang Y, Liu J, Mok SC, Xue F, and Zhang W (2016). CXCL12/CXCR4: a symbiotic bridge linking cancer cells and their stromal neighbors in oncogenic communication networks. Oncogene 35, 816–826. 10.1038/onc.2015.139. [DOI] [PubMed] [Google Scholar]
- 36.Daniel P, Filiz G, Brown DV, Hollande F, Gonzales M, D’Abaco G, Papalexis N, Phillips WA, Malaterre J, Ramsay RG, and Mantamadiotis T (2014). Selective CREB-dependent cyclin expression mediated by the PI3K and MAPK pathways supports glioma cell proliferation. Oncogenesis 3, e108. 10.1038/oncsis.2014.21. [DOI] [PMC free article] [PubMed] [Google Scholar]
- 37.Hou L, and Klann E (2004). Activation of the phosphoinositide 3-kinase-Akt-mammalian target of rapamycin signaling pathway is required for metabotropic glutamate receptor-dependent long-term depression. J. Neurosci 24, 6352–6361. 10.1523/jneurosci.0995-04.2004. [DOI] [PMC free article] [PubMed] [Google Scholar]
- 38.Chen YL, Monteith N, Law PY, and Loh HH (2010). Dynamic association of p300 with the promoter of the G protein-coupled rat delta opioid receptor gene during NGF-induced neuronal differentiation. Biochem. Biophys. Res. Commun 396, 294–298. 10.1016/j.bbrc.2010.04.083. [DOI] [PubMed] [Google Scholar]
- 39.Lo W-T, Zhang Y,Vadas O, Roske Y, Gulluni F, De Santis MC, Zagar AV, Stephanowitz H, Hirsch E, Liu F, et al. (2022). Structural basis of phosphatidylinositol 3-kinase C2α function. Nat. Struct. Mol. Biol 29, 218–228. 10.1038/s41594-022-00730-w. [DOI] [PMC free article] [PubMed] [Google Scholar]
- 40.Park M, Baker W, Cambow D, Gogerty D, Leda AR, Herlihy B, Pavlenko D, Van Den Nieuwenhuizen S, and Toborek M (2021). Methamphetamine Enhances HIV-Induced Aberrant Proliferation of Neural Progenitor Cells via the FOXO3-Mediated Mechanism. Mol. Neurobiol 58, 5421–5436. 10.1007/s12035-021-02407-9. [DOI] [PMC free article] [PubMed] [Google Scholar]
- 41.Martins AH, Zayas-Santiago A, Ferrer-Acosta Y, Martinez-Jimenez SM, Zueva L, Diaz-Garcia A, and Inyushin M (2019). Accumulation of Amyloid Beta (Aβ) Peptide on Blood Vessel Walls in the Damaged Brain after Transient Middle Cerebral Artery Occlusion. Biomolecules 9, 350. 10.3390/biom9080350. [DOI] [PMC free article] [PubMed] [Google Scholar]
- 42.Chakraborty A, de Wit NM, van der Flier WM, and de Vries HE (2017). The blood brain barrier in Alzheimer’s disease. Vascul. Pharmacol 89, 12–18. 10.1016/j.vph.2016.11.008. [DOI] [PubMed] [Google Scholar]
- 43.Chen L, Choi JJ, Choi YJ, Hennig B, and Toborek M (2012). HIV-1 Tat-induced cerebrovascular toxicity is enhanced in mice with amyloid deposits. Neurobiol. Aging 33, 1579–1590. 10.1016/j.neuro-biolaging.2011.06.004. [DOI] [PMC free article] [PubMed] [Google Scholar]
- 44.Cadavid D, Mena H, Koeller K, and Frommelt RA (2000). Cerebral beta amyloid angiopathy is a risk factor for cerebral ischemic infarction. A case control study in human brain biopsies. J. Neuropathol. Exp. Neurol 59, 768–773. 10.1093/jnen/59.9.768. [DOI] [PubMed] [Google Scholar]
- 45.Perosa V, Zanon Zotin MC, Schoemaker D, Sveikata L, Etherton MR, Charidimou A, Greenberg SM, and Viswanathan A (2024). Association Between Hippocampal Volumes and Cognition in Cerebral Amyloid Angiopathy. Neurology 102, e207854. 10.1212/wnl.0000000000207854. [DOI] [PMC free article] [PubMed] [Google Scholar]
- 46.Li Y, Chang S, Li W, Tang G, Ma Y, Liu Y, Yuan F, Zhang Z, Yang G-Y, and Wang Y (2018). cxcl12-engineered endothelial progenitor cells enhance neurogenesis and angiogenesis after ischemic brain injury in mice. Stem Cell Res. Ther 9, 139. 10.1186/s13287-018-0865-6. [DOI] [PMC free article] [PubMed] [Google Scholar]
- 47.Zenaro E, Piacentino G, and Constantin G (2017). The blood-brain barrier in Alzheimer’s disease. Neurobiol. Dis 107, 41–56. 10.1016/j.nbd.2016.07.007. [DOI] [PMC free article] [PubMed] [Google Scholar]
- 48.Cheng J, Korte N, Nortley R, Sethi H, Tang Y, and Attwell D (2018). Targeting pericytes for therapeutic approaches to neurological disorders. Acta Neuropathol. 136, 507–523. 10.1007/s00401-018-1893-0. [DOI] [PMC free article] [PubMed] [Google Scholar]
- 49.Kutcher ME, and Herman IM (2009). The pericyte: cellular regulator of microvascular blood flow. Microvasc. Res 77, 235–246. 10.1016/j.mvr.2009.01.007. [DOI] [PMC free article] [PubMed] [Google Scholar]
- 50.Sagare AP, Bell RD, Zhao Z, Ma Q, Winkler EA, Ramanathan A, and Zlokovic BV (2013). Pericyte loss influences Alzheimer-like neurodegeneration in mice. Nat. Commun 4, 2932. 10.1038/ncomms3932. [DOI] [PMC free article] [PubMed] [Google Scholar] [Retracted]
- 51.Halliday MR, Rege SV, Ma Q, Zhao Z, Miller CA, Winkler EA, and Zlokovic BV (2016). Accelerated pericyte degeneration and blood-brain barrier breakdown in apolipoprotein E4 carriers with Alzheimer’s disease. J. Cereb. Blood Flow Metab 36, 216–227. 10.1038/jcbfm.2015.44. [DOI] [PMC free article] [PubMed] [Google Scholar]
- 52.Davis H, and Attwell D (2023).A tight squeeze: how do we make sense of small changes in microvascular diameter? J. Physiol 601, 2263–2272. 10.1113/jp284207. [DOI] [PMC free article] [PubMed] [Google Scholar]
- 53.Bruckmaier M, Tachtsidis I, Phan P, and Lavie N (2020). Attention and Capacity Limits in Perception: A Cellular Metabolism Account. J. Neurosci 40, 6801–6811. 10.1523/jneurosci.2368-19.2020. [DOI] [PMC free article] [PubMed] [Google Scholar]
- 54.Kitamura A, Saito S, Maki T, Oishi N,Ayaki T, Hattori Y, Yamamoto Y, Urushitani M, Kalaria RN, Fukuyama H, et al. (2016). Gradual cerebral hypoperfusion in spontaneously hypertensive rats induces slowly evolving white matter abnormalities and impairs working memory. J. Cereb. Blood Flow Metab 36, 1592–1602. 10.1177/0271678x15606717. [DOI] [PMC free article] [PubMed] [Google Scholar]
- 55.Törteli A, Tóth R, Berger S, Samardzic S, Bari F, Menyhárt Á, and Farkas E (2023). Spreading depolarization causes reperfusion failure after cerebral ischemia. J. Cereb. Blood Flow Metab 43, 655–664. 10.1177/0271678x231153745. [DOI] [PMC free article] [PubMed] [Google Scholar]
- 56.Kecskés S, Menyhárt Á, Bari F, and Farkas E (2023). Nimodipine augments cerebrovascular reactivity in aging but runs the risk of local perfusion reduction in acute cerebral ischemia. Front. Aging Neurosci 15, 1175281. 10.3389/fnagi.2023.1175281. [DOI] [PMC free article] [PubMed] [Google Scholar]
- 57.Shen Q, Goderie SK, Jin L, Karanth N, Sun Y, Abramova N, Vincent P, Pumiglia K, and Temple S (2004). Endothelial Cells Stimulate Self-Renewal and Expand Neurogenesis of Neural Stem Cells. Science 304, 1338–1340. 10.1126/science.1095505. [DOI] [PubMed] [Google Scholar]
- 58.Williams JL, Holman DW, and Klein RS (2014). Chemokines in the balance: maintenance of homeostasis and protection at CNS barriers. Front. Cell. Neurosci 8, 154. 10.3389/fncel.2014.00154. [DOI] [PMC free article] [PubMed] [Google Scholar]
- 59.Peng H, Kolb R, Kennedy JE, and Zheng J (2007). Differential expression of CXCL12 and CXCR4 during human fetal neural progenitor cell differentiation. J. Neuroimmune Pharmacol 2, 251–258. 10.1007/s11481-007-9081-3. [DOI] [PMC free article] [PubMed] [Google Scholar]
- 60.Wu Y, Peng H, Cui M, Whitney NP, Huang Y, and Zheng JC (2009). CXCL12 increases human neural progenitor cell proliferation through Akt-1/FOXO3a signaling pathway. J. Neurochem 109, 1157–1167. 10.1111/j.1471-4159.2009.06043.x. [DOI] [PMC free article] [PubMed] [Google Scholar]
- 61.Zhao X, and van Praag H (2020). Steps towards standardized quantification of adult neurogenesis. Nat. Commun 11, 4275. 10.1038/s41467-020-18046-y. [DOI] [PMC free article] [PubMed] [Google Scholar]
- 62.Osborne OM, Kowalczyk JM, Louis KDP, Daftari MT, Colbert BM, Naranjo O, Torices S, András IE, Dykxhoorn DM, and Toborek M (2022). Brain endothelium-derived extracellular vesicles containing amyloid-beta induce mitochondrial alterations in neural progenitor cells. Extracell. Vesicles Circ. Nucl. Acids 3, 340–362. 10.20517/evcna.2022.22. [DOI] [PMC free article] [PubMed] [Google Scholar]
- 63.Janssens R, Struyf S, and Proost P (2018). The unique structural and functional features of CXCL12. Cell. Mol. Immunol 15, 299–311. 10.1038/cmi.2017.107. [DOI] [PMC free article] [PubMed] [Google Scholar]
- 64.Sánchez-Alegría K, Flores-León M, Avila-Muñoz E, Rodríguez-Corona N, and Arias C (2018). PI3K Signaling in Neurons: A Central Node for the Control of Multiple Functions. Int. J. Mol. Sci 19, 3725. 10.3390/ijms19123725. [DOI] [PMC free article] [PubMed] [Google Scholar]
- 65.Castellino RC, and Durden DL (2007). Mechanisms of disease: the PI3K-Akt-PTEN signaling node–an intercept point for the control of angiogenesis in brain tumors. Nat. Clin. Pract. Neurol 3, 682–693. 10.1038/ncpneuro0661. [DOI] [PubMed] [Google Scholar]
- 66.Peltier J, O’Neill A, and Schaffer DV (2007). PI3K/Akt and CREB regulate adult neural hippocampal progenitor proliferation and differentiation. Dev. Neurobiol 67, 1348–1361. 10.1002/dneu.20506. [DOI] [PubMed] [Google Scholar]
- 67.Cukier HN, Duarte CL, Laverde-Paz MJ, Simon SA, Van Booven DJ, Miyares AT, Whitehead PL, Hamilton-Nelson KL, Adams LD, Carney RM, et al. (2023). An Alzheimer’s disease risk variant in TTC3 modifies the actin cytoskeleton organization and the PI3K-Akt signaling pathway in iPSC-derived forebrain neurons. Neurobiol. Aging 131, 182–195. 10.1016/j.neurobiolaging.2023.07.007. [DOI] [PMC free article] [PubMed] [Google Scholar]
- 68.Selvadurai MV, Moon MJ, Mountford SJ, Ma X, Zheng Z, Jennings IG, Setiabakti NM, Iman RP, Brazilek RJ, Abidin Z, N.A., et al. (2020). Disrupting the platelet internal membrane via PI3KC2α inhibition impairs thrombosis independently of canonical platelet activation. Sci. Transl. Med 12, eaar8430. 10.1126/scitranslmed.aar8430. [DOI] [PubMed] [Google Scholar]
- 69.Cuomo O, Pignataro G, Gala R, Scorziello A, Gravino E, Piazza O, Tufano R, Di Renzo G, and Annunziato L (2007). Antithrombin reduces ischemic volume, ameliorates neurologic deficits, and prolongs animal survival in both transient and permanent focal ischemia. Stroke 38, 3272–3279. 10.1161/strokeaha.107.488486. [DOI] [PubMed] [Google Scholar]
- 70.Bevins RA, and Besheer J (2006). Object recognition in rats and mice: a one-trial non-matching-to-sample learning task to study ’recognition memory. Nat. Protoc 1, 1306–1311. 10.1038/nprot.2006.205. [DOI] [PubMed] [Google Scholar]
- 71.Vontell RT, Gober R, Dallmeier J, Brzostowicki D, Barreda A, Blennow K, Zetterberg H, Kvartsberg H, Gultekin SH, de Rivero Vaccari JP, et al. (2024). Association of region-specific hippocampal reduction of neurogranin with inflammasome proteins in post mortem brains of Alzheimer’s disease. Alzheimers Dement. 10, e12444. 10.1002/trc2.12444. [DOI] [PMC free article] [PubMed] [Google Scholar]
- 72.Park M, Levine H, and Toborek M (2016). Exercise protects against methamphetamine-induced aberrant neurogenesis. Sci. Rep 6, 34111. 10.1038/srep34111. [DOI] [PMC free article] [PubMed] [Google Scholar]
- 73.Mishra A, O’Farrell FM, Reynell C, Hamilton NB, Hall CN, and Attwell D (2014). Imaging pericytes and capillary diameter in brain slices and isolated retinae. Nat. Protoc 9, 323–336. 10.1038/nprot.2014.019. [DOI] [PubMed] [Google Scholar]
- 74.Hao Y, Hao S, Andersen-Nissen E, Mauck WM, Zheng S, Butler A, Lee MJ, Wilk AJ, Darby C, Zager M, et al. (2021). Integrated analysis of multimodal single-cell data. Cell 184, 3573–3587.e29. 10.1016/j.cell.2021.04.048. [DOI] [PMC free article] [PubMed] [Google Scholar]
- 75.Stuart T, Butler A, Hoffman P, Hafemeister C, Papalexi E, Mauck WM, Hao Y, Stoeckius M, Smibert P, and Satija R (2019). Comprehensive Integration of Single-Cell Data. Cell 177, 1888–1902.e21. 10.1016/j.cell.2019.05.031. [DOI] [PMC free article] [PubMed] [Google Scholar]
- 76.Finak G, McDavid A, Yajima M, Deng J, Gersuk V, Shalek AK, Slichter CK, Miller HW, McElrath MJ, Prlic M, et al. (2015). MAST: a flexible statistical framework for assessing transcriptional changes and characterizing heterogeneity in single-cell RNA sequencing data. Genome Biol. 16, 278. 10.1186/s13059-015-0844-5. [DOI] [PMC free article] [PubMed] [Google Scholar]
- 77.Soneson C, and Robinson MD (2018). Bias, robustness and scalability in single-cell differential expression analysis. Nat. Methods 15, 255–261. 10.1038/nmeth.4612. [DOI] [PubMed] [Google Scholar]
- 78.Torices S, Roberts SA, Park M, Malhotra A, and Toborek M (2020). Occludin, caveolin-1, and Alix form a multi-protein complex and regulate HIV-1 infection of brain pericytes. Faseb. J 34, 16319–16332. 10.1096/fj.202001562R. [DOI] [PMC free article] [PubMed] [Google Scholar]
- 79.Faul F, Erdfelder E, Lang AG, and Buchner A (2007). G*Power 3: a flexible statistical power analysis program for the social, behavioral, and biomedical sciences. Behav. Res. Methods 39, 175–191. 10.3758/bf03193146. [DOI] [PubMed] [Google Scholar]
Associated Data
This section collects any data citations, data availability statements, or supplementary materials included in this article.
Supplementary Materials
Data Availability Statement
All raw fastq data files from 5xFAD mouse scRNA-seq were deposited into GEO under accession GSE266033.
This paper does not report original code.
Any additional information required to reanalyze the data reported in this work paper is available from the lead contact upon request.