Abstract
During the initial year of the COVID-19 pandemic, a disproportionate share of COVID-19–related deaths occurred among nursing home residents. Initial estimates of all-cause mortality rates also spiked in early and late 2020 before falling to near or below historical rates by early 2021. During the first 3 years of the pandemic, the US nursing home resident population also decreased by 18% (239 000 fewer residents) compared with pre-pandemic levels. After accounting for these population changes, the all-cause nursing home mortality rate has remained above pre-pandemic levels through the middle of 2023. The peak was in December 2020 at 5692 deaths per 100 000 residents, which was 19% higher than estimates not accounting for the population decrease.
Keywords: all-cause mortality, COVID-19 pandemic, nursing home occupancy
Introduction
Nursing home residents accounted for an estimated 15% of documented COVID-19–related deaths in the United States (172 000 deaths) despite there being less than 0.5% of the US population residing in nursing homes.1-3 Indeed, some of the earliest pandemic signals in the United States came from nursing home deaths.4,5 Attributing deaths to COVID-19, however, has been difficult. Access to testing has varied over time, thus impacting COVID-19 diagnoses; furthermore, deaths in COVID-19–positive individuals whose cause was unrelated or only indirectly related to COVID-19 may be variably attributed to COVID-19 across reporters.6,7 Consequently, there has been increasing focus on all-cause mortality, but limited data currently exist on all-cause mortality rates within nursing homes.6,8
Importantly, the pandemic materially impacted the number of nursing home residents, the denominator of the mortality rate, through multiple paths. First, many residents died. Second, fewer individuals may have entered homes because of perceptions of elevated risk or concerns of limited visitation or constrained socialization, and more may have left homes to stay with family or friends. Third, nursing homes might have had fewer beds available because of factors such as infection-control efforts (eg, conversion of multi- to single-occupancy rooms), staffing shortages, or closures. The number of individuals hospitalized also fluctuated substantially during the pandemic, which likely impacted post-acute discharges, a common path to nursing home admission.
In this study, we estimated nursing home daily resident population, both nationally and at the nursing home level, during the initial 3 years of the pandemic using nursing home-day–level data from multiple sources. After accounting for the changes in the size of the national nursing home population over the period 2020–2022, nursing home mortality remained substantially higher than would be expected based on historical trends, even after the initial outbreaks and the introduction of SARS-CoV-2 vaccines.
Data and methods
We used the Centers for Medicare and Medicaid Services (CMS) Quality, Certification, and Oversight Reports (QCOR) to identify nursing homes, defined by unique CMS certification number (CCN), with active CMS certification on each day between January 2017 and June 2023. There were 16 168 CCNs active for at least 3 days of the period.9 We also tracked the number of active nursing homes over time to determine whether closures may have confounded population-level resident trends.
We then used (1) Payroll-Based Journal (PBJ) Public Use File data and (2) National Healthcare Safety Network (NHSN) data sources to construct a composite measure of nursing home-day–level resident census.2,10 The PBJ data capture nurse and non-nurse staffing levels across nursing homes with mandatory reporting since July 2016. The PBJ's daily resident census estimates (used to monitor minimum staffing rate requirements) come from CMS's Minimum Data Set assessments.10 Through NHSN, nursing homes submit data to the Centers for Disease Control and Prevention (CDC) Long-Term Care Facility (LTCF) COVID-19 Module—Surveillance Reporting Pathways and COVID-19 Vaccinations—with weekly reporting since May 24, 2020.
Gaps in data would be expected during a major disaster. To obtain a more accurate estimate we therefore used 2 data sources to assess the nursing home resident population size and to address information gaps in either source, including different start dates for data collection. When information from both the PBJ and NHSN were available for a given nursing home-day (41.9% of all home-days), we used the mean value. When both resident census estimates were available, PBJ and NHSN data were highly correlated (Pearson’s correlation = 0.97).
When information was available from only 1 source (54.3% of home-days), we used that value. When neither source had information on a given home-day (3.7% of home-days), we estimated the resident census based on other information from the same home. For nursing home-day observations with non-missing occupancy data both preceding and following that observation in time (2.4% of home-days), we interpolated linearly; for those with non-missing data only preceding or only a following value (1.4% of home-days), the resident census was set to that non-missing bound. We chose to linearly interpolate because the trend (marginal decrease) that we found for the homes for which we had data during the period was approximately linear.
In sensitivity analyses, we estimated an upper and lower bound for each week's number of residents in each home (ie, the resident census) by applying the weekly percentage change in census for homes at the 10th or 90th percentile in the change of residents to the homes with missing data. In essence, we allowed the homes with missing information on some weeks to experience the same percentage change in resident census as other nursing homes (without missing data) during the same week. For all weeks, the linear interpolated estimates, our main approach, fell within the upper and lower bounds of the estimated values based on other homes, as expected.
To quantify the impact of utilizing our census estimates, we calculated 2 parallel estimates for the national nursing home monthly all-cause death rate for 2020–2022. For all numerators, we used monthly death counts from CDC Provisional Vital Statistics data, which capture all reported deaths that occurred in each given nursing home.3 We then calculated rates using constant population estimates from January 2020 (pre-pandemic, unadjusted) and rates adjusted for changes in population size over time. To illustrate the pre-pandemic monthly trend, we plotted a smoothed trend on monthly 2019 rates.11 Although we utilize the available January–June 2023 resident census data to provide additional data for imputation, the study period focused on the most informative pandemic years (2020–2022) for which we obtained population and death data.
Limitations
There are notable limitations. First, the data sources have incomplete coverage, as might be expected during any major disaster. In PBJ data, 21.2% of nursing home-day observations were missing throughout quarter 1 of 2020, likely because of the relaxation of data reporting requirements by CMS during the initial outbreak. Missingness was only 3.3% thereafter. Missingness also progressively improved from 9.5% in 2017 to 3.0% of homes in 2019.12
National Healthcare Safety Network data reporting started in the week ending May 24, 2020 (months after the initial outbreak), and adherence to reporting requirements increased over the first several reporting weeks, maintaining 1.0% total missingness at the home-day level from the start of reporting. The NSHN reported weekly, rather than daily, resident census estimates, and pre-pandemic data and data covering the first few months of the pandemic were unavailable.
Using a composite dataset reduced much of the missing information. Using complementary data sources resulted in missing information for 3.7% of all 36.4 million nursing home-day observations defined by QCOR (January 2017 to June 2023), and 2.2% since January 2019.
Second, we assumed a 1-to-1 relationship between CCN number and unique nursing homes, which could have been incorrect.13 Homes theoretically could have had multiple CCNs during the observation period if the nursing home changed certification type (skilled nursing facility vs nursing facility vs both) or recertified due to relocation or temporary closure.
Last, the data sources provide nursing home–level estimates and do not contain individual patient-level information, such as information on risk levels or demographics. Thus, we are unable to stratify resident census changes by characteristics or determine whether mortality rate changes are due to changing risk distributions, such as if the nursing home resident population became sicker or less sick over time. Unfortunately, accessible, real-time, individual-level longitudinal clinical information does not exist for all nursing home residents. If such information were available, policymakers could better assess which patients died, examine the flows into and out of nursing homes, and track expected mortality compared with actual rates.
Results
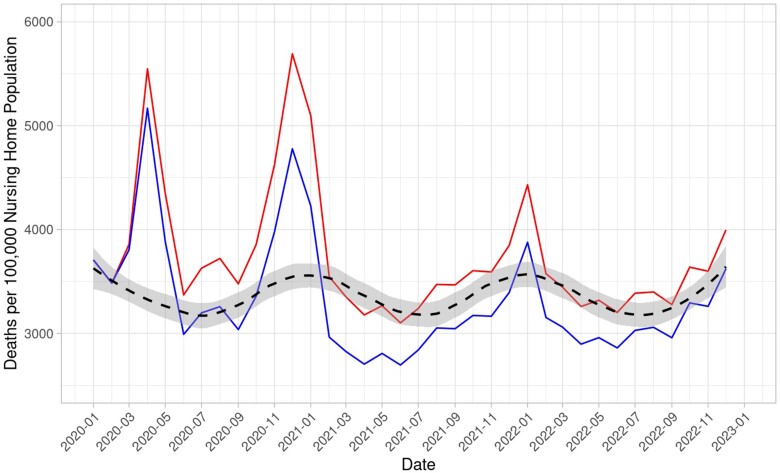
Through the end of 2022 (year 3 of the COVID-19 pandemic), mortality rates accounting for population changes were above 2019 levels, and above estimates assuming a constant population size (see Figure 1). The largest discrepancy in pandemic-era monthly mortality rates (accounting for vs not accounting for resident population changes) was, in December 2020, a difference of 19.1% (difference = 914/100 000 residents or 5692 vs 4778 per 100 000 in December 2020). Monthly estimates assuming a constant population both exceeded and fell below pre-pandemic monthly levels.
Figure 1.
Monthly all-cause nursing home mortality rate—using static vs actual resident population estimates (2020–2022). Source: Authors’ analyses of data from the Centers for Disease Control and Prevention (CDC) and Centers for Medicare & Medicaid Services (CMS).2,3,9-11 Blue = pandemic era mortality rate: using the static January 2020 Population. Red = pandemic era mortality rate: accounting for population changes. Black dashed line = pre-pandemic trend. The dashed line was produced by fitting a trend to 2019 monthly nursing home all-cause mortality rate using the default smooth setting for a generalized additive model defined by ggplot::geom_smooth() in the R programming language (span = 1/3, enabling a yearly smoothing window). The 2019 values do account for monthly changes in nursing home population (ie, the underlying 2019 rates were calculated using the same methodology as those calculated to produce the “Pandemic Era Mortality Rate: Accounting for Population Changes”), although the population size was relatively stable during this pre-pandemic period. Gray shading indicates the corresponding 95% normal CI.
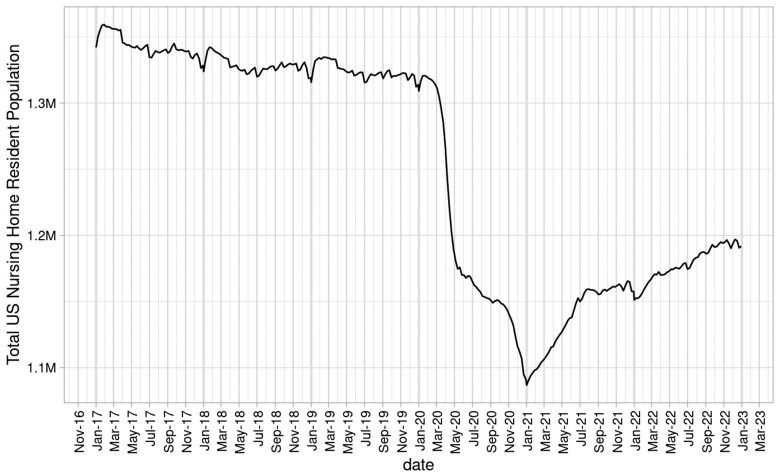
Throughout the pre-pandemic period, the nursing home population remained relatively stable, with a daily mean of 1.33 million (SD = 10 751) (see Figure 2). During the pandemic, the population fell from a peak of 1.32 million in January 2020 to a minimum of 1.09 million in January 2021, an 18% decrease (239 000 fewer residents). Subsequently, the population increased steadily to 1.19 million by the end of the study period (December 2022), a 10% decrease from the peak (133 000 fewer residents compared to January). Notably, the population decreased by 122 000 (1.31–1.19 million; 9.3%) over the first 2 months of the pandemic (March–April 2020).
Figure 2.
US nursing home resident population—weekly average (2020–2022). Source: Authors’ analyses of data from the Centers for Disease Control and Prevention (CDC) and Centers for Medicare & Medicaid Services (CMS). The nursing home population decreased most rapidly over the 2 months of March and April 2020, by 122 000 (1.31–1.19 million; 9.3%). The minimum nursing home population was 1.09 million in January 2021.
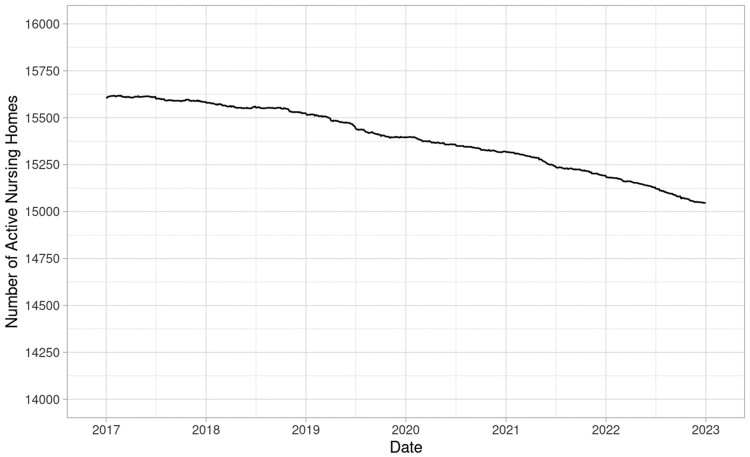
There were 16 161 nursing homes operating at any point during the period from January 2017 to December 2022. In January 2017, there were 15 606 nursing homes operating, and, by December 2022, there were 15 045 homes. A total of 1077 nursing homes closed, 514 opened, and 42 opened and then closed during the study period (see Figure 3).
Figure 3.
Number of active nursing homes (2017–2022). Source: Authors’ analyses of data from the Centers for Medicare & Medicaid Services (CMS).9 The large number of net closures from 15 606 in January 2017 to 15 045 in December 2022 represents a 3.6% decrease in total nursing homes.
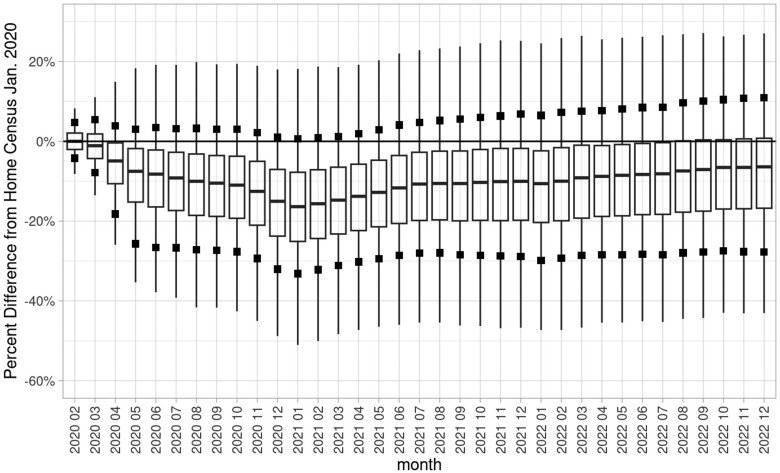
Figure 4 shows the changes in monthly mean resident census (ie, number) at the nursing home level for the 14 854 nursing homes with continuous active CMS certification for the entire period from January 2020 to December 2022. The median nursing home experienced a 16.2% decline in resident census (25th and 75th percentiles: −25.1%, −7.4%) by January 2021 and a 6.0% decrease (25th and 75th percentiles: −16.7%, 1.3%) by December 2022, compared with January 2020 census levels; 89.2% of nursing homes had decreased in census levels by January 2021, and most (70.2%) were still below historical census levels by December 2022.
Figure 4.
Nursing home–level variation in monthly resident census percentage change from January 2020 (2020–2022). Source: Authors’ analyses of data from the Centers for Disease Control and Prevention (CDC) and Centers for Medicare & Medicaid Services (CMS).2,9,10 Solid black squares were added to the standard box and whisker plot to mark 10%/90% deciles. Black boxes were added to indicate 10%/90% deciles. Outliers were excluded. Percentage changes in monthly resident census (number) were plotted for each nursing home in each month, producing the box and whisker plot. For example, a nursing home whose census began at 100 residents (January 2020) but was 80 residents in August 2020 would have a −20% census change for August 2020. Includes 14 854 nursing homes with continuous active CMS certification for the entire period January 2020 to December 2022 (5 of these facilities were removed because there were no residents reported during January 2020, despite active enrollment).
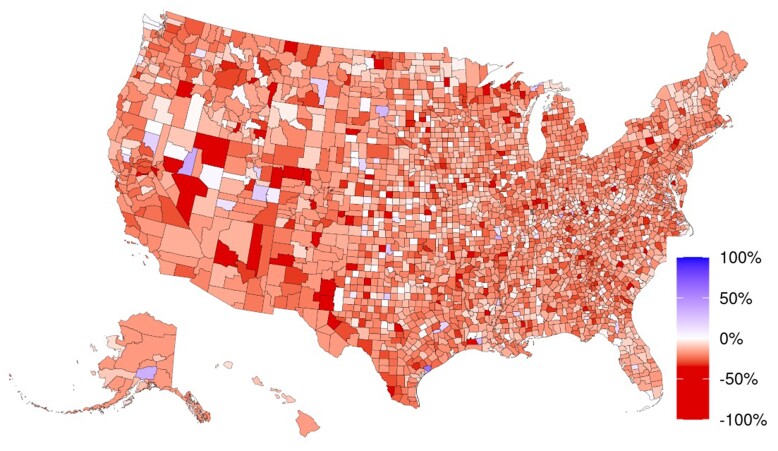
Figure 5 displays the resident census changes between January 2020 and January 2021 (the nadir of resident population during the period) for 2887 counties with a CMS-certified nursing home. We observed a relatively homogenous geographic effect over this period with no apparent regional trend at the county level. During this year, the nursing home resident population decreased in 95% of counties.
Figure 5.
County-level average monthly resident population percentage change from January 2020 to January 2021. Source: Authors’ analyses of data from the Centers for Disease Control and Prevention (CDC) and Centers for Medicare & Medicaid Services (CMS).2,9,10 Excluded counties were set to the median value. January 2020–January 2021 was selected for comparing the pre-pandemic with the lowest monthly population.
Discussion
Prior to the COVID-19 pandemic (2016–2019), the US monthly nursing home population was relatively constant. With the pandemic onset in early 2020, the number of nursing home residents in the United States declined by approximately one-fifth in the first year (with the median home experiencing a −16.2% decline in resident census). While there was partial recovery by the second year of the pandemic, the nursing home resident population by the end of 2022 remained below pre-pandemic levels. Adjusting for population changes increased the monthly nursing home all-cause mortality rate for the entire period from March 2020 through the end of our observation period in December 2022 (5692 vs 4778 deaths per 100 000 residents at its peak in December 2020 when accounting for vs not accounting for resident population changes). After population adjustment, nearly all monthly all-cause mortality rates since the onset of the pandemic have remained above the pre-pandemic levels; failure to account for the denominator changes, however, yielded estimates that incorrectly would have suggested that mortality returned to pre-pandemic levels.
The nursing home population decrease in 2020 of 239 000 residents was almost 3 times higher than the number of deaths directly attributed to COVID-19 (85 000). While some of the resident population changes may have reflected deaths not attributed to COVID-19, changes in transfer or use patterns likely contributed to this change, and highlight the dynamic population shifts that occurred during the pandemic.
Although the number of active nursing homes declined during the pandemic era, the observed population trends cannot be explained by nursing home closures alone. The declining number of active facilities was also a continuation of the pre-pandemic trend (see Figure 3).
The resident census changes appeared to impact the majority of nursing homes, and occurred in most counties in the United States. Indeed, most homes experienced a sharp census decline starting in early 2020, followed by marginal recovery thereafter. Moreover, the timing of the census changes unexpectedly appeared to be relatively consistent across regions of the United States, even though documented COVID-19 infection rates varied across areas (see Appendix Figure A1).14
In this manuscript, we reinforce the point that, with a new pathogen and evolving diagnostic standards, plus a complex health shock, information on all-cause mortality would be superior to attempting to count only pathogen-specific deaths. The information about the daily or weekly numbers of nursing home residents represents a valuable incremental change that improves the accuracy of the mortality information for policymakers. Counting deaths from all causes also is critical.
During disasters, policymakers need accurate information on vulnerable subgroups of the population, such as residents of nursing homes. During the COVID-19 pandemic, the country developed the infrastructure for collecting counts of deaths occurring in nursing homes. This early information was extremely valuable, providing some of the initial signals of the pandemic and supported monitoring of this vulnerable subgroup as the pandemic evolved. The interpretability of this information arguably changed over time during the pandemic because of the sudden drop in the number of nursing home residents. We illustrated how simplified rate estimates assuming constant numbers of residents proved progressively more inaccurate over time.
In an attempt to decrease COVID-19–related deaths, the American Rescue Plan Act of 2021 (ARPA) awarded $500 million to the Nursing Home & Long-Term Care Facility Strike Team and Infrastructure Project.15,16 Having better information about mortality rates could have assisted in targeting these efforts.
In an ideal world policymakers would have longitudinal health and mortality risk information on all persons residing in nursing homes, as well as on persons at risk of entering a nursing home, or who recently left nursing homes, combined with detailed staffing information. With such comprehensive, longitudinal information, policymakers and researchers could gain an accurate assessment of how future pandemics are impacting this vulnerable population. Although we will not have such a system in the United States in the near future, and likely never, incremental steps toward it should prove useful.
The CDC took a first step in this direction after the initial months of the pandemic when it began the NHSN LTCF COVID-19 Module: Surveillance Reporting Pathways and COVID-19 Vaccinations. Refining the data elements, assessing their accuracy and quality, and increasing their availability could help policymakers and clinicians address future threats to our nursing home residents. However, the majority of mandatory NHSN reporting related to the pandemic is set to expire this year, retaining only voluntary data submission (pending budgetary changes).17 This would take a step back from the successes realized from having these data throughout the pandemic and would be deferring a surveillance system for future health crises.
In sum, during the early months of the pandemic, many reports focused on the numbers of residents who died from COVID-19, which is problematic because attribution to a new virus is difficult, especially during a chaotic time period when concerns about the virus disrupted many aspects of life; emphasis on all-cause mortality helps address this problem. Accounting for changing numbers of residents (denominator) reveals that the all-cause mortality rate in nursing homes has been high and remained high for much of the first 3 years of the pandemic.
Supplementary Material
Contributor Information
Max Weiss, Mongan Institute, Massachusetts General Hospital, Boston, MA 02114, United States.
Sharon-Lise T Normand, Department of Biostatistics, Harvard T.H. Chan School of Public Health, Boston, MA 02115, United States; Department of Health Care Policy, Harvard Medical School, Boston, MA 02115, United States.
David C Grabowski, Department of Health Care Policy, Harvard Medical School, Boston, MA 02115, United States.
Deborah Blacker, Department of Psychiatry, Massachusetts General Hospital, Boston, MA 02114, United States; Department of Epidemiology, Harvard T.H. Chan School of Public Health, Boston, MA 02115, United States.
Joseph P Newhouse, Department of Health Care Policy, Harvard Medical School, Boston, MA 02115, United States; Harvard Kennedy School, Cambridge, MA 02138, United States; National Bureau of Economic Research, Cambridge, MA 02138, United States; Department of Health Policy and Management, Harvard T.H. Chan School of Public Health, Boston, MA 02115, United States.
John Hsu, Mongan Institute, Massachusetts General Hospital, Boston, MA 02114, United States; Department of Health Care Policy, Harvard Medical School, Boston, MA 02115, United States; Department of Medicine, Massachusetts General Hospital, Harvard Medical School, Boston, MA 02114, United States.
Supplementary material
Supplementary material is available at Health Affairs Scholar online.
Funding
This work was supported by National Institutes of Health (NIH) grants RF1AG083033, U01AG076478, P01AG032952, and R01AG062282.
Data availability
All data publicly available.
Notes
- 1. Shen K, Loomer L, Abrams H, Grabowski DC, Gandhi A. Estimates of COVID-19 cases and deaths among nursing home residents not reported in federal data. JAMA Netw Open. 2021;4(9):e2122885. [DOI] [PMC free article] [PubMed] [Google Scholar]
- 2. Centers for Disease Control and Prevention (CDC) . COVID-19 nursing home data Data.CMS.gov: Centers for Medicare & Medicaid Services (CMS). 2023. Accessed May 7, 2024. https://data.cms.gov/covid-19/covid-19-nursing-home-data
- 3. National Center for Health Statistics (NCHS) . Provisional COVID-19 Deaths by Place of Death and Age: Centers for Disease Control and Prevention (CDC). 2023. Accessed August 20, 2023. https://data.cdc.gov/NCHS/Provisional-COVID-19-Deaths-by-Place-of-Death-and-/4va6-ph5s
- 4. McMichael TM, Clark S, Pogosjans S, et al. COVID-19 in a long-term care facility—King County, Washington, February 27-March 9, 2020. MMWR Morb Mortal Wkly Rep. 2020;69(12):339–342. [DOI] [PMC free article] [PubMed] [Google Scholar]
- 5. McMichael TM, Currie DW, Clark S, et al. Epidemiology of Covid-19 in a long-term care facility in King County, Washington. N Engl J Med. 2020;382(21):2005–2011. [DOI] [PMC free article] [PubMed] [Google Scholar]
- 6. Cronin CJ, Evans WN. Nursing home quality, COVID-19 deaths, and excess mortality. J Health Econ. 2022;82:102592. [DOI] [PMC free article] [PubMed] [Google Scholar]
- 7. Levere M, Rowan P, Wysocki A. The adverse effects of the COVID-19 pandemic on nursing home resident well-being. J Am Med Dir Assoc. 2021;22(5):948–54.e2. [DOI] [PMC free article] [PubMed] [Google Scholar]
- 8. Office of Inspector General . COVID-19 had a devastating impact on Medicare beneficiaries in nursing homes during 2020. 2023. Accessed May 7, 2024. https://oig.hhs.gov/oei/reports/OEI-02-20-00490.pdf
- 9. Centers for Medicare & Medicaid Services (CMS) . Quality, Certification and Oversight Reports (QCOR). 2023. Accessed September 9, 2024. qcor.cms.gov
- 10.Centers for Medicare and Medicaid Services (CMS). Payroll Based Journal (PBJ). 2023. Accessed September 1, 2023. https://data.cms.gov/quality-of-care/payroll-based-journal-daily-non-nurse-staffing
- 11. National Center for Health Statistics (NCHS) . CDC WONDER: provisional multiple cause of death by single race 2018: Centers for Disease Control and Prevention (CDC). 2023. Accessed May 22, 2022. https://wonder.cdc.gov/mcd-icd10-provisional.html
- 12. Centers for Medicare & Medicaid Services (CMS) . COVID-19 emergency declaration blanket waivers for health care providers. 2022. Accessed May 7, 2024. https://www.cms.gov/files/document/covid-19-emergency-declaration-waivers.pdf
- 13. Centers for Medicare & Medicaid Services (CMS) . Certification Number (CCN) State Codes—State Operations Manual (SOM) Section 2779A revisions. 2007. Accessed May 7, 2024. https://www.cms.gov/medicare/provider-enrollment-and-certification/surveycertificationgeninfo/downloads/survey-and-cert-letter-16-09.pdf
- 14. The New York Times . Coronavirus in the U.S.: latest map and case count. 2023. Accessed May 7, 2024. https://www.nytimes.com/interactive/2021/us/covid-cases.html
- 15. Centers for Disease Control and Prevention (CDC) . Strike team and infrastructure support for nursing homes and other long-term care facilities archive.cdc.gov. 2023. Accessed May 7, 2024. https://archive.cdc.gov/#/details?url=https://www.cdc.gov/hai/hai-ar-programs/activities/striketeam.html
- 16. Centers for Disease Control and Prevention (CDC) . Nursing home and long-term care facility strike team and infrastructure project guidance. 2021. Accessed May 7, 2024. stacks.cdc.gov
- 17. US Department of Health and Human Services Office of Inspector General . CDC has improved the nursing home reporting process for COVID-19 data in NHSN, but challenges remain. 2024. Accessed May 7, 2024.
Associated Data
This section collects any data citations, data availability statements, or supplementary materials included in this article.
Supplementary Materials
Data Availability Statement
All data publicly available.


