Abstract
Establishing strong seepage stability for tailings dams is crucial for ensuring their safety and mitigating the risk of failure. This study developed a three-dimensional seepage numerical model using finite element numerical computation for four different elevation conditions (5070 m, 5081 m, 5159 m, and 5213 m) encompassing the pond area and dam body. Seepage calculations were conducted under normal and flooding conditions, and the tailings pond’s seepage stability was assessed for various stacking scenarios. The spatial distribution pattern of the infiltration surface and the hydraulic stability of the tailings pond were evaluated, which provides insights into the three-dimensional infiltration stability. Examining the seepage stability under different accumulation conditions revealed distinct spatial distribution patterns of the infiltration surface and hydraulic ratio drop values. The findings indicated that the maximum permeability slope at 5070 m elevation ranged from 0.66 to 0.75 at normal operation water level and maximum flood level. Most hydraulic ratio drop values at 5081 m were below 0.2, while the anti-seepage lining sections at 5159 m and 5213 m showed larger values, and maintained the overall hydraulic ratio drop within safe limits. Consequently, the dam body’s permeability was deemed secure, and no infiltration damage was anticipated with the proposed design of seepage control and drainage facilities. Moreover, sensitivity analysis of the tailing sand’s permeability coefficient demonstrated that variations between 0.2 and 5 times the given parameter align with the seepage control requirements for the tailings dam. Additionally, local geomembrane breakage was found to have minimal impact on the tailing pond’s seepage field and the dam body’s permeability stability, which provides a scientific foundation for analyzing and designing the seismic static-dynamic stability of the tailings pond.
Keywords: Tailings pond, Three-dimensional numerical simulation, Seepage field, Infiltration line
Subject terms: Chemical engineering, Civil engineering
Introduction
As mines continue to be mined, safety issues arise, and in addition to quarry slopes, the safety of tailings impoundment dams is of concern. Meanwhile, tailing pond is a man-made mudflow hazard source with high potential energy and the risk of dam failure. Lyu et al.1 classified the causes of accidents into five categories: infiltration damage, foundation instability, flood overtopping, earthquakes and other causes through the statistics of tailing pond accidents during 1910–2018 globally, of which infiltration damage accounted for about 21.6%. Understanding seepage within tailings dams is essential for monitoring the stability and safety of the dams.
In recent years, most scholars have been studying more and more about tailing pond dams, including theoretical studies2–4 experimental studies and numerical simulations5–7. Numerical simulation plays an indispensable role in various fields, providing an efficient and accurate method for solving complex problems and challenges. With the continuous progress of technology, the application of numerical simulation will be more promising, bringing more innovations and breakthroughs to academic research and engineering practice8–10. To analyze seepage transients in tailings dams under the condition of extremely rapid water level decline, Ozer and Bromwell used limit equilibrium and finite element methods11. As noted by and Zhang et al.12, the two-dimensional model is not able to fully represent the complex and dynamic factors of a seepage field. Thus, their studies have suggested a new method of numerical modeling of the three-dimensional seepage field in tailings dams, so that its numerical simulation results are more in line with the actual situation.
In this paper, a tailing pond is taken as the research object, and the finite element numerical analysis software is used to carry out three-dimensional seepage numerical simulation of the tailing pond, based on the following assumptions: the flow of infiltration water in the tailing pond is considered as a laminar flow motion with low Reynolds number and conforms to Darcy’s law of infiltration, which is calculated according to the stable seepage flow13; the horizontal and vertical permeability coefficients of the materials of each partition are assumed to be equal, and the orthogonal anisotropy is not taken into account. Thus, it better and more accurately reflects the real state of the tailing pond and further studies the stability of the tailing dam, which is of far-reaching significance to guarantee the safety and stability of the tailing dam body.
Project overview
A tailing pond adopts the waste rock centerline damming method, which belongs to the first-class bank, with the main structure level 1, the secondary structure level 3, and the temporary structure level 4. The initial dam of the tailing pond adopts the crushed waste rock dam type, with a crest elevation of 5070 m, the lowest ground elevation of the dam axis of 5018 m, the initial dam height of 52 m, the length of the dam crest axis of about 1050 m, the total capacity of the dam of 6970 × 104 m3, and the effective capacity of the dam of 3834 × 104 m3. The later dam adopts the waste rock damming method, with the design of the final dam crest elevation of 5213 m, the total height of the dam of 195 m, the length of the final dam crest axis of about 1515 m, and the design of the final dam crest of 5213 m, and the length of the dam crest axis of about 1515 m. The axis length of about 1515 m, the total capacity of 100,238 × 104 m3, taking the capacity utilization factor of 0.85, the effective capacity of the tailings pond is estimated to be 85, 203 × 104 m3, the axis of the dam in the valley of the main ditch to make a turn, the turn is arranged into a curved section; the sub-dam is proposed to be a crushed waste rock dam type, a sub-dam top elevation of 5213 m, the height of the dam is 60 m, the top width of the dam is 4 m, and the length of the axis of the dam is about 534 m. The beach surface of the tailings deposition beach in the reservoir area, the outer slope of the later waste rock dam, and the outer slope of the sub-dam are identified as permeable boundaries; the bottom of the whole reservoir adopts the anti-seepage liner for horizontal seepage control, which is identified as impermeable boundaries; and the surface of the surrounding mountains in the reservoir area is identified as impermeable boundaries.
Principle of three-dimensional seepage calculation and related parameters
Basic principles of seepage calculations
Tailings dam seepage in actual engineering belongs to three-dimensional spatial seepage, for three-dimensional stable seepage, the basic equation is:
 |
1 |
where h is the head function; kx, ky, kz, are the permeability coefficients in the direction of the x, y, and z axes, respectively.
The above equation is the Laplace equation for a homogeneous isotropic seepage field.
 |
2 |
Its boundary conditions are:
The head on the first type of boundary is known, i.e.
 |
3 |
The flow is zero on the second type of boundary, i.e.
 |
4 |
Since the free surface of the seepage is a flow surface, there is no flow inflow or outflow from the surface, so in addition to satisfying the above equation on the free surface of the seepage, Eq. (5) also needs to be satisfied.
 |
5 |
Γ1 and Γ2 form the entire boundary of the seepage field in three dimensions.
According to the variational principle, the above-fixed solution problem is equivalent to the following generalized function taking minimal values.
 |
6 |
When the finite element mesh of the tailings dam is tetrahedral, the four vertices of the tetrahedral cell (Fig. 1) are numbered i, j, k, and m according to the right-handed spiral law.
Fig. 1.
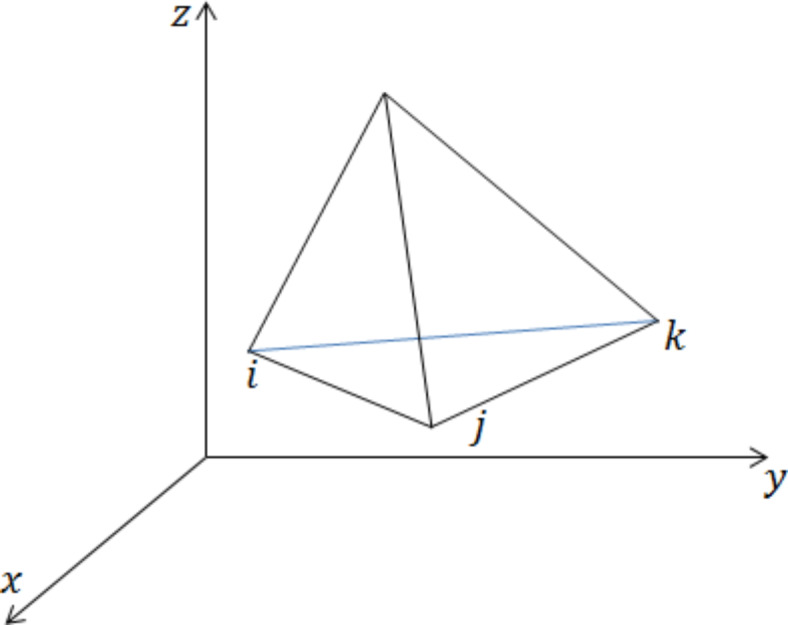
Tetrahedron element.
Let the values of the head function at the four vertices of the tetrahedral element be hi, hj, hk, and hm, and the head is approximately assumed to be distributed as a linear function within the tetrahedral element, and the permeability coefficient within the tetrahedral element is constant. Thus, Eq. (7) is an interpolating function for tetrahedral cells with i, j, k, and m as fixed points.
 |
7 |
where α1, α2, α3, α4 are the coefficients. Since h passes through points i, j, k, and m, the expression is Eq. (8).
 |
8 |
Where (xi,yi,zi), (xj,yj,zj), (xk,yk,zk), (xm,ym,zm), are the coordinates of vertices i, j, k, and m, respectively. From the above system of equations, solve for the values of α1, α2, α3, α4, and substitute into Eq. (7) to get the expression for head H.
 |
9 |
where v is the volume of a tetrahedral element, i.e.
 |
10 |
The expressions for the other coefficients may be determined by the following methods. For example, aj should be determined as one of (j, k, i, m) or (j, m, k, i) or (j, i, m, k) by the right-handed helix rule with the row labels k, i, and m of the determinant.
 |
11 |
The generalized function of the tetrahedral element e is:
 |
12 |
The element penetration matrix is:
 |
13 |
 |
14 |
Equation (14) is abbreviated as Eq. (15).
 |
15 |
The seepage field is superimposed by differentiating the generalized function of all cells. To satisfy the condition that the entire seepage field is extremely small, Eq. (16) is used.
 |
16 |
where m’ is the number of cells with i as the common nodes.
The set of linear algebraic equations for n unknown head nodes, in matrix form, can be written as Eq. (17).
 |
17 |
where [K] is the total infiltration matrix; {h} is the column vector of heads at the unknown head nodes; and {F} is the vector of constant columns formed by the heads at the known head nodes.
Modeling of three-dimensional seepage calculations
According to the tailing pond engineering design program and survey basic data, combined with the topography and geomorphology of the reservoir area and its surroundings and the permeability characteristics of geotechnical material14–16. Taking the bedrock of the reservoir area, the initial dam, the later waste rock dam, the stockpiled tailings, the seepage control liner, and the sub-dam as the outer boundary of the geometric model, the three-dimensional numerical model is established according to the surface morphology of the tailing storage area. According to the topographic characteristics of the reservoir area and the determined geometric model boundary, the topography of the area where the tailing pond is located is taken as shown in Fig. 2.
Fig. 2.
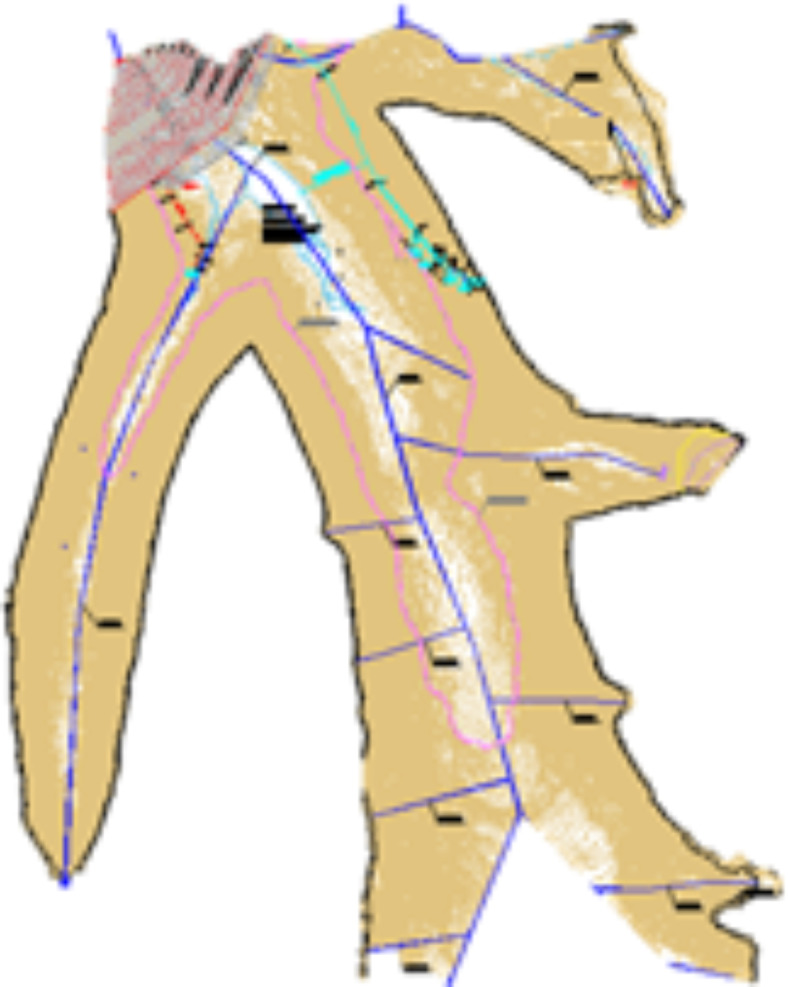
Topographic map of a tailing pond and the area where it is located.
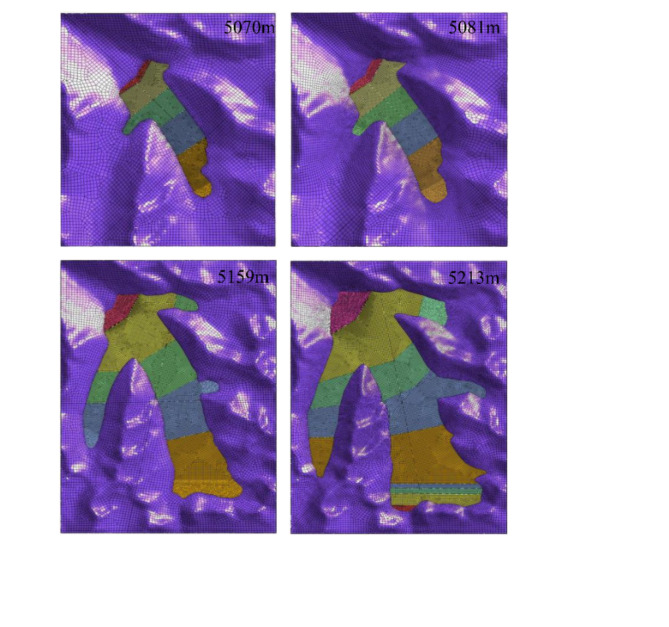
Figure 3 shows the three-dimensional seepage numerical analysis model of a tailing pond at 5070 m, 5081 m, 5159 m, and 5213 m elevations. The partitions included in each computational model are listed in Table 1.
Fig. 3.
Calculation model diagram for different elevations of tailing ponds.
Table 1.
Table of material parameters for tailing pond seepage calculations.
| Partitions | Elevation models | |||
|---|---|---|---|---|
| 5070 m | 5081 m | 5159 m | 5213 m | |
| Initial dam | √ | √ | √ | √ |
| Late-stage waste rock dam | — | √ | √ | √ |
| Impermeable lining layer | √ | √ | √ | √ |
| Tailed fine sand | √ | √ | √ | √ |
| Tail silty sand | √ | √ | √ | √ |
| Tail loam | √ | √ | √ | √ |
| Tail silty clay | √ | √ | √ | √ |
| Auxiliary dam | — | — | — | √ |
In the later stage of operation, additional discharge modes for tailings are employed above the top elevation of the waste rock dam at 5150 m. These modes include the addition of other branch ditch reservoir tail and reservoir weekly ore release methods. The locations for these modes are specified to be the middle main ditch, in front of the sub-dam, and at the foot of the downstream slope of the branch ditch where the branch discharging field is situated. Consequently, the tailing sand in front of the dam mustn’t be segregated into tailing pulverized clay at the sub-dam in front of the mine. In the final 5213 m three-dimensional model of the sub-dam, the partitioning of the tailing sand to the reservoir tailing sand by the main dam tailing sand deposition law aligns more closely with the engineering realities.
The upper part of the waste rock dam was initially raised in stages using the centerline method. Simultaneously, the tailing sand partition line in the reservoir was aligned parallel to the inner slope direction of the waste rock dam. Based on the test results of tailing sand particle size distribution, it was determined that approximately 35–40% of the particles consist of tailing fine sand, while tailing chalk, tailing chalky soil, and tailing chalky clay account for 20–22%. This classification guided the partitioning process for tailing sand accordingly.
Modeled seepage calculation parameters
Determining the infiltration line of the dam body, the seepage volume of the dam body and dam base, and the hydraulic slope drop of the dam body out of the escape section are the key objectives of seepage calculation16,18. This analysis plays a crucial role in the stability calculation of the dam body and the design of seepage discharge facilities. The permeability coefficients of the soil layer in the tailing pond dam body and dam base are presented in Table 2.
Table 2.
Material parameters for tailings pond seepage calculations.
| Layer of rock and soil | Permeability coefficient k (cm/s) | |
|---|---|---|
| Vertical direction Kx | Horizontal direction Ky | |
| Initial dam | 5.0 × 10⁻² | 5.0 × 10⁻² |
| Late-stage waste rock dam | 5.0 × 10⁻² | 5.0 × 10⁻² |
| Impermeable lining layer | 1.3 × 10⁻³ | 1.3 × 10⁻³ |
| Tailed fine sand | 3.75 × 10⁻⁴ | 3.75 × 10⁻⁴ |
| Tail silty sand | 1.25 × 10⁻⁴ | 1.25 × 10⁻⁴ |
| Tail loam | 3.0 × 10⁻⁶ | 3.0 × 10⁻⁶ |
| Tail silty clay | 1.0 × 10⁻⁷ | 1.0 × 10⁻⁷ |
| Auxiliary dam | 5.0 × 10⁻² | 5.0 × 10⁻² |
Initial water level conditions
Under different operating conditions, the stacking elevations were 5070 m, 5081 m, 5159 m, and 5213 m. The head boundaries of the reservoir area are shown in Table 3. The slope of the tailings deposition beach is set at 0.5%. Seepage calculations for the head boundary account for the impact of ore release and rainwater on the infiltration line. According to the formula, ore-release water covers a significant portion of the beach surface. Table 3 presents the length of the beach and the water level after chemical diversion.
Table 3.
Initial water level conditions for seepage calculations.
| Calculation conditions (m) | Normal water level | Design flood level | ||||||
|---|---|---|---|---|---|---|---|---|
| Calculation of beach length (m) | Calculation of water level (m) | Chemtrail beachcomber (m) | Elevation of water level (m) | Calculation of beach length (m) | Calculation of water level (m) | Chemtrail beachcomber (m) | Elevation of water level (m) | |
| 5070 | 500 | 5067.5 | 65.2 | 5069.67 | 396 | 5068.02 | 8.3 | 5069.71 |
| 5081 | 500 | 5078.5 | 65.2 | 5080.67 | 406 | 5078.97 | 59.0 | 5080.71 |
| 5159 | 800 | 5155.0 | 81.7 | 5158.59 | 748 | 5155.26 | 79.1 | 5158.6 |
| 5213 | 1000 | 5208.0 | 90.9 | 5212.55 | 950 | 5208.25 | 88.7 | 5212.56 |
Seepage calculation results and analysis
A three-dimensional finite element model was established to analytically study seepage in tailings ponds with stacking conditions at elevations of 5070 m, 5081 m, 5159 m, and 5213 m. The model aims to simulate the spatial distribution patterns of waste rock dams, infiltration surfaces of tailings and tailing sands within the ponds, and the characteristics of the spatial distribution of the hydraulic ratio drop in the tailings ponds. This analysis is conducted across the various stacking elevations and under different operational conditions.
Results of seepage calculations
Total head results
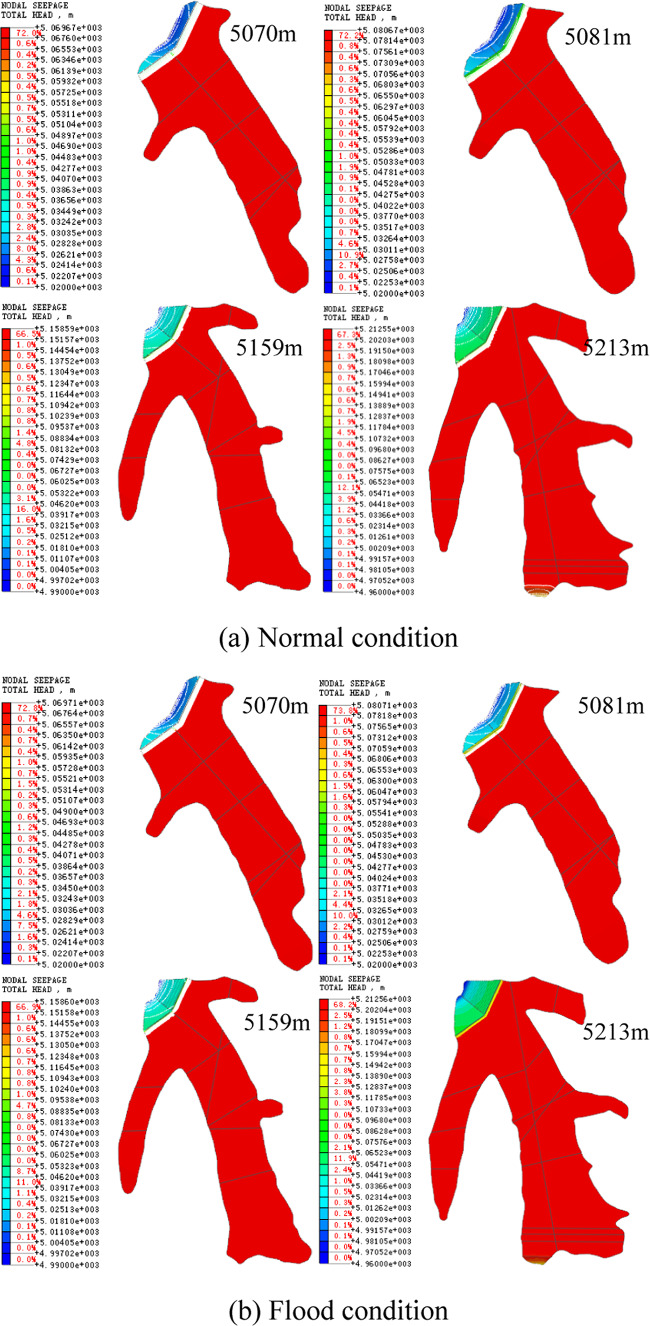
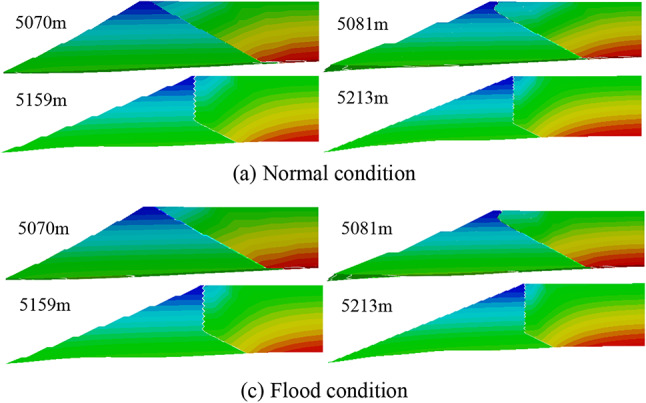
Table 4 displays the maximum and minimum total head values of the tailing dam at various elevations and operational scenarios. Figures 4 and 5 present the outcomes of three-dimensional head computations for normal and flooding conditions in both top view and cross-section perspectives.
Table 4.
Maximum and minimum values of the total head of tailings dam at different elevations and operating conditions.
| Calculation conditions (m) | Normal condition | Flood conditions | ||
|---|---|---|---|---|
| Total head maximum (m) | Total head minimum (m) | Total head maximum (m) | Total head minimum (m) | |
| 5070 | 5069.67 | 5020.0 | 5069.71 | 5020.0 |
| 5081 | 5080.67 | 5020.0 | 5080.71 | 5020.0 |
| 5159 | 5158.59 | 4990.0 | 5158.6 | 4990.0 |
| 5213 | 5212.55 | 4960.0 | 5212.56 | 4960.0 |
Fig. 4.
Top-view total head cloud for different working conditions at each elevation of the tailings impoundment
Fig. 5.
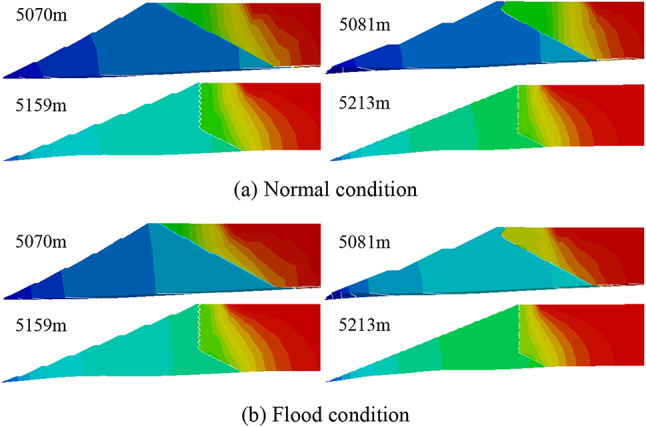
Total head cloud of different working condition profiles at each elevation of the tailings impoundment
-
2)
Orifice pressure results
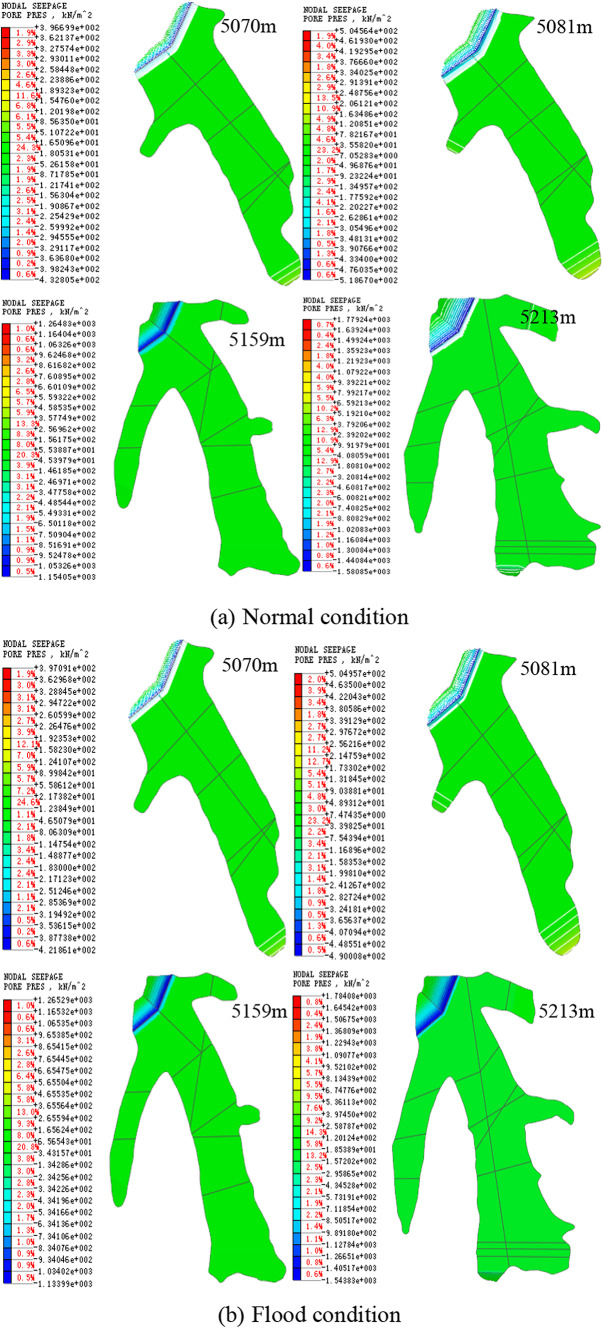
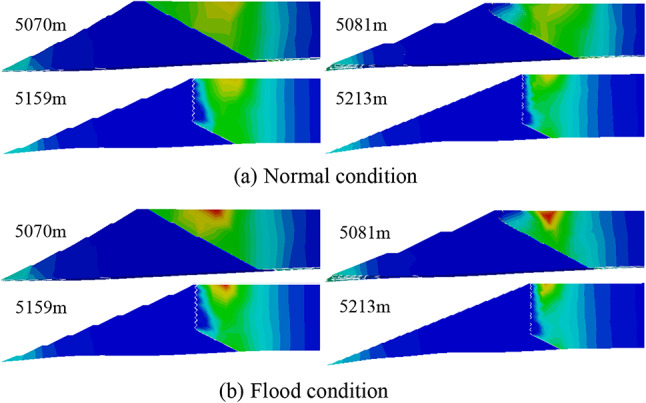
Figures 6 and 7 present the maximum sections at various elevations and working conditions in three dimensions, showcasing the results of pore pressure from both top view and section angles. The analysis reveals that the highest pore pressure values are concentrated within the lower tailing sand layer, as specified in Table 5 elucidating the distribution of these pressures.
Fig. 6.
Pore pressure maps of different working condition profiles at various elevations of the tailing ponds.
Fig. 7.
Pore pressure maps of different working condition profiles at various elevations of the tailing ponds.
Table 5.
Maximum values of pore pressure at different elevations and working conditions.
| Calculation conditions (m) | Normal condition (kPa) | Flood condition (kPa) |
|---|---|---|
| 5070 | 396.7 | 397.1 |
| 5081 | 504.6 | 504.96 |
| 5159 | 1264.8 | 1265.3 |
| 5213 | 1779.2 | 1784.1 |
-
3)
Location of infiltration surface
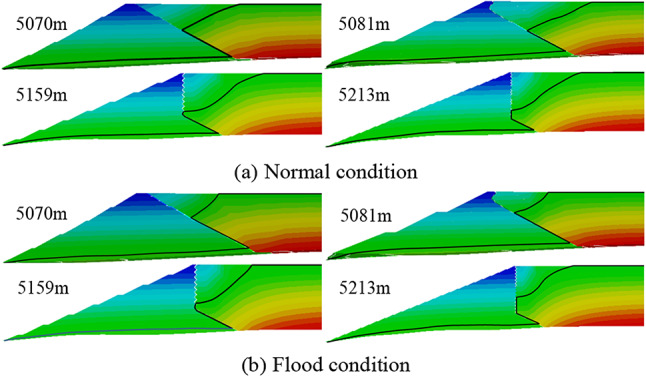
The calculation results presented in Fig. 8 illustrate the positioning of the infiltration surface at varying elevations and operating scenarios. The spatial arrangement of the infiltration surface within the tailings storage dam structure does not exhibit a pronounced three-dimensional impact. Specifically, during flood events, the infiltration surface in the vicinity of the tailing sand near the inner slope of the original dam is elevated relative to standard operating conditions. This elevation can be attributed to the increased water levels resulting from the flood. Notably, the depth of the infiltration surface within the initial dam downstream of the impermeable liner closely approaches the ground surface in both normal and flood conditions, primarily due to the impermeability of the geomembrane. Interestingly, the depth of the infiltration surface appears to remain relatively consistent between flood and normal conditions, indicating minimal variations in this parameter across different scenarios.
Fig. 8.
Location of the leaching surface for different working conditions at each elevation of the tailings impoundment.
-
4)
Flow rate results
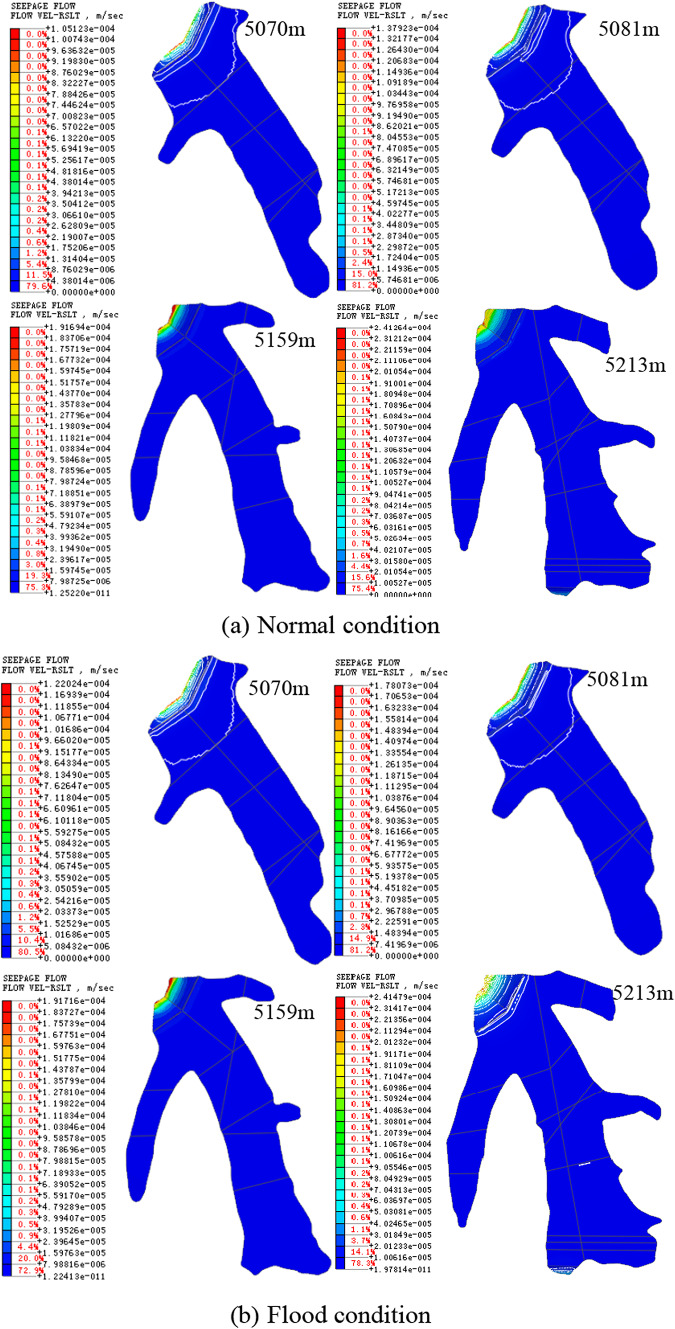
The calculation results of flow velocity at various elevations and under different working conditions are depicted in Figs. 9 and 10 from top view and profile angles, respectively. The results reveal that the highest flow velocity occurs at elevations 5070 m and 5081 m at the base of the slope beyond the original dam. Similarly, the maximum flow velocity at elevations 5159 m and 52 m is observed at the base of the slope outside the subsequent waste rock dam. Detailed numerical values are outlined in Table 6.
Fig. 9.
Top-view flow velocity cloud for different working conditions at each elevation of the tailing pond.
Fig. 10.
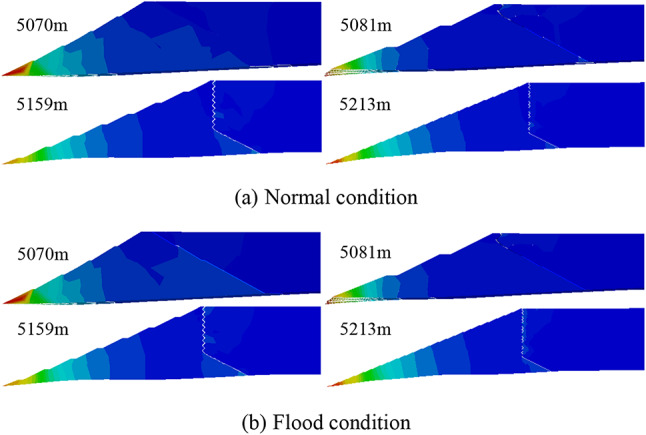
Flow velocity clouds of different working condition profiles at each elevation of tailing ponds.
Table 6.
Maximum flow velocities at different elevations and working conditions.
| Calculation conditions (m) | Normal condition (m/s) | Flood condition (m/s) |
|---|---|---|
| 5070 | 1.05 × 10⁻⁴ | 1.22 × 10⁻⁴ |
| 5081 | 1.38 × 10⁻⁴ | 2.14 × 10⁻⁵ |
| 5159 | 1.92 × 10⁻⁴ | 1.92 × 10⁻⁴ |
| 5213 | 2.41 × 10⁻⁴ | 2.41 × 10⁻⁴ |
-
5)
Hydraulic-specific drop results
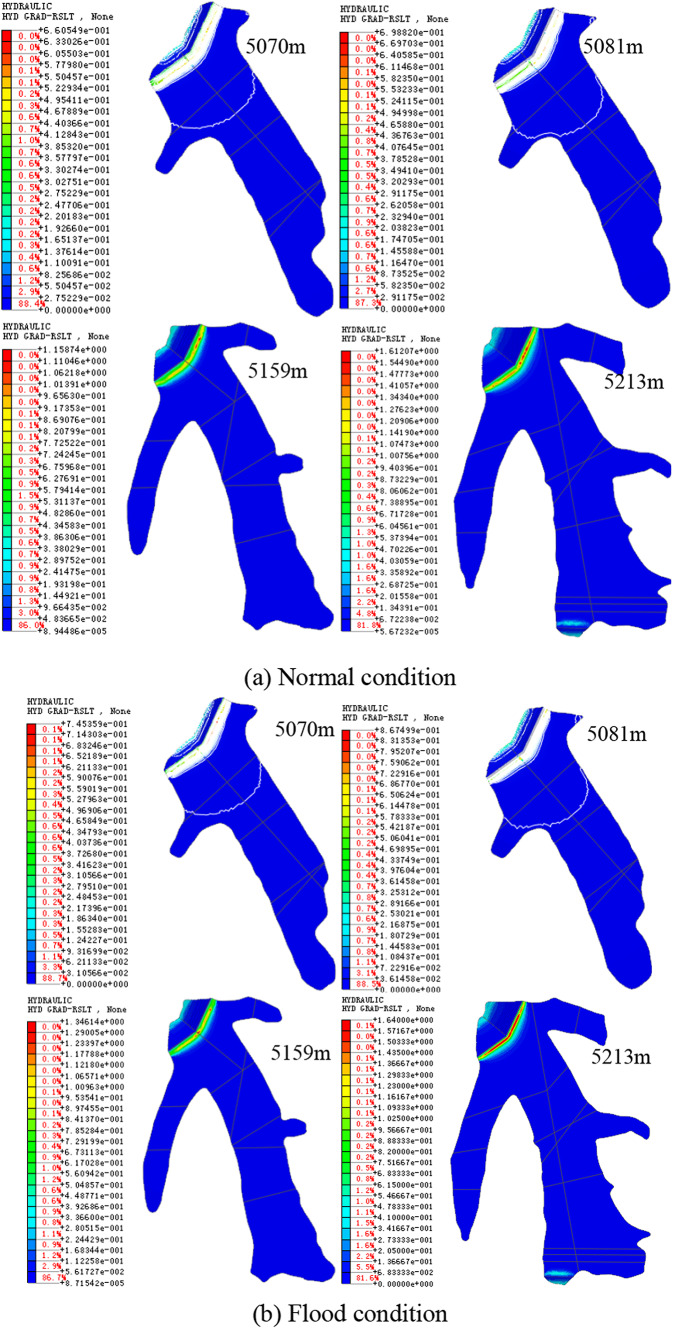
Figures 11 and 12 present the results of the maximum cross-section hydraulic ratio drop for various elevations and working conditions, depicted from the top view and cross-section perspectives, respectively. Hydraulic ratio drop denotes the head loss per unit seepage length injury, and it holds significant importance in the study of seepage deformation and damage, serving as a crucial metric in tailing pond design. Analyzing the figures reveals that, except the impermeable liner, both the initial dam body and the vast majority of the accumulated tailings exhibit hydraulic ratio drops below 0.2. The maximum value of the ratio drop within the tailings region is detailed in Table 7 These findings suggest that the dam body’s permeability is within safe limits, thus minimizing the risk of seepage damage occurrence.
Fig. 11.
Cloud diagram of top-view hydraulic specific drop for different working conditions at each elevation of the tailings impoundment.
Fig. 12.
Cloud map of hydraulic specific drop of different working condition profiles at each elevation of tailing ponds.
Table 7.
Maximum specific drop values in the tailing sand region at different elevations and working conditions.
| Calculation conditions (m) | Normal condition | Flood condition |
|---|---|---|
| 5070 | 0.66 | 0.75 |
| 5081 | 0.699 | 0.87 |
| 5159 | 1.16 | 1.35 |
| 5213 | 1.61 | 1.64 |
Analysis of seepage results
The finite element model of the tailing pond was established at elevations of 5070 m, 5081 m, 5159 m, and 5213 m using the three-dimensional finite element method. Subsequently, the seepage field of the tailing dam at each elevation was calculated, and an analysis of the depth of infiltration surface and infiltration gradient was conducted under normal operation and flood operation conditions. The calculations revealed that the seepage field and spatial distribution of the infiltration surface at each elevation did not exhibit significant three-dimensional effects. Moreover, the permeability of the dam body was deemed safe, with no infiltration damage observed, owing to the adoption of the proposed seepage control and drainage facilities design. At 5070 m elevation, downstream of the impermeable liner at the beginning of the dam body, the internal infiltration surface depth closely approximated the ground surface. The minor difference in depth indicated a maximum infiltration slope drop of 0.66 and 0.75 under normal and flood operation conditions. The utilization of the proposed seepage control facilities demonstrated compliance with seepage safety and specification requirements. Similarly, at 5081 m elevation, effective seepage control measures, including the use of geomembranes, ensured that the infiltration surface of the dam body downstream of the liner remained near the ground surface. The seepage control facilities were found to meet the safety and specification requirements, with the largest hydraulic ratio drop area observed in the geomembrane position. Furthermore, at 5159 m elevation, the seepage lining exhibited a higher value, while the hydraulic ratio drop value of the dam body remained within a safe range, thereby guaranteeing overall seepage safety. Similarly, at 5213 m elevation, the anti-seepage membrane played a crucial role, leading to the downstream distribution of the internal infiltration surface in the lower part of the dam. The specific drop values at this elevation indicated a safe hydraulic specific drop value for the dam body and most of the tailing sand within the reservoir, preventing infiltration damage under both normal and flood operation conditions. In summary, the comprehensive analysis conducted through the finite element method highlighted the effectiveness of the seepage control measures implemented in ensuring the safety and stability of the tailing dam across various elevation levels.
Seepage sensitivity analysis
The effects of permeability change of tailings storage pile construction materials and local breakage of geomembrane impermeable liner of the main dam and sub-dam on the seepage flow field of tailings storage, respectively19–21. Through the sensitivity analysis, further calculation and analysis to demonstrate the effectiveness and rationality of the design scheme. In the stable seepage period, the boundary types of seepage analysis are mainly known as head boundary, seepage boundary, and impermeable boundary.
Sensitivity analysis of permeability coefficient
The infiltration line analysis of a tailings dam can be performed by seepage calculations. Based on the results of seepage calculations in the previous section, the seepage calculations can be simplified by converting the beach lengths of the calculated conditions to the diverted beach lengths to obtain a diverted reservoir level above the calculated reservoir level. The head boundary of the flow calculation takes into account the influence of factors such as ore release and rainfall on the leach line, and is calculated in accordance with the formula that the ore release water covers most of the beach surface, i.e.
 |
18 |
where Lh is the chemically induced beach length, m; L is the calculated beach length, m.
Determine the infiltration line using two-way homogeneous seepage calculations based on the level of the chemically induced reservoir and the length of the chemically induced beach. The difference between the normal and flood condition dip line burial depths is small, and the flood condition dip line burial depths for the maximum profile for each elevation condition are plotted as shown in Fig. 13.
Fig. 13.
Depth of infiltration lines at different locations of the main dam profile at various elevations of the tailing ponds.
To investigate the impact of altering the permeability coefficient of tailing fine sand on the seepage field within the dam body, the permeability coefficient of the tailing fine sand was manipulated by both enlarging and reducing it by a factor of five. Meanwhile, the permeability coefficients of the other tailing sand partitions remained constant throughout the experiment. When the permeability coefficient of the tailing sand was increased by five times, the infiltration surface of the dam body exhibited a slight elevation. However, the degree of elevation was relatively limited, with the maximum elevation reaching approximately 0.5 m. Despite this increase, the depth of the infiltration surface along the dam slope remained within the specified limits. Notably, the maximum infiltration gradient remained largely unchanged, highlighting the minimal impact on the overall stability of the dam body. Conversely, when the permeability coefficient of the tailing sand was reduced by a factor of five, the infiltration surface of the dam body experienced a slight reduction. The maximum reduction observed was also around 0.5 m, but the depth of the infiltration surface across various positions on the dam slope continued to comply with the prescribed specifications. Similarly, the maximum infiltration slope drop remained relatively consistent, indicating no significant influence on the stability of the dam body from this reduction in permeability coefficient.
Seepage analysis of geomembrane failure
Analysis of geomembrane partial failure conditions.
Geomembrane is a key material used for seepage control, which has a very low permeability coefficient. When a geomembrane undergoes localized breakage, its impermeability performance is affected. To assess the impact of geomembrane on the permeability of the whole dam body under the broken condition, the method of localized geomembrane breakage equivalent to the comprehensive permeability coefficient amplification is used to carry out the sensitivity analysis of the impact of localized geomembrane breakage22–24. That is, by artificially amplifying the permeability coefficient of the geomembrane to a certain multiple to simulate the impact of geomembrane breakage on the overall permeability of the dam body. Thus, it ensures that the seepage control design of the tailing pond can adapt to the possible breakage of the geomembrane to ensure its safety.
The finite element calculation results show that the distribution law of seepage field under each working condition does not change much when the integrated permeability coefficient of geomembrane is enlarged 10 times, 20 times and 50 times respectively. That is, the geomembrane local damage to the tailings pond seepage field and dam body permeability stability impact is very small, the permeability is much smaller than the ore discharge flow.
-
2)
Analysis of complete failure conditions of geomembranes
For the consideration of partial hazard, the geomembrane permeability coefficient is taken to be the same as that of the waste rock dam (i.e., 5 × 10⁻⁴m/s), and at this time, the infiltration line burial depths under the four conditions of tailings impoundment elevation of 5070 m, 5081 m, 5159 m, and 5213 m, respectively, are shown in Fig. 14. After calculation, in a limited range, with the increase of geomembrane breakage rate, the infiltration flow of the tailings impoundment dam body does not change much. If the infiltration flow field is to reach the more ideal state of design, the construction quality of the impermeable membrane should be improved and the breakage rate of the membrane should be reduced.
Fig. 14.
Geomembrane complete failure conditions at each elevation of the tailing pond infiltration line burial depth.
It should be noted that local damage to the geomembrane will lead to leakage of tailings wastewater into the groundwater, which will have a certain impact on the groundwater environment, and thus attention should be paid to the construction of the geomembrane impermeable body as well as the tailings release and operation process to ensure that the geomembrane impermeable body is as intact as possible.
Conclusions
According to the engineering geological and hydrogeological conditions of the tailing pond, combined with the characteristics of the project, a three-dimensional finite element model of seepage reflecting the main dam structure and the engineering hydrogeological characteristics of the reservoir area is established, and the seepage characteristics of the tailing dam under the condition of controlling the water level are calculated and analyzed, and the seepage characteristics of tailing ponds operated under the normal working conditions and flooding conditions of four typical elevation calculation models are mainly analyzed. However, since the boundary conditions for seepage calculation are determined based on certain assumptions and actual measurement data, and the boundary conditions may be more complicated and variable in actual engineering, this will limit the applicability of the model.
The natural groundwater seepage field is analyzed inversely based on the engineering geological conditions, investigated groundwater level data, and the results of borehole pressure tests. The analysis results indicate that the natural groundwater level simulated through the inverse analysis aligns well with the measured water level data from the survey. Furthermore, it is found that the seepage numerical simulation results are reliable, affirming the credibility of the finite element model in characterizing the groundwater dynamics in the area.
The seepage field of the tailing dam was calculated and analyzed at four typical operating elevations (5070 m, 5081 m, 5159 m, and 5213 m) for both the normal operating water level and the highest flood level of the tailing pond. Various analyses were conducted, including drawing the contour map of the groundwater level, the infiltration line of the typical section, and the distribution map of the isopotential line. Additionally, the depth of the infiltration surface and the infiltration slope drop of the dam body were assessed. The results indicate that, with the implementation of the seepage control facilities designed for tailing ponds, the infiltration surface burial depth of the dam body complies with specification requirements. Furthermore, the infiltration stability of each partition was found to meet the necessary standards.
The sensitivity analysis was conducted on the impact of varying permeability coefficients in two groups of tailings pond accumulation bodies at elevations of 5070 m, 5081 m, 5159 m, and 5213 m. Results indicated that the distribution pattern of the seepage field within the tailings pond dam body remained consistent across all operational conditions. Furthermore, the designed measures, including the impermeability of the geomembrane across the entire reservoir area and the blind ditch seepage discharge system, were found to effectively satisfy the seepage control criteria for the tailings dam.
The tailing pond employs centerline waste rock dam construction, with a focus on maintaining the normal functioning of flood discharge and seepage control facilities. The construction quality is strictly monitored to ensure the safety and reliability of the facilities. The buried depth of the infiltration surface, pore water pressure distribution, and hydraulic ratio drop of the dam body fall within safe operational ranges. Findings from the three-dimensional seepage analysis confirm that this tailing pond project meets stability requirements.
Acknowledgements
This work is supported by Project of Special Funds for Basic Research Operating Expenses of China Academy of Work Safety (grant number 2024JBKY17). Research and application on the disaster prevention laws of weak and soft layers of tailings dams and refined stability calculation methods. We gratefully acknowledge the financial support provided by the special foundation for basic research operating expense of China Academy of Work Safety.
Author contributions
Botao Fu carried out the experiment. Jingjing Pei wrote the manuscript and supervised the project. Huaijun Ji conceived the original idea.
Data availability
Data is provided within the manuscript, Figures files and Tables files.
Declarations
Competing interests
The authors declare that they have no known competing financial interests or personal relationships that could have appeared to influence the work reported in this paper.
Footnotes
Publisher’s note
Springer Nature remains neutral with regard to jurisdictional claims in published maps and institutional affiliations.
References
- 1.Lyu, Z. J., Chai, J. R., Xu, Z. G., Qin, Y. & Cao, J. A comprehensive review on reasons for Tailings dam failures based on case history. Adv. Civ. Eng.10.1155/2019/4159306 (2019). (2019). [Google Scholar]
- 2.Lin, S. Q. et al. Regional distribution and causes of global mine tailings dam failures. Metals. 10.3390/met12060905 (2022). [Google Scholar]
- 3.Shen, L. Y., Luo, S. H., Zeng, X. K. & Wang, H. Q. Review on anti-seepage technology development of tailings pond in China. Procedia Eng.26, 1803–1809. 10.1016/j.proeng.2011.11.2370 (2011). [Google Scholar]
- 4.Luca, P., Briseid, S. E., Liu, Z. Q., Farrokh, N. & Suzanne, L. A new look at the statistics oftailings dam failures. Eng. Geol.. 10.1016/j.enggeo.2022.106657 (2022). [Google Scholar]
- 5.Dai, Z., Peng, L. & Qin, S. Experimental and numerical investigation on the mechanism of ground collapse induced by underground drainage pipe leakage. Environ. Earth Sci.83, 32. 10.1007/s12665-023-11344-w (2023). [Google Scholar]
- 6.Yu, H., Wang, H. & Lian, Z. An assessment of seal ability of tubing threaded connections: Ahybrid empirical-numerical method. J. Energy Res. Technol.145, 052902. 10.1115/1.4056332 (2022). [Google Scholar]
- 7.Han, R., Wu, J., Zhang, Y., Chen, Q. & Sun, B. Oblique distribution patterns and the underlying mechanical model of orebody groups controlled by structures at different scales. Sci. Rep. 10.1038/s41598-024-55473-z (2024). [DOI] [PMC free article] [PubMed]
- 8.Chang, X. et al. Single-objective and multi-objective flood interval forecasting considering interval fitting coefficients. Water Resour. Manage.38, 3953–3972. 10.1007/s11269-024-03848-2 (2024). [Google Scholar]
- 9.Guo, J. et al. Study on optimization and combination strategy of multiple daily runoff prediction models coupled with physical mechanism and LSTM. J Hydrol. 624, 129969. (2023). 10.1016/j.jhydrol.2023.129969
- 10. Xie, X., Gao, Y., Hou, F., Cheng, T., Hao, A., & Qin, H. Fluid inverse volumetric modeling and applications from surface motion. IEEE Trans. Visual. Comput. Graphi https://doi.org/10.1109/TVCG.2024.3370551 (2024). [DOI] [PubMed]
- 11.Özer, A. T. & Bromwell, L. G. Stability assessment of an earth dam on silt/clay tailings foundation: a case study. Eng. Geol.151, 89–99. 10.1016/j.enggeo.2012.09.011 (2012). [Google Scholar]
- 12.Zhang, L. T., Qi, Q. L., Xiong, B. L. & Zhang, J. Numerical simulation of 3-D seepage field in tailing pond and its practical application. Procedia Eng. 12, 170–176. (2011). https://doi.org/10.1016/j.proeng.05.027 (2011).
- 13.Cheng, H. et al. A mathematical model for pre-darcy flow in low permeability porous media with stress sensitivity and the boundary-layer effect. Eng. Geol.10.1016/j.enggeo.2023.107257 (2023). [Google Scholar]
- 14.Fan, J. Y. & Rowe, R. K. Piping of silty sand tailings through a circular geomembrane hole. Geotext. Geomembranes . 50:183–196. 10.1016/j.geotexmem.2021.10.003.( (2022).
- 15.Islam, S., Islam, J., Hoque, N. M. R. & Hasan, K. Improving geotechnical properties of soil of hillock slope using crushed recycled concrete aggregates. J. Eng. Res.11, 293–300. 10.1016/j.jer.2023.100139 (2023). [Google Scholar]
- 16.Zhuang, J. Q. et al. Distribution and characteristics of landslide in Loess Plateau: A case study in Shaanxi province. Eng. Geol.236, 89–96. 10.1016/j.enggeo.2017.03.001 (2018). [Google Scholar]
- 17.Shafieiganjeh, R. et al. Seepage process understanding at long-existing landslide dams through numerical analysis and hydrological measurements. Eng. Geol. Eng. Geol.335, 107524. 10.1016/j.enggeo.2024.107524 (20242023).
- 18.Chen, Y. A., Xu, J., Peng, S. J., Zhang, Q. W. & Chen, C. C. Space–time evolution law of progressive failure area and mechanical behaviour of rock under different seepage conditions. Eng. Geol. https://doi.org/10.1016/j.enggeo.2022.106926 (2023).
- 19.Jiang, T., Zhang, J. R., Wan, W. F., Cui, S. & Deng, D. P. 3D transient numerical flow simulation of groundwater bypass seepage at the dam site of Dongzhuang hydro-junction. Eng. Geol.231, 176–189. 10.1016/j.enggeo.2017.10.022 (2017). [Google Scholar]
- 20.Long, D. Y., Li, C. H., Hu, Y. Y., Li, J. Z. & Wang, Y. Investigation on the prevention and treatment measures of seepage failure of the fine-grained tailings dam: A case of iron tailings reservoir in China. Min. Metall. Explor.41, 875–887. 10.1007/S42461-024-00951-1 (2024). [Google Scholar]
- 21.Li, Q. et al. The relatively stable seepage field: A new concept to determine seepage field in the design of a dry-stack tailings pond. Appl. Sci.12, 12123–12123. 10.3390/APP122312123 (2022). [Google Scholar]
- 22.Fan, J. & Rowe, R. K. Effect of a lateral drainage layer on leakage through a defect in a geomembrane overlain by saturated tailings. Geotext. Geomembr.52, 383–395. 10.1016/j.geotexmem.2023.12.004 (2024). [Google Scholar]
- 23.Jiying, F. & Kerry, R. R. Effect of subgrade on leakage through a defective geomembrane seam below saturated tailings. Geotext. Geomembr.51, 360–369. 10.1016/j.geotexmem.2022.12.003 (2023). [Google Scholar]
- 24.Kerry, R. R. & Fan, J. Y. A general solution for leakage through geomembrane defects overlain by saturated tailings and underlain by highly permeable subgrade. Geotext. Geomembr.50, 694–707. 10.1016/j.geotexmem.2022.03.010 (2022). [Google Scholar]
Associated Data
This section collects any data citations, data availability statements, or supplementary materials included in this article.
Data Availability Statement
Data is provided within the manuscript, Figures files and Tables files.


