Abstract
Background
Colorectal cancer (CRC) is a common intestinal malignancy worldwide, posing a serious threat to public health. Due to its high heterogeneity, prognosis and drug response of different CRC patients vary widely, limiting the effectiveness of traditional treatment. Therefore, this study aims to construct a novel CRC prognostic signature using machine learning algorithms to assist in making informed clinical decisions and improving treatment outcomes.
Methods
Gene expression matrix and clinical information of CRC patients were obtained from the The Cancer Genome Atlas (TCGA) and Gene Expression Omnibus (GEO) databases. Then, genes with prognostic value were identified through univariate Cox regression analysis. Next, nine machine learning algorithms, including least absolute shrinkage and selection operator (LASSO), gradient boosting machine (GBM), CoxBoost, plsRcox, Ridge, Enet, StepCox, SuperPC and survivalSVM were integrated to form 97 combinations, which was employed to screen the best strategy for building a prognostic model based on the average C-index in the three CRC cohorts. Kaplan Meier survival analysis, receiver operating curve (ROC) analysis and multivariate regression analysis were conducted to assess the predictive performance of the constructed signature. Furthermore, the CIBERSORT and ESTIMATE algorithms were utilized to quantify the infiltration level of immune cells. Besides, a nomogram were developed to predict 1-, 2-, and 3-year overall survival (OS) probabilities for individual patient.
Results
A prognostic signature consisting of 13 genes was developed utilizing LASSO Cox regression and GBM methods. Across both the training and validation datasets, the performance evaluation consistently indicated the signature’s capacity to accurately predict the prognosis of CRC patients. Especially, compared with 30 published signatures, the 13-gene model exhibited dramatically superior predictive power. Even within clinical subgroups, it could still precisely stratify the prognosis. Functional analysis revealed a robust association between the signature and the immune status as well as chemotherapy response in CRC patients. Furthermore, a nomogram was created based on the signature-derived risk score, which demonstrated a strong predictive ability for OS in CRC patients.
Conclusions
The 13-gene prognostic signature is expected to be a valuable tool for risk stratification, survival prediction, and treatment evaluation of patients with CRC.
Keywords: Colorectal cancer (CRC), machine learning, prognosis, signature, survival
Highlight box.
Key findings
• A machine learning-based analysis identified a 13-gene prognostic signature with high value for survival prediction and treatment evaluation in colorectal cancer (CRC).
What is known and what is new?
• Machine learning algorithms play an important role in predicting cancer survival outcomes by integrating multidimensional information, such as clinical data, molecular biology features, and patient imaging data.
• By employing a comprehensive machine-learning survival framework, the combination of least absolute shrinkage and selection operator Cox regression and gradient boosting machine methods was selected as the optimal strategy to construct a 13-gene prognostic signature, which exhibited superior predictive power for the survival of CRC patients.
What is the implication, and what should change now?
• Our study provides valuable insights for the development of novel CRC biomarkers with potential applications in prognosis, personalized treatment and drug sensitivity analysis.
Introduction
Colorectal cancer (CRC) is the third most frequently diagnosed cancer on a global scale, with approximately 1.9 million new cases and 903,859 deaths reported in 2022 (1). The situation regarding the prevention and treatment of CRC in China is particularly concerning, as there has been a notable rise in both the incidence and mortality rates of the disease (2). Despite the updated treatment strategies and the continuous improvement of medical standards, the prognosis of CRC patients remains unfavorable, as a considerable proportion of individuals are diagnosed when the disease has already progressed to advanced stages (3). As reported, the 5-year survival rate for patients with metastatic CRC is approximately 20% (4). In clinical practice, the prognostic assessment of CRC mainly relies on clinicopathologic features and tumor-node-metastasis (TNM) classification staging system. However, these traditional methods often ignore individual differences, dynamic changes in disease progression, and complex interactions between multiple factors, resulting in limited accuracy and reliability. Therefore, it is urgent to develop and validate new prognostic models to effectively monitor CRC progression.
In recent years, with the rapid development of artificial intelligence technology, the application of machine learning algorithms in the medical field has increasingly attracted attention. They could extract useful information from massive amounts of data and automatically learn the complex relationships between data to support predictions and decision-making. Especially, machine learning algorithms can improve the accuracy of risk prediction models in the prognostic assessment of cancer by integrating multidimensional information, including clinical data, molecular biology features (5), and pathological images (6,7). It has been reported that machine learning-based models have emerged as crucial tools in predicting survival outcomes for various types of cancer (8-10). For example, Gong et al. (11) used CoxBoost and random survival forest (RSF) to construct a neutrophil-derived prognostic signature for improving the prognosis of hepatocellular carcinoma. Zhu et al. (12) developed a machine learning-based prognostic model for prostate cancer and confirmed the role of TMED3 in promoting malignant cell proliferation. Zhang et al. (13) constructed a prognostic model for lung adenocarcinoma by using a combination of 26 machine learning algorithms. The signature can accurately predict patient prognosis and immunotherapy response. Therefore, by employing machine learning algorithms, researchers can obtain more accurate and reliable prognostic assessments, contributing to better treatment decisions.
This study aimed to develop a prognostic signature for CRC based on gene expression profiles and clinical information using machine learning methods. The prognostic value of the multi-gene signature was evaluated through Kaplan-Meier (KM) survival analysis, receiver operating curve (ROC) analysis and performance comparison analysis. The correlation between the signature-derived risk score and several factors including infiltration level of immune cells and chemotherapy sensitivity, was systematically investigated. Additionally, a nomogram was developed by combining the risk score and common clinical factors to estimate the survival probabilities of individuals with CRC, thus providing more personalized support for clinical decision-making. We present this article in accordance with the TRIPOD reporting checklist (available at https://jgo.amegroups.com/article/view/10.21037/jgo-24-325/rc).
Methods
Data collation and analysis
Gene expression matrix and clinical information from 524 cases of colon adenocarcinoma (COAD) and rectum adenocarcinoma (READ) were obtained from the The Cancer Genome Atlas (TCGA) database (https://portal.gdc.cancer.gov/). Meanwhile, clinical information and transcriptome data of CRC patients were retrieved from the Genomics Expression Omnibus (GEO) database (https://www.ncbi.nlm.nih.gov/geo/) with the accession numbers GSE17536 (n=177) and GSE39582 (n=585). Table 1 summarizes the clinical information of patients in the training set GSE39582 (14). Download and collection of these datasets began in October 2023. Patients without clinical information were excluded from the subsequent analyses. Next, univariate Cox hazard analysis was carried out to detect genes with prognostic value in all three datasets (P<0.05). Finally, an online tool (https://bioinformatics.psb.ugent.be/webtools/Venn/) was used to determine the overlap of prognostic genes across these three datasets (15). The study was conducted in accordance with the Declaration of Helsinki (as revised in 2013).
Table 1. The clinical information of the CRC patients in the GSE39582 dataset.
| Characteristics | Values |
|---|---|
| Gender | |
| Female | 263 (45.0) |
| Male | 322 (55.0) |
| Stage | |
| 0 | 4 (0.7) |
| 1 | 38 (6.5) |
| 2 | 271 (46.3) |
| 3 | 210 (35.9) |
| 4 | 60 (10.3) |
| Unknown | 2 (0.3) |
| T stage | |
| T0 | 1 (0.2) |
| T1 | 12 (2.1) |
| T2 | 49 (8.4) |
| T3 | 379 (64.8) |
| T4 | 119 (20.3) |
| Tis | 3 (0.5) |
| Unknown | 22 (3.8) |
| N stage | |
| N+ | 6 (1.0) |
| N0 | 314 (53.7) |
| N1 | 137 (23.4) |
| N2 | 100 (17.1) |
| N3 | 6 (1.0) |
| Unknown | 22 (3.8) |
| M stage | |
| M0 | 499 (85.3) |
| M1 | 61 (10.4) |
| MX | 3 (0.5) |
| Unknown | 22 (3.8) |
Values are presented as n (%). CRC, colorectal cancer.
Construction of the prognostic model for CRC
To develop a reliable prognostic model for CRC, univariate Cox regression analysis to identify genes that are significantly associated with patient survival. Genes with a P value less than 0.05 were considered statistically significant and included in further analysis. Then, the present study integrated nine machine learning algorithms, including supervised principal components (SuperPC), gradient boosting machine (GBM), partial least squares regression for Cox (plsRcox), Ridge, survival support vector machine (survival-SVM), least absolute shrinkage and selection operator (LASSO), StepCox, Enet, and CoxBoost (16). By leveraging the unique strengths of each algorithm, their integration was able to improve the overall performance of the prognostic model in predicting CRC outcomes. Among the nine machine learning algorithms used in this study, LASSO, StepCox, and CoxBoost algorithms possess the capacity for feature selection and data dimensionality reduction, and they were combined with other types of machine learning algorithms to build 97 prognostic signatures.
To further select the algorithmic combination that could be used to establish the optimal prognostic model, the C-index values of each model were computed in the GSE39582, GSE17536 and TCGA cohorts. Based on the comparison of average C-index values across the three cohorts, the prognostic signature with the highest score was selected as the optimal model for further analyses. The risk score for each patient was then calculated using the algorithmic combination used to build the optimal model. The “surv_cutpoint” function in “survminer” (17) was used to determine the optimal cutoff point to divided CRC patients into the high- and low-risk groups. This cutoff point corresponds to the risk score value that can maximize the difference in overall survival (OS) time between the two groups.
Performance evaluation of the prognostic model
To assess the predictive performance of the constructed signature, KM survival analysis was conducted using the “survival” and “survminer” packages in the training and validation cohorts (17,18). This analysis allowed researchers to assess the association between the signature-derived risk score and patient survival outcomes in each cohort. Besides, time-dependent ROC analysis was carried out by using the “timeROC” package (19) to evaluate the predictive efficacy of the model in the training and validation cohorts. In the ROC analysis, the area under the curve (AUC) was calculated as a measure of the model’s discriminatory ability.
Next, a total of 30 prognostic signatures for CRC were queried from the PubMed database (https://pubmed.ncbi.nlm.nih.gov/) (Table S1). To compare the performance of these models with the prognostic signature proposed in the study, the “survival” R package (20) was employed to calculate the C-index values of each model in the training and validation datasets. Then, the “compareC” R package (16) was utilized to determine whether the proposed prognostic signature outperformed other existing models in predicting CRC outcomes.
Construction and performance analysis of the prognostic nomogram
Based on the independent prognostic factors including the signature-derived risk score and the common clinical features, a prognostic nomogram was constructed by using the “nomogramEx” package (21) in the GSE39582 dataset. Then, to evaluate the predictive performance of the nomogram in predicting OS, several analyses were conducted in the GSE39582 dataset. First, ROC analysis was carried out using the “timeROC” package (19) to evaluate the predictive efficacy of the nomogram by calculating the AUC and comparing it to other models or clinical factors. Second, calibration curve analysis was performed using the “calibrate” package (22), which allowed for the comparison of the predicted probabilities of survival with the actual survival outcomes observed in the GSE39582 cohort.
Comparative analysis of immune cell infiltration levels between high- and low-risk groups
The CIBERSORT algorithm is an impactful deconvolution algorithm that uses gene expression profiles and a pre-defined immune signature matrix to estimate the proportion of 22 distinct human tumor-infiltrating immune cells present in a given sample (23). In this study, the CIBERSORT algorithm was employed to estimate the abundance of tumor-infiltrating immune cells in both the high-risk and low-risk groups of CRC. Furthermore, the ESTIMATE algorithm (24) was utilized to assess the immune, stromal, and ESTIMATE scores for each CRC sample. The immune, stromal and ESTIMATE scores indicate the ratios of immune and stromal components as well as the overall proportions of these components within the tumor microenvironment (TME).
Expression pattern analysis of genes constituting the prognostic signature
GEPIA2 (http://gepia2.cancer-pku.cn/) (25) is an online tool for exploring gene expression data from TCGA and Genotype-Tissue Expression (GTEx) projects. In this study, GEPIA2 online tool was utilized to compare the expression profiles of the genes constituting prognostic signature in tumor and normal control tissues. Furthermore, the Human Protein Atlas (https://www.proteinatlas.org/) database (26) was employed to retrieve histological staining information of the representative genes in tumor and normal control tissues of CRC.
Analysis of drug sensitivity in different risk groups
The GDSC database (https://www.cancerrxgene.org/) is a valuable resource that provides extensive information on the sensitivity of cancer cell lines to different types of anticancer drugs (27). Based on the GDSC database, half maximal inhibitory concentration (IC50) was calculated to assess the response of each CRC patient to chemotherapy drugs by using “prophetic” R package (28). The Wilcoxon test was applied to assess the statistical significance of the difference in IC50 values between the high- and low-risk groups, with a P value threshold set at less than 0.05.
Statistical analysis
All statistical analyses were performed using R (version 4.3.2) (29). If not specified, statistical significance was determined based on a two-sided P value or adjusted P value below 0.05.
Results
Identification of genes with prognostic value in CRC
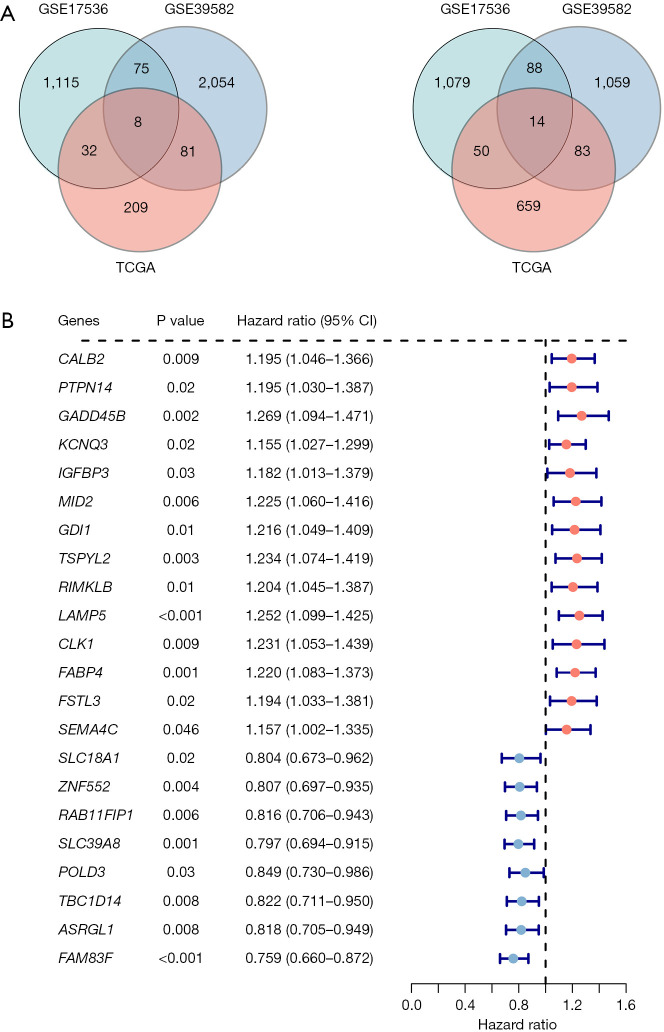
To identify reliable prognostic genes in CRC, univariate Cox analysis was performed using gene expression data and survival information from three independent datasets including GSE39582, GSE17536 and TCGA. As shown in Figure 1, 3,462, 2,461 and 1,136 genes were found to have significant associations with prognosis in GSE39582, GSE17536 and TCGA, respectively (P<0.05). From these gene sets, we identified 14 hazardous genes [hazard ratio (HR) >1] and 8 protective genes (HR <1) that consistently overlapped across all three datasets (Figure 1). Accordingly, these 22 genes were selected to serve as the input for constructing prognostic signatures in CRC.
Figure 1.
Screening for overlapping prognosis-related genes across the three datasets. (A) Venn plot shows the overlapping protective genes (left) and hazardous genes (right) across the three datasets. (B) Forest plot shows the univariate Cox analysis results of the overlapping prognostic genes in the GSE39582 dataset. TCGA, The Cancer Genome Atlas.
Construction of a 13-gene prognostic signature based on combinations of machine learning algorithms
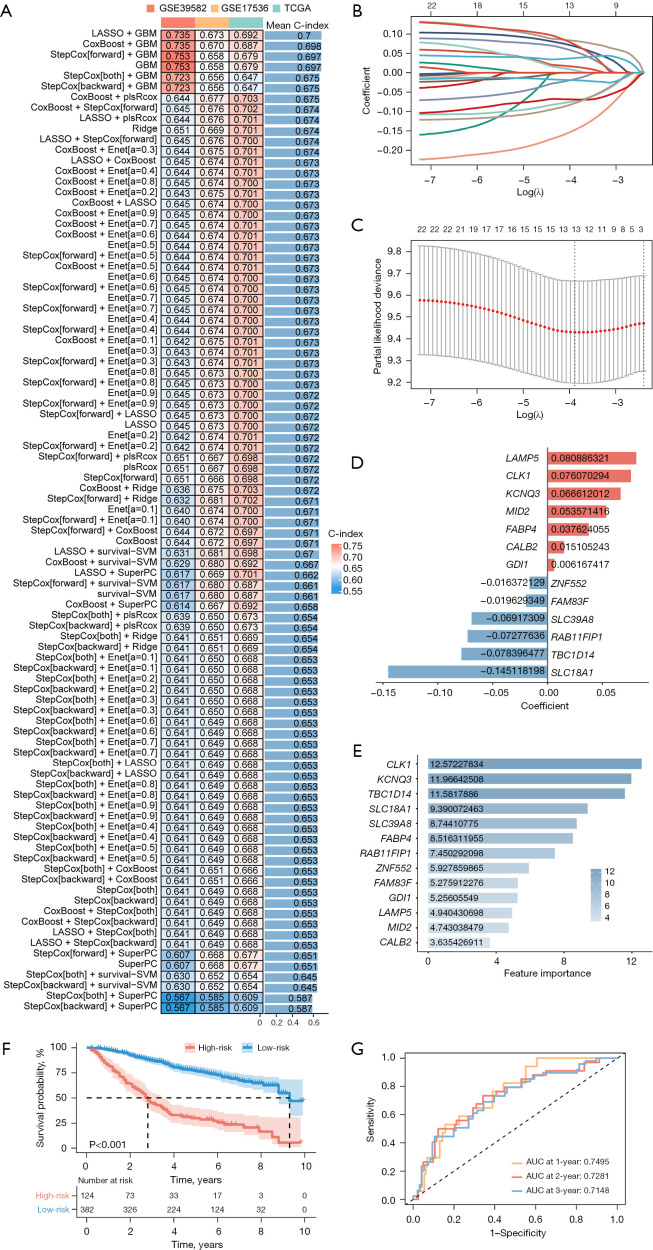
To construct a reliable prognostic signature, we applied a comprehensive machine learning survival framework to the 22 prognostic genes in the GSE39582 training dataset. The framework consisted of 97 algorithm combinations, which were used to develop corresponding models. Then, the C-index value of each model was calculated across the training and validation datasets. Comparatively, the 13-gene prognostic signature constructed through the “LASSO + GBM” combination exhibited the highest average C-index across the three cohorts, and was thus identified as the optimal model (Figure 2A). In detail, in the GSE39582 training cohort, 13 genes including LAMP5, CLK1, KCNQ3, MID2, FABP4, CALB2, GDI1, ZNF552, FAM83F, SLC39A8, RAB11FIP1, TBC1D14 and SLC18A1, were identified as the most critical subset closely associated with the prognosis of CRC patients by LASSO Cox regression analysis (Figure 2B-2D). GBM algorithm was further employed to determine the importance of these 13 genes with non-zero coefficient in the prognostic signature (Figure 2E). Accordingly, the risk score of each CRC patient was calculated in the GSE39582 dataset, and they were subsequently divided into high- and low-risk groups based on their respective scores.
Figure 2.
Construction of the 13-gene prognostic signature by machine learning methods. (A) C-index values of 97 combinations of machine learning algorithms in predicting the OS of CRC patients in the GSE39582, GSE17536 and TCGA datasets. (B,C) LASSO Cox regression analysis was performed to select genes used to comprise the prognostic signature. (D) LASSO coefficients for 13 genes with prognostic value. (E) Contribution of 13 genes with prognostic value in GBM. (F) KM survival curves for patients in the high- and low-risk groups. (G) Time-dependent ROC curves for assessing the predictive power of the constructed signature. TCGA, The Cancer Genome Atlas; AUC, area under the curve; OS, overall survival; CRC, colorectal cancer; LASSO, least absolute shrinkage and selection operator; SuperPC, supervised principal components; GBM, gradient boosting machine; plsRcox, partial least squares regression for Cox; survival-SVM, survival support vector machine; KM, Kaplan-Meier; ROC, receiver operating curve.
Furthermore, to assess the performance of the 13-gene prognostic signature in stratifying CRC patients with different risks, KM survival curve analysis was conducted in the GSE39582 dataset. The result revealed a significant decrease in OS rates for patients in the high-risk group compared to those in the low-risk group, indicating that high-risk patients had a worse prognosis (P<0.001) (Figure 2F). Besides, time-dependent ROC analysis was employed to assess the predictive capability of the 13-gene signature. The results showed that the AUC values for 1-, 2- and 3-year survival were 0.7495, 0.7281 and 0.7148, respectively (Figure 2G), indicating its relatively good performance in predicting patient outcomes.
Validation of the predictive capability of the 13-gene prognostic signature
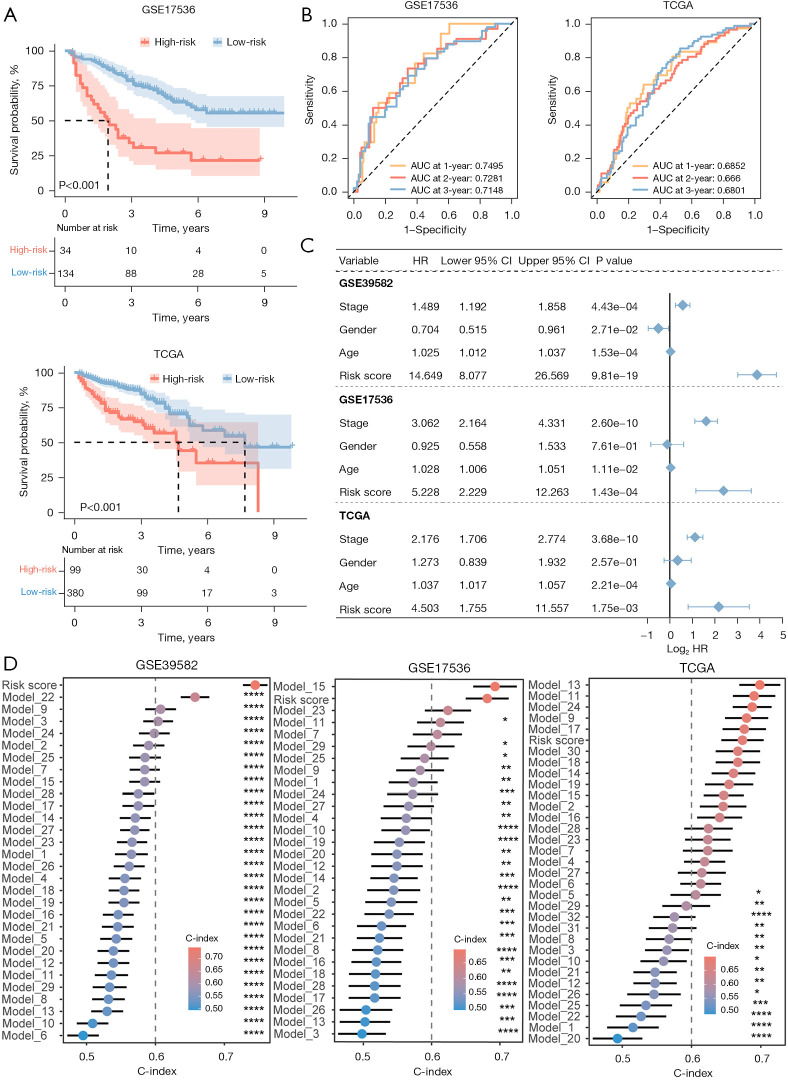
The robustness of the established prognostic signature was further evaluated in the validation datasets TCGA (COAD + READ, n=497) and GSE17536 (n=177). Within each dataset, CRC patients were stratified into high-risk and low-risk groups based on the optimal cutoff point of the risk score. KM survival curve analysis indicated that patients in the low-risk group had higher OS probability compared to those in the high-risk group (Figure 3A). Time-dependent ROC analysis demonstrated the stable predictive ability of the model for patient survival time (Figure 3B). Furthermore, multivariate Cox regression analysis showed that the signature-derived risk score and common clinical factors including age and stage could serve as independent prognostic indicators for CRC patients across the three cohorts (Figure 3C). Importantly, the 13-gene prognostic signature consistently outperformed most of the 30 previously published models when evaluating the C-index across three datasets (Figure 3D). Therefore, these findings indicated that the 13-gene signature exhibited a powerful ability in predicting the clinical survival of CRC patients.
Figure 3.
Performance assessment of the 13-gene prognostic signature in predicting the OS of CRC patients. (A) KM survival curve analyses were performed to assess the performance of the 13-gene signature in predicting the OS of high- and low-risk patients in the validation datasets (GSE17536 and TCGA). (B) Time-dependent ROC curve analyses were conducted to determine the ability of the 13-gene signature in predicting the 1-, 2- and 3-year OS in the validation datasets (GSE17536 and TCGA). (C) Multivariable Cox regression analysis of the signature-derived risk score and common clinical factors in the training and validation dataset. (D) Comparison of the C-index values between the 13-gene signature and 30 previously published models in the training and validation cohorts. *, P<0.05; **, P<0.01; ***, P<0.001; ****, P<0.0001. TCGA, The Cancer Genome Atlas; AUC, area under the curve; HR, hazard ratio; CI, confidence interval; OS, overall survival; CRC, colorectal cancer; KM, Kaplan-Meier; ROC, receiver operating curve.
Construction of a nomogram to quantify the OS of CRC patients
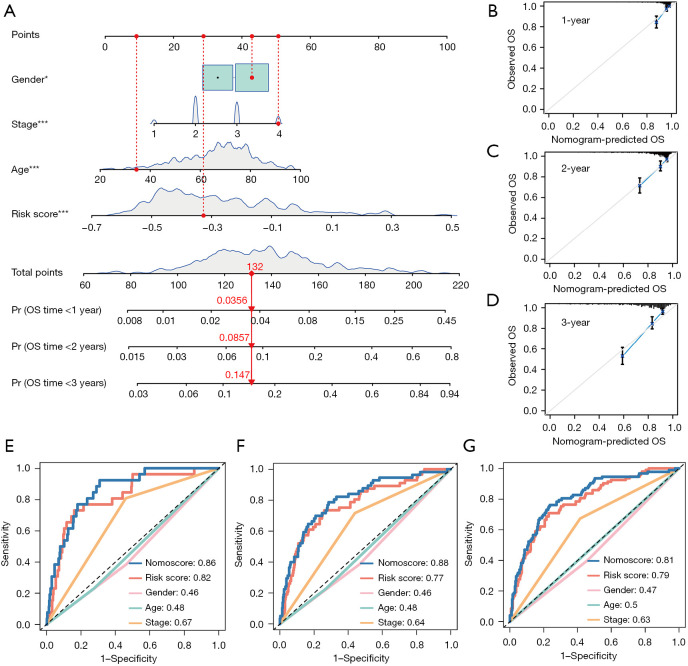
A nomogram could provide a concise visual representation of prognostic factors, facilitating the estimation of individualized survival probabilities across multiple time points for patients. Accordingly, utilizing four independent prognostic factors (including gender, age, stage, and risk score) obtained from multivariate Cox regression analysis, we developed a nomogram to assess the 1-, 2-, and 3-year OS of CRC samples in the GSE39582 dataset (Figure 4A). Notably, the calibration curve analysis showed good agreement between the observed and predicted OS probabilities (Figure 4B-4D). Moreover, the ROC curve analyses demonstrated that the 1-, 2-, and 3-year AUC values of the nomogram-derived score (nomoscore) were 0.86, 0.88, and 0.81, respectively, which exceeded the AUC values of the risk score, stage, age and gender (Figure 4E-4G). These findings suggest that the prognostic nomogram had robust power for predicting the OS of CRC patients.
Figure 4.
Nomogram for predicting OS of CRC patients in the GSE39582 dataset. (A) Construction of the nomogram based on the independent prognostic indicators identified by multivariable Cox regression analysis. (B-D) Calibration curves of the nomogram at 1-year (B), 2-year (C) and 3-year (D). (E-G) Comparison of the predictive ability at 1-year (E), 2-year (F) and 3-year (G) through ROC curve analysis. *, P<0.05; ***, P<0.001. OS, overall survival; CRC, colorectal cancer; ROC, receiver operating curve.
Correlation between the 13-gene prognostic signature and clinical characteristics
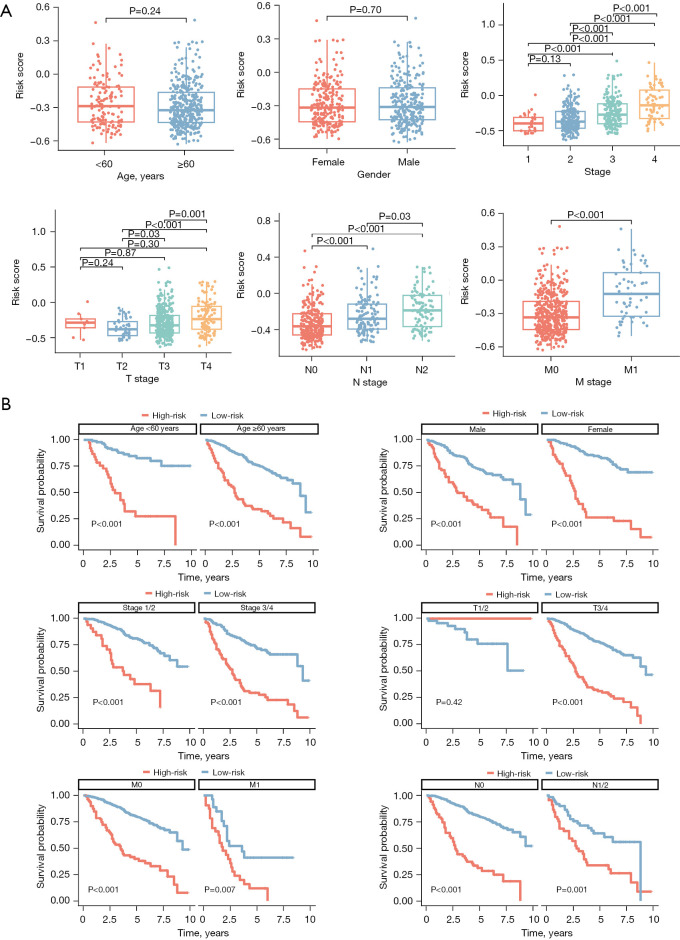
To elucidate the relationship between the 13-gene prognostic signature and common clinical features, we evaluated the variation in risk scores across different clinical subgroups in the GSE39582 cohort. As shown in Figure 5A, the risk score was closely related to TNM stage, T stage, N stage and M stage, whereas no correlation was observed between the risk score and age or gender. Moreover, patients with advanced stage, distant metastasis, and lymph node metastasis tended to possess higher risk score, which is consistent with clinical observations. Furthermore, a stratified KM curve analysis was conducted in the GSE39582 dataset to evaluate the predictive efficacy of the 13-gene signature in different clinical subgroups of CRC patients. The results showed that high-risk patients had a worse prognosis than low-risk patients across various subgroups, including age <60, age ≥60, male, female, TNM stage I/II, TNM stage III/IV, T3/4, M0, M1, N0 and N1/2 subgroups (Figure 5B). These findings suggest that the prognostic model is highly stable, as it can effectively distinguish between high- and low-risk groups in most independent clinical subgroups.
Figure 5.
Correlation analysis between the 13-gene prognostic signature and clinical information. (A) Correlation analysis between the 13-gene prognostic signature and common clinical information. (B) Stratified KM survival curve analyses were performed to assess the performance of the 13-gene signature in predicting the OS of high- and low-risk patients in the different subgroups of the GSE39582 training dataset. KM, Kaplan-Meier; OS, overall survival.
Correlation between the 13-gene prognostic signature and immune status
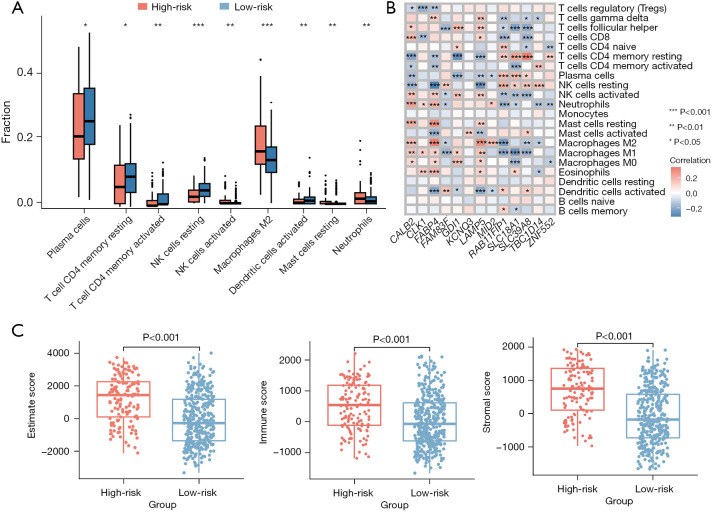
Considering the crucial role of immune infiltration in cancer progression, we used the CIBERSORT algorithm to quantify the difference in the abundance of immune cell infiltration between the high- and low-risk groups in the GSE39582 dataset. As shown in Figure 6A, there were significant differences in the infiltration levels of nine immune cell types between the high- and low-risk groups, such as M2 macrophages and neutrophils. Notably, among the 13 genes utilized in constructing the signature, the expression levels of CALB2, FABP4, FAM83F, LAMP5, MID2, RAB11FIP1, SLC39AB and TBC1D14 were significantly linked to the abundance of M2 macrophages (P<0.05) (Figure 6B). In addition, the signature-derived risk score was significantly correlated with both immune score and stromal score (P<0.001) (Figure 6C). These findings suggest that the 13-gene prognostic model may be associated with immune cell infiltration levels and could potentially serve as a biomarker for predicting the tumor immune microenvironment of CRC.
Figure 6.
Correlation analysis between the 13-gene prognostic signature and immune status. (A) Correlation analysis between the signature-derived risk score and the infiltration level of immune cells in the GSE39582 dataset. (B) Correlation analysis between the expression levels of signature-related genes and the infiltration level of immune cells in the GSE39582 dataset. (C) Correlation analysis between the risk score and immune score, stromal score and estimate score in the GSE39582 dataset. *, P<0.05; **, P<0.01; ***, P<0.001.
Association between the 13-gene prognostic signature and drug sensitivity
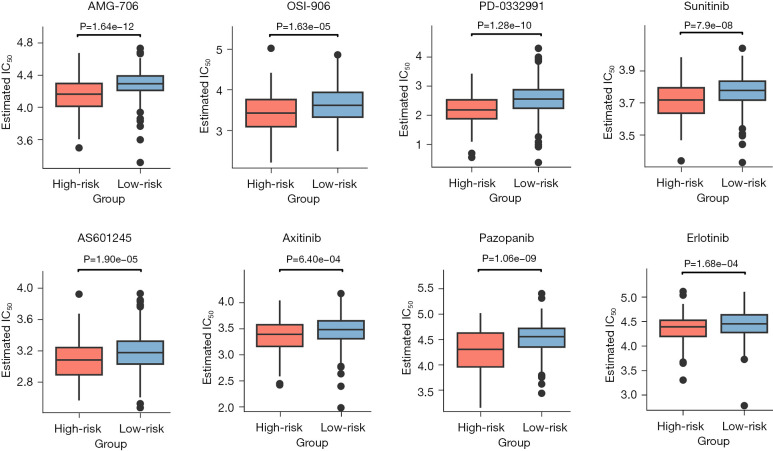
Chemotherapy is a critical strategy in shrinking tumors, preventing their spread, and improving OS rates for patients with CRC (30). To preliminarily explore the potential of the 13-gene prognostic signature in guiding chemotherapy for CRC, we conducted a correlation analysis between the prognostic model and drug sensitivity based on GDSC database. IC50 refers to the concentration of an antagonist that is required to inhibit half of the measured biological activity. As shown in Figure 7, the IC50 values of eight drugs reported for the clinical treatment of CRC, including AMG-706 (31), OSI-906 (32), PD-0332991 (33), sunitinib (34), AS01245 (35), axitinib (36), pazopanib (37) and erlotinib (38), were lower in the high-risk group than in the low-risk group (P<0.001), indicating the promising role of the 13-gene prognostic signature in predicting chemotherapy response.
Figure 7.
Comparison of responses to chemotherapeutic agents between the high- and low-risk patients. IC50, half maximal inhibitory concentration.
Expression pattern of representative genes in the 13-gene prognostic signature
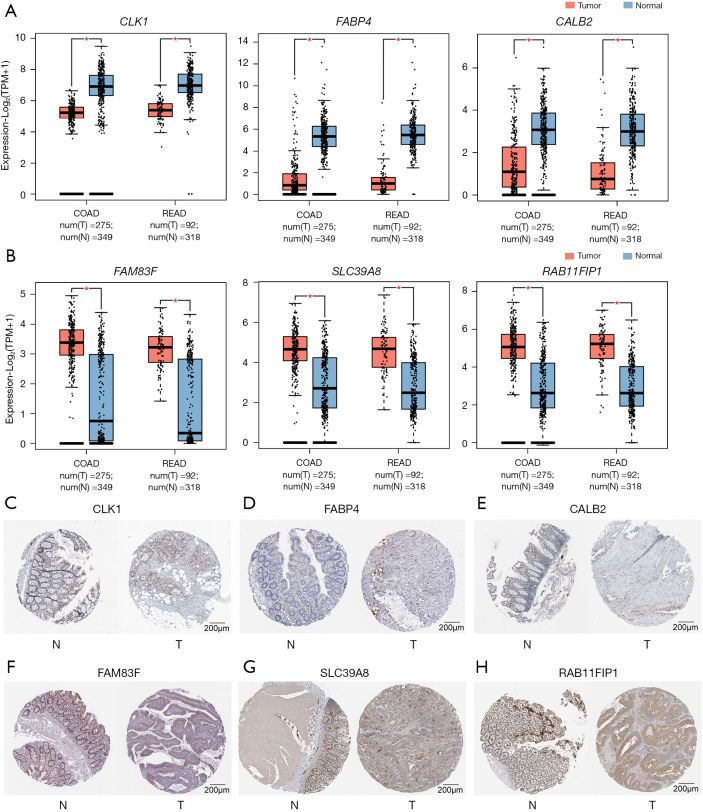
To gain further insight into the 13-gene prognostic signature, we compared the expression patterns of representative genes that make up the signature in the tumor and normal control tissues of CRC. As shown in Figure 8A,8B, CLK1, FABP4 and CALB2 were significantly down-regulated in tumor tissues, while GDI1, FAM83F and SLC39A8 had the opposite trend. Furthermore, the protein expression levels of these genes in tumor and normal control tissues were examined using the Human Protein Atlas (HPA) database, which confirmed the above findings (Figure 8C-8H).
Figure 8.
Expression pattern of representative genes comprising the 13-gene prognostic signature. (A,B) Expression levels of the representative down-regulated genes (A) and up-regulated genes (B) in the tumor and normal control tissues of CRC patients. (C-H) Immunohistochemical images were obtained from the Human Protein Atlas database. (C) Immunohistochemical images of CLK1, normal sample (image available from https://www.proteinatlas.org/ENSG00000013441-CLK1/tissue/colon#img), and tumor sample (image available from https://www.proteinatlas.org/ENSG00000013441-CLK1/pathology/colorectal+cancer#img). (D) Immunohistochemical images of FABP4, normal sample (image available from https://www.proteinatlas.org/ENSG00000170323-FABP4/tissue/colon#img), and tumor sample (image available from https://www.proteinatlas.org/ENSG00000170323-FABP4/pathology/colorectal+cancer#img). (E) Immunohistochemical images of CALB2, normal sample (image available from https://www.proteinatlas.org/ENSG00000172137-CALB2/tissue/colon#img), and tumor sample (image available from https://www.proteinatlas.org/ENSG00000172137-CALB2/pathology/colorectal+cancer#img). (F) Immunohistochemical images of FAM83F, normal sample (image available from https://www.proteinatlas.org/ENSG00000133477-FAM83F/tissue/colon#img), and tumor sample (image available from https://www.proteinatlas.org/ENSG00000133477-FAM83F/pathology/colorectal+cancer#img). (G) Immunohistochemical images of SLC39A8, normal sample (image available from https://www.proteinatlas.org/ENSG00000138821-SLC39A8/tissue/colon#img), and tumor sample (image available from https://www.proteinatlas.org/ENSG00000138821-SLC39A8/pathology/colorectal+cancer#img). (H) Immunohistochemical images of RAB11FIP1, normal sample (image available from https://www.proteinatlas.org/ENSG00000156675-RAB11FIP1/tissue/colon#img), and tumor sample (image available from https://www.proteinatlas.org/ENSG00000156675-RAB11FIP1/pathology/colorectal+cancer#img). *, P<0.05. TPM, transcripts per million; COAD, colon adenocarcinoma; READ, rectum adenocarcinoma; CRC, colorectal cancer; N, normal control; T, tumor.
Discussion
In recent years, how to improve the prognosis and personalized treatment outcome of CRC patients has been the focus of both biological researchers and clinicians. Given this challenge, this study aimed to construct a multi-gene model for predicting OS of CRC patients and elucidate its functional significance through an integrated computational approach.
The integration of machine learning algorithms to construct prognostic risk prediction models for cancer patients is currently a popular strategy in the field of oncology. For example, Feng et al. utilized eight machine learning algorithms to assess the risk of lymph node metastasis in central neck thyroid cancer, and found that the “LASSO + RF” combination yielded the most effective model for predicting metastasis (39). Li et al. combined ten machine learning algorithms to form 117 combinations and found that “LASSO + Stepcox” was the optimal combination for constructing an immune-related lncRNA prognostic model for gastric cancer (40). Similarly, among the 97 combinations of machine learning algorithms utilized in this study, “LASSO + GBM” exhibited the best performance and thus was selected for constructing the prognostic signature. LASSO is a linear regression method that adds a penalty term to the sum of squared residuals to force some coefficients to be exactly zero. The advantage of LASSO in handling high-dimensional data by reducing the number of variables in the model, makes it a popular method in survival analysis (41). The GBM method excels at handling nonlinear relationships, considering interactions (42) and incorporating higher-order effects in the modeling process to better capture complex biological features and potential nonlinear associations (43,44). Considering the importance of avoiding overfitting and improving generalization (45), this study adopted ten-fold cross-validation for LASSO Cox regression analysis to select the optimal λ value and for GBM to select the optimal number of decision trees, thereby minimizing the prediction error. Notably, our 13-gene prognostic signature demonstrated high prediction accuracy in both the training and validation sets when compared to 30 published prognostic models, as indicated by the C-index value.
Functionally, the signature-derived risk score was closely associated with the infiltration levels of multiple immune cell types as well as stromal score and immune score (Figure 6). Additionally, there were significant differences in the responses to eight reported chemotherapeutic agents between the high- and low-risk CRC patients, including AMG-706 (31), OSI-906 (46), PD-0332991 (33), sunitinib (34), AS01245 (35), axitinib (36), pazopanib (37) and erlotinib (38). For example, Kaya et al. (31) found that AMG-706 exhibited anti-proliferative, anti-angiogenic, and apoptotic effects on HT29 CRC cells, and the combination of AMG-706 with DUP-697 could further enhance these effects. Leiphrakpam et al. (32) demonstrated that OSI-906, a small molecule tyrosine kinase inhibitor, could act as an IGF-1R antagonist and inhibit subcutaneous CRC xenograft growth. This is achieved by downregulating the X-linked inhibitor of apoptosis (XIAP) protein, which is crucial for cell survival and prevention of cell death. Therefore, the 13-gene prognostic signature could serve as a valuable tool for assisting in the clinical decision-making concerning the treatment of CRC.
Furthermore, we found that some of the genes comprising the 13-gene prognostic model were involved in CRC pathogenesis. For example, FABP4 knockdown could inhibit CRC progression by regulating cell growth, apoptosis, stemness and glycolysis through the reactive oxygen species/extracellular signal-regulated kinase/mammalian target of rapamycin (ROS/ERK/mTOR) pathway (47). Ma et al. (48) demonstrated that MID2 could mediate the proliferation, migration, and invasion of CRC cells in vitro. CALB2 has been recognized as a prognostic biomarker for CRC and a potential target for gemcitabine, a preferred second-line anti-cancer drug used in the treatment of CRC (49). Xie et al. (50) demonstrated that elevated levels of GDI1 were dramatically associated with poor outcomes in CRC patients. Therefore, the identification of these genes in the 13-gene prognostic model provides valuable insights into the molecular mechanisms underlying CRC pathogenesis and highlights their potential as prognostic biomarkers and therapeutic targets for CRC.
In addition, there are some limitations in this study. First, the clinical utility of the 13-gene prognostic signature identified in this study may be restricted by sample size constraints and potential biases in the datasets. Second, the stability and generalizability of the model across diverse patient populations and clinical settings require further validation. Third, the functions of the genes that make up the prognostic model need to be experimentally verified in CRC.
Conclusions
The machine learning-based prognostic model developed in this study can be used to stratify CRC patients into different risk groups based on their gene expression profiles. Its prognostic value was evaluated and verified through KM survival analysis, time-dependent ROC curve analysis and multivariate Cox regression analysis in the training and validation datasets. Therefore, this signature provides an opportunity to improve individualized treatment strategies and enhance patient outcomes for CRC.
Supplementary
The article’s supplementary files as
Acknowledgments
Funding: This study was supported by the National Natural Science Foundation of China (grant No. 32270705) and the Postgraduate Research & Practice Innovation Program of Jiangsu Province (grant No. KYCX23_3344).
Ethical Statement: The authors are accountable for all aspects of the work in ensuring that questions related to the accuracy or integrity of any part of the work are appropriately investigated and resolved. The study was conducted in accordance with the Declaration of Helsinki (as revised in 2013).
Footnotes
Reporting Checklist: The authors have completed the TRIPOD reporting checklist. Available at https://jgo.amegroups.com/article/view/10.21037/jgo-24-325/rc
Conflicts of Interest: All authors have completed the ICMJE uniform disclosure form (available at https://jgo.amegroups.com/article/view/10.21037/jgo-24-325/coif). The authors have no conflicts of interest to declare.
References
- 1.Bray F, Laversanne M, Sung H, et al. Global cancer statistics 2022: GLOBOCAN estimates of incidence and mortality worldwide for 36 cancers in 185 countries. CA Cancer J Clin 2024;74:229-63. 10.3322/caac.21834 [DOI] [PubMed] [Google Scholar]
- 2.Xia C, Dong X, Li H, et al. Cancer statistics in China and United States, 2022: profiles, trends, and determinants. Chin Med J (Engl) 2022;135:584-90. 10.1097/CM9.0000000000002108 [DOI] [PMC free article] [PubMed] [Google Scholar]
- 3.Siegel RL, Wagle NS, Cercek A, et al. Colorectal cancer statistics, 2023. CA Cancer J Clin 2023;73:233-54. 10.3322/caac.21772 [DOI] [PubMed] [Google Scholar]
- 4.Fan A, Wang B, Wang X, et al. Immunotherapy in colorectal cancer: current achievements and future perspective. Int J Biol Sci 2021;17:3837-49. 10.7150/ijbs.64077 [DOI] [PMC free article] [PubMed] [Google Scholar]
- 5.Wu J, Zhou X, Ren J, et al. Glycosyltransferase-related prognostic and diagnostic biomarkers of uterine corpus endometrial carcinoma. Comput Biol Med 2023;163:107164. 10.1016/j.compbiomed.2023.107164 [DOI] [PubMed] [Google Scholar]
- 6.Mansouri Z, Salimi Y, Amini M, et al. Development and validation of survival prognostic models for head and neck cancer patients using machine learning and dosiomics and CT radiomics features: a multicentric study. Radiat Oncol 2024;19:12. 10.1186/s13014-024-02409-6 [DOI] [PMC free article] [PubMed] [Google Scholar]
- 7.Sajda P. Machine learning for detection and diagnosis of disease. Annu Rev Biomed Eng 2006;8:537-65. 10.1146/annurev.bioeng.8.061505.095802 [DOI] [PubMed] [Google Scholar]
- 8.Tran KA, Kondrashova O, Bradley A, et al. Deep learning in cancer diagnosis, prognosis and treatment selection. Genome Med 2021;13:152. 10.1186/s13073-021-00968-x [DOI] [PMC free article] [PubMed] [Google Scholar]
- 9.Li C, Liu M, Li J, et al. Machine learning predicts the prognosis of breast cancer patients with initial bone metastases. Front Public Health 2022;10:1003976. 10.3389/fpubh.2022.1003976 [DOI] [PMC free article] [PubMed] [Google Scholar]
- 10.Qu J, Li C, Liu M, et al. Prognostic Models Using Machine Learning Algorithms and Treatment Outcomes of Occult Breast Cancer Patients. J Clin Med 2023;12:3097. 10.3390/jcm12093097 [DOI] [PMC free article] [PubMed] [Google Scholar]
- 11.Gong Q, Chen X, Liu F, et al. Machine learning-based integration develops a neutrophil-derived signature for improving outcomes in hepatocellular carcinoma. Front Immunol 2023;14:1216585. 10.3389/fimmu.2023.1216585 [DOI] [PMC free article] [PubMed] [Google Scholar]
- 12.Zhu W, Zeng H, Huang J, et al. Integrated machine learning identifies epithelial cell marker genes for improving outcomes and immunotherapy in prostate cancer. J Transl Med 2023;21:782. 10.1186/s12967-023-04633-2 [DOI] [PMC free article] [PubMed] [Google Scholar]
- 13.Zhang N, Zhang H, Liu Z, et al. An artificial intelligence network-guided signature for predicting outcome and immunotherapy response in lung adenocarcinoma patients based on 26 machine learning algorithms. Cell Prolif 2023;56:e13409. 10.1111/cpr.13409 [DOI] [PMC free article] [PubMed] [Google Scholar]
- 14.Marisa L, de Reyniès A, Duval A, et al. Gene expression classification of colon cancer into molecular subtypes: characterization, validation, and prognostic value. PLoS Med 2013;10:e1001453. 10.1371/journal.pmed.1001453 [DOI] [PMC free article] [PubMed] [Google Scholar]
- 15.Jia A, Xu L, Wang Y. Venn diagrams in bioinformatics. Brief Bioinform 2021;22:bbab108. 10.1093/bib/bbab108 [DOI] [PubMed] [Google Scholar]
- 16.Liu Z, Liu L, Weng S, et al. Machine learning-based integration develops an immune-derived lncRNA signature for improving outcomes in colorectal cancer. Nat Commun 2022;13:816. 10.1038/s41467-022-28421-6 [DOI] [PMC free article] [PubMed] [Google Scholar]
- 17.Kassambara A, Kosinski M, Biecek P. survminer: Drawing Survival Curves using 'ggplot2'. CRAN: Contributed Packages; 2016.
- 18.Therneau TM, Lumley T. Package 'survival'. R Top Doc 2015;12810:28-33. [Google Scholar]
- 19.Nahm FS. Receiver operating characteristic curve: overview and practical use for clinicians. Korean J Anesthesiol 2022;75:25-36. 10.4097/kja.21209 [DOI] [PMC free article] [PubMed] [Google Scholar]
- 20.Huang J, Zhang JL, Ang L, et al. Proposing a novel molecular subtyping scheme for predicting distant recurrence-free survival in breast cancer post-neoadjuvant chemotherapy with close correlation to metabolism and senescence. Front Endocrinol (Lausanne) 2023;14:1265520. 10.3389/fendo.2023.1265520 [DOI] [PMC free article] [PubMed] [Google Scholar]
- 21.Bi G, Li R, Liang J, et al. A nomogram with enhanced function facilitated by nomogramEx and nomogramFormula. Ann Transl Med 2020;8:78. 10.21037/atm.2020.01.71 [DOI] [PMC free article] [PubMed] [Google Scholar]
- 22.Xenopoulos P, Rulff J, Nonato LG, et al. Calibrate: Interactive Analysis of Probabilistic Model Output. IEEE Trans Vis Comput Graph 2023;29:853-63. 10.1109/TVCG.2022.3209489 [DOI] [PubMed] [Google Scholar]
- 23.Newman AM, Liu CL, Green MR, et al. Robust enumeration of cell subsets from tissue expression profiles. Nat Methods 2015;12:453-7. 10.1038/nmeth.3337 [DOI] [PMC free article] [PubMed] [Google Scholar]
- 24.Yoshihara K, Shahmoradgoli M, Martínez E, et al. Inferring tumour purity and stromal and immune cell admixture from expression data. Nat Commun 2013;4:2612. 10.1038/ncomms3612 [DOI] [PMC free article] [PubMed] [Google Scholar]
- 25.Tang Z, Kang B, Li C, et al. GEPIA2: an enhanced web server for large-scale expression profiling and interactive analysis. Nucleic Acids Res 2019;47:W556-60. 10.1093/nar/gkz430 [DOI] [PMC free article] [PubMed] [Google Scholar]
- 26.Colwill K;; Gräslund S. A roadmap to generate renewable protein binders to the human proteome. Nat Methods 2011;8:551-8. 10.1038/nmeth.1607 [DOI] [PubMed] [Google Scholar]
- 27.Yang W, Soares J, Greninger P, et al. Genomics of Drug Sensitivity in Cancer (GDSC): a resource for therapeutic biomarker discovery in cancer cells. Nucleic Acids Res 2013;41:D955-61. 10.1093/nar/gks1111 [DOI] [PMC free article] [PubMed] [Google Scholar]
- 28.Geeleher P, Cox N, Huang RS. pRRophetic: an R package for prediction of clinical chemotherapeutic response from tumor gene expression levels. PLoS One 2014;9:e107468. 10.1371/journal.pone.0107468 [DOI] [PMC free article] [PubMed] [Google Scholar]
- 29.Dessau RB, Pipper CB. R.--en programpakke til statistisk databehandling og grafik. Ugeskr Laeger 2008;170:328-30. [PubMed] [Google Scholar]
- 30.Kotani D, Oki E, Nakamura Y, et al. Molecular residual disease and efficacy of adjuvant chemotherapy in patients with colorectal cancer. Nat Med 2023;29:127-34. 10.1038/s41591-022-02115-4 [DOI] [PMC free article] [PubMed] [Google Scholar]
- 31.Kaya TT, Altun A, Turgut NH, et al. Effects of a Multikinase Inhibitor Motesanib (AMG 706) Alone and Combined with the Selective DuP-697 COX-2 Inhibitor on Colorectal Cancer Cells. Asian Pac J Cancer Prev 2016;17:1103-10. 10.7314/APJCP.2016.17.3.1103 [DOI] [PubMed] [Google Scholar]
- 32.Leiphrakpam PD, Agarwal E, Mathiesen M, et al. In vivo analysis of insulin-like growth factor type 1 receptor humanized monoclonal antibody MK-0646 and small molecule kinase inhibitor OSI-906 in colorectal cancer. Oncol Rep 2014;31:87-94. 10.3892/or.2013.2819 [DOI] [PMC free article] [PubMed] [Google Scholar]
- 33.Li C, Qi L, Bellail AC, et al. PD-0332991 induces G1 arrest of colorectal carcinoma cells through inhibition of the cyclin-dependent kinase-6 and retinoblastoma protein axis. Oncol Lett 2014;7:1673-8. 10.3892/ol.2014.1957 [DOI] [PMC free article] [PubMed] [Google Scholar]
- 34.Lahti S, Ludwig JM, Xing M, et al. In vitro biologic efficacy of sunitinib drug-eluting beads on human colorectal and hepatocellular carcinoma-A pilot study. PLoS One 2017;12:e0174539. 10.1371/journal.pone.0174539 [DOI] [PMC free article] [PubMed] [Google Scholar]
- 35.Cerbone A, Toaldo C, Minelli R, et al. Rosiglitazone and AS601245 decrease cell adhesion and migration through modulation of specific gene expression in human colon cancer cells. PLoS One 2012;7:e40149. 10.1371/journal.pone.0040149 [DOI] [PMC free article] [PubMed] [Google Scholar]
- 36.Berndsen RH, Swier N, van Beijnum JR, et al. Colorectal Cancer Growth Retardation through Induction of Apoptosis, Using an Optimized Synergistic Cocktail of Axitinib, Erlotinib, and Dasatinib. Cancers (Basel) 2019;11:1878. Erratum in: Cancers (Basel) 2020;12:E1079. 10.3390/cancers11121878 [DOI] [PMC free article] [PubMed] [Google Scholar]
- 37.Itatani Y, Kawada K, Yamamoto T, et al. Resistance to Anti-Angiogenic Therapy in Cancer-Alterations to Anti-VEGF Pathway. Int J Mol Sci 2018;19:1232. 10.3390/ijms19041232 [DOI] [PMC free article] [PubMed] [Google Scholar]
- 38.Siegman A, Shaykevich A, Chae D, et al. Erlotinib Treatment in Colorectal Cancer Suppresses Autophagy Based on KRAS Mutation. Curr Issues Mol Biol 2024;46:7530-47. 10.3390/cimb46070447 [DOI] [PMC free article] [PubMed] [Google Scholar]
- 39.Feng JW, Ye J, Qi GF, et al. LASSO-based machine learning models for the prediction of central lymph node metastasis in clinically negative patients with papillary thyroid carcinoma. Front Endocrinol (Lausanne) 2022;13:1030045. 10.3389/fendo.2022.1030045 [DOI] [PMC free article] [PubMed] [Google Scholar]
- 40.Li G, Huo D, Guo N, et al. Integrating multiple machine learning algorithms for prognostic prediction of gastric cancer based on immune-related lncRNAs. Front Genet 2023;14:1106724. 10.3389/fgene.2023.1106724 [DOI] [PMC free article] [PubMed] [Google Scholar]
- 41.Ternès N, Rotolo F, Michiels S. Empirical extensions of the lasso penalty to reduce the false discovery rate in high-dimensional Cox regression models. Stat Med 2016;35:2561-73. 10.1002/sim.6927 [DOI] [PubMed] [Google Scholar]
- 42.Salditt M, Humberg S, Nestler S. Gradient Tree Boosting for Hierarchical Data. Multivariate Behav Res 2023;58:911-37. 10.1080/00273171.2022.2146638 [DOI] [PubMed] [Google Scholar]
- 43.Zhang Z, Zhao Y, Canes A, et al. Predictive analytics with gradient boosting in clinical medicine. Ann Transl Med 2019;7:152. 10.21037/atm.2019.03.29 [DOI] [PMC free article] [PubMed] [Google Scholar]
- 44.Cygu S, Seow H, Dushoff J, et al. Comparing machine learning approaches to incorporate time-varying covariates in predicting cancer survival time. Sci Rep 2023;13:1370. 10.1038/s41598-023-28393-7 [DOI] [PMC free article] [PubMed] [Google Scholar]
- 45.Charilaou P, Battat R. Machine learning models and over-fitting considerations. World J Gastroenterol 2022;28:605-7. 10.3748/wjg.v28.i5.605 [DOI] [PMC free article] [PubMed] [Google Scholar]
- 46.Bendell JC, Jones SF, Hart L, et al. A phase Ib study of linsitinib (OSI-906), a dual inhibitor of IGF-1R and IR tyrosine kinase, in combination with everolimus as treatment for patients with refractory metastatic colorectal cancer. Invest New Drugs 2015;33:187-93. 10.1007/s10637-014-0177-3 [DOI] [PubMed] [Google Scholar]
- 47.Gao Y, Wang Y, Wang X, et al. FABP4 Regulates Cell Proliferation, Stemness, Apoptosis, and Glycolysis in Colorectal Cancer via Modulating ROS/ERK/mTOR Pathway. Discov Med 2023;35:361-71. 10.24976/Discov.Med.202335176.37 [DOI] [PubMed] [Google Scholar]
- 48.Ma Y, Li J, Zhao X, et al. Multi-omics cluster defines the subtypes of CRC with distinct prognosis and tumor microenvironment. Eur J Med Res 2024;29:207. 10.1186/s40001-024-01805-8 [DOI] [PMC free article] [PubMed] [Google Scholar]
- 49.Zeng X, Sun L, Ling X, et al. Comprehensive analysis identifies novel targets of gemcitabine to improve chemotherapy treatment strategies for colorectal cancer. Front Endocrinol (Lausanne) 2023;14:1170526. 10.3389/fendo.2023.1170526 [DOI] [PMC free article] [PubMed] [Google Scholar]
- 50.Xie X, Lin H, Zhang X, et al. Overexpression of GDP dissociation inhibitor 1 gene associates with the invasiveness and poor outcomes of colorectal cancer. Bioengineered 2021;12:5595-606. 10.1080/21655979.2021.1967031 [DOI] [PMC free article] [PubMed] [Google Scholar]


