

Abstract
In our previous work, pulsed nano-electrospray ionization was applied to aqueous mixtures of 5 × 10⁻⁶ M angiotensin II (A), bradykinin (B), and gramicidin S (G). It was found that G was totally suppressed by the presence of A and B. In this work, mixtures of A, B, and G in water/acetonitrile (W/AcN) were investigated by pulsed nano-electrospray ionization. It was found that G and A were detected as major ions, but B was almost totally suppressed by the addition of 1% acetic acid in the W/AcN solution. In contrast, B was detected as one of the major ions for the solution with the addition of 10 mM ammonium acetate. These results were interpreted based on the solvent effect. While the hydration of ornithine −NH3+ in aqueous solution makes the ion most hydrophilic, solvation of ornithine −NH3+ by AcN in W/AcN makes the ion solvophobic and surface active.
Keywords: pulsed nano-electrospray, solvent effect, peptide, acetonitrile
INTRODUCTION
We have developed pulsed nano-electrospray ionization for the study of time-dependent charging of the Taylor cone.1,2) Electrospray initiates when the electrostatic pressure (PE) becomes stronger than the inward pressure (Pγ) caused by the surface tension of the liquid droplet. By increasing the pulse widths of the high voltage applied to the liquid, it is possible to observe the dynamic change in the accumulation of excess charges on the Taylor cone that is directly reflected in the observed mass spectra. In our previous paper,1) nano-electrospray mass spectra for solutions of gramicidin S (G), ubiquitin (U), and cytochrome c (C) in water/methanol (1/1) were measured as a function of the high voltage (4000 V) pulse width in the range of 200 ns to 1 ms. Multiply protonated ions for all analytes started to be detected with a 300 µs pulse width. The denaturation of C and U was found to proceed with an increase in pulse width. When a bias voltage of ~880 V that was lower than the threshold voltage for the generation of continuous electrospray (~1000 V) was applied to the liquid, multiply protonated G, U, and C were detected with a much shorter pulse width of 200 ns. This is due to the preconcentration of excess charges on the liquid droplet by the application of the bias voltage.
Pulsed nano-electrospray ionization was also applied to aqueous mixtures of angiotensin II (A), bradykinin (B), and gramicidin S (G).2) Heavily sodiated ions for A and B were detected. It was proposed that carboxyl (−COOH), imidazole >N−H, hydroxyl (−OH) as well as amide >N−H bonds act as acids and are deprotonated to form respective sodiated forms of carboxylate −COO–....Na+, imidazole >N–....Na+, hydroxyl −O–....Na+ and amide −N=C−O–....Na+ bonds. Strangely, ions of G were totally suppressed by the coexistence of A and B. In this work, the same solutions of A, B, and G were investigated in water/acetonitrile (1/1) with the addition of 1% acetic acid (AcOH) and 10 mM ammonium acetate (AcONH4). G and A were detected but B was almost totally suppressed for the solution with the addition of 1% AcOH. However, all analytes could be detected for the solution with the addition of 10 mM AcONH4. The observed marked difference in mass spectra depending on the solvent components and additives was interpreted based on the solvent effects.
EXPERIMENTAL
Materials
Water (W) was purified and deionized using a Simplicity UV system (Millipore, Bedford, MA, USA). Reagent-grade acetonitrile (AcN) was purchased from FUJIFILM Wako Chemicals (Osaka, Japan). Angiotensin II (A), bradykinin (B), and gramicidin S (G) were purchased from Sigma Aldrich (St. Louis, MO, USA). Figure 1 shows the chemical structures of A, B, and G.
Fig. 1. Chemical structure of angiotensin II (A), bradykinin (B), and gramicidin S (G).

Method for pulsed nano-electrospray ionization
A detailed description of the experimental procedure was provided in our previous paper.1) An acupuncture needle (L type No. 8, 300 µm o.d. and ~700 nm tip diameter, Seirin, Shizuoka, Japan) was inserted into a non-coated nano-electrospray glass capillary with an inner tip diameter of 4 ± 1 µm (PicoTip Emitter, BG12-94-4-N-20, New Objective, Inc., Woburn, MA, USA) filled with a 30 µL solution. The pulse voltage (PV) was applied to the needle using a digital delay generator (DG645, Stanford Research Systems, Sunnyvale, CA, USA) and a fast high voltage transistor switch (HTS 151-03-GSM, Behlke Power Electronics GmbH, Kronberg, Germany) coupled with two high-voltage power supplies (HJMP-5R1.2, Matsusada Precision, Shiga, Japan). The minimum output pulse width using this system was 200 ns. One power supply controlled the bias voltage (BV) from 0 V (ground potential) to 1000 V, while a second power supply controlled the PV (4000 V).
The metal needle in the capillary was positioned at ~1.5 mm from the tip of the glass capillary. The capillary was filled with a 30 µL sample solution. As a sample solution, mixtures of 5 × 10⁻⁶ M A, B, and G in W/AcN with and without the addition of 1% AcOH and 10 mM ammonium acetate were prepared. The liquid flow rate was measured to be ~60 nL/min with the application of 1100 V, which was 100 V higher than the threshold (~1000 V) for the generation of electrospray. Mass spectra were measured as a function of the high voltage (4000 V) pulse width (PW) applied to the solution in the range of 200 ns to 1 ms with and without the application of a BV of ~900 V. The BV is lower than the threshold voltage (~1000 V) for the generation of electrospray. The repetition rate of the pulse is 1 Hz. Mass spectra were obtained by averaging a 20 s measurement. Gas breakdown leading to the corona discharge was never observed with the application of PV of 4000 V up to PW of 1 ms.
Mass spectrometric measurement
The capillary was positioned 3 mm in front of the inlet of an Orbitrap mass spectrometer (Exactive Plus, Thermo Fisher Scientific, Bremen, Germany). Mass spectrometer settings were as follows. The temperature of the ion transfer capillary (i.d. 0.58 mm, length 58.4 mm): 250°C, the S lens radio frequency level: 80, the maximum ion injection time: 100, and the scanning mode of acquisition of the mass spectra with the mass resolution of 35000.
RESULTS AND DISCUSSION
A, B, and G solutions in W/AcN with the addition of 1% AcOH
Figure 2 shows the mass spectra for solutions of A, B, and G in W/AcN (1/1) with the addition of 1% AcOH measured by changing the 4000 V PW with BV = 0 V. At the threshold PW of 150 µs in Fig. 2A, [G + H]+ and [G + H − H + Na]+ were detected. The ion [G + H − H + Na]+ may be abbreviated as [G + Na]+. However, [M + Na]+ evokes that this ion is the associated ion of Na+ with the molecule M, Na+...M. It should be noted that protons attached to the basic sites (e.g., −NH3+ and protonated guanidino group) are unlikely to be replaced by Na+ ions because the proton affinities (PAs) of basic sites are much higher than the Na+ affinities. For example, the gas phase PA and Na+ affinities for NH3 are 204.2 kcal mol−1 3) and 29.1 kcal mol−1,4) respectively, and this trend may also hold for the condensed phase. [M + H − H + Na]+ explicitly indicates that one acidic site of [M + H]+ is deprotonated and forms a salt-like bond with Na+. A detailed discussion of the sodiation of protonated peptides has been made in Refs. 2, 5, 6, and 7.
Fig. 2. Mass spectra for solutions of A, B, and G in W/AcN (1/1) with the addition of 1% AcOH measured by changing the 4000 V pulse widths with BV = 0 V. A, angiotensin II; B, bradykinin; BV, bias voltage; G, gramicidin S; W/AcN, water/acetonitrile.

With an increase in PW to 200 µs in Fig. 2B, doubly protonated G and A and their sodiated forms appeared as major ions due to the enrichment of excess charges for longer PW on the Taylor cone. It should be noted that B ions were barely detected up to a 1 ms PW in Fig. 2D.
At the threshold PW for the ion signal appearance at 150 μs, only [G + H]+ and [G + H − H + Na]+ but no ions of A and B were detected. This indicates that G ions are preferentially enriched on the surface of the Taylor cone. The first appearance of G ions is in marked contrast to the fact that G was totally suppressed in an aqueous solution of A, B, and G in our previous paper.2) It is apparent that the ions [G + H]+ and [G + H − H + Na]+ became most surface-active compared to ions of A and B in the W/AcN solution with the addition of 1% AcOH. Accumulation of surface-active components on the liquid surface decreases the surface tension of the liquid and the components enriched on the surface are preferably detected by ESI. As shown in Fig. 1, the two basic sites of G are ornithine (Orn) amino groups (−NH2), and the positive charge on the protonated −NH3+ is localized in three protic hydrogen atoms. That is, the protonated Orn NH3+ is a strong nucleophilic target in solution. The AcN molecule is the representative aprotic molecule and has a hard basic site, −C≡N. As shown below, the negative charge in the AcN molecule is localized on the nitrogen atom with lone-pair electrons while the positive charge is well delocalized in the counterpart moiety of H3C–C and behaves as a soft acidic site.8)
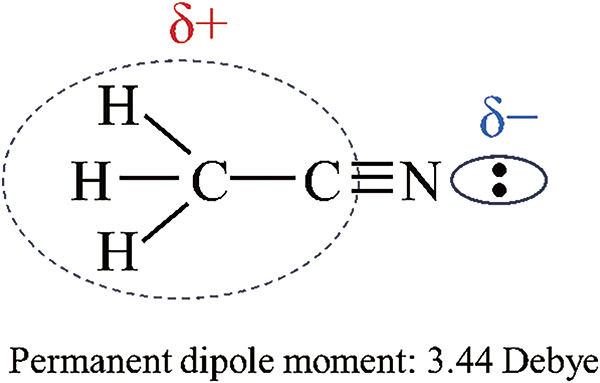
Due to this localized negative charge on the N atom and delocalized positive charge in the H3C−C moiety, the AcN molecule has a large dipole moment of 3.44 Debye. Thus, AcN as a solvent has a strong nucleophilicity and a weak electrophilicity. Due to the high nucleophilicity of AcN, the protonated Orn −NH3+ must be solvated strongly by AcN molecules. Because the positive charge in an AcN molecule is well-dispersed in H3C−C moiety, the Orn NH3+ solvated by AcN molecules will become highly surface active.2) In contrast, the hydrated Orn NH3+ in aqueous solution will be much less surface active compared to ions solvated by AcN because the hydration energy of protonated molecules is much larger than the solvated AcN molecules.8–10) This may explain why the protonated G ions were totally suppressed in an aqueous solution of A, B, and G.2)
In contrast to the high detection efficiency of G in Fig. 2, the ions of B are barely detected even if the PW was increased to 1 ms. This suggests that the ions of B solvated by AcN molecules are least surface-active compared to G and A. As shown in Fig. 1, B is composed of two basic sites of very basic guanidino groups. Due to the high basicity of guanidino groups, the positive charge in protonated guanidino groups is well dispersed and thus they cannot form strong hydrogen bonds with AcN solvent molecules. With small solvation energies by AcN solvents, B ions may become less surface active compared to A and G resulting in the poor detection sensitivity of B in W/AcN solvent.
As shown in Fig. 1, A has three different basic sites, one guanidino, one amino, and one imidazole groups. Considering the pKa values of 12.5 for the protonated guanidino group, ~9 for α-NH3+, and ~6 for protonated imidazole,2) the protonation sites of A should be guanidino and amino groups for [A + 2H]2+. In fact, [A + 3H]3+ was not detected in this work. By the preferable solvation of the amino group of A by the AcN solvent, the ions of A could be detected reasonably strongly as shown in Fig. 2.
Figure 3 shows the mass spectra for solutions of A, B, and G in W/AcN (1/1) with the addition of 1% AcOH measured by changing the 4000 V PW with the application of BV. The BV was adjusted just about 100 V below the start of spontaneous electrospray. By the application of BV, the most surface-active excess charges should be enriched on the liquid surface. By the application of BV = 880 V, the G ions were detected with the shortest PW of 200 ns in this experiment. As shown in Fig. 3A, [G + H − nH + nNa]+ with n = 0, 1 and [G + 2H − nH + nNa]2+ with n = 0−2 but no ions of A and B were detected. It is confirmed that G ions solvated by AcN are the most surface-active among ions of A, B, and G. With an increase in PW to 100 μs, [A + 2H]2+ and [A + 2H − H + Na]2+ started to be observed. However, B ions were barely detected similar to the results shown in Fig. 2.
Fig. 3. Mass spectra for solutions of A, B, and G in W/AcN (1/1) with the addition of 1% AcOH measured by changing the 4000 V pulse widths with the application of BV. A, angiotensin II; B, bradykinin; BV, bias voltage; G, gramicidin S; W/AcN, water/acetonitrile.

Figure 4 shows the mass spectrum measured by the continuous mode of operation. Although the intensity of [G + 2H]2+ (3.73E7) becomes more than one order of magnitude stronger than that (2.45E6) in Fig. 3D with the PW = 1 ms, B ions were barely detected.
Fig. 4. Mass spectrum for a solution of A, B, and G in W/AcN with the addition of 1% AcOH measured by the continuous mode of operation. The high voltage applied to the liquid: 1100 V. A, angiotensin II; B, bradykinin; G, gramicidin S; W/AcN, water/acetonitrile.

A, B, and G solutions in W/AcN with the addition of 10 mM AcONH4
As described in the previous section, the most basic B with two guanidino groups is barely detected in an acidic W/AcN solution. To examine the detection sensitivity for B, a solution of A, B, and G in W/AcN with the addition of AcONH4 was investigated.
Figure 5 shows the free energies of hydration (ΔGhyd) for NH4+, Na+, and H3O+.11) It should be noted that ΔGhyd(NH4+) is smaller than ΔGhyd(H3O+) by 25.2 kcal/mol. This means that NH4+ is much more surface-active than H3O+. This trend may also hold for the mixed solvent W/AcN and the excess charges on the Taylor cone should be much more enriched by NH4+ than H3O+ with the addition of AcONH4. This is a marked contrast to the acidic solution where the excess charges are mainly composed of H3O+. Because B is composed of very basic guanidino groups, the preferable protonation of B by the addition of AcONH4 in W/AcN may be expected compared to the amino group.
Fig. 5. Free energies of hydration (ΔGhyd) for NH4+, Na+, and H3O+.
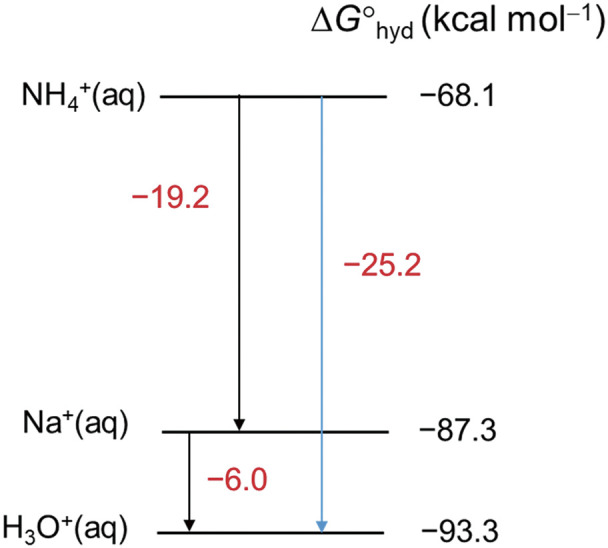
Figure 6 shows the mass spectra for solutions of A, B, and G in W/AcN (1/1) with the addition of 10 mM AcONH4 measured by changing the 4000 V pulse widths with BV = 0 V. In Fig. 6A, [B + 2H − nH + nNa]2+ with n = 0−3 as major ions and [G + H − H + Na]+ as a minor ion were detected at the threshold of ion appearance with a PW of 220 µs. With an increase in PW up to 1 ms, ions B as well as G and A were detected with reasonable ion intensities. This is a marked contrast to mass spectra for the solution with the addition of 1 % AcOH in Fig. 2 where ions A and G were observed but ions B were barely detected. It seems likely that the protonation of B and also preferable solvation of G and A by the AcN solvent balanced for the detection of A, B, and G in 10 mM AcONH4.
Fig. 6. Mass spectra for solutions of A, B, and G in W/AcN (1/1) with the addition of 10 mM AcONH4 measured by changing the 4000 V pulse widths with BV = 0 V. A, angiotensin II; B, bradykinin; BV, bias voltage; G, gramicidin S; W/AcN, water/acetonitrile.

Figure 7 shows the mass spectra for solutions of A, B, and G in W/AcN (1/1) with the addition of 10 mM AcONH4 measured with the application of BV = 900 V. With a PW of 200 ns, [G + H − nH + nNa]+ with n = 0, 1 and [B + 2H − nH + nNa]2+ with n = 0−2, but no ions of A were detected. With a PW of 10 µs, singly protonated ion [G + H − nH + nNa]+ with n = 0, 1 and [B + H]+ were detected in greater abundance than the doubly protonated G and B despite the increase in PW. At PW = 100 µs, background ions at m/z 508.99, 515.01, 591.00, and 673.00 appeared as major ions with a minor [B + 2H]2+. It seems likely that electrospray with a PW of 10 and 100 µs became unstable. With PW = 1 ms, the doubly protonated ions of G, B, and A were detected with the order of G > B > A. Figure 8 shows the continuous-mode mass spectrum measured with an application of high voltage = 1.1 kV. Basically, the same mass spectrum pattern as that shown in Fig. 7D was obtained except that the ion intensity of [G + 2H]2+ in Fig. 8 (5.28E6) is about one order of magnitude stronger than that (5.42E5) in Fig. 7D.
Fig. 7. Mass spectra for solutions of A, B, and G in W/AcN (1/1) with the addition of 10 mM AcONH4 measured by changing the 4000 V pulse widths with BV = 900 V. A, angiotensin II; B, bradykinin; BV, bias voltage; G, gramicidin S; W/AcN, water/acetonitrile.

Fig. 8. Continuous-mode mass spectrum for a solution of A, B, and G in W/AcN (1/1) with the addition of 10 mM AcONH4 measured with an application of high voltage = 1.1 kV. A, angiotensin II; B, bradykinin; G, gramicidin S; W/AcN, water/acetonitrile.

Sodiation of ions for A, B, and G
Metal ions play crucial roles in biological systems. The functioning of many enzymes is metal dependent. Felitsyn et al. detected [M + 11H − nH + nNa]11+ for M = carbonic anhydrase up to n = 12.12) Flick et al. detected [U + 6H − nH + nNa]6+ with n up to 23 for an aqueous solution containing 10 µM ubiquitin (U) and 1.0 mM NaF.13,14) The detection of [U + 6H − 23H + 23Na]6+ suggests that in addition to 12 carboxyl groups, a further 11 less acidic hydrogens were deprotonated and replaced by Na+. Pan et al. pointed out that the relative extent of sodium ion incorporation correlates with protein pI.6) In addition to pI, Juraschek et al.15) noted a trend of increasing sodiation with decreasing charge state of protein ions formed by ESI. In our previous work, positive-mode nanoelectrospray ionization was applied to the analysis of mixed solutions of 10−5 M ubiquitin, cytochrome c, and gramicidin S in H2O/MeOH (50/50).5) The formation of sodiated proteins was interpreted as the specific sodiation of deprotonated carboxyl groups in the amino acid residues.
In our previous work,2) progressive sodiation of the deprotonated acidic sites of peptides such as carboxyl, hydroxyl, imidazole, and amide groups was observed with an increase in pulse width. However, the opposite trend of sodiation was observed in this work, that is, sodiation of doubly-protonated A, B, and G decreased with an increase in PW as shown in Figs. 2−8. The appearance of sodiated peptides at the threshold PW suggests that the surface of the Taylor cone is initially enriched by Na+ ions in the solution with the addition of 1% AcOH and also AcONH4. That is, the solvation energy of Na+ in solutions of W/AcN with the addition of AcOH and also AcONH4 is smaller than that of solvated H3O+ and NH4+, respectively, and impurity-origin Na+ is enriched on the surface of the Taylor cone. This may be due to the strong bond formation for the Na+ sandwiched by two AcN molecules, H3C−C≡N...Na+...N≡C−CH3. With an increase in the PW, the much greater majority of H3O+ in the AcOH solution and NH4+ in the AcONH4 solution may prevail on the Taylor cone, resulting in the suppression of sodiated peptide ions. Unfortunately, this hypothesis is only tentative because the free energies of solvation for Na+, H3O+, and NH4+ in W/AcN solvent are not available. The drastic change in detection sensitivities for three peptides observed in this work indicates that the choice of solvents and additives is very important for the detection of biological samples.
As mentioned above, surface active values of protonated analytes in solution play a crucial role in the detection of analyte ions by ESI. Bull and Breese measured the surface tension of aqueous amino acid solutions and calculated free energies of transfer (ΔF) of the amino acid residues from the solution to the surface.16) Furthermore, Nishikaze and Takayama17) derived hydrophobic indices for angiotensin- and bradykinin-related peptides using ΔF proposed by Bull and Breese. Such a quantitative analysis for the mixed solvents, for example, W/AcN, is highly necessary.
CONCLUSION
In this work, pulsed nano-electrospray ionization of mixtures of angiotensin II (A), bradykinin (B), and gramicidin S (G) in W/AcN with the addition of 1% AcOH and 10 mM AcONH4 was examined. In the solution with the addition of 1% AcOH, G was detected as a major ion but the most basic B was barely detected. This is in marked contrast to the fact that B is readily detected for the mixture of A, B, and G in aqueous solution. These anomalous results were attributed to the difference in the solvent effect between water and acetonitrile, that is, while the amino groups of −NH3+ in G solvated by AcN become surface active, those solvated by water are most solvophobic and become least surface active. The best choice of solvent for the simultaneous detection of A, B, and G was found to be W/AcN with the addition of 10 mM AcONH4. This is because surface active values of protonated A, B, and G samples become close to each other and they can be detected with satisfactory intensities. It should be noted that the solvent system of W/AcN, with the addition of AcONH4, is used in the LC/MS analysis of biological samples. This system is preferred for its ability to enhance analyte ionization, especially in ESI, and is effective in the separation and detection of a wide range of polar and semi-polar compounds, including peptides, metabolites, and pharmaceuticals.
Mass Spectrom (Tokyo) 2024; 13(1): A0157
REFERENCES
- 1).S. Ninomiya, K. Hiraoka. Pulsed nano-electrospray ionization with a high voltage (4000 V) pulse applied to solutions in the range of 200 ns to 1 ms. J. Am. Soc. Mass Spectrom. 31: 693–699, 2020. [DOI] [PubMed] [Google Scholar]
- 2).K. Hiraoka, D. T. Usmanov, S. Ninomiya, S. Rankin-Turner, S. Akashi. Site-specific sodiation of peptides studied by pulsed nanoelectrospray ionization. Int. J. Mass Spectrom. 490: 117073, 2023. [Google Scholar]
- 3).E. P. L. Hunter, S. G. Lias. Evaluated gas phase basicities and proton affinities of molecules: An update. J. Phys. Chem. Ref. Data 27: 413–656, 1998. [Google Scholar]
- 4).R. G. Keesee, A. W. Castleman Jr. Thermochemical data on gas-phase ion-molecule association and clustering reactions. J. Phys. Chem. Ref. Data 15: 1011–1071, 1986. [Google Scholar]
- 5).K. Hiraoka, S. Ninomiya, S. Rankin-Turner, S. Akashi. Comparative study of H3O+ (aq) and NH4+ (aq) on electrophoresis, protonating ability, and sodiation of proteins. Int. J. Mass Spectrom. 471: 116728, 2022. [Google Scholar]
- 6).P. Pan, H. P. Gunawardena, Y. Xia, S. A. McLuckey. Nanoelectrospray ionization of protein mixtures: Solution pH and protein pI. Anal. Chem. 76: 1165–1174, 2004. [DOI] [PubMed] [Google Scholar]
- 7).P. Hu, M. L. Gross. Strong interactions of anionic peptides and alkaline earth metal ions: Metal–ion-bound peptides in the gas phase. J. Am. Chem. Soc. 114: 9153–9160, 1992. [Google Scholar]
- 8).K. Hiraoka, S. Mizuse, S. Yamabe. Solvation of halide ions with H2O and CH3CN in the gas phase. J. Phys. Chem. 92: 3943–3952, 1988. [Google Scholar]
- 9).Y. Marcus. Thermodynamic functions of transfer of single ions from water to nonaqueous and mixed solvents: Part 1—Gibbs free energies of transfer to nonaqueous solvents. Pure Appl. Chem. 55: 977–1021, 1983. [Google Scholar]
- 10).Y. Marcus. Linear solvation energy relationships. A scale describing the “softness” of solvents. J. Phys. Chem. 91: 4422–4428, 1987. [Google Scholar]
- 11).Y. Marcus. Thermodynamics of solvation of ions. Part 5.—Gibbs free energy of hydration at 298.15 K. J. Chem. Soc., Faraday Trans. 87: 2995–2999, 1991. [Google Scholar]
- 12).N. Felitsyn, M. Peschke, P. Kebarle. Origin and number of charges observed on multiply-protonated native proteins produced by ESI. Int. J. Mass Spectrom. 219: 39–62, 2002. [Google Scholar]
- 13).T. G. Flick, S. I. Merenbloom, E. R. Williams. Effects of metal ion adduction on the gas-phase conformations of protein ions. J. Am. Soc. Mass Spectrom. 24: 1654–1662, 2013. [DOI] [PMC free article] [PubMed] [Google Scholar]
- 14).T. G. Flick, S. I. Merenbloom, E. R. Williams. Anion effects on sodium ion and acid molecule adduction to protein ions in electrospray ionization mass spectrometry. J. Am. Soc. Mass Spectrom. 22: 1968–1977, 2011. [DOI] [PMC free article] [PubMed] [Google Scholar]
- 15).R. Juraschek, T. Dülcks, M. Karas. Nanoelectrospray—More than just a minimized-flow electrospray ionization source. J. Am. Soc. Mass Spectrom. 10: 300–308, 1999. [DOI] [PubMed] [Google Scholar]
- 16).H. B. Bull, K. Breese. Surface tension of amino acid solutions: A hydrophobicity scale of the amino acid residues. Arch. Biochem. Biophys. 161: 665–670, 1974. [DOI] [PubMed] [Google Scholar]
- 17).T. Nishikaze, M. Takayama. Study of factors governing negative molecular ion yields of amino acid and peptide in FAB, MALDI and ESI mass spectrometry. Int. J. Mass Spectrom. 268: 47–59, 2007. [Google Scholar]