

Summary
Hypothyroidism is commonly detected in patients with medulloblastoma (MB). However, whether thyroid hormone (TH) contributes to MB pathogenicity remains undetermined. Here, we find that TH plays a critical role in promoting tumor cell differentiation. Reduction in TH levels frees the TH receptor, TRα1, to bind to EZH2 and repress expression of NeuroD1, a transcription factor that drives tumor cell differentiation. Increased TH reverses EZH2-mediated repression of NeuroD1 by abrogating the binding of EZH2 and TRα1, thereby stimulating tumor cell differentiation and reducing MB growth. Importantly, TH-induced differentiation of tumor cells is not restricted by the molecular subgroup of MB, suggesting that TH can be used to broadly treat MB subgroups. These findings establish an unprecedented association between TH signaling and MB pathogenicity, providing solid evidence for TH as a promising modality for MB treatment.
Keywords: medulloblastoma, thyroid hormone, terminal differentiation, EZH2, NeuroD1, TRα1
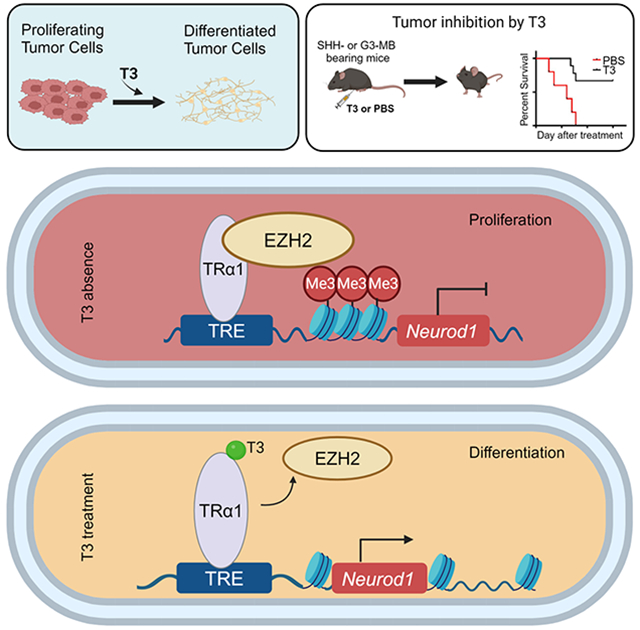
Graphical Abstract
eTOC Blurb
Yang et al. reveal the mechanisms underlying the terminal differentiation of tumor cells in medulloblastoma (MB) and establish an unprecedent connection between thyroid hormone (TH) signaling and MB progression. These studies provide evidence that TH represents a promising approach for MB treatment through promoting tumor cell differentiation.
Introduction
Medulloblastoma (MB), the most prevalent malignant brain tumor among children, comprises at least four molecular subgroups: Wingless (WNT), Sonic Hedgehog (SHH), Group 3 (G3) and Group 4 (G4). Each subgroup exhibits unique clinical and genetic characteristics 1,2. Despite comprehensive multimodal therapy, a significant proportion of patients continues to succumb to this disease, and survivors often suffer enduring treatment-related side effects including endocrine disorders and cognitive deficits 3,4. Consequently, there exists a pressing need for more effective and less toxic approaches to treat MB.
Previous studies have illuminated a key aspect of MB biology: MB tumor cells can undergo terminal differentiation, a process marked by an irreversible exit from the cell cycle and the loss of tumorigenic potential 4-6. This suggests that inducing terminal differentiation in MB tumor cells may offer a viable therapeutic strategy. However, to harness this potential, it is imperative to fully understand the molecular mechanisms governing tumor cell differentiation in MB.
Thyroid hormone (TH) is indispensable for fetal and postnatal brain development, in particular, cerebellar development 7-10. The major circulating form of TH is thyroxine (T4), which, after de-iodination, transforms into its active counterpart, 3,5,3’-triiodo-L-thyronine, or T3. T3 is primarily responsible for mediating TH’s critical intracellular effects on the transcription of target genes, via interactions between T3 and its nuclear thyroid hormone receptors (TRs) 11. In the brain, thyroid receptor α1 (TRα1) predominates and serves as a transcription factor for regulating the transcription of TH target genes, including Krueppel-like factor 9 (Klf9) and hairless (Hr) 12. Patients with MB commonly exhibit hypothyroidism (reduced plasma levels of TH), which is classically considered a treatment-related complication 13,14. A possible role of TH, or hypothyroidism, in MB pathogenicity has never been investigated.
In this study, we discovered that TH induces terminal differentiation through upregulating the expression of NeuroD1 in tumor cells. TH, in the form of T3, promotes differentiation and inhibits proliferation of tumor cells from various MB subgroups, including SHH- an G3-MB. Together, our results elucidate the mechanisms governing terminal differentiation of MB tumor cells and established an unprecedented link between TH signaling and MB progression. Our findings offer compelling evidence for T3 as a promising therapeutic modality to promote tumor cell differentiation and suppress MB progression.
Results
T3 induces the terminal differentiation of SHH-MB tumor cells
To evaluate a potential role of TH in promoting the terminal differentiation of MB tumor cells, we isolated tumor cells from mice (Math1-Cre/Ptch1loxp/loxp mice) with conditional deletion of Patched 1 (Ptch1), an established model for SHH-MB 15,16, and treated tumor cells with T3 at different concentrations. Even at the lowest concentration tested (25nM), T3 significantly induced tumor cell differentiation, evidenced by less tumor cell proliferation (EdU labeling), and increased expression of differentiation markers including microtubule-associated protein 2 (MAP2) (Figure 1A), NeuN (Figure 1B) and βIII-tubulin (Figures S1A-B, related to Figure 1A-B). This induction of MB cell differentiation and inhibition of proliferation by T3 was dose-dependent (Figure 1C). No increase in apoptosis (expression of cleaved caspse-3, CC3+) was observed in T3-treated tumor cells (data not shown). These data suggest that T3 treatment suppresses tumor cell proliferation and promotes tumor cell differentiation.
Figure 1. T3 induces terminal differentiation of SHH MB tumor cells.

(A) Representative images of MB tumor cells after immunostaining for MAP2 and EdU labelling, following 48 hrs treatment with PBS or T3 (at designated concentrations, A).
(B) Western blot of NeuN protein in MB tumor cells after treatment with T3 or PBS (Con) for 48 hrs.
(C) The percentage of MAP2+ cells and EdU+ cells in the culture was quantified.
(D) Dose-response curve of T3 in MB tumor cells, measured by CCK8 assay. Data are represented as mean +/− SEM (n = 3).
(E) Survival curves of CB17/SCID mice (n=11) after transplantation with T3-treated tumor cells or PBS-treated tumor cells.
(F) mRNA and protein expression of NeuroD1 in MB tumor cells treated with PBS (Con) or T3, examined by Q-PCR and western blotting, respectively. Scale bar: 50μm (A).
Data are represented as mean +/− SEM. ***, p< 0.001.
Also see Figures S1A-B
The in vitro growth of tumor cells was effectively inhibited by T3 treatment (Figure 1D). Importantly, upon intracranial transplantation, T3-treated tumor cells failed to develop into tumors in recipient mice (n=11), although untreated cells generated tumors in 6 of 11 recipient mice (Figure 1E). These combined data indicate that T3 induces terminal differentiation of MB tumor cells and reduces their proliferative capacity and tumorigenic potential.
Previous studies demonstrate that NeuroD1 induces the differentiation of MB tumor cells6,17. We confirmed that T3 treatment elevated expression levels of NeuroD1 mRNA and protein in MB tumor cells compared with controls using qPCR and western blot analysis, respectively (Figure 1F).
Tumor cell differentiation and NeuroD1 transcription are directly repressed by TRα1
To investigate the mechanism underlying T3-induced tumor cell differentiation, we treated tumor cells with 1-850, a specific antagonist of TH receptors that interferes with the interaction between T3 and its receptors 18. As shown in Figure 2A-B, the T3-induced expression of the differentiation markers MAP2 and NeuN was significantly reduced in tumor cells treated with both T3 and 1-850. These findings suggest that 1-850 effectively blocked T3-induced differentiation of tumor cells. Additionally, the T3-induced repression of tumor cell proliferation was also counteracted by 1-850 (Figure 2C). These data collectively indicate that the interaction between T3 and its receptor is essential for T3-induced differentiation of MB tumor cells.
Figure 2. TRα1 mediates T3-induced differentiation of tumor cells.

(A) Tumor cells from SHH-MB mice (Math1-Cre/Ptch1loxp/loxp) were treated with TH receptor-specific antagonist 1-850 or PBS (Con) in the presence/absence of 200nM T3, for 48 hrs. After being pulsed with EdU for 2 hrs, tumor cells were harvested to examine differentiation (MAP2+) and proliferation (EdU+) by immunocytochemistry.
(B) Western blot of NeuN protein in tumor cells after treatment with 1-850 or PBS (Con) in the presence/absence of 200nM T3, for 48 hrs.
(C) Percentages of EdU+ cells in tumor cells based on immunocytochemistry in A.
(D) Western blot of TRα1 protein in tumor cells from Math1-Cre/Ptch1loxp/loxp mice, after treatment with T3 (200nM) or PBS (Con) for 48 hrs. GAPDH was used as a loading control.
(E) Western blot of TRα1 protein in tumor cells from CAG-Cas9/Math1-Cre/Ptch1loxp/loxp mice, after being virally infected with an sgRNA specific for Thra, or an empty RNA as a control.
(F-H) Immunohistochemistry of tumor cells infected with Thra sgRNA or an empty RNA and treated with T3 or PBS (Con) for 48 hrs and pulsed with EdU for 2 hrs, before being harvested to examine proliferation (EdU+) and differentiation (MAP2+) (F). Percentages of EdU+ cells or MAP2+ cells (G). Western blot using anti-TRα1, anti-NeuN, anti-NeuroD1 and anti-GAPDH antibodies in tumor cells after Thra knockout and treatment with T3 or PBS (H).
(I) A schematic showing the distance of established regulatory regions of NeuroD1 gene from the transcription start site (TSS).
(J) ChIP-PCR results showing the enrichment of TRα1 in the NeuroD1 regulatory regions using an antibody against TRα1 or IgG control antibody.
(K) A schematic showing the repressing role of TRα1 (possibly by binding with EZH2) on the proliferation and NeuroD1 transcription in tumor cells. Scale bar: 50μm (A and F).
Data are represented as mean +/− SEM. ***, p< 0.001; ns, not significant.
Also see Figures S2A-C
The predominant TH receptor in the brain is TRα1, which is a nuclear receptor and functions as a transcription factor that mediates TH signaling by regulating the transcription of target genes 19,20. It is encoded by the thyroid hormone receptor alpha (Thra) gene. As anticipated, TRα1 is expressed by MB tumor cells and its expression level was not altered by T3 treatment (Figure 2D). To determine whether T3-induced differentiation requires the T3 receptor TRα1, we knocked out Thra (encoding TRα1) in tumor cells from CAG-Cas9/Math1-Cre/Ptch1loxp/loxp mice. Cells from these mice universally express CRISPR-associated protein 9 (Cas9) 21; knockout was achieved by viral transduction with small guide RNAs (sgRNAs) specific for Thra or an empty vector as control (Figure 2E). Surprisingly, deletion of Thra induced tumor cell differentiation and decreased proliferation, as shown by a reduction of EdU+ and increase of MAP2+ cells, respectively; the effects of Thra deletion were not further impacted by T3 treatment (Figure 2F-G). Similar results were observed after Thra knockdown by shRNA (Figures S2A-C, related to Figures 2D-G). These results suggest that MB tumor cell differentiation is intrinsically repressed by TRα1. Knockout or knockdown of Thra led to an upregulation of NeuroD1 and NeuN in tumor cells, which was not further increased by T3 treatment (Figure 2H and Figure S2A, related to Figure 2H). These data suggest that unliganded TRα1 normally inhibits NeuroD1 expression in tumor cells. We further examined the possible enrichment of TRα1 in established regulatory regions (Figure 2I) of NeuroD1 in tumor cells 22,23. Using ChIP-PCR, we confirmed the binding of TRα1 with the regulatory regions of NeuroD1 in tumor cells (Figure 2J). These results suggest NeuroD1 as a target gene of TRα1 and endogenous TRα1 can directly repress NeuroD1 transcription in MB tumor cells (Figure 2K).
T3 interferes with the physical interaction between TRα1 and EZH2
We previously reported that NeuroD1 expression in MB tumor cells is repressed by EZH2-mediated histone 3 lysine 27 trimethylation (H3K27me3) 6. Therefore, we examined whether TRα1-suppressed NeuroD1 transcription in tumor cells involves EZH2 and H3K27me3. Comparable levels of EZH2 and H3K27me3 protein were found in tumor cells after T3 or PBS treatment (Figure 3A), suggesting that T3 treatment did not alter the global levels of EZH2 and H3K27me3. However, T3 treatment reduced the enrichment of EZH2 on most of the NeuroD1 promoter regions (except the one located 1.4kb downstream of the transcription start site of NeuroD1) (Figure 3B) in tumor cells compared to the control. These data indicate that T3 treatment reduces the binding of EZH2 to the promoter regions of NeuroD1. As a negative control, T3 treatment did not alter the enrichment of EZH2 on the promoter regions of Cdkn2a and Dio3 in tumor cells (Figure 3C), which are established EZH2-enriched regions 24,25. Consistently, T3 repressed the enrichment of H3K27m3 in the promoter regions of NeuroD1 (Figure 3D). These results suggest that T3 regulates NeuroD1 expression by locally interfering with EZH2 enrichment.
Figure 3. T3 impairs the physical interaction between TRα1 and EZH2, allowing transcription of NeuroD1.

(A) Western blot of EZH2 and H3K27me3 in tumor cells after treatment with T3 or PBS (Con).
(B and D) ChIP-PCR showing effects of T3 or PBS (Con) on EZH2 enrichment in NeuroD1 promoter regions (B), EZH2 enrichment in promoter regions of established EZH2-enriched genes Cdkn2a gene and Dio3 (C), and H3K27me3 enrichment in NeuroD1 promoter regions (D) in tumor cells.
(E and F) Co-immunoprecipitation of TRα1 and EZH2 in tumor cells treated with T3 or PBS (Con), using an antibody against TRα1 (E) or EZH2 (F).
(G) Pull-down assay of TRα1 and EZH2. TRα1 was used to pull down EZH2. T3 was titrated into the mixture at 3.5 μM or 14 μM. Antibodies against TRα1 or EZH2 were used to detect TRα1 or EZH2, respectively.
(H) Co-immunoprecipitation of TRα1 and EZH2 in tumor cells transduced with Flag-tagged wild type TRα1 or TRα1PV (dominant negative, lacking T3-interaction domain), using an antibody against Flag.
(I) Western blot of NeuroD1 in tumor cells transduced with wild type TRα1 or TRα1 PV.
(J-L) Tumor cells were treated with PBS, GSK126 (1μM) or UNC1999 (1μM) in the absence or presence of T3 (200nM) for 48 hrs before being collected to examine EZH2(J), H3K27m3(J), NeuroD1 and NeuN proteins (K) by western blotting. Tumor cell proliferation and differentiation were examined by immunocytochemistry (L). Percentage of proliferative tumor cells (EdU+) and differentiated tumor cells (MAP2+) is shown at the right panel in L.
(M) PCA of PBS-treated, T3-treated and EZh2 inhibitor (EZHi, GSK126)-treated tumor cells based on their transcriptomes.
(N-P) Heat-maps showing expression levels of TH pathway target genes(N), Hh pathway target genes(O) and neuronal differentiation associated genes (P).
(Q) Schematic showing that T3 induces EZH2 expression and promotes terminal differentiation in MB tumor cells by compromising the interaction between TRα1 and EZH2. Scale bar: 50μm (L).
Data are represented as mean +/− SEM. *, p< 0.05; **, p< 0.01; ***, p< 0.001; ns, not significant.
Also see Figures S3A-B
Previous studies have shown that thyroid hormone receptors (such as TRα1) regulate the expression of their target genes by interacting with cofactors such as nuclear corepressor-126 and histone deacetylases 27. We then tested for a physical association between EZH2 and TRα1 in tumor cells by co-immunoprecipitation. Indeed, TRα1 immunoprecipitated EZH2 in MB tumor cells (Figure 3E-F). Moreover, the association between TRα1 and EZH2 was significantly reduced by T3 treatment (Figure 3E-F), indicating that T3 disrupts the interaction between TRα1 and EZH2. To further examine the direct interaction between TRα1 and EZH2, we conducted a competitive pulldown assay using recombinant TRα1 and EZH2 proteins. As shown in Figure 3G, TRα1 efficiently pulled down EZH2 in vitro, demonstrating a direct interaction between the two proteins. Additionally, the presence of T3 significantly reduced the interaction between TRα1 and EZH2. These data confirm that TRα1 and EZH2 interact directly, and that this interaction is compromised by T3.
Previous studies have revealed that ligand binding to thyroid hormone receptors (TRs) induces significant conformational changes, affecting their interactions with co-activators or co-repressors 28,29. To further understand the molecular details of the interaction between TRα1 and EZH2, we used AlphaFold2 and AlphaFold3 to predict the protein-protein complexes between these two binding partners. The most likely complexes involved a region in the N-terminal of TRα1 (residues 21-40) interacting with the CXC-SET domains (residues 491-746) of EZH2 (Figure S3A-B, related to Figure 3H-I). This prediction aligns with other homologous SET domains in the Protein Data Bank (PDB) that bind peptides in a similar fashion (e.g., 7ATB). These findings suggest that TRα1 interacts with T3 and EZH2 through two separate domains. To further validate that T3 treatment disturbs the interaction between TRα1 and EZH2, we transduced MB tumor cells with wild type (WT) TRα1 or a dominant negative form of TRα1 (TRα1PV), which lacks the domain for interacting with T3 30. Note that both WT TRα1 and TRα1PV could be immunoprecipitated with EZH2 (Figure 3H), indicating that deletion of the T3 interaction domain from TRα1 did not hinder the ability of TRα1 to interact with EZH2. As anticipated, T3 treatment repressed the interaction of EZH2 with WT TRα1, but not with TRα1PV (Figure 3H), suggesting that T3 needs to bind with TRα1 in order to interfere with the interaction between TRα1 and EZH2. Moreover, in the absence of the TRα1 T3-interaction domain, T3 failed to upregulate NeuroD1 protein expression (Figure 3I), further confirming that T3 induces NeuroD1 expression by binding with TRα1.
EZH2i phenocopies T3 treatment in inducing tumor cell differentiation
We previously demonstrated that inhibition of EZH2 can facilitate the differentiation of MB tumor cells6. To investigate whether EZH2 inhibition elicits similar effects to T3 treatment in promoting tumor cell differentiation, we treated tumor cells with EZH2 inhibitors (EZH2i), specifically GSK126 and UNC1999, either alone or in combination with T3, or with PBS as a control. Upon treatment with GSK126 or UNC1999, we observed no significant alterations in EZH2 protein levels within the tumor cells. However, the expected reduction in H3K27me3 levels, indicative of EZH2 inhibition, was evident following treatment with either GSK126 or UNC1999 (Figure 3J). As shown in Figure 3K-L, GSK126 and UNC1999 significantly enhanced NeuroD1 expression in tumor cells and induced the expression of differentiation markers NeuN and MAP2. These results suggest that EZH2i promotes tumor cell differentiation, phenocopying the T3 treatment. Moreover, T3 treatment failed to further increase NeuroD1 expression or differentiation in GSK126 or UNC1999-treated tumor cells. These data support the notion that T3 induces NeuroD1 expression and differentiation in tumor cells through inhibition of EZH2-mediated H3K27me3.
We next assessed the transcriptomes of tumor cells after treatment with the EZH2 inhibitor GSK126, T3, or PBS by RNA sequencing. Principal component analysis (PCA) revealed that the transcriptomes of tumor cells treated with EZH2i closely resemble those treated with T3, indicating similar transcriptional profiles in tumor cells following either EZH2i or T3 treatment (Figure 3M). KEGG pathway analysis showed that genes involved in the TH signaling pathway, including Klf9 and Hr, were significantly upregulated in T3-treated tumor cells compared to those treated with PBS (Figure 3N). However, genes associated with the Hh pathway, such as Gli1 and Gli2, were generally downregulated in tumor cells following EZH2i or T3 treatment compared to PBS treatment, indicating repression of Hh signaling (Figure 3O). Additionally, genes linked to neuronal differentiation pathways were upregulated in both EZH2i- and T3-treated tumor cells compared to PBS-treated cells (Figure 3P). These findings further confirm that MB tumor cells undergo differentiation after treatment with either EZH2i or T3.
Together, the above findings demonstrate that T3 induces NeuroD1 expression and promotes terminal differentiation in MB tumor cells by compromising EZH2-mediated H3K2me3 (Figure 3Q).
T3 treatment represses the in vivo growth of murine SHH-MB
We next asked whether TH can inhibit the growth of murine SHH-MB, derived from deletion of Ptch1 or constitutive activation of Smoothened (Smo). We first treated Math1-Cre/Ptch1loxp/loxp mice with T3 (200ng/g) or PBS as a control (Figure 4A). In control-treated mice, tumor volume progressively increased over 4 weeks during the treatment. However, in T3-treated mice, no significant increase in tumor volume was observed, indicating that T3 inhibited tumor progression in vivo (Figures 4B-C). Consistent with our in vitro data, immunohistochemistry revealed that T3 treatment in vivo significantly repressed tumor cell proliferation (Ki67 expression), and enhanced tumor cell differentiation (expressions of MAP2, NeuN and NeuroD1) (Figure 4D). Based on the expression of cleaved caspase-3 (CC3), no increase in tumor cell apoptosis was detected after treatment with T3 (Figure S4, related to Figure 4D). Importantly, T3 treatment significantly prolonged survival of Math1-Cre/Ptch1loxp/loxp mice, compared to control (median survival: T3 treatment, undefined vs PBS treatment, 24 ds, p<0.01) (Figure 4E). No obvious reduction in body weight was observed after T3 treatment, compared with PBS treatment (Figure S5A, related to Figure 4E). Consistently, T3 substantially improved the tumor symptoms such as hydrocephalus and ataxia, compared with controls (Videos S1 and S2, related to Figure 4E). These data suggest that T3 treatment in vivo induces extensive differentiation of tumor cells and significantly inhibits tumor progression of murine Ptch1-deficient SHH-MB.
Figure 4. T3 inhibits in vivo growth of murine SHH-MB.

(A-C) A schematic showing the strategy of T3 treatment (A). Representative MRI images of brains from the same Math1-Cre/Ptch1loxp/loxp mice before and after treatment with T3 or PBS (Con) for 2 weeks and 4 weeks (B). Yellow dots indicate tumor area. Tumor volumes are quantified based on MRI images (C).
(D) Immunohistochemistry of tumor tissues from Math1-Cre/Ptch1loxp/loxp mice after the T3 or PBS treatment.
(E) Survival of Math-Cre/Ptch1loxp/loxp mice after treatment with T3 or PBS.
(F and G) Representative immunofluorescence images of tumor cells from Math1-Cre/LSL-SmoM2 mice after treatment with PBS, T3, or vismodegib (F). The percentage of EdU+ cells and MAP2+ cells in the culture (G).
(H and I) NeuroD1 and NeuN proteins (H), and mRNA expression of Hh target genes (I) in tumor cells after treatment with PBS, T3, or vismodegib, examined by western blotting and Q-PCR, respectively.
(J) Representative immunohistochemistry images of tumor tissues from Math1-Cre/LSL-SmoM2 mice after treatment with T3 or PBS (Con).
(K and L) Survival (K) and body weight (L) of Math-Cre/LSL-SmoM2 mice after treatment with T3 or PBS. Scale bars: 2mm (B); 100μm (D and J); 50μm (F). Data are represented as mean +/− SEM. *, p< 05; ***, p< 0.001; ns, not significant.
Also see Figures S4 and S5A; Videos S1-S5
We next tested whether T3 produces similar effects in SHH-MB tumor cells derived from constitutive activation of Smo using Math1-Cre/LSL-SmoM2 mice 15,16. First, we asked whether T3 suppressed proliferation and induced differentiation in these cells in vitro. Indeed, T3 significantly suppressed proliferation and stimulated tumor cell differentiation (Figure 4F-G). As expected, constitutive activation of SmoM2 renders tumor cells resistant to killing by vismodegib, an FDA-approved Smo antagonist 31,32, and vismodegib failed to cause significant changes in tumor cell proliferation or differentiation (Figure 4F-G). As in Ptch1-deficient tumor cells, T3 treatment increased expression of NeuroD1 and NeuN in SmoM2 tumor cells (Figure 4H). Expression levels of Gli1, Gli2 or Ptch2 mRNAs were significantly reduced by T3 but not by vismodegib, compared with control (Figure 4I), suggesting that T3 treatment inactivated the Hh pathway. In vivo, T3 treatment significantly repressed tumor cell proliferation and increased tumor cell differentiation in Math1-Cre/LSL-SmoM2 mice (as in Math1-Cre/Ptch1loxp/loxp mice, Figure 4E) (Figure 4J). No increase in apoptosis was observed in tumor tissues following T3 treatment, compared with PBS (Figure S4, related to Figure 4J). T3 significantly prolonged the survival of Math1-Cre/LSL-SmoM2 mice, compared with PBS (median survival: T3 treatment, undefined vs PBS treatment, 8 days; p<0.001) (Figure 4K). As expected, vismodegib did not prolong survival (Figure 4K). The body weight of Math1-Cre/LSL-SmoM2 mice steadily increased during T3 treatment (Figure 4L). Even with just 2 weeks of treatment with T3, brain tumor symptoms in Math1-Cre/LSL-SmoM2 mice were markedly alleviated compared with PBS or vismodegib (Videos S3-S5, related to Figure 4K). The above results demonstrate that T3 confers significant tumor inhibitory effects in murine SHH-MB regardless of the driver mutation (Ptch1 deletion or constitutive Smo activation).
T3 represses human SHH-MB progression in vitro and in vivo
We next examined the therapeutic effects of T3 in human SHH-MB tumor cells (ICb-5610MB cells, with inactivating mutations in the Ptch1 gene) 33 and patient-derived orthotopic xenograft (PDOX) models. First, tumor cells were treated with T3, PBS, or cisplatin, a potent DNA damaging agent currently used in MB treatment 34 as an additional control. As in the mouse MB cells, T3 treatment of human MB cells significantly decreased the percentage of proliferating cells (EdU+) and increased the number of differentiated cells (MAP2+) (Figure 5A, left and center). More importantly, the number of apoptotic cells after T3 treatment was comparable with PBS treatment, indicating that T3 does not compromise the survival of MB tumor cells (Figure 5A, right). Cisplatin also inhibited tumor cell proliferation, but this did not involve the induction of tumor cell differentiation; as expected, cisplatin caused extensive tumor cell apoptosis (Figure 5A). As was the case in mouse MB tumor cells, in human tumor cells T3 treatment significantly upregulated NeuroD1 mRNA expression, compared with control or cisplatin treatment (Figure 5B). These combined data indicate that T3 suppresses tumor cell proliferation, induces cell differentiation, and upregulates NeuroD1 in human SHH-MB tumor cells. In addition, in human cells T3 inhibits the Hh pathways as Gli1 mRNA expression significantly declined after T3 treatment (Figure 5C). Cisplatin reduced expression of both NeuroD1 and Gli1 mRNAs, presumably due to the induced apoptosis (Figure 5B-C).
Figure 5. T3 represses the progression of human SHH-MB due to Ptch1 or Smo drivers.

(A) Representative immunofluorescence images of tumor cells from human SHH-MB tumor cells after treatment with PBS, T3(0.1μM and 0.2μM) or cisplatin (1μM) for 48hrs. The percentage of proliferative cells (EdU+), differentiated cells (MAP2+) or apoptotic cells (CC3+) in human SHH-MB cells, based on the immunofluorescence of EdU, MAP2, or CC3 at the right panel in A.
(B and C) Q-PCR showing the mRNA expression of NeuroD1 (B) and Gli1 (C) in human SHH-MB cells after treatment with PBS, T3 or cisplatin.
(D-F) Heat-maps showing expression levels of TH pathway target genes (D), Hh pathway target genes (E) and neuronal differentiation associated genes (F) in human SHH-MB tumor cells after treatment with PBS or T3, based on their transcriptomes.
(G) Luminescence images of PDOX-bearing mice bearing SHH-MB cells, after treatment with PBS or T3 from day 0 (D0) to day 21 (D21).
(H) Quantification of brain luminescence intensity in G.
(I) Survival curves of PDOX-bearing mice after treatment with PBS or T3.
(J) Representative immunofluorescence images of frozen tissue sections from PDOX-bearing mice after control or T3 treatment (left panel); DAPI was used to counterstain cell nuclei at the left panel. Immunohistochemistry images of paraffin-embedded tumor tissues for MAP2 and NeuroD1 expression at the right panel.
Scale bars: 50μm (A); 100μm (J). Data are represented as mean +/− SEM. *, p< 0.05; **, p< 0.01; ***, p< 0.001; ns, not significant.
Also see Figures S4, S5B and S6A-J
We next examined transcriptional changes in human SHH-MB tumor cells after treatment with T3 (0.2 μM) or PBS by RNA sequencing. KEGG analysis of the transcriptomes revealed that the TH signaling pathway was upregulated in tumor cells following T3 treatment (Figure 5D), as expected. Similar to that observed in murine tumor cells, genes associated with the Hh pathway were significantly downregulated in human tumor cells after T3 treatment (Figure 5E). Importantly, expression levels of genes linked to neuronal differentiation (the same geneset as in Figure 3P) were overall elevated in tumor cells following T3 treatment compared to PBS treatment (Figure 5F). These results confirm that T3 treatment induces the differentiation of human SHH-MB tumor cells.
We then assessed the effects of T3 on tumor growth in PDOX mouse models. Human ICb-5610MB cells transduced with a luciferase expressing construct were transplanted into the cerebella of CB17/SCID mice. After tumors were established, mice were daily treated with PBS (control) or T3 (200ng/g) by I.P. injection. After 3 weeks of treatment, tumor progression in the T3-treated mice was significantly inhibited compared with controls (Figure 5G). Quantification of luciferase levels in the brain showed that tumors progressively increased in control-treated mice, but the rate of increase was significantly reduced by T3 treatment (Figure 5H). T3 treatment also significantly improved survival of recipient mice (median survival: T3 treatment, undefined vs PBS treatment, 19 days; p<0.01. Figure 5I). Consistent with our observations in murine tumor tissue, T3 treatment inhibited tumor cell proliferation and promoted tumor cell differentiation in PDOXs of SHH-MB (Figure 5J). No increase in apoptosis was observed following T3 treatment, compared with PBS (Figure S4, related to Figure 5J). Moreover, body weight was comparable following T3 or control treatment (Figure S5B, related to Figure 5I), suggesting that T3 treatment did not produce obvious toxicities in PDOX SHH-MB mice. Tumor inhibitory effect of T3 was also confirmed in PDOXs generated using another two human SHH-MB lines: Med1712 35 (with Ptch1 mutations) and SJNBT12 cells 36 (with N-myc amplification and P53 mutations) (Figures S6A-J, related to Figures 5G-I). These data demonstrate that T3 potently induces tumor cell differentiation and inhibits the growth of human SHH-MB in mice.
T3 inhibits the progression of Group 3 MB
Group 3 (G3) is the most aggressive form of human MB. We next examined whether T3 induces differentiation of tumor cells from G3-MB, asked whether increased expression of NeuroD1 by T3 is a key mechanism, and tested the efficacy of T3 treatment in G3-MB PDOXs. First, we treated RCMB20 or RCMB28 cells, two established PDOX lines of human G3-MB with MYC amplification 35, with T3 or PBS (Figures 6A-B). T3 significantly reduced the proliferation of both RCMB28 and RCMB20 cells and significantly enhanced differentiation, compared with controls (Figure 6A-D). As in SHH-MB tumor cells, no increase in apoptosis was observed in G3-MB tumor cells after T3 treatment, compared with control (data not shown). The inhibitory effect of T3 on the proliferation of RCMB28 cells was confirmed by tumoroid forming assays (Figures S7A-B, related to Figure 6B). Additionally, we conducted RNA sequencing to examine the transcriptomes of G3-tumor cells (RCMB20 cells) after T3 or PBS treatment. KEGG analyses of the transcriptomes revealed that the TH signaling pathway was significantly upregulated in tumor cells following T3 treatment (Figure 6E). MYC pathway target genes were downregulated in T3-treated tumor cells compared to PBS-treated cells (Figure 6F), indicating that T3 treatment represses the MYC pathway in these cells. Moreover, similar to our observations in murine and human SHH-MB tumor cells, T3 treatment significantly upregulated the expression of genes associated with neuronal differentiation (Figure 6G). These transcriptomic data confirm that T3 treatment promotes the differentiation of G3-MB tumor cells.
Figure 6. T3 inhibits the pathogenicity of human G3-MB.

(A-D) Representative immunofluorescence images of RCMB20 (A) and RCMB28 cells (B) after treatment with T3 or PBS (Con). Percentages of EdU+ cells and MAP2+ cells in the culture of RCMB20 (the right panel in A); and RCMB28 cells (the right panel in B). C-D, Western blot of NeuroD1 and NeuN expression in RCMB20 cells (C) and RCMB28 cells (D), after T3 treatment for 48 hrs.
(E-G) Heat-maps showing expression levels of TH pathway target genes (E), MYC pathway target genes (F) and neuronal differentiation associated genes (G) from human RCMB28 cells after treatment with PBS or T3, based on their transcriptomes.
(H and I) Percentage of MAP2+ cells in RCMB28 cells after transduction of GFP or NeuroD1-GFP (H). Western blot of NeuroD1 protein in RCMB28 cells after transduction of GFP or NeuroD1-GFP (I).
(J) Co-immunoprecipitation of EZH2 and TRα1 in RCMB28 cells after PBS or T3 treatment, using an antibody against TRα1.
(K-M) Luminescence images of PDOX mice bearing RCMB28 cells (K), brain luminescence intensity (L) and survival (M) of PDX mice after PBS or T3 treatment.
(N) Western blot of NeuroD1 protein in tumor tissues from four mice shown in panel K (#1—#4), after PBS or T3 treatment.
(O) Representative immunohistochemistry image of Ki67 and MAP2 in frozen sections from G3-MB bearing mice after PBS or T3 treatment. Note that arrows indicate tumor tissues in. DAPI was used to counterstain cell nuclei.
Scale bars: 50μm (A and B); 100μm (O). Data are represented as mean +/− SEM. ***, p< 0.001.
Also see Figures S6K-O and S7A-B; Table S1
Second, we tested the mechanism underlying the T3-induced differentiation in G3-MB tumor cells. We transduced RCMB28 cells with an expression vector carrying either NeuroD1-GFP or GFP alone as a control. Forced expression of NeuroD1 significantly promoted tumor cell differentiation, as evidenced by increased numbers of MAP2+ cells and NeuroD1 expression in NeuroD1-transduced cells compared with control cells (Figure 6H-I), suggesting that the enhanced expression of NeuroD1 by T3 does drive differentiation of G3-MB tumor cells. In G3-MB cells, as in SHH-MB cells, intrinsic TRα1 interacts with EZH2, and this interaction was impaired by T3 treatment (Figure 6J). These data suggest that T3 induced NeuroD1 expression in G3-MB tumor cells, by a mechanism similar as in SHH-MB tumor cells.
Finally, we generated G3-MB PDOXs by intracranial transplantation of RCMB28 cells transduced with a luciferase expressing construct. After tumors were established (~ 21 days), mice were treated with T3 or PBS by I.P. injection. T3 treatment significantly slowed tumor progression (Figure 6K) and reduced the luciferase levels in mouse brains compared with PBS (Figure 6L). Importantly, T3 significantly prolonged survival of recipient mice (median survival: T3 treatment, undefined vs PBS treatment, 15 days; p<0.01. Figure 6M). As in the human SHH-MB PDOX model, T3 increased the amount of NeuroD1 protein in PDOX tissues (Figure 6N), suggesting that T3 treatment induces NeuroD1 expression in G3-MB tumor cells. As in SHH-MB, T3 repressed proliferation and enhanced differentiation of tumor cells in tumor tissue (Figure 6O). In addition, T3 treatment significantly inhibited tumor growth in PDOXs generated by using RCMB20 cells (Figures S6K-O, related to Figure 6M). These results demonstrate that T3 treatment induces the differentiation of human G3-MB tumor cells and inhibits G3-MB growth in a PDOX model. Moreover, T3 treatment significantly reduced metastasis in PDOX models compared with PBS treatment (Table S1, related to Figure 6M). Our findings that T3 promoted tumor cell differentiation and suppressed tumor growth in both SHH-MB and G3-MB, indicate that the tumor inhibitory effects of T3 are not restricted by oncogenic mutations in MB tumor cells.
T3 treatment causes no toxicities in mice
Having observed the promising effects of T3 in inhibiting MB growth, we next examined possible toxicities of T3 in mice. The recommended dosage of T3 for patients is 75-100μg/day 37. Converting this to mice (based on body surface area) 38, the equivalent dose is 10-20ng/g/day. We therefore treated Math1-Cre/Ptch1loxp/loxp mice with 4 different doses of T3 (2ng/g, 20ng/g, 200ng/g and 2μg/g-body weight) or PBS, by I.P. injection daily (Figure 7A) for 3 weeks. No mice died during the 3-week treatment. T3 levels in brain increased in a dose-dependent manner, confirming that I.P. injection represents an effective approach to deliver T3 to the brain (Figure 7B). Note that by the end of 3-week T3 treatment, plasma levels of free T3 did not differ significantly between T3 and PBS-treated mice (except 2μg/g) (Figure 7C), possibly due to the intricate TH homeostatic mechanisms that have evolved to regulate systemic T3 levels 39,40.
Figure 7. T3 does not cause toxicity in MB-bearing mice.

(A) Schematic for T3/PBS toxicity study in Math1-Cre/Ptch1loxp/loxp mice, n=3 per condition.
(B and C) T3 levels in the tumor tissue (B) and plasma (C) in mice after T3 or PBS (Con) treatment for 3 weeks.
(D and F) Measures of food consumption (D), water consumption (E) and body weight (F) of mice during the T3/PBS treatment.
(G and H) Heart rate measured weekly (G), and coefficient of variation (CV) of heart rate (H) of mice throughout the 3 weeks of T3/PBS treatment, based on the ECG recordings.
(I) Representative images of whole-mount brains (upper panel), and HE staining (middle panels) and corresponding (boxed regions) immunohistochemistry (lower panels) of brain sections, from wild type or Math1-Cre/Ptch1loxp/loxp mice after treatment with PBS or indicated doses of T3. Arrows pointing to tumors in mouse cerebella.
(J) Quantification of percentages of proliferating cells (EdU+) or differentiated cells (NeuN+) in tissues sections as in panel I.
(K) Survival curves of Math1-Cre/Ptch1loxp/loxp mice after treatment with 20ng/g T3 or PBS, once a day, by I.P injection.
(L) Luminescence images of recipient mice transplanted with RCMB28 cells, after the treatment with 20ng/g T3 or PBS by I.P. injection, once a day.
(M) Quantification of brain luminescence intensity.
(N) Survival curves of PDOX-bearing mice after PBS or T3 treatment. Scale bars: 100μm (I).
Data are represented as mean +/− SEM. *, p< 0.05; **, p< 0.01; ***, p< 0.001; ns, not significant.
Also see Figures S8A-C; Video S6
The classic signs of thyrotoxicosis in mice are increased food/water intake, weight loss, and tachycardia. We therefore evaluated the following potential effects of T3 in mice over a 3-week treatment period: 1) food/water consumption; 2) body weight; 3) cardiac electrophysiology; 4) hematologic analysis; and 5) histopathology of major organs. Food and water consumption in T3-treatment mice was elevated above control levels during the 1st and 2nd week of T3 treatment. However, food/water consumption declined to levels close to that in controls (at the 1st week) as the treatment progressed (Figures 7D-E). Reduced food/water intake in PBS-treated mice may be due to the tumor growth. No significant changes in body weight were observed in mice after T3 or PBS treatment (Figure 7F), suggesting that the treatment with T3 treatment did not cause weight loss. We next assessed cardiac electrophysiology in mice after T3 or PBS treatment. Electrocardiogram (ECG) recording showed that all mice had normal sinus rhythm, with no arrhythmias detected during T3 treatment (data not shown). Heart rate (HR) in PBS-treated mice declined during the treatment (Figure 7G), likely due to the intracranial hypertension caused by tumor progression 41. After completion of the T3 treatment, no significant difference in HR was observed in the T3-treated mice (Figure 7G). We also examined the coefficient of variance (CV) of HR over the 3 week treatment to assess HR variability over time 42. No significant difference in the CV was detected among T3-treated mice, or between T3-treated and PBS-treated mice (Figure 7H), together suggesting that T3 treatment did not significantly affect HR in mice. No abnormalities in the hematology parameters were observed in mice after T3 treatment (Table S2, related to Figure 7F). No alterations were detected in the biopsy and histological analyses of major organs including thyroid gland, lung, liver, heart, spleen, kidney and gastrointestinal track (data not shown). These combined data demonstrate that T3 treatment ranging from 2ng/g-2μg/g causes no significant toxicities in MB-bearing mice.
To test whether T3 treatment might affect normal cerebellar development, we examined TRα1 expression in the cerebella of wild-type mice. TRα1 protein was detected in the cerebellum from postnatal day 0 (P0) to P8. However, TRα1 expression was absent in the cerebellum at P21 (Figure S8A, related to Figure 7). In vitro, T3 treatment significantly inhibited SHH-stimulated proliferation of cerebellar GNPs (Figure S8B, related to Figure 7), suggesting that T3 can promote the differentiation of GNPs. We then treated wild-type mice at P4 with T3 or PBS for four days. After the treatment, cerebellar size and structure, as well as GNP proliferation in T3-treated mice, were comparable to those in PBS-treated mice (Figure S8C, related to Figure 7). The differing outcomes in GNP proliferation after T3 treatment in vivo and in vitro may be due to insufficient brain transportation of T3 in neonatal mice. Nevertheless, these results suggest that normal cerebellar development is not disrupted by T3 treatment in vivo.
T3 at a clinically-relevant dose increases survival in Ptch1 and G3-MB mice
We next examined the effects of the increasing doses of T3 on tumor growth in Math1-Cre/Ptch1loxp/loxp mice by histological analyses and immunohistochemistry. Consistent with our previous report 15, in PBS-treated mice cerebellar structure was substantially disrupted due to the tumor growth, compared with wildtype mice of the same age (Figure 7I). However, in T3 treated mice, tumor size was reduced in a dose-dependent manner by all T3 doses including 2ng/g, compared with the control (PBS) (Figure 7I). Moreover, cerebellar structure was partially restored by T3 treatment, especially at the higher doses (Figure 7I). The tumor symptoms significantly improved with T3 treatment, even at the lowest dose of 2ng/g (Video S6, related to Figure 7). We then examined tumor cell differentiation and proliferation markers by immunohistochemistry in tumor sections. Consistent with the gross pathology findings, higher doses of T3 were associated with increasing numbers of NeuN+ (human neuronal differentiation marker) cells and declining numbers of EdU+ cells (Figure 7I-J), suggesting that T3 treatment induced tumor cell differentiation and repressed tumor cell proliferation in a dose-dependent manner.
Finally, we tested the tumor inhibitory effects of T3 at 20ng/g, a dose equivalent to the recommended T3 dose for patients (75-100μg per day). Math1-Cre/Ptch1loxp/loxp mice were treated with 20ng/g T3 or PBS by I.P. injection, once a day. The T3 treatment significantly prolonged the survival of Math1-Cre/Ptch1loxp/loxp mice compared to the control treatment (median survival: T3 treatment, undefined vs PBS treatment, 24 days; p<0.01. Figure 7K). In the aggressive G3-MB, 20ng/g T3 treatment significantly inhibited the in vivo progression of human G3-MB tumor cells (Figure 7L-M) and improved the survival of the PDOX-bearing mice (median survival: T3 treatment, undefined vs PBS treatment, 16 days; p<0.001. Figure 7N). These data confirm the therapeutic efficacy of T3 at a clinically relevant dose, in MB treatment. Our findings demonstrate that T3 represents a safe and effective approach to treat MB.
Discussion
Despite the established use of conventional chemotherapy and radiation as primary treatments for various malignancies, these approaches often come with challenges such as drug resistance and systemic toxicity, which limit their therapeutic efficacy. An alternative strategy known as “Differentiation therapy”, offers a unique and potentially less toxic approach to cancer treatment. This approach aims to induce terminal differentiation in cancer cells, leading to a loss in their proliferative and tumorigenic capacity 43,44. However, the mechanisms governing terminal differentiation of cancer cells remain poorly understood across various malignancies, hindering the development of differentiation-based treatment strategies.
Our studies demonstrate the potential of TH to induce terminal differentiation in MB tumor cells by promoting NeuroD1 transcription. Our findings reveal that TH-driven tumor cell differentiation leads to a substantial reduction in tumor cell proliferation and effectively inhibits MB growth in vivo. Importantly, the striking tumor-inhibitory effects of TH extends to both SHH-MB and G3-MB. Specifically, T3 suppressed tumor progression in PDOX models of SHH MB with P53 mutations, and G3-MB, which represent the aggressive and refractory forms of MB 45,46. These findings suggest that therapeutic effects of T3 are not restricted by MB subgroups or oncogenic mutations, and that T3 therapy could have broad application across MB subgroups. These studies establish T3 treatment as an innovative and promising strategy for MB therapy, highlighting the advantage of differentiation-based strategies in cancer treatment. T3, an FDA-approved drug for hypothyroidism, has demonstrated ability to cross the blood-brain barrier 47,48. Our studies also confirm that T3 can penetrate the brain and suppress tumor growth without any apparent toxicities or defects in cerebellar development. Given the favorable safety profile of T3, our findings provide a compelling rationale for investigating T3 in clinical trials for MB treatment, either as a stand-alone therapy or in combination with other treatment modalities. The standard-of-care chemotherapies work by directly killing dividing tumor cells. However, nearly all MB patients suffer long-term side effects, including endocrine disorders and cognitive deficits, significantly diminishing their quality of life49,50. Our findings demonstrate the T3 inhibits tumor growth by promoting differentiation of tumor cells, instead of inducing cell apoptosis. This distinct mechanism suggests that T3 may serve as a promising adjuvant to chemotherapy.
Hypothyroidism is a prevalent endocrine disorder in patients with MB, primarily considered a consequence of aggressive tumor treatments, particularly craniospinal irradiation 13,14. Our studies present the first compelling evidence that TH signaling actively inhibits MB progression, suggesting that hypothyroidism might contribute to MB pathogenesis. Our findings underscore the importance of routinely assessing TH levels and hypothyroidism in MB treatment. Furthermore, the widespread occurrence of hypothyroidism among MB patients offers additional support for the idea of using T3 as part of MB treatment.
In our mechanistic investigations, we found that knockout or knockdown of TRα1 significantly upregulated NeuroD1 expression and promoted differentiation in tumor cells. These findings suggest that TRα1 acts as a repressor of NeuroD1 expression and terminal differentiation in MB tumor cells. To accomplish this, TRα1 recruits EZH2 as a corepressor to inhibit NeuroD1 transcription by mediating the histone methylation within NeuroD1 promotor regions. This mechanism is further supported by our observations that pharmaceutical inhibition of EZH2 mirrored the effects of TRα1 knockout in stimulating NeuroD1 expression and inducing differentiation in tumor cells. Previous studies have shown that EZH2 engages in gene-specific chromatin modification by interacting with transcription factors such as estrogen receptor and NF-kB 51,52. In our studies, T3 treatment disrupts the physical interaction between EZH2 and TRα1 in tumor cells, thereby inducing NeuroD1 expression by counteracting histone methylation. It is noteworthy that global levels of EZH2 and H3K27me3 remained unaffected in tumor cells following T3 treatment, suggesting that T3 regulates NeuroD1 expression in a gene-specific manner. Our immunoprecipation assays and competitive pull-down experiments demonstrate that TRα1 directly interacts with EZH2 in tumor cells, and that T3 compromises the interaction between TRα1 and EZH2. Prior studies based on the crystal structures of TRα1, have shown that T3 induces ligand-dependent conformational changes in TRα1, affecting its ability to interact with co-repressors or co-activators 53,54,55. Therefore, it is plausible that T3 treatment may result in conformational changes of TRα1, impairing its interaction with EZH2 in tumor cells. Future studies are needed to confirm this. Collectively, these findings establish the TH/TRα1/EZH2/NeuroD1 signaling axis and its pivotal role in promoting tumor cell differentiation and MB pathogenesis.
STAR Methods
Resource availability
Lead contact
Further information and requests for resources and reagents should be directed to and will be fulfilled by the lead contact, Zeng-jie Yang (zengjie.yang@fccc.edu).
Materials availability
Unique reagents generated in this study are available from the lead contact after completion of a Materials Transfer Agreement (MTA).
Data and code availability
RNA-seq Raw data are deposited at the National Center for Biotechnology Information’s Gene Expression Omnibus Database and under accession numbers of GEO Database: GSE224974. This paper does not report original code. Any additional information required to reanalyze the data reported in this paper is available from the lead contact upon request.
Experimental model and study participant details
Animals
Math1-Cre mice, Ptch1loxp/loxp mice, LSL(Loxp-STOP-Loxp)-SmoM2 mice, CAG-Cas9 mice were purchased from the Jackson Laboratory. All mice were bred and genotyped as recommended by the Jackson Laboratory. CB17/SCID mice were bred in the Fox Chase Cancer Center Laboratory Animal Facility (LAF). All animals were maintained in the LAF at Fox Chase Cancer Center and all experiments were performed by procedures approved by the Fox Chase Cancer Center Animal Care and Use Committee.
PDOXs were generated by injecting human tumor cells into the cerebella of CB17/SCID mice using a stereotaxic frame with a mouse adaptor (David Kopf Instruments), as described previously 56. 2 X10⁵ tumor cells suspended in 5μl NB-B22, were injected into each recipient cerebellum. Survival was defined as the days elapsed from transplantation until symptom onset.
In vivo T3 treatment was performed by I.P. injection (200ng/g, twice a day), which was initiated after tumors were established in Math1-Cre/Ptch1loxp/loxp mice (4 weeks of age), Math1-Cre/LSL-SmoM2 mice (2 weeks of age), PDOXs (luminescence signals in the range of 105–106 rad/s). Equal volume of PBS was also injected as a control. Math1-Cre/LSL-SmoM2 mice were also treated with 50mg/kg vismodegib (twice a day) by I.P. injection. Body weight was routinely monitored for evaluation of possible T3 toxicities. T3 levels in the plasma and tumor tissues were measured at 2 hrs following T3 or PBS treatment, by using a T3 enzyme-linked immunosorbent assay kit (ThermoFisher). The blood was extracted from mice after the treatment, which was centrifuged at 3000 g for 15 mins to harvest the plasma after removal of cells and debris. Tumor tissues were homogenized in RIPA buffer and centrifuged at 3000 g for 15 mins, to remove the tissue debris. T3 levels were measured using the above kit according to the manufacturer’s instructions.
Cell culture and treatment
Primary cells were freshly isolated from tumor-bearing mice at 6 to 8 weeks of age, as previously described56. Briefly, tumor tissues were isolated from mouse brains and digested in a papain solution to obtain a single cell suspension and then centrifuged through a 35% and 65% Percoll gradient. Cells from the 35% to 65% interface were suspended in Dulbecco's PBS (DPBS) plus 0.5% BSA. Cells were then suspended in NB-B22 (without T3). The B22 supplement was prepared following the protocol generated in Jacob Hanna’s lab57. Cell suspension was plated on poly-D-lysine (PDL)-coated coverslips (BD Biosciences). In most in vitro experiments, 200nM T3 (unless other concentrations designated) was added to the culture medium, and 200nM vismodegib or 1μM cisplatin was used as controls. After treatment for 48 hrs, tumor cells were harvested to examine their proliferation, differentiation or apoptosis by immunocytochemistry. DAPI was used to counterstain cell nuclei for quantifying cell percentage.
For tumoroid culture, human MB cells were plated in a 6-well plate (2×10⁵ cells/well) using NB-B22 medium supplemented with 10ng/ml FGF and 20ng/ml EGF for 4-5 days, in the presence/absence of 200nM T3. For counting the number of tumoroids, 50μl of tumoroid suspension were collected and the number of tumoroids was counted under a microscope. Established tumoroids were defined by a minimal sphere size spanning at least 50μm in diameter.
Method details
Lentivirus preparation
293FT cells or Lenti-X 293T cells (carrying pLVX lenti-backbone) were transfected with the plasmid using the calcium phosphate transfection kit (Thermo Fisher). Following the transfection, culture medium was replaced with DMEM plus 10% FBS and 2-5 mM Sodium Butyrate to increase virus production efficacy. The cells were then cultured for 36 hrs before culture medium was harvested. The culture medium was then concentrated by ultracentrifugation and stored at −80°C.
Gene knockdown or knockout
To knock down THRA in tumor cells, lentivirus carrying shRNA constructs targeting THRA or scrambled shRNA (Vectorbuilder) was generated. Tumor cells were virally transduced with the shRNA vectors, and validated for THRA knockdown in tumor cells by examining TRα1 through western blotting. All sequences for shRNAs were listed in Table S3.
To knock out THRA in tumor cells, we crossed CAG-Cas9 mice with Math1-Cre/Ptch1loxp/loxp mice to generate CAG-Cas9/Math1-Cre/Ptch1loxp/loxp mice in which all tumor cells express Cas9. A lentiviral vector encoding mcherry tagged small guide RNAs (sgRNAs) targeting THRA, was purchased and used for virus preparation. Note that this lentiviral vector contains two guide RNAs targeting THRA, to enhance the knockout efficiency. Tumor cells were virally transduced with sgRNAs specific for THRA, or an empty vector as a control. At 48 hrs following the infection, infected cells were purified by FACS based on mcherry expression. Western blotting was performed to examine levels of TRα1 protein in infected cells, to validate the deletion of THRA. Sequences of sgRNAs for THRA knockout were included in Table S3.
Immunostaining, western blotting, co-immunoprecipitation and pull-down assay
Immunofluorescence staining of sections and cells was carried out according to standard methods. Briefly, sections or cells were blocked and permeabilized for 1 hr with PBS containing 0.1% Triton X-100 and 10% normal goat serum, stained with primary antibodies overnight at 4°C and incubated with secondary antibodies overnight. Sections or cells were counterstained with DAPI and mounted with Fluoromount-G (Southern Biotech) before being visualized using a Nikon Eclipse Ti microscope. In some experiments, tumor cells were pulsed with EdU (0.02μg/μl) for 2 hrs prior to immunostaining. Primary antibodies used for immunofluroscence assay include MAP2 (1:500, Millipore, Ab5622); NeuN (1:200, Abcam, Ab104224); Cleaved caspase-3 (1:500, CST, 9664S).
For western blot analysis, cells were lysed in RIPA buffer (Thermo) supplemented with protease and phosphatase inhibitors (Thermo). Total lysate containing equal amount of protein were separated by SDS-PAGE gel and subsequently transferred onto PVDF membrane. Membranes were then subjected to probe with antibodies. Western blot signals were detected by using SuperSignal West Pico Chemiluminescent substrate and visualized using an iBright imaging system (Model CL1500, ThermoFisher). Primary antibodies used in this study include NeuroD1 (1:1000, Abcam, Ab60704); TRα1 (1:1000, Abcam, Ab53729); EZH2 (1:1000, CST, 5246); GAPDH (1:1000, CST, 2118S). Protein levels were quantified from 3 experiments using ImageJ and normalized to GAPDH.
Co-IP experiments were performed using the DynabeadsTM Protein G Immunoprecipitation Kit according to the manufacturer’s instruction. Briefly, cells were homogenized and incubated on ice for 15 mins, which were then centrifuged to remove the cell debris. 50 μl cell lysate was used as an input, which was resuspended with Dynabeads™ magnetic beads. After incubation for 9-12 hrs at 4°C, the beads were washed thoroughly with provided washing buffer. The beads were then eluted using the elution buffer, which was heated for 10 mins at 70°C before being used for western blotting.
The pulldown assay was performed using a kit following manufacture instructions (Thermo Fisher, Cat# 10007D). Purified TRα1 (Creative Biogene, THRA-437H) and EZH2 (Origene, TP302054) proteins were mixed in a binding buffer (20 mM Tris, pH 8.0, 100 mM NaCl, 2 mM DTT) to a final volume of 10 μl with a 1:1 stoichiometry, each at a concentration of 0.87 μM. The competitive pulldown was performed by titrating a series of concentrations of T3 compound (3.5 μM and 14 μM) into the mixture of TRα1 and EZH2. The mixture was incubated on ice for 15 mins. After mixing with 4 μg anti-TRα1 (1:1000, Abcam, Ab53729) and rotating at 4°C for 2 hours, the mixture was incubated with protein G beads at 4°C and rotated for 2 hrs. After removing the supernatant, the beads were washed three times with the wash buffer from the kit, and the proteins were eluted with 20 mM Glycine, pH 2.0. The samples were applied to Western Blotting for analysis. Anti-TRα1 and anti-EZH2 (1:1000, CST, 5246) were used for the detection of THRα and EZH2.
Quantitative polymerase chain reaction (qPCR) and ChIP-PCR
Total RNA was extracted from cells or tissues using TRIzol Reagent (Invitrogen). The RNA was then reversely transcribed to cDNA using Primescript RT reagent Kit Thermo. To evaluate the mRNA levels, qPCR was performed on a CFX96 q–PCR System using SYBR Green qPCR master mix (Promega, USA). GAPDH was used as the internal control. All the samples were normalized to internal controls, and fold changes were calculated based on relative quantification (2−ΔΔCt). Sequences of primers were listed in Table S3.
ChIP-PCR was performed using the Pierce Agarose Thermo ChIP Kit (Thermo) according to the manufacturer’s instruction. Briefly, cross-linking was performed by adding formaldehyde and incubated at room temperature for 10 mins. Cross-linking reaction was terminated by the addition of glycine solution. Cells were washed with ice-cold PBS containing 0.1 mM PMSF. Cell pellets were collected by centrifugation at 3000g for 5 mins and resuspended in 1 ml of ChIP sonication buffer. DNA was sheared by sonication and the cell debris was pelleted by centrifugation at 9,000 g for 3 minutes. Equal aliquots of chromatin supernatants were subjected to overnight immunoprecipitation with anti-TRα antibody (Abcam) or IgG antibody (negative control). The primer sets used for PCR were listed in Table S3.
MRI
MRI experiments were performed on a 3-Tesla MRS*DRYMAG (Guildford, UK) preclinical scanner with a 17-cm-wide bore and a 20-mm birdcage mouse head coil. A T2-weighted two-dimensional fast spin-echo sequence was used for scanning mouse brain with the following parameters: scan direction = sagittal; repetition time = 5,000 ms; effective echo time (TEeff)/base echo time (TEbase) = 68 ms/17 ms; echo train length = 8; number of averages = 3; field of view = 25mm × 25 mm; matrix size = 256 × 240; slice thickness = 0.5 mm; gap = 0 mm; number of slices = 24. The tumor volume was assessed in each MRI examination independently by ROI-based volumetry. For the ROI-based measurement, Digital Imaging and Communications in Medicine (DICOM) imported into ImageJ. The areas which are traced on each sagittal T2-weight image are summed to calculate tumor volume (V). The tumor area (A) in each MR slice, . n, number of slices; ,individual slice number.
Bioluminescent imaging (BLI)
For BLI, tumor-bearing mice were injected by I.P. with 10 μl/g (body weight) of luciferin. BLI was performed at 10 min (efflux) after substrate injection using the IVIS Lumina III imaging system. Grayscale photographic images and bioluminescent color images were superimposed using LIVINGIMAGE (version 2.12, PerkinElmer) and IGOR Image Analysis FX software (WaveMetrics, Lake Oswego, OR). BLI signals were expressed in units of photons per cm2 per second per steradian (P/cm2/s/sr). All mice were anesthetized using 1–2% isoflurane gas during imaging.
ECG recording
ECGs were recorded in mice using an ECG recording platform (Mouse Specifics, Boston, MA). The size and arrangement of the electrodes were configured to contact three paws, providing an ECG signal equivalent to Eithenoven lead I. To minimize the stress, mice were accustomed to the platform by placing them on it for at least 10 mins before ECGs were recorded. ECG signals were digitized and only data from continuous recordings of 20–30 signals were used in the following analyses. Each signal was analyzed using e-MOUSE (Mouse Specifics). The QRS duration, P-R interval, and heart rate (HR) were measured and reported automatically. To eliminate circadian influences, ECGs were recorded between 10:00 AM and 11:00 AM.
Toxicity studies of T3 in tumor-bearing mice
Math1-Cre/Ptch1loxp/loxp mice (3 weeks of age) were administered PBS or T3 at doses of 2 ng/g, 20 ng/g, or 200 ng/g or 2 μg/g (body weight) via I.P. injection, once daily, for consecutive 3 weeks. To minimize the circadian influences, mice were treated with T3 between 11:00 AM and 12:00 PM. To eliminate sex difference, only female mice were used in the toxicity studies.
Body weight, ECG recording, food consumption and water consumption were measured every 7 days during the treatment. Blood samples and tumor tissues were collected at 24 hrs following the final T3/PBS treatment, for examining T3 levels in the plasma and tumor tissues, by using a T3 enzyme-linked immunosorbent assay kit (#EIAT3C, ThermoFisher), or analyzing tumor cell differentiation by immunohistochemistry. For T3 measurement, blood sample was centrifuged at 3000 g for 15 mins to harvest the plasma after removal of cells and debris. Tumor tissues were homogenized in RIPA buffer and centrifuged at 3000 g for 15 mins, to remove the tissue debris. T3 levels were measured using the above kit according to the manufacturer’s instructions.
Blood samples for hematological analyses were collected in Microtainer Blood Collection Tubes with K2EDTA (BD, USA). Peripheral blood was analyzed with a VetScan HM5 (Abaxis) hematology analyzer and discrimination between cell types was achieved by size. The following parameters were analyzed: lymphocytes, monocytes, and neutrophils, all reported as absolute cell counts as well as percentage of total white blood cells, red blood cells, hemoglobin, hematocrit, mean corpuscular volume (MCV), mean corpuscular hemoglobin (MCH), mean corpuscular hemoglobin concentration (MCHC), and red blood cell distribution width (RDWc), platelets (PLT), plateletcrit (PCT), mean platelet volume (MPV), and platelet distribution width (PDWc).
Major organs including brain, thyroid, lung, heart, liver, spleen, kidney and GI track were harvested in mice after the completion of T3/PBS treatment for 3 weeks. Histological slides prepared from these organs, were independently analyzed by two pathologists.
RNA sequencing
Total RNA was extracted from tumor cells treated with T3 or PBS. Strand-specific mRNA-seq libraries for the Illumina platform were generated and sequenced following the manufacturer’s protocol. High-quality total RNA was used as input for the so-called dUTP library preparation method. Briefly, the mRNA fraction was purified from total RNA by polyA capture, fragmented and subjected to first-strand cDNA synthesis with random hexamers in the presence of Actinomycin D. The second-strand synthesis was performed incorporating dUTP instead of dTTP. Barcoded DNA adapters were ligated to both ends of the double-stranded cDNA and subjected to PCR amplification. The resultant library was checked on a Bioanalyzer (Agilent) and quantified. The libraries were multiplexed, clustered, and sequenced on an Illumina NextSeq 2000. The sequencing run was analyzed with the Illumina Novaseq X plus.
Paired-end RNA sequencing fastq files were processed for adapter and low-quality base call removal. Each paired-end file was split into equal read numbers across all conditions to account for library depths. Files were then mapped to either the mm39 or hg38 gencode genome index with the light-weight transcript abundance quantifier, Salmon. Variance-mean dispersions of raw counts were estimated using the negative binomial generalized linear modeling Wald test. Gene Ontology Terms were selected using the SQLite based annotation package, AnnotationDbi. Curated gene sets provided from the GSEA resource database and KEGG were also included. Count matrices were centered and scaled to normalize before generating heatmaps and coregulation plots. All packages used for analysis are listed within the reference section.
Quantification and statistical analysis
Unless stated otherwise, Student’s t test or one-way ANOVA was performed to determine the statistical significance of the difference. p<0.05 was considered statistically significant (*, p< 0.05; **, p< 0.01; ***, p< 0.001; ns, not significant). Error bars represent the SEM. Overall survival was assessed using the Kaplan-Meier survival analysis and the Mantel-Cox log-rank test was used to assess the significance of difference between survival curves. Data handling and statistical processing was performed using Graphpad Prism Software.
Supplementary Material
Table S1. Metastasis rate in recipient mice, related to Figure 6M
Table S2. Hematological analyses in mice after T3 treatment, related to Figure 7F
Table S3. Sequences of shRNAs, sgRNAs and primers, related to STAR methods
Video S4. Symptoms of a Math1-Cre/LSL-SmoM2 mouse after vismodegib treatment for 2 weeks, related to Figure 4K
Video S1. Symptoms of a Math1-Cre/Ptch1loxp/loxp mouse after PBS treatment for 2 weeks, related to Figure 4E
Video S2. Symptoms of a Math1-Cre/Ptch1loxp/loxp mouse after T3 treatment for 2 weeks, related to Figure 4E
Video S3. Symptoms of a Math1-Cre/LSL-SmoM2 mouse after PBS treatment for 2 weeks, related to Figure 4K
Video S5. Symptoms of a Math1-Cre/LSL-SmoM2 mouse after T3 treatment for 2 weeks, related to Figure 4K
Video S6. Symptoms of Math1-Cre/Ptch1loxp/loxp mice after treatment with PBS or T3 (at various doses) for 3 weeks, related to Figure 7
Key resources table
| REAGENT OR RESOURCE | SOURCE | IDENTIFIER |
|---|---|---|
| Chemicals | ||
| 3,3',5-Triiodo-L-thyronine | Cayman | CAS#345957-19-9 |
| Thyroid Hormone Receptor Antagonist (1-850) | Cayman | CAS#251310-57-3 |
| UNC1999 | Cayman | CAS#1431612-23-5 |
| GSK126 | Cayman | CAS#1346574-57-9 |
| EPZ-6438 | Cayman | CAS#1403254-99-8 |
| D-Luciferin | PerkinElmer Informatics Inc | Cat# 122799 |
| 2'-Deoxy-5-ethynyluridine (EdU) | Carbosynth | Cat# NE08701 |
| Tetramethylrhodamine (TAMRA) | Thermo Fisher | Cat# T10182 |
| Neurobasal Medium (NB) | Thermo Fisher | Cat# 21103049 |
| B27 supplement | Thermo Fisher | Cat# 17504044 |
| Antibodies | ||
| Rabbit polyclonal to Thyroid Hormone Receptor alpha | Abcam | Cat# ab53729; RRID: AB_882974 |
| Rabbit monoclonal anti-Ki67 | Abcam | Cat#ab15580; RRID: AB_443209 |
| Mouse monoclonal anti-NeuN | Abcam | Cat#ab104224; RRID: AB_10711040 |
| Rabbit monoclonal anti-Microtubule Associated Protein 2 (MAP2) | Millipore | Cat# AB5622; RRID: AB_91939 |
| Mouse monoclonal anti-beta III Tubulin | Abcam | Cat#ab78078; RRID: AB_2256751 |
| Rabbit monoclonal anti-Cleaved Caspase3 | Cell Signaling Technology | Cat#9664; RRID: AB_2070042 |
| Mouse monoclonal anti-Neurod1 | Abcam | Cat# ab60704; RRID: AB_943491 |
| Chicken Polyclonal anti-GFP | Thermo Fisher Scientific | Cat#A10262; RRID: AB_2534023 |
| Rabbit monoclonal anti-Histone H3, Trimethyl (Lys27) | Cell Signaling Technology | Cat#9733; RRID: AB_2616029 |
| Rabbit monoclonal anti-EZH2 | Cell Signaling Technology | Cat#5246; RRID: AB_10694683 |
| Rabbit monoclonal anti-GAPDH | Cell Signaling Technology | Cat#2118; RRID: AB_561053 |
| Goat anti-Rabbit IgG Alexa Fluor 488 | Thermo Fisher Scientific | Cat# A31566, RRID: AB_10374301 |
| Goat anti-Rabbit IgG Alexa Fluor 594 | Thermo Fisher Scientific | Cat# A11012; RRID: AB_2534079 |
| Goat anti-Mouse IgG Alexa Fluor 488 | Thermo Fisher Scientific | Cat# A-31560, RRID: AB_2536174 |
| Goat anti-Mouse IgG Alexa Fluor 594 | Thermo Fisher Scientific | Cat# A-11005, RRID: AB_2534073 |
| Goat Anti-Mouse HRP Conjugate | Bio-Rad | Cat# 170-5047, RRID: AB_11125753 |
| Goat Anti-Rabbit HRP Conjugate | Bio-Rad | Cat# 170-5046, RRID: AB_11125757 |
| Biological Samples | ||
| human MB PDX lines | Northwestern University | ICb-5610 |
| human MB PDX lines | Columbia university | Med1712 |
| human MB PDX lines | Columbia university | Rcmb20 |
| human MB PDX lines | Columbia university | Rcmb28 |
| human MB PDX lines | St Jude children's hospital | SJNBT12 |
| EZH2 Human Recombinant Protein | Origene Technologies Inc | Cat# TP302054 |
| Recombinant Human THRA Protein | Creative Biogene | Cat# THRA-437H |
| pU6-sgRNA#1TRα1-sgRNA#2TRα1 | VectorBuilder | Cat# VB211018-1217ptt |
| pU6-shRNA-TRα1 | VectorBuilder | Cat# VB211018-1218mrf |
| Experimental Models: Organisms/Strains | ||
| Mouse: Ptch1loxp/loxp | Jackson Laboratory | https://www.jax.org/strain/030494 |
| Mouse: Math1-Cre | Jackson Laboratory | https://www.jax.org/strain/011104 |
| Mouse: CB17/SCID | Jackson Laboratory | https://www.jax.org/strain/001303 |
| Mouse: C57BL/6J | Fox Chase Cancer Center | N/A |
| Critical commercial assays | ||
| BCA Protein Assay Kit | Thermo Fisher Scientific | Cat# 23225 |
| Pierce™ Magnetic ChIP Kit | Thermo Fisher Scientific | Cat# 26157 |
| Triiodothyronine (T3) ELISA | Thermo Fisher Scientific | Cat# EIAT3C |
| Others | ||
| Benchtop pH meter | Fisher Scientific | AB150 |
| Centrifuge | Thermo Scientific | ST40R |
| Inverted microscope | Zeiss | Axiovert 40 CFL |
| Small Animal Stereotaxic Frame | David Kopf Instruments | Model 900LS |
| Micromanipulator | David Kopf Instruments | Model 1760 |
| Replacement blade | Excel | Cat# 84-327-1 |
| Unbeveled Hamilton syringe | Hamilton | Cat# 76350-01 |
| Beveled 18-gauge needle | BD Bioscience | Cat# 5302622 |
| Nylon skin suture (with needle) | Fisher Scientific | Cat# NC1646047 |
| Deltaphase Isothermal Pad | Braintree Scientific | Cat# 39DP |
| Nutrition gel | ClearH2O | Cat# 72-06-5022 |
Highlights.
T3 induces terminal differentiation of MB tumor cells through upregulating NeuroD1
T3 promotes NeuroD1 transcription by interfering with TRα1 and EZH2 interaction
T3 represses the growth of human and mouse tumors from multiple MB groups
T3-induced differentiation is an effective and safe strategy for MB treatment
Acknowledgement
We appreciate Drs. E. Golemis, J. Whestine, T. Curran and R. Locke for their insightful discussions. We thank Drs. S. Liao for RNA sequencing analysis; J. Oesterling for flow cytometric analysis; A. Efimov for microscopy analysis; Y. Yang and D. Cvetkovic for MRI analysis. We are grateful for Dr. Martine F. Roussel for kindly providing human MB cell lines. This research was supported by funds from National Cancer Institute (R01 CA276273, ZJY), the CURE grant from Pennsylvania Department of Health (#4100085739, ZJY), American Cancer Society (ACSDG1900025, ZJY), the Andrew McDonough B+ Foundation (#1027381, ZJY), and the Buck County Board of Association at Fox Chase Cancer Center (ZJY), and the Core Comprehensive Cancer Center Grant CA06927 in support to Fox Chase Cancer Center’s facilities including Light Microscopy, Histopathology, Cell Culture, Biostatistics and Bioinformatics and the Talbot Library. Some graphics were created with BioRender (www.BioRender.com).
Footnotes
Publisher's Disclaimer: This is a PDF file of an unedited manuscript that has been accepted for publication. As a service to our customers we are providing this early version of the manuscript. The manuscript will undergo copyediting, typesetting, and review of the resulting proof before it is published in its final form. Please note that during the production process errors may be discovered which could affect the content, and all legal disclaimers that apply to the journal pertain.
Declaration of Interests
A patent related to this work has been filed by Fox Chase Cancer Center (Yang Y.J. and Yang Z.J.). No disclosures were reported by the other authors.
References
- 1.Taylor MD, Northcott PA, Korshunov A, Remke M, Cho YJ, Clifford SC, Eberhart CG, Parsons DW, Rutkowski S, Gajjar A, et al. (2012). Molecular subgroups of medulloblastoma: the current consensus. Acta Neuropathol 123, 465–472. 10.1007/s00401-011-0922-z. [DOI] [PMC free article] [PubMed] [Google Scholar]
- 2.Northcott PA, Korshunov A, Pfister SM, and Taylor MD (2012). The clinical implications of medulloblastoma subgroups. Nat Rev Neurol 8, 340–351. nrneurol.2012.78 [pii] 10.1038/nrneurol.2012.78. [DOI] [PubMed] [Google Scholar]
- 3.Crawford JR, MacDonald TJ, and Packer RJ (2007). Medulloblastoma in childhood: new biological advances. Lancet Neurol 6, 1073–1085. S1474-4422(07)70289-2 [pii] 10.1016/S1474-4422(07)70289-2. [DOI] [PubMed] [Google Scholar]
- 4.Vanner RJ, Remke M, Gallo M, Selvadurai HJ, Coutinho F, Lee L, Kushida M, Head R, Morrissy S, Zhu X, et al. (2014). Quiescent sox2(+) cells drive hierarchical growth and relapse in sonic hedgehog subgroup medulloblastoma. Cancer Cell 26, 33–47. 10.1016/j.ccr.2014.05.005. [DOI] [PMC free article] [PubMed] [Google Scholar]
- 5.Selvadurai HJ, Luis E, Desai K, Lan X, Vladoiu MC, Whitley O, Galvin C, Vanner RJ, Lee L, Whetstone H, et al. (2020). Medulloblastoma Arises from the Persistence of a Rare and Transient Sox2(+) Granule Neuron Precursor. Cell Rep 31, 107511. 10.1016/j.celrep.2020.03.075. [DOI] [PubMed] [Google Scholar]
- 6.Cheng Y, Liao S, Xu G, Hu J, Guo D, Du F, Contreras A, Cai KQ, Peri S, Wang Y, et al. (2020). NeuroD1 dictates tumor cell differentiation in medulloblastoma. Cell Rep 31, 107782. 10.1016/j.celrep.2020.107782. [DOI] [PMC free article] [PubMed] [Google Scholar]
- 7.Dussault JH, and Ruel J (1987). Thyroid hormones and brain development. Annu Rev Physiol 49, 321–334. 10.1146/annurev.ph.49.030187.001541. [DOI] [PubMed] [Google Scholar]
- 8.Bernal J, and Nunez J (1995). Thyroid hormones and brain development. Eur J Endocrinol 133, 390–398. 10.1530/eje.0.1330390. [DOI] [PubMed] [Google Scholar]
- 9.Mullur R, Liu YY, and Brent GA (2014). Thyroid hormone regulation of metabolism. Physiol Rev 94, 355–382. 10.1152/physrev.00030.2013. [DOI] [PMC free article] [PubMed] [Google Scholar]
- 10.Ishii S, Amano I, and Koibuchi N (2021). The Role of Thyroid Hormone in the Regulation of Cerebellar Development. Endocrinol Metab (Seoul) 36, 703–716. 10.3803/EnM.2021.1150. [DOI] [PMC free article] [PubMed] [Google Scholar]
- 11.Forrest D, and Vennstrom B (2000). Functions of thyroid hormone receptors in mice. Thyroid 10, 41–52. 10.1089/thy.2000.10.41. [DOI] [PubMed] [Google Scholar]
- 12.Grontved L, Waterfall JJ, Kim DW, Baek S, Sung MH, Zhao L, Park JW, Nielsen R, Walker RL, Zhu YJ, et al. (2015). Transcriptional activation by the thyroid hormone receptor through ligand-dependent receptor recruitment and chromatin remodelling. Nat Commun 6, 7048. 10.1038/ncomms8048. [DOI] [PMC free article] [PubMed] [Google Scholar]
- 13.Cosnarovici MM, Piciu A, Bonci EA, Badan MI, Badulescu CI, Stefan AI, Mester A, Cosnarovici R, and Larg MI (2020). Post-Treatment Thyroid Diseases in Children with Brain Tumors: A Single-Center Experience at "Prof. Dr. Ion Chiricuta" Institute of Oncology, Cluj-Napoca. Diagnostics (Basel) 10. 10.3390/diagnostics10030142. [DOI] [PMC free article] [PubMed] [Google Scholar]
- 14.Paulino AC (2002). Hypothyroidism in children with medulloblastoma: a comparison of 3600 and 2340 cGy craniospinal radiotherapy. Int J Radiat Oncol Biol Phys 53, 543–547. 10.1016/s0360-3016(02)02744-x. [DOI] [PubMed] [Google Scholar]
- 15.Yang ZJ, Ellis T, Markant SL, Read TA, Kessler JD, Bourboulas M, Schuller U, Machold R, Fishell G, Rowitch DH, et al. (2008). Medulloblastoma can be initiated by deletion of Patched in lineage-restricted progenitors or stem cells. Cancer Cell 14, 135–145. S1535-6108(08)00229-8 [pii] 10.1016/j.ccr.2008.07.003. [DOI] [PMC free article] [PubMed] [Google Scholar]
- 16.Schuller U, Heine VM, Mao J, Kho AT, Dillon AK, Han YG, Huillard E, Sun T, Ligon AH, Qian Y, et al. (2008). Acquisition of granule neuron precursor identity is a critical determinant of progenitor cell competence to form Shh-induced medulloblastoma. Cancer Cell 14, 123–134. S1535-6108(08)00230-4 [pii] 10.1016/j.ccr.2008.07.005. [DOI] [PMC free article] [PubMed] [Google Scholar]
- 17.Zhao H, Ayrault O, Zindy F, Kim JH, and Roussel MF (2008). Post-transcriptional down-regulation of Atoh1/Math1 by bone morphogenic proteins suppresses medulloblastoma development. Genes Dev 22, 722–727. 22/June/722 [pii] 10.1101/gad.1636408. [DOI] [PMC free article] [PubMed] [Google Scholar]
- 18.Schapira M, Raaka BM, Das S, Fan L, Totrov M, Zhou Z, Wilson SR, Abagyan R, and Samuels HH (2003). Discovery of diverse thyroid hormone receptor antagonists by high-throughput docking. Proc Natl Acad Sci U S A 100, 7354–7359. 10.1073/pnas.1131854100. [DOI] [PMC free article] [PubMed] [Google Scholar]
- 19.Lazar MA (1993). Thyroid hormone receptors: multiple forms, multiple possibilities. Endocr Rev 14, 184–193. 10.1210/edrv-14-2-184. [DOI] [PubMed] [Google Scholar]
- 20.Zhang J, and Lazar MA (2000). The mechanism of action of thyroid hormones. Annu Rev Physiol 62, 439–466. 10.1146/annurev.physiol.62.1.439. [DOI] [PubMed] [Google Scholar]
- 21.Platt RJ, Chen S, Zhou Y, Yim MJ, Swiech L, Kempton HR, Dahlman JE, Parnas O, Eisenhaure TM, Jovanovic M, et al. (2014). CRISPR-Cas9 knockin mice for genome editing and cancer modeling. Cell 159, 440–455. 10.1016/j.cell.2014.09.014. [DOI] [PMC free article] [PubMed] [Google Scholar]
- 22.Amador-Arjona A, Cimadamore F, Huang CT, Wright R, Lewis S, Gage FH, and Terskikh AV (2015). SOX2 primes the epigenetic landscape in neural precursors enabling proper gene activation during hippocampal neurogenesis. Proc Natl Acad Sci U S A 112, E1936–1945. 10.1073/pnas.1421480112. [DOI] [PMC free article] [PubMed] [Google Scholar]
- 23.Feng W, Kawauchi D, Korkel-Qu H, Deng H, Serger E, Sieber L, Lieberman JA, Jimeno-Gonzalez S, Lambo S, Hanna BS, et al. (2017). Chd7 is indispensable for mammalian brain development through activation of a neuronal differentiation programme. Nat Commun 8, 14758. 10.1038/ncomms14758. [DOI] [PMC free article] [PubMed] [Google Scholar]
- 24.Stevenson TJ, and Prendergast BJ (2013). Reversible DNA methylation regulates seasonal photoperiodic time measurement. Proc Natl Acad Sci U S A 110, 16651–16656. 10.1073/pnas.1310643110. [DOI] [PMC free article] [PubMed] [Google Scholar]
- 25.Aoyama K, Shinoda D, Suzuki E, Nakajima-Takagi Y, Oshima M, Koide S, Rizq O, Si S, Tara S, Sashida G, and Iwama A (2021). PRC2 insufficiency causes p53-dependent dyserythropoiesis in myelodysplastic syndrome. Leukemia 35, 1156–1165. 10.1038/s41375-020-01023-1. [DOI] [PubMed] [Google Scholar]
- 26.Cohen RN, Wondisford FE, and Hollenberg AN (1998). Two separate NCoR (nuclear receptor corepressor) interaction domains mediate corepressor action on thyroid hormone response elements. Mol Endocrinol 12, 1567–1581. 10.1210/mend.12.10.0188. [DOI] [PubMed] [Google Scholar]
- 27.Tagami T, Park Y, and Jameson JL (1999). Mechanisms that mediate negative regulation of the thyroid-stimulating hormone alpha gene by the thyroid hormone receptor. J Biol Chem 274, 22345–22353. 10.1074/jbc.274.32.22345. [DOI] [PubMed] [Google Scholar]
- 28.Hu X, and Lazar MA (1999). The CoRNR motif controls the recruitment of corepressors by nuclear hormone receptors. Nature 402, 93–96. 10.1038/47069. [DOI] [PubMed] [Google Scholar]
- 29.Nagy L, Kao HY, Love JD, Li C, Banayo E, Gooch JT, Krishna V, Chatterjee K, Evans RM, and Schwabe JW (1999). Mechanism of corepressor binding and release from nuclear hormone receptors. Genes Dev 13, 3209–3216. 10.1101/gad.13.24.3209. [DOI] [PMC free article] [PubMed] [Google Scholar]
- 30.Kaneshige M, Suzuki H, Kaneshige K, Cheng J, Wimbrow H, Barlow C, Willingham MC, and Cheng S (2001). A targeted dominant negative mutation of the thyroid hormone alpha 1 receptor causes increased mortality, infertility, and dwarfism in mice. Proc Natl Acad Sci U S A 98, 15095–15100. 10.1073/pnas.261565798. [DOI] [PMC free article] [PubMed] [Google Scholar]
- 31.Huang P, Zheng S, Wierbowski BM, Kim Y, Nedelcu D, Aravena L, Liu J, Kruse AC, and Salic A (2018). Structural Basis of Smoothened Activation in Hedgehog Signaling. Cell 175, 295–297. 10.1016/j.cell.2018.09.003. [DOI] [PMC free article] [PubMed] [Google Scholar]
- 32.Yauch RL, Dijkgraaf GJ, Alicke B, Januario T, Ahn CP, Holcomb T, Pujara K, Stinson J, Callahan CA, Tang T, et al. (2009). Smoothened mutation confers resistance to a Hedgehog pathway inhibitor in medulloblastoma. Science 326, 572–574. 1179386 [pii] 10.1126/science.1179386. [DOI] [PMC free article] [PubMed] [Google Scholar]
- 33.Cheng Y, Franco-Barraza J, Wang Y, Zheng C, Zhang L, Qu Y, Long Y, Cukierman E, and Yang ZJ (2020). Sustained hedgehog signaling in medulloblastoma tumoroids is attributed to stromal astrocytes and astrocyte-derived extracellular matrix. Lab Invest. 10.1038/s41374-020-0443-2. [DOI] [PMC free article] [PubMed] [Google Scholar]
- 34.Packer RJ, Goldwein J, Nicholson HS, Vezina LG, Allen JC, Ris MD, Muraszko K, Rorke LB, Wara WM, Cohen BH, and Boyett JM (1999). Treatment of children with medulloblastomas with reduced-dose craniospinal radiation therapy and adjuvant chemotherapy: A Children's Cancer Group Study. J Clin Oncol 17, 2127–2136. 10.1200/JCO.1999.17.7.2127. [DOI] [PubMed] [Google Scholar]
- 35.Rusert JM, Juarez EF, Brabetz S, Jensen J, Garancher A, Chau LQ, Tacheva-Grigorova SK, Wahab S, Udaka YT, Finlay D, et al. (2020). Functional Precision Medicine Identifies New Therapeutic Candidates for Medulloblastoma. Cancer Res 80, 5393–5407. 10.1158/0008-5472.CAN-20-1655. [DOI] [PMC free article] [PubMed] [Google Scholar]
- 36.Smith KS, Xu K, Mercer KS, Boop F, Klimo P, DeCupyere M, Grenet J, Robinson S, Dunphy P, Baker SJ, et al. (2020). Patient-derived orthotopic xenografts of pediatric brain tumors: a St. Jude resource. Acta Neuropathol 140, 209–225. 10.1007/s00401-020-02171-5. [DOI] [PMC free article] [PubMed] [Google Scholar]
- 37.Selenkow HA, and Rose LI (1976). Comparative Clinical Pharmacology of Thyroid-Hormones. Pharmacol Ther Pt C 1, 331–349. Doi 10.1016/S0362-5486(76)80024-6. [DOI] [Google Scholar]
- 38.Nair AB, and Jacob S (2016). A simple practice guide for dose conversion between animals and human. J Basic Clin Pharm 7, 27–31. 10.4103/0976-0105.177703. [DOI] [PMC free article] [PubMed] [Google Scholar]
- 39.Hoermann R, Eckl W, Hoermann C, and Larisch R (2010). Complex relationship between free thyroxine and TSH in the regulation of thyroid function. Eur J Endocrinol 162, 1123–1129. 10.1530/EJE-10-0106. [DOI] [PubMed] [Google Scholar]
- 40.Salas-Lucia F, and Bianco AC (2022). T3 levels and thyroid hormone signaling. Front Endocrinol (Lausanne) 13, 1044691. 10.3389/fendo.2022.1044691. [DOI] [PMC free article] [PubMed] [Google Scholar]
- 41.Schmidt EA, Despas F, Pavy-Le Traon A, Czosnyka Z, Pickard JD, Rahmouni K, Pathak A, and Senard JM (2018). Intracranial Pressure Is a Determinant of Sympathetic Activity. Front Physiol 9, 11. 10.3389/fphys.2018.00011. [DOI] [PMC free article] [PubMed] [Google Scholar]
- 42.Baron R, and Ewing DJ (1999). Heart rate variability. The International Federation of Clinical Neurophysiology. Electroencephalogr Clin Neurophysiol Suppl 52, 283–286. [PubMed] [Google Scholar]
- 43.Lotem J, and Sachs L (1988). In vivo control of differentiation of myeloid leukemic cells by recombinant granulocyte-macrophage colony-stimulating factor and interleukin 3. Blood 71, 375–382. [PubMed] [Google Scholar]
- 44.Sachs L. (2000). The Molecular Control of Hematopoiesis and Leukemia: From Basic Biology to the Clinic. Hematology Am Soc Hematol Educ Program, 1. 10.1182/asheducation-2000.1.1. [DOI] [PubMed] [Google Scholar]
- 45.Northcott PA, Robinson GW, Kratz CP, Mabbott DJ, Pomeroy SL, Clifford SC, Rutkowski S, Ellison DW, Malkin D, Taylor MD, et al. (2019). Medulloblastoma. Nat Rev Dis Primers 5, 11. 10.1038/s41572-019-0063-6. [DOI] [PubMed] [Google Scholar]
- 46.Ramaswamy V, Nor C, and Taylor MD (2015). p53 and Meduloblastoma. Cold Spring Harb Perspect Med 6, a026278. 10.1101/cshperspect.a026278. [DOI] [PMC free article] [PubMed] [Google Scholar]
- 47.Van Tassell B, Wohlford G.F.t., Linderman JD, Smith S, Yavuz S, Pucino F, and Celi FS (2019). Pharmacokinetics of L-Triiodothyronine in Patients Undergoing Thyroid Hormone Therapy Withdrawal. Thyroid 29, 1371–1379. 10.1089/thy.2019.0101. [DOI] [PMC free article] [PubMed] [Google Scholar]
- 48.Roberts LM, Woodford K, Zhou M, Black DS, Haggerty JE, Tate EH, Grindstaff KK, Mengesha W, Raman C, and Zerangue N (2008). Expression of the thyroid hormone transporters monocarboxylate transporter-8 (SLC16A2) and organic ion transporter-14 (SLCO1C1) at the blood-brain barrier. Endocrinology 149, 6251–6261. 10.1210/en.2008-0378. [DOI] [PubMed] [Google Scholar]
- 49.Rossi A, Caracciolo V, Russo G, Reiss K, and Giordano A (2008). Medulloblastoma: from molecular pathology to therapy. Clin Cancer Res 14, 971–976. 14/April/971 [pii] 10.1158/1078-0432.CCR-07-2072. [DOI] [PMC free article] [PubMed] [Google Scholar]
- 50.Klesse LJ, and Bowers DC (2010). Childhood medulloblastoma: current status of biology and treatment. CNS Drugs 24, 285–301. 2 [pii] 10.2165/11530140-000000000-00000. [DOI] [PubMed] [Google Scholar]
- 51.Shi B, Liang J, Yang X, Wang Y, Zhao Y, Wu H, Sun L, Zhang Y, Chen Y, Li R, et al. (2007). Integration of estrogen and Wnt signaling circuits by the polycomb group protein EZH2 in breast cancer cells. Mol Cell Biol 27, 5105–5119. 10.1128/MCB.00162-07. [DOI] [PMC free article] [PubMed] [Google Scholar]
- 52.Lee ST, Li Z, Wu Z, Aau M, Guan P, Karuturi RK, Liou YC, and Yu Q (2011). Context-specific regulation of NF-kappaB target gene expression by EZH2 in breast cancers. Mol Cell 43, 798–810. 10.1016/j.molcel.2011.08.011. [DOI] [PubMed] [Google Scholar]
- 53.Wagner RL, Apriletti JW, McGrath ME, West BL, Baxter JD, and Fletterick RJ (1995). A structural role for hormone in the thyroid hormone receptor. Nature 378, 690–697. 10.1038/378690a0. [DOI] [PubMed] [Google Scholar]
- 54.Moras D, and Gronemeyer H (1998). The nuclear receptor ligand-binding domain: structure and function. Current opinion in cell biology 10, 384–391. 10.1016/s0955-0674(98)80015-x. [DOI] [PubMed] [Google Scholar]
- 55.Yen PM, and Chin WW (1994). New advances in understanding the molecular mechanisms of thyroid hormone action. Trends in endocrinology and metabolism: TEM 5, 65–72. 10.1016/1043-2760(94)90004-3. [DOI] [PubMed] [Google Scholar]
- 56.Guo D, Wang Y, Cheng Y, Liao S, Hu J, Du F, Xu G, Liu Y, Cai KQ, Cheung M, et al. (2021). Tumor cells generate astrocyte-like cells that contribute to SHH-driven medulloblastoma relapse. J Exp Med 218. 10.1084/jem.20202350. [DOI] [PMC free article] [PubMed] [Google Scholar]
- 57.Irie N, Weinberger L, Tang WW, Kobayashi T, Viukov S, Manor YS, Dietmann S, Hanna JH, and Surani MA (2015). SOX17 is a critical specifier of human primordial germ cell fate. Cell 160, 253–268. 10.1016/j.cell.2014.12.013. [DOI] [PMC free article] [PubMed] [Google Scholar]
Associated Data
This section collects any data citations, data availability statements, or supplementary materials included in this article.
Supplementary Materials
Table S1. Metastasis rate in recipient mice, related to Figure 6M
Table S2. Hematological analyses in mice after T3 treatment, related to Figure 7F
Table S3. Sequences of shRNAs, sgRNAs and primers, related to STAR methods
Video S4. Symptoms of a Math1-Cre/LSL-SmoM2 mouse after vismodegib treatment for 2 weeks, related to Figure 4K
Video S1. Symptoms of a Math1-Cre/Ptch1loxp/loxp mouse after PBS treatment for 2 weeks, related to Figure 4E
Video S2. Symptoms of a Math1-Cre/Ptch1loxp/loxp mouse after T3 treatment for 2 weeks, related to Figure 4E
Video S3. Symptoms of a Math1-Cre/LSL-SmoM2 mouse after PBS treatment for 2 weeks, related to Figure 4K
Video S5. Symptoms of a Math1-Cre/LSL-SmoM2 mouse after T3 treatment for 2 weeks, related to Figure 4K
Video S6. Symptoms of Math1-Cre/Ptch1loxp/loxp mice after treatment with PBS or T3 (at various doses) for 3 weeks, related to Figure 7
Data Availability Statement
RNA-seq Raw data are deposited at the National Center for Biotechnology Information’s Gene Expression Omnibus Database and under accession numbers of GEO Database: GSE224974. This paper does not report original code. Any additional information required to reanalyze the data reported in this paper is available from the lead contact upon request.