

Summary
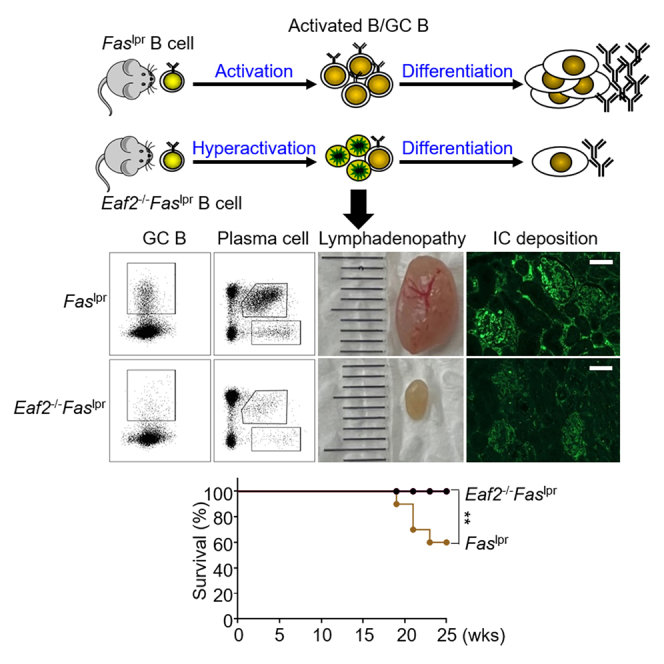
MRL/lpr mice develop systemic lupus erythematosus-like autoimmunity due to defective FAS-mediated apoptosis. We generated Faslpr mice deficient in EAF2, a transcription elongation-associated factor known to promote apoptosis in germinal center (GC) B cells and crucial for preventing autoimmunity. Contrary to expectations, EAF2 deficiency significantly reduced lymphadenopathy and splenomegaly, extended lifespan, and alleviated nephritis by decreasing renal immune complex deposition. Additionally, EAF2 deficiency markedly reduced accumulation of activated B cells, GC B cells, plasma cells, and the abnormal B220+CD3+ T cells in Faslpr mice. Further analysis revealed that Eaf2−/−Faslpr B cells showed hyperactivation upon various stimulations, followed by increased death. RNA sequencing of the B220+CD3+ cells revealed a downregulation in survival-promoting genes such as Bcl-2 and Akt and an upregulation of proapoptotic genes. We conclude that the combined deficiency in FAS- and EAF2-mediated apoptotic pathways leads to B cell hyperactivation and subsequent death, thereby ameliorating systemic autoimmunity in this model.
Subject areas: Pathophysiology, Immunology, Cell biology
Graphical abstract
Highlights
-
•
EAF2 and FAS both facilitate apoptosis in germinal center B cells
-
•
Unexpectedly, EAF2 deficiency reduces autoimmunity in Faslpr mice
-
•
Loss of both FAS and EAF2 leads to B cell hyperactivation and subsequent increased death
-
•
These findings underscore the complex regulation of lymphocyte apoptosis
Pathophysiology; Immunology; Cell biology
Introduction
Systemic lupus erythematosus (SLE) is a chronic autoimmune disease with significant morbidity and mortality. The disease is characterized by autoantibody production and the deposition of immune complexes, leading to multiorgan damage affecting the kidneys, skin, lungs, brain, and joints.1,2,3 In MRL/lpr mice, a classic animal model for SLE, the lymphoproliferation (lpr) mutation arises from the insertion of a 5.3 kb early transposable (ETn) element into intron 2 of the Fas gene. This insertion causes premature termination and aberrant splicing of the Fas transcript,4,5,6 leading to a defect in apoptosis. As a result, mice carrying the lpr mutation exhibit extensive lymphadenopathy and splenomegaly, elevated lymphocyte activation, autoantibody production, lupus nephritis (LN), and the accumulation of large numbers of nonmalignant B220+CD3+ T lymphocytes in lymph nodes and spleen, with LN being a primary cause of mortality.4,7,8
Several immune cell lineages are abnormally activated in SLE, with B cells playing essential roles in both the onset and progression of the disease.9 They serve as precursors to antibody-secreting cells (ASCs), contributing to LN through autoantibody production.10,11 Additionally, B cells act as antigen-presenting cells (APCs) for T cell activation and produce both inflammatory and regulatory cytokines.12,13,14 However, despite the development of B cell targeted immunotherapies, including B cell activating factor inhibitors and B cell specific depleting antibodies,15,16 the prognosis of SLE remains poor.17 This underscores the need for a deeper understanding of the role of B cells in SLE.18
Human upregulated gene 19 (U19)/ELL-associated factor 2 (EAF2) is a potential prostate tumor suppressor19 and may also be involved in the development of acute myeloid leukemia.20 As part of the super elongation complexes (SEC), EAF2 regulates transcriptional elongation through interactions with RNA polymerase II (Pol II) elongation factors known as eleven-nineteen Lys-rich leukemia (ELL) proteins.21,22,23 The SEC, comprising AF4/FMR2 (AFF) family proteins (AFF1–4), YEATS domain-containing proteins ENL or AF9 (encoded by the MLLT1 and MLLT3 genes), ELL proteins, and positive transcription elongation factor b (P-TEFb), is crucial for facilitating rapid and productive transcription by releasing RNA Pol II through its P-TEFb module and promoting transcriptional processivity with its ELL2 subunit.24 Our previous work has demonstrated that EAF2 is highly expressed in germinal center (GC) B cells, where it mediates apoptosis and plays an important role in maintaining the balance between immunity and tolerance.25 In the present study, we show that absence of EAF2 in Faslpr mice significantly alleviates LN by attenuating GC B cell expansion and plasma cell (PC) formation. Moreover, the abnormal B220+CD3+ T cells were also significantly reduced in Eaf2−/−Faslpr mice. In vitro studies suggest that the dual deficiency in FAS- and EAF2-mediated apoptotic pathways leads to B cell hyperactivation followed by increased death, which contributes to the amelioration of systemic autoimmunity. These findings provide insights into the regulatory mechanisms of lymphocyte death in SLE.
Results
EAF2 deficiency reduces mortality in Faslpr mice
To assess disease progression, we examined the body condition of mice at various ages. The body weights of wild type (WT), Eaf2−/−, Faslpr, and Eaf2−/−Faslpr mice showed no significant differences over time (Figure 1A). However, EAF2 deficiency significantly prolonged the survival of Faslpr mice (Figure 1B). This was accompanied by markedly reduced lymph node enlargement in Eaf2−/−Faslpr mice (Figure 1C), particularly in the axillary (Figures 1D and 1E) and inguinal lymph nodes (Figures 1F and 1G), and diminished splenomegaly (Figures 1H and 1I).
Figure 1.

EAF2 deficiency reduces mortality in Faslpr mice
WT, Eaf2−/−, Faslpr, and Eaf2−/−Faslpr female mice were evaluated, with all mice sacrificed at 25 weeks (n ≥ 3).
(A) Body weight monitored from ages 7 to 23 weeks.
(B) Survival curves. We included 12 WT, 12 Eaf2−/−, 10 Faslpr, and 12 Eaf2−/−Faslpr female mice in the survival analysis. ∗∗p < 0.01 (Log rank test).
(C) Appearance of Faslpr and Eaf2−/−Faslpr female mice.
(D–G) (D and E) Axillary and (F and G) inguinal lymph node sizes.
(H and I) Spleen size. Lymph node and spleen weight index is expressed as mg/g body weight. Results from three or more independent experiments are shown as mean ± SEM. ∗∗p < 0.01; ∗∗∗∗p < 0.0001 (one-way ANOVA).
EAF2 deficiency alleviates lupus nephritis in Faslpr mice
Eaf2−/−Faslpr mice showed significant reductions in levels of IgG anti-sm/RNP (Figure 2A) and IgG anti-ANA antibodies (Figure 2B) compared to Faslpr mice, with no changes in IgG anti-ssDNA (Figure 2C) and anti-dsDNA (Figure 2D) antibodies. These autoantibodies form immune complexes and deposit in renal glomeruli, leading to LN,26 a major cause of mortality in SLE. Histological analyses of kidney sections stained with hematoxylin and eosin (H&E) (Figure 2E) and periodic acid-Schiff (PAS) (Figure 2F) revealed significant reductions in glomerular area (Figure 2H) and cellularity (15 glomeruli analyzed randomly for each mouse) (Figure 2I) in Eaf2−/−Faslpr mice. Additionally, EAF2 deficiency reduced glomerular immune complex deposition in Faslpr mice (Figure 2G). In agreement with the results of histological analysis, loss of EAF2 significantly lowered blood urea nitrogen (BUN) (Figure 2J) and urine protein (UP) levels (Figure 2K) in Faslpr mice. Collectively, these results indicate that EAF2 deficiency alleviates lupus nephritis in Faslpr mice.
Figure 2.

EAF2 deficiency alleviates lupus nephritis in Faslpr mice
(A–D) WT, Eaf2−/−, Faslpr, and Eaf2−/−Faslpr female mice at 17 weeks were evaluated for levels of IgG anti-sm/RNP (A), IgG anti-ANA (B), IgG anti-ssDNA (C), and IgG anti-dsDNA autoantibodies (D).
(E–G) Kidney damage evaluated at age 25 weeks (E) H&E staining of kidney sections. Scale bar: 50 μm. (F) PAS staining. Scale bar: 50 μm and 30 μm (inset). (G) IgG immune complex deposition, indicated by red arrows. Scale bar, 50 μm.
(H) Glomerular area and (I) Glomerular cell numbers.
(J and K) Levels of BUN and UP. Data analyzed using one-way ANOVA or one-tailed unpaired Student’s t test. ∗p < 0.05; ∗∗p < 0.01; ∗∗∗p < 0.001; ∗∗∗∗p < 0.0001. Results presented as mean ± SEM.
Loss of EAF2 affects B cell development and maturation in Faslpr mice
B cells, crucial for SLE progression, are categorized into B-1, comprising B-1a and B-1b, and B-2, including marginal zone (MZ) and follicular (FO), B cells.27 B-1a cells, part of the innate immune system, secrete natural antibodies to neutralize invading pathogens.28 While Faslpr mice exhibited a reduction in B-1a cells, which is consistent with previous results,29,30 EAF2 deficiency restored their levels (Figures S2A and S2E). No significant changes were observed in B-1b cells (Figure S2F). Transitional B cells, including T2 cells, were significantly reduced (Figures S2B and S2C, S2G–S2J), while T1 cells were increased in Eaf2−/−Faslpr mice (Figures S2C and S2H). In addition, the proportion of MZ B cells was restored in the absence of EAF2, with minimal impact on FO B cells (Figures S2D, S2K, and S2L).
EAF2 deficiency reduces accumulation of activated B cells, GC B cells, and plasma cells in Faslpr mice
Defective B cell apoptosis in Faslpr mice led to a marked increase in both the proportion (Figure 3A) and number (Figure 3B) of CD69+ B cells, which largely diminished in Eaf2−/−Faslpr mice. In the GC, B cells undergo massive expansion, affinity maturation, and finally differentiate into memory B cells or plasma cells that produce high-affinity antibodies.25 As shown in Figures 3C and 3D, GC B cells spontaneously accumulated in Faslpr mice, and loss of EAF2 markedly reduced both the proportion and number of GC B cells. Ex vivo apoptosis experiments conducted with annexin-V and 7-AAD staining revealed that the late (annexin-V+7AAD+) apoptotic cells were significantly reduced in Eaf2−/− mice and Faslpr mice compared to WT mice (Figures 3E and 3F), consistent with the notion that both EAF2 and FAS mediate GC B cell apoptosis. Remarkably, Eaf2−/−Faslpr GC B cells exhibited elevated proportions of the late apoptotic populations compared to Faslpr GC B cells (Figures 3E and 3F), suggesting that the dual loss of EAF2 and FAS resulted in increased death of GC B cells. Faslpr mice also contained a high proportion and absolute number of B220+CD138+ plasmablasts (Figures 3G and 3H) and B220−CD138+ plasma cells (Figures 3G and 3I) in the spleen, which were significantly reduced in the absence of EAF2. Consistent with these findings, EAF2 deficiency resulted in greatly reduced levels of total immunoglobulin M (IgM), IgA, and IgG antibodies (Figures 3J–3L).
Figure 3.

EAF2 deficiency reduces accumulation of activated B cells, GC B cells, and plasma cells in Faslpr mice
(A–D) Flow cytometry analysis of B cell activation (A and B) and GC B cell expansion (C and D).
(E and F) Proportion of apoptotic cells among GC B cells.
(G–I) Proportions and absolute numbers of PB and PC.
(J–L) Levels of total IgM, IgG, and IgA antibodies measured by ELISA. Data expressed as mean ± SEM, with statistical significance determined by one-way ANOVA and paired t test. ∗p < 0.05; ∗∗p < 0.01; ∗∗∗p < 0.001; ∗∗∗∗p < 0.0001.
EAF2 deficiency reduces excessive PC formation in Faslpr B cells by inducing cell death
To investigate whether the accumulation of plasma cells in Faslpr mice (Figures 3G–3L) is due to an intrinsic abnormality in B cells, we isolated naive B cells and induced their PC differentiation in vitro with either CD40L + IL4 + IL21 (CII) or LPS stimulation for 72 h. The purity of B cells was >90% as revealed by their B220 and CD3 expression (Figure S3A), with <1% of abnormal B220+CD3+ cells, <1% of B220+CD138+ PB, and <3% of GL7+ GC B cells (Figures S3A–S3C). In line with the in vivo data, Faslpr B cells generated a higher proportion of the B220+CD138+ plasmablasts than WT B cells under both CLL and LPS stimuli (Figures 4A, 4B, 4G , and 4H), which were significantly reduced in the absence of EAF2. ELISPOT enumeration also confirmed fewer IgM and IgG secreting cells in Eaf2−/−Faslpr mice (Figures 4C–4F; 4I–4L).
Figure 4.

Absence of EAF2 reduces excessive PC generation in Faslpr B cells by inducing cell death
Purified naive B cells from WT, Eaf2−/−, Faslpr, Eaf2−/−Faslpr female mice were induced to differentiate into PC in vitro with CII and LPS stimulation for 72 h (n ≥ 3).
(A) Representative flow cytometry plots showing PC populations (B220low/−CD138+) after CII stimulation for 72 h.
(B) Summary of results from 5 independent experiments, analyzing 5 mice from each genotype (WT, Eaf2−/−, Faslpr, and Eaf2−/−Faslpr).
(C–F) ELISPOT analysis of IgM (C and E) and IgG (D and F) plasma cells after CII stimulation.
(G and H) Proportions of PC after LPS stimulation.
(I–L) ELISPOT analysis for IgM (I and K) and IgG (J and L) plasma cells.
(M) CD86 expression in B cells after 24 h stimulation with CII or LPS.
(N–Q) Forward scatter (FSC) of live B cells and cell death after 24 h (N and O) or 72 h (P and Q) stimulation with CII or LPS. Data expressed as mean ± SEM. ∗p < 0.05; ∗∗p < 0.01; ∗∗∗∗p < 0.0001 (M, two-way ANOVA; E, F, K, and L, two-tailed unpaired Student’s t test; B, H, N–Q, paired t test).
To understand the mechanism behind the decreased PC formation in Eaf2−/−Faslpr B cells, we examined B cell activation and death during their PC differentiation in vitro. After 24 h of CII and LPS stimulation, B cells from Eaf2−/−Faslpr mice displayed significantly higher levels of CD86 expression (Figure 4M), increased cell size (Figure 4N), and reduced cell death (Figures 4O and S4B), indicating higher cellular activation compared to Faslpr mice. Similar results were obtained when Eaf2−/−Faslpr B cells were stimulated with F(ab’)2-anti-IgM antibodies, CD40L and IL4 (ACI) (Figure S4A). The increased cell size persisted even after 72 h of either CII or LPS stimulation (Figure 4P). However, these hyperactivated Eaf2−/−Faslpr B cells exhibited elevated death compared to Faslpr B cells after 72 h of stimulation (Figure 4Q and S4B). Carboxyfluorescein succinimydyl ester (CFSE) in vitro proliferation assays indicated that EAF2 deficiency did not affect B cell proliferation (Figure S4C). We hypothesize that the excessive activation of Eaf2−/−Faslpr B cells, as revealed by increased CD86 expression and significantly enlarged cell size, is followed by increased death, consequently reducing PC generation.
EAF2 deficiency reduces abnormal B220+CD3+ and CD4−CD8− double-negative T cells in Faslpr mice through enhanced apoptosis
The splenomegaly and lymphadenopathy in Faslpr mice are associated with the accumulation of aberrant B220+CD3+ T cells, the majority of which were CD4−CD8− double-negative (DN) T cells. These B220+CD3+ DN T cells contribute to autoimmunity by producing pro-inflammatory cytokines, inducing GC formation, promoting autoantibody production, and contributing to organ damage.31,32,33 Notably, the B220+CD3+ cells were significantly reduced in Eaf2−/−Faslpr mice compared to Faslpr mice (Figures 5A and 5B). To determine why the abnormal T cells accumulate in Faslpr mice, we examined the apoptosis of these B220+CD3+ cells using flow cytometry, employing annexin-V and 7-AAD staining. In Faslpr mice, there was a marked decrease in the annexin-V+7-AAD+ cells, which was significantly increased in Eaf2−/−Faslpr mice (Figures 5C and 5D). Within the B220+CD3+ cells, the proportion of the DN T cells was further reduced in Eaf2−/−Faslpr mice(Figures 5E and 5F). This reduction was associated with an increase in apoptosis (Figures 5G and 5H), indicating that EAF2 and FAS double deficiency enhanced apoptosis in the DN T population. However, EAF2 deficiency in Faslpr mice had little effect on the proliferation of these abnormal T cells, as measured by Ki-67 expression (Figure S5), suggesting that apoptosis, rather than proliferation, regulates these cells.
Figure 5.

EAF2 deficiency reduces abnormal B220+CD3+ T cells in Faslpr mice through enhanced apoptosis
(A–D) Frequency of the abnormal B220+CD3+ cells (A and B) and apoptotic cells (C and D) in WT, Eaf2−/−, Faslpr, and Eaf2−/−Faslpr female mice (7–12 weeks, n ≥ 3).
(E–H) Proportions of B220+CD3+ DN T cells (E andF) and apoptotic cells (G and H).Data in B and D are shown as mean ± SEM, with statistical significance analyzed by one-way or two-way ANOVA. ∗p < 0.05; ∗∗p < 0.01; ∗∗∗p < 0.001; ∗∗∗∗p < 0.0001.
EAF2 deletion promotes apoptosis in B220+CD3+ cells: Evidence from RNA-seq analysis
To delineate the signaling pathways involved in apoptosis, we sorted B220+CD3+ cells from Faslpr and Eaf2−/−Faslpr mice for RNA sequencing (RNA-seq) analysis. As expected, EAF2 expression was low in the abnormal T cells from Eaf2−/−Faslpr mice compared with those from Faslpr mice (Figure 6A). RNA-seq data identified 196 genes significantly down-regulated and 592 genes up-regulated in Eaf2−/−Faslpr mice compared with Faslpr group. (Q value ≤0.05; Log2FC ≥ 1) (Figure 6B). Gene Set Enrichment Analysis (GSEA) (Figure 6C) and Kyoto Encyclopedia of Genes and Genomes (KEGG) analysis (Figure 6D) highlighted significant enrichment in genes associated with apoptosis and those in the MAPK, TNF, and NF-κB signaling pathways in EAF2-deficient B220+CD3+ cells. Visualizations including a volcano plot (Figure 6E), heatmap (Figure 6F), and violin plot (Figure 6G) highlighted multiple enrichment terms emphasizing changes in both anti-apoptosis and pro-apoptosis genes. Notably, levels of anti-apoptosis genes (Figure 6G) Bcl-2 and phosphorylated-protein kinase B (Akt) were decreased in the B220+CD3+ cells of Eaf2−/−Faslpr mice, while transcription levels of pro-apoptosis genes (Figure 6H), such as Atf4, Jun, and Fos were increased. These findings underscore the role of EAF2 deficiency in promoting apoptosis within this specific T cell subset.
Figure 6.

EAF2 deletion promotes apoptosis in B220+CD3+ cells: evidence by RNA-Sequence
B220+CD3+ cells were sorted from Faslpr and Eaf2−/−Faslpr female mice aged 7–12 weeks (n = 4).
(A) Eaf2 expression in B220+CD3+ cells from Faslpr and Eaf2−/−Faslpr mice. Left, Log2 (TPM+1); right, TPM.
(B) Differentially expressed genes (DEGs) between the B220+CD3+ cells from Faslpr and Eaf2−/−Faslpr mice.
(C) Gene Set Enrichment Analysis (GSEA).
(D) KEGG bubble chart.
(E) Volcano plot.
(F) Heatmap.
(G) Expression of anti-apoptosis genes Bcl-2 and Akt.
(H) Expression of pro-apoptosis genes Atf4, Chop, Fos, and Jun. Statistics calculated by two-tailed unpaired Student’s t test, ∗∗p < 0.01; ∗∗∗p < 0.001; ∗∗∗∗p < 0.0001.
Discussion
Our previous work established that EAF2 mediates apoptosis in GC B cells, playing a crucial role in preventing excessive B cell activation and autoimmunity. Notably, the present study demonstrates that EAF2 deficiency actually ameliorates, rather than exacerbates, systemic autoimmunity in Faslpr mice. This presents a paradox where the loss of two apoptotic pathways results in an unexpected reversal of the anticipated phenotype, underscoring the complex interplay within the immune system.
Faslpr mice characteristically display immunological abnormalities including the accumulation of activated B cells, GC B cells, PC cells, and abnormal B220+CD3+ T cells, along with splenomegaly and lymph adenopathy. Remarkably, EAF2 deficiency reversed all these aberrant phenotypes, including the reduction of B220+CD3+ T cells, despite EAF2 primarily being expressed in GC B cells among the immune cells. This finding is consistent with prior studies that have highlighted the central role of B cells in lymphoproliferation observed in Faslpr mice.34,35,36 FAS expression in GC B cells has been shown to be crucial for maintaining T and B cell homeostasis.37 Thus, by promoting B cell apoptosis, EAF2 deficiency significantly mitigated the immune dysregulation in Faslpr mice.
LN is by far the major determinant of long-term prognosis and mortality in patients with SLE due to its serious complications.38,39 Similarly, Faslpr mice develop LN, resulting in a significantly shortened lifespan.40,41 Our findings show that the absence of EAF2 extended lifespan in these mice, accompanied by decreased autoantibody production, reduced immune complex deposition in the kidneys, and attenuated LN, as revealed by improved histology of glomeruli and significantly lower UP levels. Thus, EAF2 deficiency not only reverses all aberrant immune phenotypes but also substantially alleviates the lethal nephritis in Faslpr mice.
Activation-induced cell death (AICD) generally follows lymphocyte activation and is primarily mediated by FAS-FAS ligand interaction.42,43 Our data suggest that EAF2 deficiency leads to hyperactivation of Faslpr lymphocytes, which is followed by increased cell death. This is evidenced by a significant reduction in both the proportion and total number of GC B cells in Eaf2−/−Faslpr mice compared to Faslpr controls, along with increased apoptosis. Further in vitro experiments showed that Eaf2−/−Faslpr B cells expressed significantly higher levels of CD86 after 24 h of stimulation with either LPS, CD40L + IL4 + IL21 or α–IgM + CD40L + IL4, compared to Faslpr B cells. Notably, these hyperactivated cells subsequently experienced increased cell death. RNA-seq analysis also showed elevated expression of pro-apoptotic genes and a reduction in anti-apoptotic genes in the abnormal B220+CD3+ T cells from Eaf2−/−Faslpr mice. These observations collectively suggest that the concurrent deficiency of FAS and EAF2 apoptotic pathways does not merely exacerbate the expected phenotype but can lead to an opposite outcome. This outcome may resemble AICD but is not mediated by the traditional FAS-FASL system. One hypothesis is that the excessive activation and proliferation observed in Eaf2−/−Faslpr B cells may not be sustainable due to insufficient nutrition supply. It is also conceivable that the absence of both FAS and EAF2 pathways sensitizes or activates alternative cell death pathways by allowing them to utilize effector molecules typically engaged by FAS- or EAF2-triggered signals. Since the experiments were performed on F2 mice with a mixed B6 and MRL genetic background, we cannot rule out the possibility that a gene derived from B6, which may limit autoimmunity, is closely linked to the Eaf2 allele. Further studies are required to explore how the dual absence of these apoptotic pathways induces cell death. Understanding this cell death mechanism could provide valuable insights into developing alternative therapeutic strategies for lymphoproliferation disorders, such as autoimmune lymphoproliferative syndrome (ALPS), which is caused by FAS mutations, and other disorders associated with immune dysregulation and lymphocyte accumulation.
SLE is a chronic autoimmune disease predominantly affecting women, especially those of childbearing age,44 presenting with a spectrum of symptoms ranging from mild arthralgias and rash to more severe nephropathy, hematological abnormalities and neuropsychiatric involvement.45 Despite advances in understanding the mechanisms contributing to SLE, treatment options remain limited. Given the high expression of EAF2 in human B cells and Burkitt’s lymphomas (Figure S6), the potential impact of targeting EAF2 on SLE pathogenesis and B lymphomas remains to be investigated.
In summary, EAF2 deficiency in Faslpr mice led to an amelioration, rather than exacerbation, of systemic autoimmunity. Further investigation revealed that Eaf2−/−Faslpr B cells become hyperactivated upon stimulation, followed by elevated cell death. These observations underscore the complexity of the gene regulatory network in activated lymphocytes and suggest a potentially alternative approach for alleviating systemic autoimmunity caused by FAS deficiency.
Limitations of the study
This study was performed using mice with a mixed B6 and MRL genetic background. Consequently, it is possible that a gene from the B6 lineage, which may suppress autoimmunity, is closely linked to the Eaf2 allele, potentially influencing the results. Additionally, while our results indicate that Eaf2−/−Faslpr B cells are hyperactivated upon stimulation, followed by elevated cell death, the specific mechanisms that trigger alternative apoptosis pathways have not been fully elucidated and warrant further investigation.
Resource availability
Lead contact
Requests for resources and reagents should be directed to and will be fulfilled by the lead contact, Ji-Yang Wang (wang@fudan.edu.cn).
Materials availability
All materials described in this study are available from the lead contact upon request.
Data and code availability
-
•
Data: RNA-seq data have been deposited at NCBI and are publicly available as of the date of publication. Accession number is listed in the key resources table.
-
•
Code: This paper does not report the original code.
-
•
Additional information: Any additional information reported in the paper will be shared by the lead contact upon request.
Acknowledgments
We thank the members in Wang laboratory for their helpful discussions. This work was supported by the Major Research Plan of the National Natural Science Foundation of China (grant #32330033 to J.-Y.W.), the National Natural Science Foundation of China (grant #32270932 to J.-Y.W.), National Natural Science Foundation for Young Scholar (grant #82202013 to Q.M. and #82402110 to X.M.), and China Postdoctoral Science Foundation Grant (grant #2022M720782 to Q.M.).
Author contributions
Y.L. conducted most experiments and drafted the manuscript; Y.L. and Q.M. designed the experiments; R.Z. handled mouse breeding and genotyping; Z.W. assisted with flow cytometry; X.M. supervised the study; Z.H., X.F., M.Y., and L.D. analyzed data. J.-Y.W. designed the study, secured funding, and finalized the manuscript.
Declaration of interests
The authors declare no competing interests.
STAR★Methods
Key resources table
| REAGENT or RESOURCE | SOURCE | IDENTIFIER |
|---|---|---|
| Antibodies | ||
| Alexa Fluor 488 goat anti-mouse IgG (H + L) | Invitrogen | Cat#A28175; RRID: AB_2536161 |
| HRP-conjugated anti-mouse IgG (H + L) | Southern Biotech | Cat#1030-05; RRID: AB_2619742 |
| Anti-mouse Ig antibody | Southern Biotech | Cat#1010-01; RRID: AB_2794121 |
| HRP-conjugated anti-mouse IgM | Southern Biotech | Cat#1020-05; RRID: AB_2794201 |
| HRP-conjugated anti-mouse IgA | Southern Biotech | Cat#1040-05; RRID: AB_2714213 |
| Purified Rat Anti-Mouse CD16/CD32 | BD Biosciences | Cat#553142; RRID: AB_394656 |
| FITC-conjugated anti-mouse -CD43 | BD Biosciences | Cat#553270; RRID: AB_394747 |
| APC-conjugated anti-mouse -CD5 | Biolegend | Cat#100626; RRID: AB_2563929 |
| APC-Cy7-conjugated anti-mouse B220 | BD Biosciences | Cat#552094; RRID: AB_394335 |
| PE-Cyaine 7-conjugated anti-mouse B220 | Biolegend | Cat#103222; RRID: AB_313005 |
| Percp Cy5.5-conjugated anti-mouse B220 | Biolegend | Cat#103235; RRID: AB_893356 |
| APC-conjugated anti-mouse -CD93 | eBioscience | Cat#17-5892-81; RRID: AB_469465 |
| PE-Cyaine 7-conjugated anti-mouse -CD23 | Biolegend | Cat#101614; RRID: AB_2103036 |
| FITC-conjugated anti-mouse -CD21/35 | BD Biosciences | Cat#553818; RRID: AB_395070 |
| APC-conjugated anti-mouse -CD69 | BD Biosciences | Cat#560689; RRID: AB_1727506 |
| APC-conjugated anti-mouse -CD86 | Invitrogen | Cat#17-0862-82; RRID: AB_469419 |
| FITC-conjugated anti-mouse -GL-7 | Biolegend | Cat#144604; RRID: AB_2561697 |
| PE- conjugated anti-mouse -CD138 | BD Biosciences | Cat#553714; RRID: AB_395000 |
| APC- conjugated anti-mouse -CD138 | BD Biosciences | Cat#558626; RRID: AB_1645216 |
| APC-Cy7-conjugated anti-mouse -CD3 | Biolegend | Cat#152323; RRID: AB_2894632 |
| APC- conjugated anti-mouse -CD3 | Biolegend | Cat#100235; RRID: AB_2561455 |
| APC- conjugated anti-mouse -CD4 | Biolegend | Cat#100412; RRID: AB_312697 |
| PE-Cyaine 7-conjugated anti-mouse -CD8 | Biolegend | Cat#140416; RRID: AB_2564385 |
| 7-amino-actinomycin D | Invitrogen | Cat#00-6993-50 |
| APC- conjugated Annexin-V | BD Biosciences | Cat#550474; RRID: AB_2868885 |
| FITC- conjugated Annexin-V | BD Biosciences | Cat#556420; RRID: AB_2665412 |
| AP-conjugated anti-mouse IgG (H + L) | Southern Biotech | Cat#1031-04; RRID: AB_2794306 |
| AP-conjugated anti-mouse IgM | Southern Biotech | Cat#1021-04; RRID: AB_2794239 |
| F(ab’)2 anti-mouse μ chain-specific antibodies | Jackson ImmunoResearch | Cat#715-006-020; RRID: AB_2340760 |
| Chemicals, peptides, and recombinant proteins | ||
| Mouse IL-4 | R&D | Cat#404-ML |
| Mouse IL-21 | R&D | Cat#594-ML |
| Annexin-V Binding buffer | Biolegend | Cat#422201 |
| Lipopolysaccharide | Sigma | Cat#437627 |
| CD40 ligand | This paper | N/A |
| Critical commercial assays | ||
| Urine protein quantification test kit | Nanjing Jiancheng Bioengineering institute | Cat#C035-2-1 |
| Mouse B Lymphocyte Enrichment Set-DM | BD Biosciences | Cat#557792 |
| BCIP/NBT substrate | Beyotime | Cat#C3206 |
| Mouse ANA ELISA kit | Creative Diagnostics | Cat#DEIA-BJ2332 |
| Deposited data | ||
| RNA-seq data | GEO | Accession numbers :GSE278963 |
| Experimental models: Organisms/strains | ||
| MRL/lpr female mice | Jackson Laboratory | N/A |
| Eaf2−/− mice | Li et al.25 | N/A |
| Software and algorithms | ||
| GraphPad Prism | GraphPad | https://www.graphpad.com/ |
| ImageJ | NIH | https://imagej.nih.gov/ij/ |
| FlowJo | BD Biosciences | https://www.flowjo.com/ |
| SOAPnuke (v1.6.5) | Chen et al.46 | https://github.com/BGI-flexlab/SOAPnuke |
| HISAT (v2.2.1) | Kim et al.47 | http://www.ccb.jhu.edu/software/hisat |
| Bowtie2 (v2.4.5) | Langmead et al.48 | http://bowtie-bio.sourceforge.net/Bowtie2/index.shtml |
| RSEM (v1.3.1) | Li et al.49 | http://deweylab.biostat.wisc.edu/rsem/rsem-calculate-expression.html |
Experimental model and study participant details
Mouse model
MRL/lpr mice were purchased from the Jackson Laboratory (Bar Harbor, ME). Eaf2−/− mice, previously generated,25 were crossed with MRL/lpr mice to produce F1 offspring.50 These F1 mice carrying the Eaf2+/−Fas+/lpr genotype underwent brother-sister mating to generate F2 mice51 with various genotypes including WT, Eaf2−/−, Faslpr/lpr (hereafter Faslpr), and Eaf2−/−Faslpr on a mixed genetic background. F2 siblings were further mated to obtain a sufficient number of mice with various genotypes. The Eaf2 genotype was determined using previously described methods [25], and the lpr genotype was identified by genomic PCR of tail DNA following the vendor’s protocol. Twenty-four mouse tails from the initial cohort and from a subsequent one-year interval were sent to Shanghai Biowing Applied Biotechnology for genomic single nucleotide polymorphism (SNP) testing, confirming comparable genetic backgrounds across the four genotypes (Figure S1). Only female mice aged 7 to 25 weeks were used for phenotypic and functional analyses. All mice were housed under specific pathogen-free conditions at the Laboratory Animal Facility of Fudan University, with a standard diet and a 12-h light–dark cycle, maintained at controlled temperature and humidity. All animal procedures were approved by the Animal Experimentation Committee of Fudan University.
Method details
Evaluation of renal injury
Urine samples were collected biweekly from individual mice using the ‘bladder massage’ approach, and urine protein (UP) concentrations were measured at 17 weeks with a urine protein quantification test kit (C035-2-1, Nanjing Jiancheng Bioengineering institute). Serum blood urea nitrogen (BUN) levels were assessed at 17 weeks using a fully automated biochemical analyzer at the Laboratory Animal Facility of Fudan University. Kidneys were fixed in 4% polyformaldehyde, embedded in paraffin, and sectioned for staining with hematoxylin and eosin (H&E) and periodic acid-Schiff (PAS). Glomeruli areas and numbers were measured with ImageJ software. Immunofluorescence staining for immune complex deposition in kidneys was performed on 4-μm paraffin sections using Alexa Fluor 488 goat anti-mouse IgG antibody (A28175, Invitrogen).
ELISA
Sera collected at 17 weeks were analyzed for antibodies and autoantibodies using an enzyme-linked immunosorbent assay (ELISA). Plates were coated with 1 μg/mL sm/RNP and incubated overnight at 4°C. Samples or standards were added, followed by HRP-conjugated anti-mouse IgG (H + L) antibody (1030-05, Southern Biotech). For IgG anti-ssDNA detection, 10 μg/ml calf thymus DNA was denatured before coating the plates, left at room temperature for 1 h, and processed as described above. ANA levels were measured using a mouse ANA ELISA kit (DEIA-BJ2332, Creative Diagnostics) according to the manufacturer’s protocol. To analyze IgG, IgM, IgA concentrations in serum and culture supernatants of mouse splenic B cells, anti-mouse Ig antibody (1010-01, Southern Biotech) was used as the primary antibody, followed by HRP-conjugated secondary antibodies specific for IgG (H + L), IgM (1020-05, Southern Biotech), and IgA (1040-05, Southern Biotech).
Flow cytometry
Single-cell suspensions were incubated with anti-CD16/32 (2.4G2, 553142; BD Biosciences) to block FcγR, and then stained with the following fluorochrome-conjugated Abs including α-CD43(553270, BD Biosciences), α-CD5 (100626, Biolegend), α-B220 (552094, BD Biosciences; 103222, 103235, Biolegend), α-CD93 (17-5892-81, eBioscience), α-IgM (553408, BD Biosciences), α-CD23 (101614, Biolegend), α-CD21/35 (553818, BD Biosciences), α-CD69 (560689, BD Biosciences), α-CD86 (17-0862-82, Invitrogen), α-GL-7 (144604, Biolegend), α-CD138 (558626, 553714, BD Biosciences), α-CD3 (152323, 100235, Biolegend), α-CD4 (100412, Biolegend), and α-CD8 (140416, Biolegend). 7-amino-actinomycin D (7-AAD, Invitrogen, 00-6993-50) was used to distinguish live from dead cells. Samples were analyzed on a FACSVerse flow cytometer (BD Biosciences), and data were processed using FlowJo software (Tree Star, Ashland, OR, USA).
Apoptosis assay
Single cell suspensions were first stained for surface markers, washed twice with Binding buffer (422201, Biolegend), and then stained with Annexin-V (550474, BD Biosciences, 1:100) and 7-AAD (1:100) on ice for 15 min. Samples were analyzed using a FACSVerse flow cytometer (BD Biosciences), and data were processed using FlowJo software.
B cell purification and ex vivo stimulation
B cells were isolated using the Mouse B Lymphocyte Enrichment Set-DM (BD Biosciences) via magnetic bead negative selection. Briefly, splenic single-cell suspensions from mice aged 7–12 weeks were mixed with Biotinylated Mouse B Lymphocyte Enrichment Cocktail. After washing, IMag Streptavidin Particles Plus were added to the cell suspension, and the bound cells were separated using a magnetic stand. The purity of the cell population was confirmed by flow cytometry to be >90%. Purified B cells were stimulated with Lipopolysaccharide (LPS) (Sigma, 20 μg/mL), CD40 ligand (CD40L) (house made, 0.1V)52 + IL4 (R&D, 20 ng/mL) + IL21 (R&D, 30 ng/mL) (CLL), or F(ab’)2 anti-mouse μ chain-specific antibodies (Jackson ImmunoResearch, 10 μg/mL) + CD40L + IL4 (ACI), and cultured in 96-well U plates for 24 and 72 h to analyze cell activation and differentiation.
ELISPOT assay
The PVDF membrane of an ELISPOT plate was activated with 70% ethanol, coated with anti-mouse Ig antibody overnight at 4°C, and blocked for 2 h. LPS- or CII-stimulated cells were added to wells and incubated for 4 h at 37°C in a cell culture incubator. AP-conjugated secondary antibodies (anti-mouse IgG, 1031-04; anti-mouse IgM, 1021-04; SouthernBiotech) and BCIP/NBT substrate (C3206, Beyotime) were applied for detection. Data were acquired using an enzyme-linked spot analyzer, iSpot.
RNA sequencing (RNA-seq)
B220+CD3+ cells were sorted from Faslpr and Eaf2−/−Faslpr mice for RNA-Seq at BGI Genomics. The raw data was filtered with SOAPnuke46 (v1.6.5, https://github.com/BGI-flexlab/SOAPnuke) to obtain clean reads stored in FASTQ format. The clean data was mapped to the reference genome by HISAT47 (v2.2.1, http://www.ccb.jhu.edu/software/hisat). The clean data was mapped to the assembled specific gene by Bowtie248 (v2.4.5, http://bowtie-bio.sourceforge.net/Bowtie2/index.shtml). The expression level of genes was calculated by RSEM49 (v1.3.1, http://deweylab.biostat.wisc.edu/rsem/rsem-calculate-expression.html). The subsequent analysis and data mining were performed on Dr. Tom Multi-omics Data mining system (https://biosys.bgi.com) except for the volcano plot, which was depicted using an online platform for data analysis and visualization (https://www.bioinformatics.com.cn).
Quantification and statistical analysis
Statistical analyses were conducted using GraphPad Prism version 8.4.2 software. Two-tailed unpaired and paired Student’s t-tests were used to assess differences between two groups or time points, respectively. One-way and two-way ANOVA were used to test effects among multiple groups. Log rank test was used to analyze survival data in mice. p-values <0.05 were considered to be statistically significant, represented as ∗p < 0.05, ∗∗p < 0.01, ∗∗∗p < 0.001, ∗∗∗∗p < 0.0001. Data are represented as mean ± SEM, except for the body weight and survival curves.
Published: October 21, 2024
Footnotes
Supplemental information can be found online at https://doi.org/10.1016/j.isci.2024.111220.
Supplemental information
References
- 1.Pan L., Lu M.P., Wang J.H., Xu M., Yang S.R. Immunological pathogenesis and treatment of systemic lupus erythematosus. World J. Pediatr. 2020;16:19–30. doi: 10.1007/s12519-019-00229-3. https://www.ncbi.nlm.nih.gov/pubmed/30796732 [DOI] [PMC free article] [PubMed] [Google Scholar]
- 2.Wu Y., He S., Bai B., Zhang L., Xue L., Lin Z., Yang X., Zhu F., He P., Tang W., Zuo J. Therapeutic effects of the artemisinin analog SM934 on lupus-prone MRL/lpr mice via inhibition of TLR-triggered B-cell activation and plasma cell formation. Cell. Mol. Immunol. 2016;13:379–390. doi: 10.1038/cmi.2015.13. https://www.ncbi.nlm.nih.gov/pubmed/25942599 [DOI] [PMC free article] [PubMed] [Google Scholar]
- 3.Zhang Q., Xiang L., Zaman M.H., Dong W., He G., Deng G.M. Predominant Role of Immunoglobulin G in the Pathogenesis of Splenomegaly in Murine Lupus. Front. Immunol. 2019;10:3020. doi: 10.3389/fimmu.2019.03020. https://www.ncbi.nlm.nih.gov/pubmed/32082297 [DOI] [PMC free article] [PubMed] [Google Scholar]
- 4.Adachi M., Watanabe-Fukunaga R., Nagata S. Aberrant transcription caused by the insertion of an early transposable element in an intron of the Fas antigen gene of lpr mice. Proc. Natl. Acad. Sci. USA. 1993;90:1756–1760. doi: 10.1073/pnas.90.5.1756. https://www.ncbi.nlm.nih.gov/pubmed/7680478 [DOI] [PMC free article] [PubMed] [Google Scholar]
- 5.Mountz J.D., Zhou T., Bluethmann H., Wu J., Edwards C.K., 3rd Apoptosis defects analyzed in TcR transgenic and fas transgenic lpr mice. Int. Rev. Immunol. 1994;11:321–342. doi: 10.3109/08830189409051178. https://www.ncbi.nlm.nih.gov/pubmed/7528763 [DOI] [PubMed] [Google Scholar]
- 6.Wu J., Zhou T., Zhang J., He J., Gause W.C., Mountz J.D. Correction of accelerated autoimmune disease by early replacement of the mutated lpr gene with the normal Fas apoptosis gene in the T cells of transgenic MRL-lpr/lpr mice. Proceedings of the National Academy of Sciences. 1994;91:2344–2348. doi: 10.1073/pnas.91.6.2344. https://www.ncbi.nlm.nih.gov/pubmed/7510888 [DOI] [PMC free article] [PubMed] [Google Scholar]
- 7.Xiang L., Liu A., Xu G. Expression of XBP1s in B lymphocytes is critical for pristane-induced lupus nephritis in mice. Am. J. Physiol. Ren. Physiol. 2020;318:F1258–F1270. doi: 10.1152/ajprenal.00472.2019. https://www.ncbi.nlm.nih.gov/pubmed/32249615 [DOI] [PubMed] [Google Scholar]
- 8.Zheng X., Dozmorov M.G., Strohlein C.E., Bastacky S., Sawalha A.H. Ezh2 Knockout in B Cells Impairs Plasmablast Differentiation and Ameliorates Lupus-like Disease in MRL/lpr Mice. Arthritis Rheumatol. 2023;75:1395–1406. doi: 10.1002/art.42492. https://www.ncbi.nlm.nih.gov/pubmed/36897808 [DOI] [PMC free article] [PubMed] [Google Scholar]
- 9.Nickerson K.M., Smita S., Hoehn K.B., Marinov A.D., Thomas K.B., Kos J.T., Yang Y., Bastacky S.I., Watson C.T., Kleinstein S.H., Shlomchik M.J. Age-associated B cells are heterogeneous and dynamic drivers of autoimmunity in mice. J. Exp. Med. 2023;220 doi: 10.1084/jem.20221346. https://www.ncbi.nlm.nih.gov/pubmed/36828389 [DOI] [PMC free article] [PubMed] [Google Scholar]
- 10.Marinov A.D., Wang H., Bastacky S.I., van Puijenbroek E., Schindler T., Speziale D., Perro M., Klein C., Nickerson K.M., Shlomchik M.J. The Type II Anti-CD20 Antibody Obinutuzumab (GA101) Is More Effective Than Rituximab at Depleting B Cells and Treating Disease in a Murine Lupus Model. Arthritis Rheumatol. 2021;73:826–836. doi: 10.1002/art.41608. https://www.ncbi.nlm.nih.gov/pubmed/33277983 [DOI] [PMC free article] [PubMed] [Google Scholar]
- 11.Lou H., Ling G.S., Cao X. Autoantibodies in systemic lupus erythematosus: From immunopathology to therapeutic target. J. Autoimmun. 2022;132 doi: 10.1016/j.jaut.2022.102861. https://www.ncbi.nlm.nih.gov/pubmed/35872103 [DOI] [PubMed] [Google Scholar]
- 12.Chan O.T., Madaio M.P., Shlomchik M.J. B cells are required for lupus nephritis in the polygenic, Fas-intact MRL model of systemic autoimmunity. J. Immunol. 1999;163:3592–3596. https://www.ncbi.nlm.nih.gov/pubmed/10490951 [PubMed] [Google Scholar]
- 13.Chan O., Madaio M.P., Shlomchik M.J. The roles of B cells in MRL/lpr murine lupus. Ann. N. Y. Acad. Sci. 1997;815:75–87. doi: 10.1111/j.1749-6632.1997.tb52046.x. https://www.ncbi.nlm.nih.gov/pubmed/9186641 [DOI] [PubMed] [Google Scholar]
- 14.Hao F., Tian M., Feng Y., Quan C., Chen Y., Chen S., Wei M. Abrogation of Lupus Nephritis in Somatic Hypermutation-Deficient MRL/lpr Mice. J. Immunol. 2018;200:3905–3912. doi: 10.4049/jimmunol.1800115. https://www.ncbi.nlm.nih.gov/pubmed/29728506 [DOI] [PubMed] [Google Scholar]
- 15.Atisha-Fregoso Y., Toz B., Diamond B. Meant to B: B cells as a therapeutic target in systemic lupus erythematosus. J. Clin. Invest. 2021;131 doi: 10.1172/JCI149095. https://www.ncbi.nlm.nih.gov/pubmed/34128474 [DOI] [PMC free article] [PubMed] [Google Scholar]
- 16.Lee D.S.W., Rojas O.L., Gommerman J.L. B cell depletion therapies in autoimmune disease: advances and mechanistic insights. Nat. Rev. Drug Discov. 2021;20:179–199. doi: 10.1038/s41573-020-00092-2. https://www.ncbi.nlm.nih.gov/pubmed/33324003 [DOI] [PMC free article] [PubMed] [Google Scholar]
- 17.Lu L.D., Stump K.L., Wallace N.H., Dobrzanski P., Serdikoff C., Gingrich D.E., Dugan B.J., Angeles T.S., Albom M.S., Mason J.L., et al. Depletion of autoreactive plasma cells and treatment of lupus nephritis in mice using CEP-33779, a novel, orally active, selective inhibitor of JAK2. J. Immunol. 2011;187:3840–3853. doi: 10.4049/jimmunol.1101228. https://www.ncbi.nlm.nih.gov/pubmed/21880982 [DOI] [PubMed] [Google Scholar]
- 18.Hoffman W., Lakkis F.G., Chalasani G. B Cells, Antibodies, and More. Clin. J. Am. Soc. Nephrol. 2016;11:137–154. doi: 10.2215/CJN.09430915. https://www.ncbi.nlm.nih.gov/pubmed/26700440 [DOI] [PMC free article] [PubMed] [Google Scholar]
- 19.Xiao W., Zhang Q., Jiang F., Pins M., Kozlowski J.M., Wang Z. Suppression of prostate tumor growth by U19, a novel testosterone-regulated apoptosis inducer. Cancer Res. 2003;63:4698–4704. https://www.ncbi.nlm.nih.gov/pubmed/12907652 [PubMed] [Google Scholar]
- 20.Luo R.T., Lavau C., Du C., Simone F., Polak P.E., Kawamata S., Thirman M.J. The elongation domain of ELL is dispensable but its ELL-associated factor 1 interaction domain is essential for MLL-ELL-induced leukemogenesis. Mol. Cell Biol. 2001;21:5678–5687. doi: 10.1128/MCB.21.16.5678-5687.2001. https://www.ncbi.nlm.nih.gov/pubmed/11463848 [DOI] [PMC free article] [PubMed] [Google Scholar]
- 21.Simone F., Luo R.T., Polak P.E., Kaberlein J.J., Thirman M.J. ELL-associated factor 2 (EAF2), a functional homolog of EAF1 with alternative ELL binding properties. Blood. 2003;101:2355–2362. doi: 10.1182/blood-2002-06-1664. https://www.ncbi.nlm.nih.gov/pubmed/12446457 [DOI] [PubMed] [Google Scholar]
- 22.Simone F., Polak P.E., Kaberlein J.J., Luo R.T., Levitan D.A., Thirman M.J. EAF1, a novel ELL-associated factor that is delocalized by expression of the MLL-ELL fusion protein. Blood. 2001;98:201–209. doi: 10.1182/blood.v98.1.201. https://www.ncbi.nlm.nih.gov/pubmed/11418481 [DOI] [PubMed] [Google Scholar]
- 23.Kong S.E., Banks C.A.S., Shilatifard A., Conaway J.W., Conaway R.C. ELL-associated factors 1 and 2 are positive regulators of RNA polymerase II elongation factor ELL. Proc. Natl. Acad. Sci. USA. 2005;102:10094–10098. doi: 10.1073/pnas.0503017102. https://www.ncbi.nlm.nih.gov/pubmed/16006523 [DOI] [PMC free article] [PubMed] [Google Scholar]
- 24.Luo Z., Lin C., Shilatifard A. The super elongation complex (SEC) family in transcriptional control. Nat. Rev. Mol. Cell Biol. 2012;13:543–547. doi: 10.1038/nrm3417. https://www.ncbi.nlm.nih.gov/pubmed/22895430 [DOI] [PubMed] [Google Scholar]
- 25.Li Y., Takahashi Y., Fujii S.i., Zhou Y., Hong R., Suzuki A., Tsubata T., Hase K., Wang J.Y. EAF2 mediates germinal centre B-cell apoptosis to suppress excessive immune responses and prevent autoimmunity. Nat. Commun. 2016;7 doi: 10.1038/ncomms10836. https://www.ncbi.nlm.nih.gov/pubmed/26935903 [DOI] [PMC free article] [PubMed] [Google Scholar]
- 26.Fang T., Li B., Li M., Zhang Y., Jing Z., Li Y., Xue T., Zhang Z., Fang W., Lin Z., et al. Engineered Cell Membrane Vesicles Expressing CD40 Alleviate System Lupus Nephritis by Intervening B Cell Activation. Small Methods. 2023;7 doi: 10.1002/smtd.202200925. https://www.ncbi.nlm.nih.gov/pubmed/36605001 [DOI] [PubMed] [Google Scholar]
- 27.Wang Y., Liu J., Burrows P.D., Wang J.Y. B Cell Development and Maturation. Adv. Exp. Med. Biol. 2020;1254:1–22. doi: 10.1007/978-981-15-3532-1_1. https://www.ncbi.nlm.nih.gov/pubmed/32323265 [DOI] [PubMed] [Google Scholar]
- 28.Yamamoto W., Toyoda H., Xu D.Q., Hanaki R., Morimoto M., Nakato D., Ito T., Iwamoto S., Bonno M., Tanaka S., Hirayama M. CD3+ B-1a Cells as a Mediator of Disease Progression in Autoimmune-Prone Mice. Mediat. Inflamm. 2018;2018 doi: 10.1155/2018/9289417. https://www.ncbi.nlm.nih.gov/pubmed/30670930 [DOI] [PMC free article] [PubMed] [Google Scholar]
- 29.Reap E.A., Sobel E.S., Cohen P.L., Eisenberg R.A. Conventional B cells, not B-1 cells, are responsible for producing autoantibodies in lpr mice. J. Exp. Med. 1993;177:69–78. doi: 10.1084/jem.177.1.69. https://www.ncbi.nlm.nih.gov/pubmed/8418209 [DOI] [PMC free article] [PubMed] [Google Scholar]
- 30.Lech M., Weidenbusch M., Kulkarni O.P., Ryu M., Darisipudi M.N., Susanti H.E., Mittruecker H.W., Mak T.W., Anders H.J. IRF4 deficiency abrogates lupus nephritis despite enhancing systemic cytokine production. J. Am. Soc. Nephrol. 2011;22:1443–1452. doi: 10.1681/ASN.2010121260. https://www.ncbi.nlm.nih.gov/pubmed/21742731 [DOI] [PMC free article] [PubMed] [Google Scholar]
- 31.Li H., Tsokos G.C. Double-negative T cells in autoimmune diseases. Curr. Opin. Rheumatol. 2021;33:163–172. doi: 10.1097/BOR.0000000000000778. https://www.ncbi.nlm.nih.gov/pubmed/33394752 [DOI] [PMC free article] [PubMed] [Google Scholar]
- 32.Velikkakam T., Gollob K.J., Dutra W.O. Double-negative T cells: Setting the stage for disease control or progression. Immunology. 2022;165:371–385. doi: 10.1111/imm.13441. https://www.ncbi.nlm.nih.gov/pubmed/34939192 [DOI] [PMC free article] [PubMed] [Google Scholar]
- 33.Wu Z., Zheng Y., Sheng J., Han Y., Yang Y., Pan H., Yao J. CD3(+)CD4(-)CD8(-) (Double-Negative) T Cells in Inflammation, Immune Disorders and Cancer. Front. Immunol. 2022;13 doi: 10.3389/fimmu.2022.816005. https://www.ncbi.nlm.nih.gov/pubmed/35222392 [DOI] [PMC free article] [PubMed] [Google Scholar]
- 34.Chan O.T., Hannum L.G., Haberman A.M., Madaio M.P., Shlomchik M.J. A novel mouse with B cells but lacking serum antibody reveals an antibody-independent role for B cells in murine lupus. J. Exp. Med. 1999;189:1639–1648. doi: 10.1084/jem.189.10.1639. https://www.ncbi.nlm.nih.gov/pubmed/10330443 [DOI] [PMC free article] [PubMed] [Google Scholar]
- 35.Chan O.T., Madaio M.P., Shlomchik M.J. The central and multiple roles of B cells in lupus pathogenesis. Immunol. Rev. 1999;169:107–121. doi: 10.1111/j.1600-065x.1999.tb01310.x. https://www.ncbi.nlm.nih.gov/pubmed/10450512 [DOI] [PubMed] [Google Scholar]
- 36.Akashi T., Nagafuchi S., Anzai K., Kitamura D., Wang J., Taniuchi I., Niho Y., Watanabe T. Proliferation of CD3+ B220- single-positive normal T cells was suppressed in B-cell-deficient lpr mice. Immunology. 1998;93:238–248. doi: 10.1046/j.1365-2567.1998.00416.x. https://www.ncbi.nlm.nih.gov/pubmed/9616374 [DOI] [PMC free article] [PubMed] [Google Scholar]
- 37.Hao Z., Duncan G.S., Seagal J., Su Y.W., Hong C., Haight J., Chen N.J., Elia A., Wakeham A., Li W.Y., et al. Fas receptor expression in germinal-center B cells is essential for T and B lymphocyte homeostasis. Immunity. 2008;29:615–627. doi: 10.1016/j.immuni.2008.07.016. https://www.ncbi.nlm.nih.gov/pubmed/18835195 [DOI] [PMC free article] [PubMed] [Google Scholar]
- 38.Li Y., Ding T., Chen J., Ji J., Wang W., Ding B., Ge W., Fan Y., Xu L. The protective capability of Hedyotis diffusa Willd on lupus nephritis by attenuating the IL-17 expression in MRL/lpr mice. Front. Immunol. 2022;13 doi: 10.3389/fimmu.2022.943827. https://www.ncbi.nlm.nih.gov/pubmed/35958622 [DOI] [PMC free article] [PubMed] [Google Scholar]
- 39.Anders H.J., Saxena R., Zhao M.H., Parodis I., Salmon J.E., Mohan C. Lupus nephritis. Nat. Rev. Dis. Prim. 2020;6:7. doi: 10.1038/s41572-019-0141-9. https://www.ncbi.nlm.nih.gov/pubmed/31974366 [DOI] [PubMed] [Google Scholar]
- 40.Andrews B.S., Eisenberg R.A., Theofilopoulos A.N., Izui S., Wilson C.B., McConahey P.J., Murphy E.D., Roths J.B., Dixon F.J. Spontaneous murine lupus-like syndromes. Clinical and immunopathological manifestations in several strains. J. Exp. Med. 1978;148:1198–1215. doi: 10.1084/jem.148.5.1198. https://www.ncbi.nlm.nih.gov/pubmed/309911 [DOI] [PMC free article] [PubMed] [Google Scholar]
- 41.Elshikha A.S., Lu Y., Chen M.J., Akbar M., Zeumer L., Ritter A., Elghamry H., Mahdi M.A., Morel L., Song S. Alpha 1 Antitrypsin Inhibits Dendritic Cell Activation and Attenuates Nephritis in a Mouse Model of Lupus. PLoS One. 2016;11 doi: 10.1371/journal.pone.0156583. https://www.ncbi.nlm.nih.gov/pubmed/27232337 [DOI] [PMC free article] [PubMed] [Google Scholar]
- 42.Green D.R., Droin N., Pinkoski M. Activation-induced cell death in T cells. Immunol. Rev. 2003;193:70–81. doi: 10.1034/j.1600-065x.2003.00051.x. https://www.ncbi.nlm.nih.gov/pubmed/12752672 [DOI] [PubMed] [Google Scholar]
- 43.Arakaki R., Yamada A., Kudo Y., Hayashi Y., Ishimaru N. Mechanism of activation-induced cell death of T cells and regulation of FasL expression. Crit. Rev. Immunol. 2014;34:301–314. doi: 10.1615/critrevimmunol.2014009988. https://www.ncbi.nlm.nih.gov/pubmed/24941158 [DOI] [PubMed] [Google Scholar]
- 44.Tsokos G.C. Systemic lupus erythematosus. N. Engl. J. Med. 2011;365:2110–2121. doi: 10.1056/NEJMra1100359. https://www.ncbi.nlm.nih.gov/pubmed/22129255 [DOI] [PubMed] [Google Scholar]
- 45.Moore E., Putterman C. Are lupus animal models useful for understanding and developing new therapies for human SLE? J. Autoimmun. 2020;112 doi: 10.1016/j.jaut.2020.102490. https://www.ncbi.nlm.nih.gov/pubmed/32535128 [DOI] [PMC free article] [PubMed] [Google Scholar]
- 46.Chen Y., Chen Y., Shi C., Huang Z., Zhang Y., Li S., Li Y., Ye J., Yu C., Li Z., et al. SOAPnuke: a MapReduce acceleration-supported software for integrated quality control and preprocessing of high-throughput sequencing data. GigaScience. 2018;7:1–6. doi: 10.1093/gigascience/gix120. https://www.ncbi.nlm.nih.gov/pubmed/29220494 [DOI] [PMC free article] [PubMed] [Google Scholar]
- 47.Kim D., Langmead B., Salzberg S.L. HISAT: a fast spliced aligner with low memory requirements. Nat. Methods. 2015;12:357–360. doi: 10.1038/nmeth.3317. https://www.ncbi.nlm.nih.gov/pubmed/25751142 [DOI] [PMC free article] [PubMed] [Google Scholar]
- 48.Langmead B., Salzberg S.L. Fast gapped-read alignment with Bowtie 2. Nat. Methods. 2012;9:357–359. doi: 10.1038/nmeth.1923. https://www.ncbi.nlm.nih.gov/pubmed/22388286 [DOI] [PMC free article] [PubMed] [Google Scholar]
- 49.Li B., Dewey C.N. RSEM: accurate transcript quantification from RNA-Seq data with or without a reference genome. BMC Bioinf. 2011;12:323. doi: 10.1186/1471-2105-12-323. https://www.ncbi.nlm.nih.gov/pubmed/21816040 [DOI] [PMC free article] [PubMed] [Google Scholar]
- 50.Qian Y., Conway K.L., Lu X., Seitz H.M., Matsushima G.K., Clarke S.H. Autoreactive MZ and B-1 B-cell activation by Faslpr is coincident with an increased frequency of apoptotic lymphocytes and a defect in macrophage clearance. Blood. 2006;108:974–982. doi: 10.1182/blood-2005-12-006858. https://www.ncbi.nlm.nih.gov/pubmed/16861350 [DOI] [PMC free article] [PubMed] [Google Scholar]
- 51.Jarad G., Lakhe-Reddy S., Blatnik J., Koepke M., Khan S., El-Meanawy M.A., O'Connor A.S., Sedor J.R., Schelling J.R. Renal phenotype is exacerbated in Os and lpr double mutant mice. Kidney Int. 2004;66:1029–1035. doi: 10.1111/j.1523-1755.2004.00851.x. https://www.ncbi.nlm.nih.gov/pubmed/15327396 [DOI] [PubMed] [Google Scholar]
- 52.Lai N., Min Q., Xiong E., Liu J., Zhang L., Yasuda S., Wang J.Y. A tetrameric form of CD40 ligand with potent biological activities in both mouse and human primary B cells. Mol. Immunol. 2019;105:173–180. doi: 10.1016/j.molimm.2018.11.018. https://www.ncbi.nlm.nih.gov/pubmed/30529036 [DOI] [PubMed] [Google Scholar]
Associated Data
This section collects any data citations, data availability statements, or supplementary materials included in this article.
Supplementary Materials
Data Availability Statement
-
•
Data: RNA-seq data have been deposited at NCBI and are publicly available as of the date of publication. Accession number is listed in the key resources table.
-
•
Code: This paper does not report the original code.
-
•
Additional information: Any additional information reported in the paper will be shared by the lead contact upon request.