Abstract
Aims
To investigate the potential mechanisms of fatty acid metabolism (FAM)-related genes in IgA nephropathy (IgAN) and to explore its immune cell infiltration characteristic.
Methods
Datasets for IgAN and FAM-related genes were obtained from GEO and MSigDB database, respectively. We employed differential expression analysis and WGCNA to identify common genes. GO and KEGG analyses were performed to compare the differences between IgAN and control groups. Furthermore, LASSO logistic regression was applied to develop a predictive model based on FAM-related genes. The efficacy of this prognostic model was evaluated using ROC analysis. The infiltration of immune cells and immune-related functions were assessed with CIBERSORT tool. Finally, the identified key genes were validated in blood samples from IgAN and control patients, as well as in human mesangial cells (HMCs) following Gd-IgA stimulation using Real-time PCR.
Results
A total of 12 hub genes linked to FAM were identified in patients with IgAN. A predictive model consisting of four genes was conducted through COX and LASSO regression analysis, revealing AUC values that indicate a relatively strong diagnostic capability. Immune infiltration analysis indicated that various immune cells have significant associations with IgAN. Additionally, Real-time PCR assays confirmed that the expression levels of hub genes were markedly reduced in IgAN patients and in Gd-IgA treated HMCs compared to controls.
Conclusion
This study employed bioinformatics methods to unveiled the immune cell infiltration associated with IgAN and to explore the potential genetic connection between FAM and IgAN. This could aid in predicting the risk of IgAN and enhance both diagnosis and prognosis of this condition.
Keywords: IgA nephropathy, fatty acid metabolism, hub gene, immune response
Introduction
IgA nephropathy (IgAN) is the most prevalent form of primary glomerulonephritis (GN) worldwide and is a significant contributor to end-stage renal disease (ESRD)[1]. In Southeast Asia, IgAN accounts for 30–50% of diagnoses from renal biopsies, indicating its high prevalence in this region[2]. Within Asian countries, the incidence rates are comparatively higher in China and Japan [3, 4]. To facilitate rapid prognostic assessment and evaluate progression risk, employing less invasive methods such as blood-based biomarkers is preferred over renal biopsy in clinical settings.
Fatty acid (FA) metabolism, which encompasses both catabolic and anabolic process, plays a crucial role in energy production and storage, cell membrane proliferation, and the generation of signaling molecules[5]. There is growing interest in FA metabolism regarding tumor development, disease progression, and resistance associated with obesity [6]. Furthermore, FA metabolism is vital for the adaptive immune response, especially in T cells and macrophages. As we known, an important aspect in the pathogenesis of IgAN is the enhanced influx of leukocytes, including the monocyte and macrophage lineage, into the glomerulus[7]. In IgAN, monocytes/macrophages and T cells infiltrate the glomerulus and/or interstitial compartments are involved in mesangial proliferation and the development of glomerulus [8, 9], with the degree of infiltration reflecting the severity of renal histological damage and the degree of proteinuria [9–11]. A study showed that continuous or recurrent glomerular leukocyte infiltration was associated with therapeutic resistance[12]. The kidneys exhibit the highest basal energy demands among organs, primarily due to their reliance on mitochondrial β-oxidation of FAs. FA metabolites produced by gut bacteria have been found to have a substantial impact on the immunity. Therefore, a systematic understanding of the biological role of FA metabolism will provide in-depth insights into the causes of immune dysfunction in IgAN. Further exploration of the link between FA metabolism-related genes and IgAN is warranted.
Bioinformatics analysis serves as a robust method for predicting molecular pathways and gene interactions [13–15]. Recently, microarray and bioinformatic techniques have been extensively employed to identify candidate biomarker genes and enhance the understanding of the molecular pathogenesis in various diseases, although research specifically focused on IgAN remains limited [16–19]. In 2022, Wu et al. identified a five-gene set (DUSP1, FOS, JUN, EGR1, and FOSB) selected through support vector machine (SVM), least absolute shrinkage and selection operator (LASSO), and partial least square discriminant analysis (PLS-DA)[16]. Additionally, weighed gene co-expression network analysis (WGCNA) and differential expression gene (DEG) analysis pinpointed DUSP1 and FOSB as potential targets for intervention and treatment of IgAN [19].
This study aimed to determine whether the FAM pathway could be serve as a prognostic indicator for patients with IgAN. To achieve this, we leveraged extensive public resources and bioinformatics techniques to identify 12 hub genes associated with FAM and IgAN through differential analysis and WGCNA. We further examined the biological processes and pathways via Gene Ontology (GO) and Gene Set Enrichment Analysis (GSEA). Individualized FAM-derived profiles were established using logistic regression analyses to assess the overall prognostic significance for IgAN patients. Additionally, we explored immune infiltration in these samples and the relationships between various immune factors and the identified hub genes. Subsequently, in vitro experiments were conducted using peripheral blood from IgAN patients and healthy controls, along with HMCs treated with Gd-IgA to stimulate IgAN in vitro. This study unraveled the immune regulatory mechanisms involved in the progression of IgAN and identified 4 hub genes, which may serve as potential biomarkers for noninvasive diagnosis, while validating the prognostic significance of IgAN patient signature across different therapeutic strategies.
Methods
Data collection and acquisition
Gene expression data of IgAN patients were obtained from the NCBI Gene Expression Omnibus public database (GEO, www.ncbi.nlm.nih.gov/geo/). The GSE93798 dataset, comprising 22 healthy control samples and 20 IgAN kidney tissue samples, was chosen. Probes were converted to gene symbols according to the GPL22945 platform (Affymetrix Human Genome U133 Plus 2.0 Array). The GSE37460 dataset, annotated by GPL14663 (Affymetrix GeneChip Human Genome HG-U133A Custom CDF) and GPL11670 (Affymetrix Human Genome U133 Plus 2.0 Array), included 27 IgAN samples and 27 healthy control samples. Datasets GSE141295 and GSE104948 were utilized as verification sets. All data were publicly accessible.
Data processing and differential expression analysis
We utilized two microarray datasets, GSE93798 and GSE37460, normalizing their expression matrices and annotating the probes using the respective annotation files. Batch correction for the datasets was performed using the ComBat algorithm of R software’s ‘SVA’ package. Following ID conversion, differential expression analysis between IgAN and healthy control samples was performed using the ‘limma’ package in R software. Genes with a p-value < 0.01 and |log2FC| > 2.0 were classified as differentially expressed genes (DEGs). Heat maps and volcano plots of these DEGs were generated using the ‘pheatmap’ and ‘ggplot2’ packages.
Weighted correlation network analysis (WGCNA)
WGCNA was performed in accordance with established methods in the literature[20]. This analysis was conducted on the differential genes identified in GSE93798 and GSE37460. We calculated the Median Absolute Deviation (MAD) for each gene, discarding the top 50% of genes with the least MAD. The relationships between modules and traits were established through Pearson’s correlation test. Gene significance (GS) was represented by the correlation coefficient between gene expression and phenotype, representing the relationship between genes and phenotypes, which were retained for further analysis [21].
Fatty acid metabolism-related genes (FAM)
We obtained two sets of fatty acid metabolism-related gene from the Molecular Signatures Database v7.5.1 (MSigDB; www.gsea-msigdb.org), which included the Kyoto Encyclopedia of Genes and Genomes (KEGG) pathway database (Pathway: hsa00071) and the Reactome database (R-HSA-8978868), detained in Supplementary 1.
Identification of hub genes
We identified 12 overlapping hub genes associated with both fatty acid metabolism and IgAN (FAM-IgAN). The intersection of DEGs, genes derived from WGCNA, and genes from the fatty acid metabolism gene sets was determined using the ‘VennDiagram’ package in R software.
Functional enrichment, pathway analysis of hub genes
Gene Ontology (GO) analysis and Kyoto Encyclopedia of Genes and Genomes (KEGG) pathway enrichment analyses were performed using the ‘clusterProfiler’ R package, with an adjusted p-value < 0.05 set as the threshold. The functions of each hub genes were elucidated using Gene Set Enrichment Analysis (GSEA). IgAN patients were differentiated into two groups (low expression group and high expression group) based on the median hub gene expression levels. We calculated the consistency p-value for each gene set, with p-values less than 0.05 considered significantly enriched. All analyses were conducted using the ‘clusterProfiler’ package in R software.
Construction of the fatty acid metabolism-related risk signature
To identify diagnostic markers for IgAN, we applied the least absolute shrinkage and selection operator (LASSO) regression via the ‘glmnet’ package, using a regression penalty score of 0.0368. Then risk score for the predictive model was calculated. The diagnostic accuracy was measured using receiver operating characteristic curves (ROCs) and the area under the ROC curve (R package: survivalROC).
Assessment of immune cell subtype distribution
CIBERSORT was utilized to convert a normalized gene expression matrix into the proportions of 22 different immune cell types through a deconvolution algorithm. In this study, CIBERSORT was applied to determine the immune cell composition in samples from patients with IgAN and healthy controls.
Analysis of correlations and differences in immune‑infiltrated cells
The relationships between the expression levels of hub genes and immune cell infiltration were determined using Pearson correlation coefficients (r) greater than 0.4 with a significance level of p < 0.05. The Pearson correlation coefficients were obtained from the data filtered by CIBERSORT, with p values below 0.05.
HMC culture and treatment
Human mesangial cells (HMCs) were obtained from Pricella (CP-H067, Shanghai, China) and cultured in RPMI-1640 supplemented with 10% FBS, 100 U/mL penicillin, and 100 mg/ml streptomycin. An in vitro model of IgAN was established by treating HMCs with extracted Gd-IgA1 as previously described[17]. HMCs were cultured in a serum-free medium and treated with 1 mg/ml Gd-IgA1 for 24 h once they reached 70–80% confluence.
Human subjects
The study included 25 patients diagnosed with IgAN through biopsy, who were recruited from Xinhua Hospital, Shanghai Jiaotong University School of Medicine, Shanghai, China, between July 2021 and July 2023. Healthy controls (n = 25) were selected from age-match normal individuals who underwent regular health examinations.
RNA extraction and real-time PCR
Total RNA was extracted from peripheral blood and HMCs using Trizol reagent (Tiangen Biotech, Beijing, China). cDNA synthesis was performed using cDNA synthesis kit (HiScript II Q RT SuperMix for qPCR, Vazyme, China) following standard protocols. The resulting cDNA was analyzed using an ABI ViiA 7 real-time polymerase chain reaction system to detect mRNA expression for RT-PCR. All primers were synthesized by Sangon Biotech (Sangon, Shanghai, China). The relative mRNA expression levels were calculated using the 2-ΔΔCt method, involving three replicates, with GAPDH as the internal control. A summary of all primers is provided in Supplementary 2.
Statistical analysis
All statistical analyses were performed in R software. The t-test and Mann–Whitney U-test were chosen based on the normality of the data distribution. Both COX and LASSO regression analyses were utilized to assess the diagnostic significance of the predictive mode, with p < 0.05 considered statistically significant.
Results
Identification of hub genes related to IgAN and fatty acid metabolism
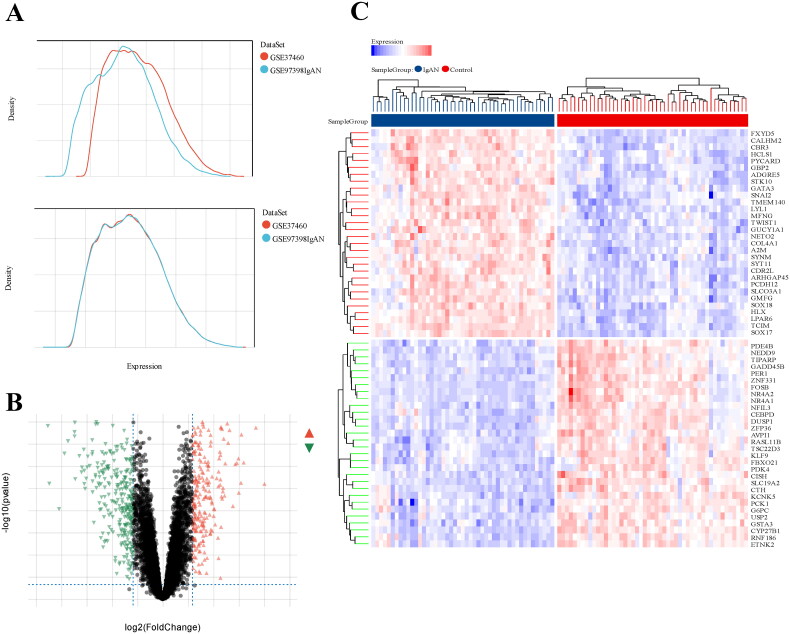
The integrated datasets from GSE93798 and GSE37460 comprised 40 healthy control samples and 47 samples from IgAN patients. We standardized the initial expression data from two datasets and subsequently compared the gene expression levels between IgAN patient samples and those from healthy control group (Figure 1(A)). A total of 561 differentially expressed genes (DEGs) were identified, including 259 were upregulated and 302 downregulated genes, with a significance threshold of 1.5-fold change (p < 0.05). The volcano plot in Figure 1(B) shows the expression profiles of all DEGs across the two datasets, while the heatmap displays the top 30 DEGs (Figure 1(C)).
Figure 1.
Differentially expressed genes between IgAN and healthy control samples. (A) a density map was utilized to eliminate batch effect. (B) a volcano plot illustrates the DEGs between the two groups, with red genes indicating high expression in IgAN, green genes showing low expression, and gray genes reflecting no significant changes. (C) a heat map displays the top 30 transcriptome expressions of DEGs between the two groups. Datasets from GSE93798 and GSE37460.
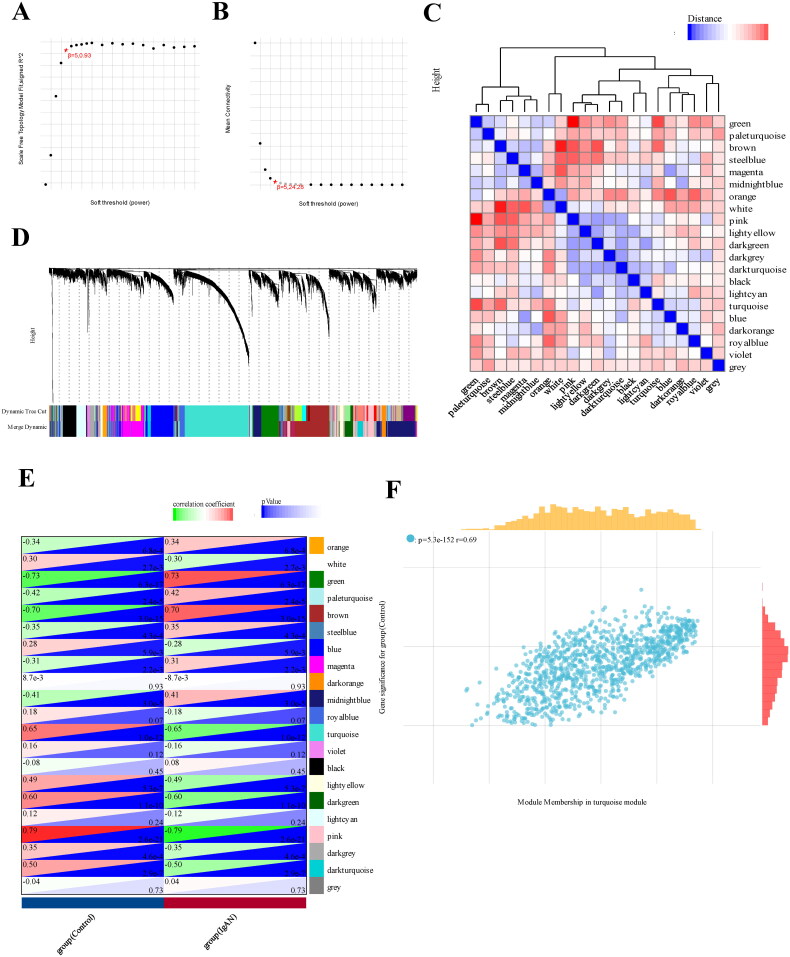
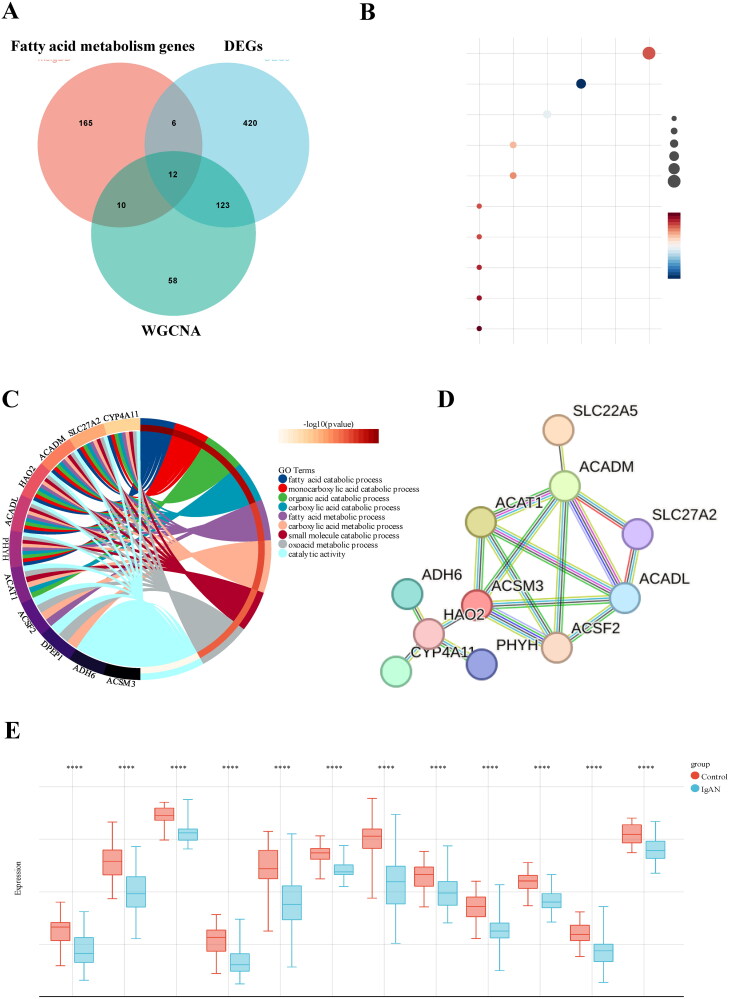
Next, we employed a weighed gene co-expression network (WGCNA) using the expression profiles of 11629 genes and 96 samples from GSE93798 and GSE37460 to construct a co-expression network. A soft threshold power of 5 was applied, resulting in a scale independence of 0.93 and an average connectivity of 24.28 (Figure 2(A,B)). We further visualized the gene network through a heatmap and metamodules, with the grey module representing genes that did not fit into any specific module (Figure 2(C,D)). Figure 2(E) illustrates the correlations between the modules and clinical traits, showing that the turquoise module displaying the strongest positive correlation with IgAN (r=-0.65, p = 1.0e-12). We identified 203 genes with high connectivity within the clinically relevant module as hub genes based on a cutoff criterion (|MM| > 0.8) (Figure 2(F)). In addition, Venn analysis was applied to identify overlapping genes among the 561 DEGs, 203 turquoise module genes, and 193 genes related to FAM from Reactome and KEGG databases, resulting in the identification of 12 hub genes for further investigation (Figure 3(A)).
Figure 2.
WGCNA analysis of differentially expressed genes. (A) a cluster dendrogram representing 96 kidney tissue samples, including 47 IgAN samples and 49 healthy control samples, along with the corresponding mean connectivity values at various soft threshold powers. (B) a cluster dendrogram of the genes. (C) Correlations between module eigengenes and clinical traits of IgAN. (D) a cluster dendrogram of differentially expressed genes to identify the clinically significant modules associated with IgAN. (E) Relationships between different modules and clinical traits, where red represents positive correlation and blue indicates negative correlation. (F) Correlation of module membership and gene significance within the turquoise module. Datasets from GSE93798 and GSE37460.
Figure 3.
GO and KEGG pathway enrichment analysis of DEGs. (A) 12 hub genes were identified by intersecting the DEGs, turquoise module genes from WGCNA, and fatty acid metabolism-related genes. (B) KEGG pathway enrichment analysis of the common genes. (C) GO analysis of the shared genes. (D) a PPI network of the 12 hub genes constructed using STRING. (E) Expression levels of the 12 hub genes in kidney tissue samples from IgAN and control groups. Datasets from GSE93798 and GSE37460.
Biological processes and pathways enriched for hub genes
GO and KEGG enrichment analyses were performed on the 12 hub genes to assess their biological functions. The KEGG pathway analysis showed significant enrichment of the hub genes in metabolic pathways, fatty acid degradation, PPAR signaling pathway, fatty acid metabolism pathway, and peroxisomal processes (Figure 3(B)). The GO analysis suggested that the shared genes are likely involved in fatty acid catabolic processes, monocarboxylic acid catabolic processes, organic acid catabolic processes, fatty acid metabolic processes and small molecule catabolic processes (Figure 3(C)). To further explore the interactions among these hub genes, we conducted a protein-protein interaction (PPI) analysis using the STRING platform, with results depicted in Figure 3(D). Boxplots showed that these 12 hub genes were expressed at lower levels in IgAN patients compared to those in the non-diseased (ND) group (Figure 3(E)).
Construction of a FAM-IgAN-related gene predictive model
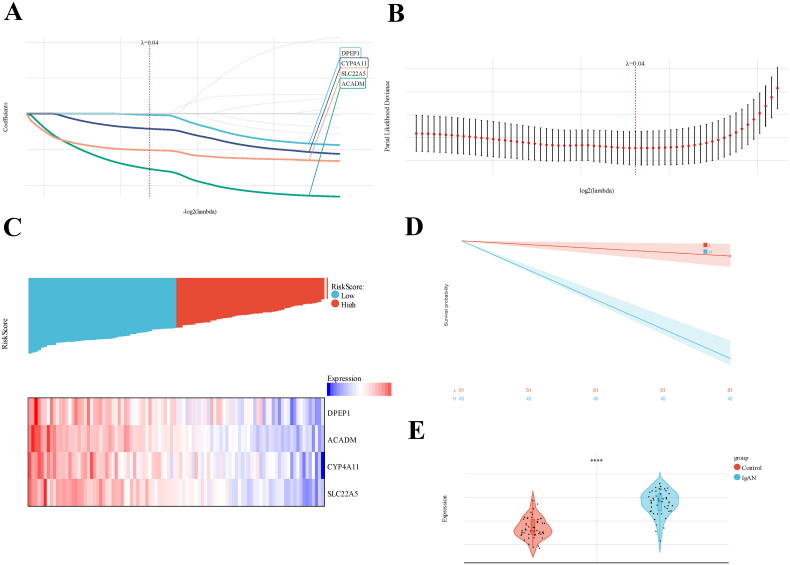
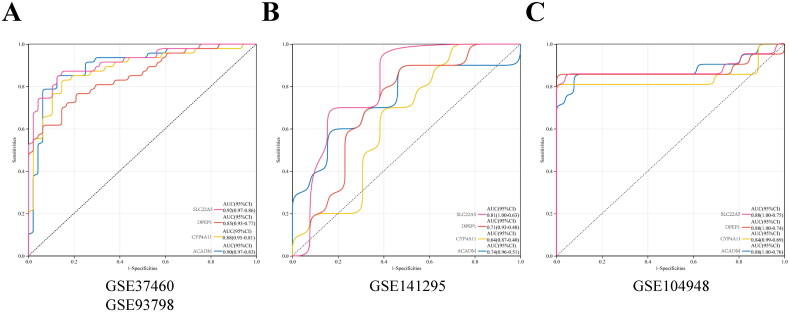
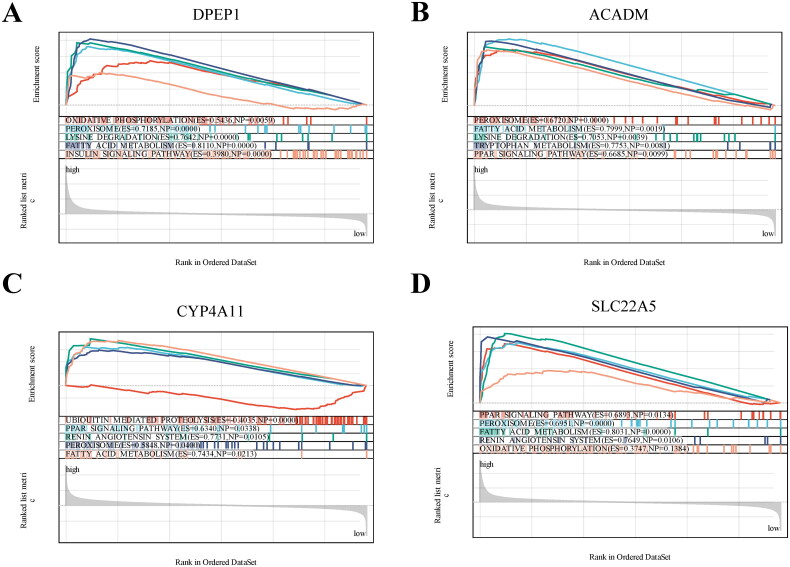
To establish a gene prognostic signature based on the 12 overlapping genes, we employed COX regression analysis. 5 of 12 genes (ACADM, SLC22A5, CYP4A11, DPEP1, ACAT1) showed statistical significance (p < 0.05) and were retained for further exploration. Subsequently, LASSO regression analysis identified 4 out of the 5 genes as optional candidates for the predictive model based on the optimum λ value (Figure 4(A,B)). The 4 FAM-related genes selected were DPEP1, ACADM, CYP4A11 and SLC22A5. Utilizing these genes, a risk-score model was developed using the follow algorithm: RiskScore=-0.0180*DPEP1-0.773*ACADM-0.211*CYP4A11-0.510*SLC22A5. Based on the median risk score, IgAN patients were categorized into high-risk and low-risk groups (Figure 4(C)). As shown in Figure 4(C), patients classified in the high-risk group exhibited higher expression levels of the four candidate genes compared to those in the low-risk group. The Kaplan-Meier survival analysis exhibited a notable difference between the two risk groups, with patients in the low-risk category demonstrating better overall survival compared to their high-risk counterparts (Figure 4(D)). When comparing risk scores between the IgAN group and healthy controls, we observed that the risk score in the IgAN cohort was significantly lower than that in the control group (Figure 4(E)). ROC analysis indicated that the predictive model based on these four genes exhibited strong diagnostic performance, as all AUC values exceeded 0.85 (Figure 5(A)). Further validation of the model was conducted using two additional datasets, GSE141295 and GSE104948, both of which displayed relatively higher AUCs (Figure 5(B,C)). To identify the potential biological functions associated with the IgAN risk score, Gene Set Enrichment Analysis (GSEA) of IgAN-FAM-related genes indicated significant connections to the PPAR signaling pathway, peroxisome, oxidative phosphorylation, and fatty acid metabolism (Figure 6(A–D)).
Figure 4.
Develpment of IgAN diagnostic model using LASSO-based logistic regression analysis. (A) Construction and screening of a diagnostic model based on 5 hub genes through LASSO-based logistic regression; (B) Univariate cox analysis assessing the prognostic value of FAM genes concerning IgAN. (C) Distribution of risk scores and a heatmap illustrating the prognostic five-gene signature within the database. (D) Kaplan-Meier survival analysis comparing patients with high and low risk scores. (E) Boxplots depicting the expression of hub genes in glomerular tissue samples from IgAN and healthy control groups. Datasets from GSE93798 and GSE37460.
Figure 5.
ROC curves and corresponding AUC values across the three expression cohorts. (A) Kidney tissue samples from GSE93798 and GES37460. (B) Kidney tissues from GES141295. (C) Kidney tissues from GES104948.
Figure 6.
GSEA analysis revealing the enriched pathways of the hub genes. (A) DPEP1. (B) ACADM. (C) CYP4A11. (D) SLC22A5.
The association of IgAN risk score with immune infiltration in IgAN
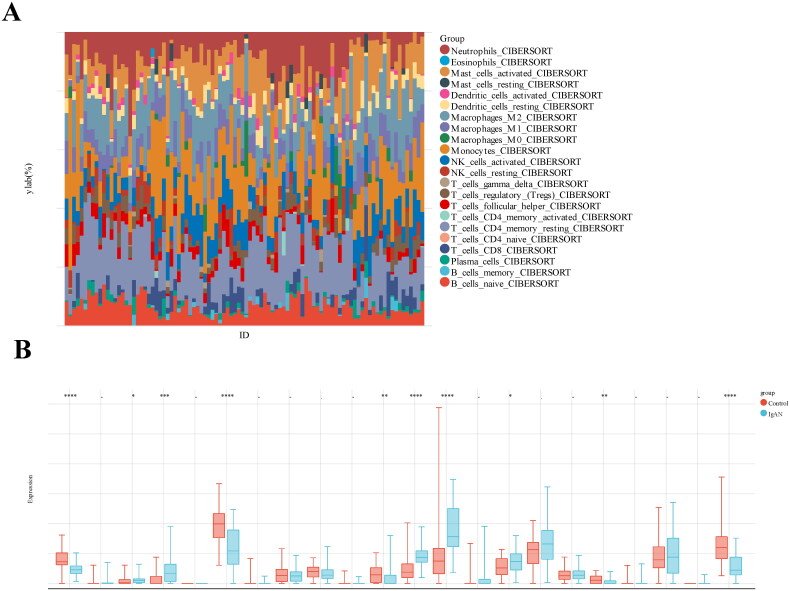
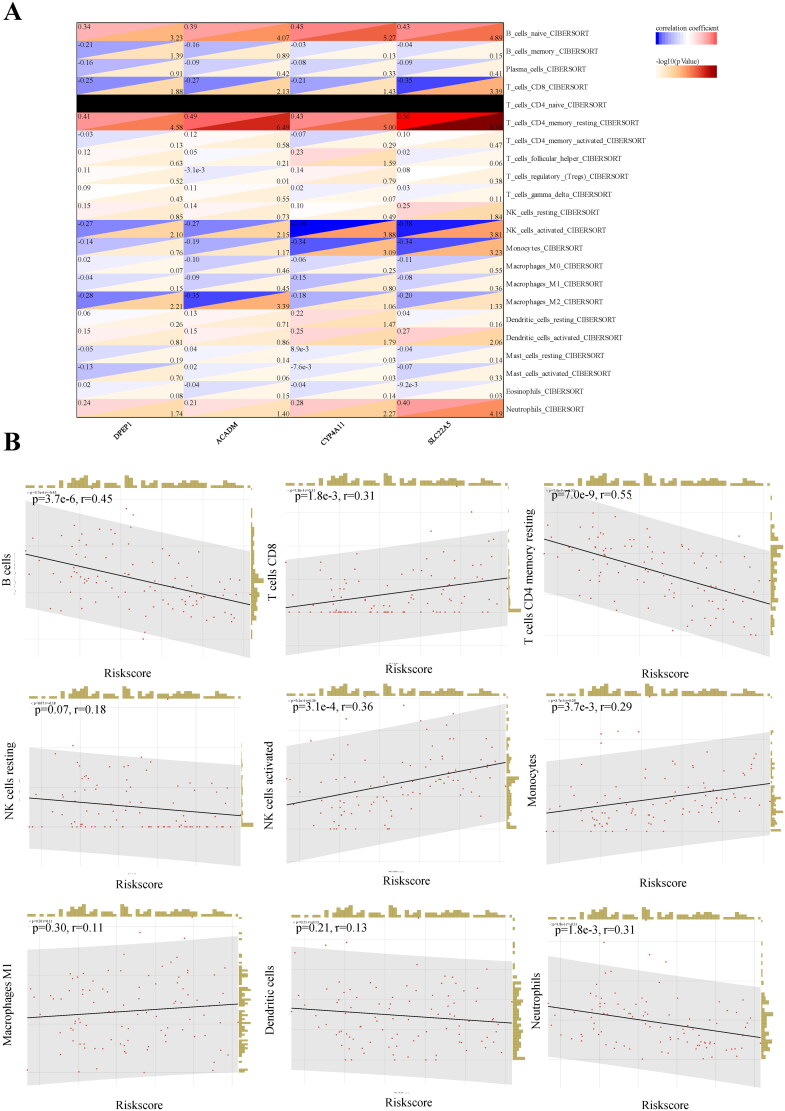
Regarding the association of IgAN risk scores with immune cell infiltration, we utilized the CIBERSORT algorithm to estimate the proportions of 22 immune cells types in 47 IgAN samples and 49 healthy controls, The results indicated a significant difference in immune cell composition between IgAN and control groups (Figure 7(A)). The box plot further showed that native B cells, resting CD4 memory T cells, resting NK cells, and neutrophils were significantly decreased in IgAN samples, whereas plasma cells, CD8T cells, activated NK cells, monocytes and M1 macrophages were significantly increased (p < 0.01) (Figure 7(B)). To assess the involvement of feature genes in immune homeostasis, we utilized a heat map to illustrate the correlations between feature genes and immune cells (Figure 8(A)). We further analyzed the relationship between IgAN risk score and infiltrating immune cells using Pearson correlation coefficients (Figure 8(B)). The findings indicated that a higher risk score correlated negatively with B cells (p = 3.7e-6, r = 0.45), resting CD4 memory T cells (p = 7.0e-9, r = 0.55), and neutrophils (p = 1.8e-3, r = 0.31). Conversely, a higher risk score was positively correlated with CD8T cells (p = 1.8e-3, r = 0.31) and activated NK cells (p = 3.1e-4, r = 0.36). These findings suggest that feature genes may have a role in immune regulation in the context of IgAN.
Figure 7.
Estimation of peripheral immune cell infiltration using the prognostic signature. (A) The relative percentages of 22 immune cells in each sample. (B) Levels of peripheral immune infiltration in IgAN versus healthy control groups, analyzed through CIBERSORT algorithms. Boxplot illustrate the differences in peripheral immune infiltration scores between the two groups. Datasets from GSE93798 and GSE37460.
Figure 8.
Relationship between hub genes and immune infiltration. (A) The association between immune cells levels and hub genes in IgAN samples. (B) Spearman correlation between IgAN and the proportion of peripheral immune cells is presented. Datasets from GSE93798 and GSE37460.
Levels of DPEP1, ACADM, CYP4A11 and SLC22A5 were decreased expression in IgAN patients and HMCs
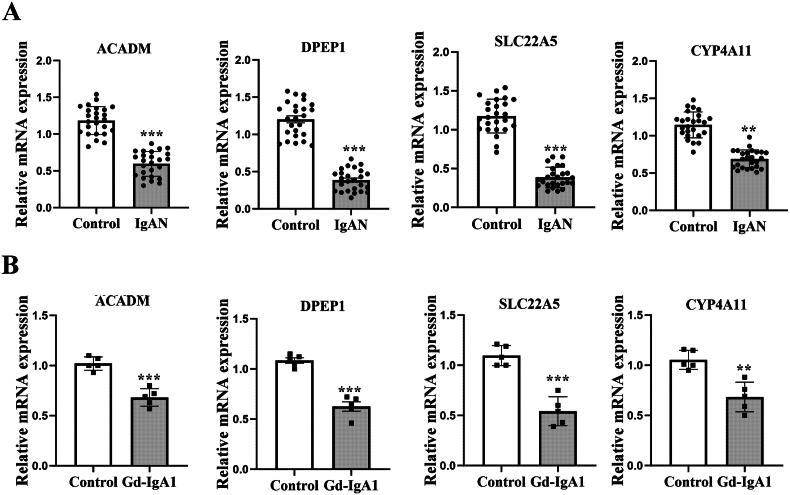
To further substantiate the bioinformatics analysis findings, we initially examined peripheral blood from IgAN patients and healthy controls. As depicted in Figure 9(A), the expression levels of DPEP1, ACADM, CYP4A11 and SLC22A5 were significantly lower in IgAN sample (n = 25) compared to the healthy controls (n = 25). Subsequently, we stimulated HMCs with Gd-IgA1 to establish an in vitro model of IgAN. Following Gd-IgA1 treatment, we observed a significant decrease in the expression levels of DPEP1, ACADM, CYP4A11 and SLC22A5 in HMCs relative to the control group (Figure 9(B)). Taken together, these findings indicate that DPEP1, ACADM, CYP4A11 and SLC22A5 may play crucial roles in the pathogenesis of IgAN.
Figure 9.
The expression levels of DPEP1, ACADM, CYP4A11 and SLC22A5 were reduced in patients with IgAN and in human mesangial cells (HMCs). (A) the mRNA expression of key genes was verified through qRT-PCR in peripheral blood samples from IgAN patients (n = 25) compared to a healthy control group (n = 25); **p < 0.001, ***p < 0.0001; (B) In HMCs stimulated with Gd-IgA1 (1 mg/ml for 24h), the mRNA expression levels of these key genes were lower when compared to the control group. n = 5, **p < 0.001, ***p < 0.0001.
Discussion
The pathogenesis of IgAN is a type of glomerulonephritis influenced by various factors, both environmental and genetic. While the precise mechanisms underlying IgAN remain unclear, atypical fatty acid metabolism, particularly fatty acid oxidation, acts as a crucial role in its pathogenesis[17]. In this study, we integrated and analyzed gene expression profiles from 47 IgAN samples and 49 healthy controls across two datasets using bioinformatics techniques. 12 genes associated with both IgAN and fatty acid metabolism (FAM) were identified. Functional enrichment analysis of GO terms showed that these genes participate in biological process related to small molecule metabolism and fatty acid metabolism. KEGG pathway analysis indicated that key genes were significantly enriched in metabolic pathways, processes related to fatty acid metabolism, the PPAR signaling pathway, and peroxisomes. Several critical proteins that regulate the PPAR signaling pathway and peroxisomes are closely associated with the progression of IgAN [17, 22]. Jing et. at suggested that PPAR agonist can reduce the inflammatory response in activated tubular epithelial cells in IgAN[23]. Both the GO term analyses and KEGG pathway results imply that the differentially expressed fatty acid metabolism-related genes (DE-FAMs) or the key IgAN-associated FAM genes identified in this study may play a role in the progression of IgAN.
Subsequently, we constructed a COX regression model focused on these genes and generated a ROC curve. From the twelve genes analyzed, four were selected for the construction of diagnostic model: DPEP1, CYP4A11, SLC22A5 and ACADM, all of which may play a role in the onset and progression of IgAN. Dipeptidase-1 (DPEP1) serves as a significant neutrophil adhesion receptor, predominantly found in proximal tubular cells and peritubular capillaries of the kidney[24]. It is involved in the hydrolysis of various dipeptides and is also associated with the renal metabolism of glutathione and leukotrienes [24]. Arthur Lau and colleagues identified DPEP1 as a principal leukocyte adhesion receptor in the kidney, contributing to the severity of acute kidney injury (AKI). In addition, DPEP1 has been suggested as a potential novel marker associated with focal segmental glomerulosclerosis (FSGS) [25]. Medium-chain acyl-CoA dehydrogenase (ACADM) facilitates the initial step of β-oxidation, crucial for the degradation of medium-chain fatty acids within mitochondria[26], mutations in this gene lead to one of the most common mitochondrial fatty acids β-oxidation disorders. Alteration of ACADM expression have been observed in individuals with cardiovascular, metabolic, and nonalcoholic fatty liver diseases[27, 28]. While the specific molecular mechanisms underlying the low expression of ACADM in kidney remain unclear, numerous studies indicated that the inhibition of fatty acid oxidation plays a critical role in organs fibrosis and cancer progression. The SLC22 transporter family, which includes multiple members expressed in the kidney, liver, heart and other tissues, SLC22A5, also known as OCTN2. This transporter is responsible for high-affinity carnitine uptake in tissues[29], with significant expression in the kidney as well as some in the intestine and placenta. SLC22A5 is linked to various conditions, including primary carnitine deficiency, inflammatory bowel disease (IBD), diabetes, and asthma[30].
CYP4A, part of the CYP4 enzyme family, is involved in metabolizing medium- and long-chain fatty acids, such as arachidonic acid and palmitate. Specifically, CYP4A11 metabolizes endobiotics and catalyzes the ω-hydroxylation of fatty acids in human liver and kidney tissues[31]. However, research on the roles of DPEP1, ACADM, CYP4A11 and SLC22A5 in the progression of IgAN is limited, necessitating further investigation into their potential contributions to the pathogenesis of IgAN. These four distinct genes are associated with β-oxidation, immunity, and energy metabolism, which may offer new strategies for preventing the progression of IgAN to chronic kidney disease.
The histological features of IgAN are diverse and reflect the spectrum observed in other forms of immune complex-mediated proliferative glomerulonephritis[32]. The human immune system comprises a complex network of both innate and adaptive immunity that can affect IgAN. This study preliminarily explored the potential immune relationships in IgAN by utilizing the CIBERSORT algorithm to assess immune cell infiltration in the glomerular tissue of IgAN patients. We identified several immune cells types that may be linked to prognosis in IgAN, predominantly B cells, T cells, NK cells, dendritic cells, and neutrophils. Our findings suggest that CD8 T cells, CD4 T cells and NK cells in the kidneys of IgAN patients could exacerbate disease progression. Recent research indicates that T cells and their cytokines are involved in the posttranslational modification of the IgA1 hinge region [33, 34]. For instance, Peng et al. demonstrated a correlation between Th cell dysregulation and proteinuria in IgAN[35]. This suggest that T cells in the kidneys of IgAN patients may contribute to disease advancement. Furthermore, chronic inflammation leading to fibrosis is a common pathological alteration in IgAN and is closely correlated with prognosis[36]. Chronic inflammation is characterized by the infiltration of leukocytes, including neutrophils and macrophages. However, recruitment of leukocytes can also underlie organ dysfunction in inflammatory responses, for example, during most forms of autoimmune disease[37]. Leukocyte recruitment in the kidney has been observed in glomerular capillaries and in interstitial peritubular capillaries. In addition, chronic inflammation also involves nearly all immune cell types, such as Th cell, regulatory T cells, and B lymphocytes [36, 38]. Research has indicated that the infiltration of immune cells in IgAN could lead to increased glomerular permeability, tubulointerstitial inflammation, and interactions that result in renal failure. The kidneys exhibit the highest basal energy demands among organs, primarily due to their reliance on mitochondrial β-oxidation of FAs. The inappropriate buildup of free FAs triggers abnormality in lipid metabolism[39]. Excess lipids causes damage to the kidneys, associated with the promotion of an inflammatory response, as well as be considered to be a major cause of renal fibrosis [40, 41]. The recovery of normal FA metabolism has become a promising path for preventing renal fibrosis.
However, this study has several limitations that need to be addressed. Firstly, the dataset’s sample size was relatively limited, and our results should be confirmed in a larger cohort. Secondly, factors such as age, sex, medication, and comorbidities of the patients were not taken into account in this analysis. Finally, the specific role of the four newly identified hub genes in IgAN remain unclear, necessitating further experimental and clinical investigations.
Conclusion
In summary, abnormal immune cell infiltration is likely involved in IgAN. We identified twelve hub genes associated with fatty acid metabolism in relation to IgAN. Furthermore, these hub genes are linked to various immune factors, suggesting that immune responses play a significant role in IgAN associated with irregular fatty acid metabolism. Nonetheless, additional research is required to determine their precise functions.
Supplementary Material
Acknowledgements
We appreciated GEO and Arrayexpress databases for providing the original study data. The pre-print version can be searched in https://doi.org/10.21203/rs.3.rs-3460092/v1 [37].
Funding Statement
This work was supported by National Natural Science Foundation of China (82070697).
Ethics approval and consent to participate
Written informed consent was obtained from all patients, and the study was approved by the Xin Hua Hospital Committee on Human Research. The research was performed in accordance with the ethical guidelines of the Declaration of Helsinki 1975.
Authors’ contributions
Xiaoqian Qian performed the experiment and drafted the manuscript. Shuyang Bian and Qin Guo performed the experiment. Dongdong Zhu and Fan Bian reviewed and edited manuscript. Gengru Jiang and Yinhui Song designed and supervised the study. All authors contributed to the final version of the manuscript and approved the final manuscript.
Disclosure statement
The authors declare no conflict of interest.
Availability of data and materials
All data needed to evaluate the conclusions in the paper are present in the paper and Supplementary Materials.
References
- 1.Rodrigues JC, Haas M, Reich HN.. IgA nephropathy. Clin J Am Soc Nephrol. 2017;12(4):677–686. doi: 10.2215/CJN.07420716. [DOI] [PMC free article] [PubMed] [Google Scholar]
- 2.Hoverstad T, Kjolstad S.. Use of focus groups to study absenteeism due to illness. J Occup Med. 1991;33(10):1046–1050. [PubMed] [Google Scholar]
- 3.Schena FP, Nistor I.. Epidemiology of IgA nephropathy: a global perspective. Semin Nephrol. 2018;38(5):435–442. doi: 10.1016/j.semnephrol.2018.05.013. [DOI] [PubMed] [Google Scholar]
- 4.Lin H, Wu D, Xiao J.. Identification of key cuproptosis-related genes and their targets in patients with IgAN. BMC Nephrol. 2022;23(1):354. doi: 10.1186/s12882-022-02991-5. [DOI] [PMC free article] [PubMed] [Google Scholar]
- 5.Tang Y, Tian W, Xie J, et al. . Prognosis and dissection of immunosuppressive microenvironment in breast cancer based on fatty acid metabolism-related signature. Front Immunol. 2022;13:843515. doi: 10.3389/fimmu.2022.843515. [DOI] [PMC free article] [PubMed] [Google Scholar]
- 6.Hoy AJ, Nagarajan SR, Butler LM.. Tumour fatty acid metabolism in the context of therapy resistance and obesity. Nat Rev Cancer. 2021;21(12):753–766. doi: 10.1038/s41568-021-00388-4. [DOI] [PubMed] [Google Scholar]
- 7.Soma J, Saito T, Ootaka T, et al. . Differences in glomerular leukocyte infiltration between IgA nephropathy and membranoproliferative glomerulonephritis. Nephrol Dial Transplant. 1998;13(3):608–616. doi: 10.1093/ndt/13.3.608. [DOI] [PubMed] [Google Scholar]
- 8.Alexopoulos E, Seron D, Hartley RB, et al. . The role of interstitial infiltrates in IgA nephropathy: a study with monoclonal antibodies. Nephrol Dial Transplant. 1989;4(3):187–195. doi: 10.1093/oxfordjournals.ndt.a091854. [DOI] [PubMed] [Google Scholar]
- 9.Arima S, Nakayama M, Naito M, et al. . Significance of mononuclear phagocytes in IgA nephropathy. Kidney Int. 1991;39(4):684–692. doi: 10.1038/ki.1991.82. [DOI] [PubMed] [Google Scholar]
- 10.Xie D, Zhao H, Xu X, et al. . Intensity of macrophage infiltration in glomeruli predicts response to immunosuppressive therapy in patients with IgA nephropathy. J Am Soc Nephrol. 2021;32(12):3187–3196. doi: 10.1681/ASN.2021060815. [DOI] [PMC free article] [PubMed] [Google Scholar]
- 11.Topaloglu R, Orhan D, Bilginer Y, et al. . Clinicopathological and immunohistological features in childhood IgA nephropathy: a single-centre experience. Clin Kidney J. 2013;6(2):169–175. doi: 10.1093/ckj/sft004. [DOI] [PMC free article] [PubMed] [Google Scholar]
- 12.Soma J, Saito T, Sato H, et al. . Intraglomerular immune cell infiltration and complement 3 deposits in membranoproliferative glomerulonephritis type I: a serial-biopsy study of 25 cases. Am J Kidney Dis. 1994;23(3):365–373. doi: 10.1016/s0272-6386(12)80998-x. [DOI] [PubMed] [Google Scholar]
- 13.Hossain MT, Li S, Reza MS, et al. . Identification of circRNA biomarker for gastric cancer through integrated analysis. Front Mol Biosci. 2022;9:857320. doi: 10.3389/fmolb.2022.857320. [DOI] [PMC free article] [PubMed] [Google Scholar]
- 14.Rahman MM, Hossain MT, Reza MS, et al. . Identification of potential long non-coding RNA candidates that contribute to triple-negative breast cancer in humans through computational approach. Int J Mol Sci. 2021;22(22):12359. doi: 10.3390/ijms222212359. [DOI] [PMC free article] [PubMed] [Google Scholar]
- 15.Reza MS, Harun-Or-Roshid M, Islam MA, et al. . Bioinformatics screening of potential biomarkers from mRNA expression profiles to discover drug targets and agents for cervical cancer. Int J Mol Sci. 2022;23(7):3968. doi: 10.3390/ijms23073968. [DOI] [PMC free article] [PubMed] [Google Scholar]
- 16.Al Mehedi Hasan M, Maniruzzaman M, Shin J.. Identification of key candidate genes for IgA nephropathy using machine learning and statistics based bioinformatics models. Sci Rep. 2022;12(1):13963. doi: 10.1038/s41598-022-18273-x. [DOI] [PMC free article] [PubMed] [Google Scholar]
- 17.Wu J, Shao X, Shen J, et al. . Downregulation of PPARalpha mediates FABP1 expression, contributing to IgA nephropathy by stimulating ferroptosis in human mesangial cells. Int J Biol Sci. 2022;18(14):5438–5458. doi: 10.7150/ijbs.74675. [DOI] [PMC free article] [PubMed] [Google Scholar]
- 18.Zhou X, Wang N, Zhang Y, et al. . Expression of CCL2, FOS, and JUN may help to distinguish patients with IgA nephropathy from healthy controls. Front Physiol. 2022;13:840890. doi: 10.3389/fphys.2022.840890. [DOI] [PMC free article] [PubMed] [Google Scholar]
- 19.Jianping W, Wei X, Li J, et al. . Identifying DUSP-1 and FOSB as hub genes in immunoglobulin A nephropathy by WGCNA and DEG screening and validation. PeerJ. 2022;10:e13725. doi: 10.7717/peerj.13725. [DOI] [PMC free article] [PubMed] [Google Scholar]
- 20.Langfelder P, Horvath S.. WGCNA: an R package for weighted correlation network analysis. BMC Bioinformat. 2008;9(1):559. doi: 10.1186/1471-2105-9-559. [DOI] [PMC free article] [PubMed] [Google Scholar]
- 21.Gu X, Lai D, Liu S, et al. . Hub genes, diagnostic model, and predicted drugs related to iron metabolism in Alzheimer’s disease. Front Aging Neurosci. 2022;14:949083. doi: 10.3389/fnagi.2022.949083. [DOI] [PMC free article] [PubMed] [Google Scholar]
- 22.Zou J-N, Xiao J, Hu S-S, et al. . Toll-like receptor 4 signaling pathway in the protective effect of pioglitazone on experimental immunoglobulin A nephropathy. Chin Med J (Engl). 2017;130(8):906–913. doi: 10.4103/0366-6999.204101. [DOI] [PMC free article] [PubMed] [Google Scholar]
- 23.Xiao J, Leung JCK, Chan LYY, et al. . Crosstalk between peroxisome proliferator-activated receptor-gamma and angiotensin II in renal tubular epithelial cells in IgA nephropathy. Clin Immunol. 2009;132(2):266–276. doi: 10.1016/j.clim.2009.04.004. [DOI] [PubMed] [Google Scholar]
- 24.Lau A, Rahn JJ, Chappellaz M, et al. . Dipeptidase-1 governs renal inflammation during ischemia reperfusion injury. Sci Adv. 2022;8(5):eabm0142. doi: 10.1126/sciadv.abm0142. [DOI] [PMC free article] [PubMed] [Google Scholar]
- 25.Nafar M, Kalantari S, Samavat S, et al. . The novel diagnostic biomarkers for focal segmental glomerulosclerosis. Int J Nephrol. 2014;2014:574261–574210. doi: 10.1155/2014/574261. [DOI] [PMC free article] [PubMed] [Google Scholar]
- 26.Ma APY, Yeung CLS, Tey SK, et al. . Suppression of ACADM-mediated fatty acid oxidation promotes hepatocellular carcinoma via aberrant CAV1/SREBP1 signaling. Cancer Res. 2021;81(13):3679–3692. doi: 10.1158/0008-5472.CAN-20-3944. [DOI] [PubMed] [Google Scholar]
- 27.Simula MP, Cannizzaro R, Canzonieri V, et al. . PPAR signaling pathway and cancer-related proteins are involved in celiac disease-associated tissue damage. Mol Med. 2010;16(5–6):199–209. doi: 10.2119/molmed.2009.00173. [DOI] [PMC free article] [PubMed] [Google Scholar]
- 28.Van Berendoncks AM, Garnier A, Beckers P, et al. . Exercise training reverses adiponectin resistance in skeletal muscle of patients with chronic heart failure. Heart. 2011;97(17):1403–1409. doi: 10.1136/hrt.2011.226373. [DOI] [PubMed] [Google Scholar]
- 29.Ranea-Robles P, Yu C, van Vlies N, et al. . Slc22a5 haploinsufficiency does not aggravate the phenotype of the long-chain acyl-CoA dehydrogenase KO mouse. J Inherit Metab Dis. 2020;43(3):486–495. doi: 10.1002/jimd.12204. [DOI] [PMC free article] [PubMed] [Google Scholar]
- 30.Li P, Wang Y, Luo J, et al. . Downregulation of OCTN2 by cytokines plays an important role in the progression of inflammatory bowel disease. Biochem Pharmacol. 2020;178:114115. doi: 10.1016/j.bcp.2020.114115. [DOI] [PubMed] [Google Scholar]
- 31.Gao H, Cao Y, Xia H, et al. . CYP4A11 is involved in the development of nonalcoholic fatty liver disease via ROS‑induced lipid peroxidation and inflammation. Int J Mol Med. 2020;45(4):1121–1129. doi: 10.3892/ijmm.2020.4479. [DOI] [PMC free article] [PubMed] [Google Scholar]
- 32.Magistroni R, D’Agati VD, Appel GB, et al. . New developments in the genetics, pathogenesis, and therapy of IgA nephropathy. Kidney Int. 2015;88(5):974–989. doi: 10.1038/ki.2015.252. [DOI] [PMC free article] [PubMed] [Google Scholar]
- 33.Gao X, Guo Z, Wang P, et al. . Transcriptomic analysis reveals the potential crosstalk genes and immune relationship between IgA nephropathy and periodontitis. Front Immunol. 2023;14:1062590. doi: 10.3389/fimmu.2023.1062590. [DOI] [PMC free article] [PubMed] [Google Scholar]
- 34.Ruszkowski J, Lisowska KA, Pindel M, et al. . T cells in IgA nephropathy: role in pathogenesis, clinical significance and potential therapeutic target. Clin Exp Nephrol. 2019;23(3):291–303. doi: 10.1007/s10157-018-1665-0. [DOI] [PMC free article] [PubMed] [Google Scholar]
- 35.Peng Z, Tian J, Cui X, et al. . Increased number of Th22 cells and correlation with Th17 cells in peripheral blood of patients with IgA nephropathy. Hum Immunol. 2013;74(12):1586–1591. doi: 10.1016/j.humimm.2013.08.001. [DOI] [PubMed] [Google Scholar]
- 36.Mariani LH, Martini S, Barisoni L, et al. . Interstitial fibrosis scored on whole-slide digital imaging of kidney biopsies is a predictor of outcome in proteinuric glomerulopathies. Nephrol Dial Transplant. 2018;33(2):310–318. doi: 10.1093/ndt/gfw443. [DOI] [PMC free article] [PubMed] [Google Scholar]
- 37.Jackman RW, Beeler DL, Fritze L, et al. . Human thrombomodulin gene is intron depleted: nucleic acid sequences of the cDNA and gene predict protein structure and suggest sites of regulatory control. Proc Natl Acad Sci USA. 1987;84(18):6425–6429. doi: 10.1073/pnas.84.18.6425. [DOI] [PMC free article] [PubMed] [Google Scholar]
- 38.Gan L, Zhou Q, Li X, et al. . Intrinsic renal cells induce lymphocytosis of Th22 cells from IgA nephropathy patients through B7-CTLA-4 and CCL-CCR pathways. Mol Cell Biochem. 2018;441(1–2):191–199. doi: 10.1007/s11010-017-3185-8. [DOI] [PubMed] [Google Scholar]
- 39.Jiang Y, Ma F, Wang J, et al. . Up-regulation of long non-coding RNA H19 ameliorates renal tubulointerstitial fibrosis by reducing lipid deposition and inflammatory response through regulation of the microRNA-130a-3p/long-chain acyl-CoA synthetase 1 axis. Noncoding RNA Res. 2024;9(4):1120–1132. doi: 10.1016/j.ncrna.2024.05.002. [DOI] [PMC free article] [PubMed] [Google Scholar]
- 40.Escasany E, Lanzón B, García-Carrasco A, et al. . Transforming growth factor beta3 deficiency promotes defective lipid metabolism and fibrosis in murine kidney. Dis Model Mech. 2021;14(9). doi: 10.1242/dmm.048249. [DOI] [PMC free article] [PubMed] [Google Scholar]
- 41.Chen L, Sha M-L, Chen F-T, et al. . Upregulation of KLF14 expression attenuates kidney fibrosis by inducing PPARalpha-mediated fatty acid oxidation. Free Radic Biol Med. 2023;195:132–144. doi: 10.1016/j.freeradbiomed.2022.12.096. [DOI] [PubMed] [Google Scholar]
Associated Data
This section collects any data citations, data availability statements, or supplementary materials included in this article.
Supplementary Materials
Data Availability Statement
All data needed to evaluate the conclusions in the paper are present in the paper and Supplementary Materials.


