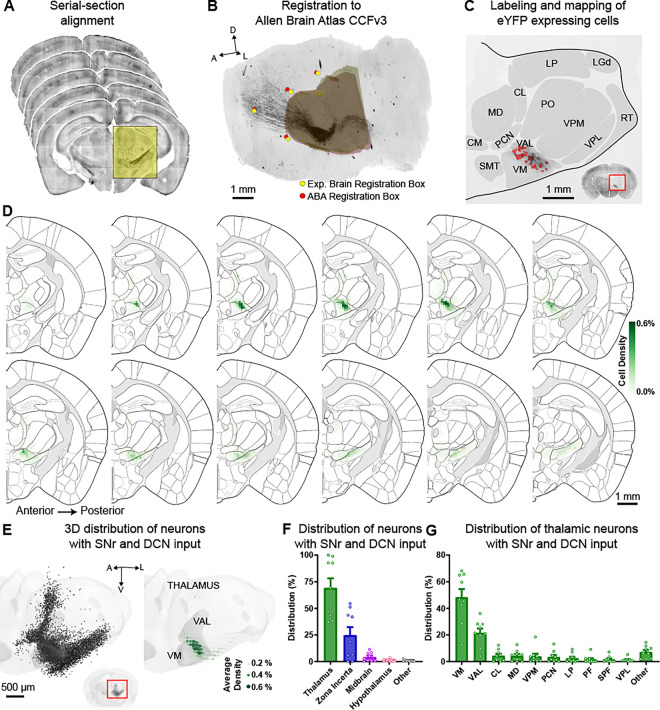
Figure 2: Most thalamic neurons with SNr and DCN inputs are located in VM and VAL.
(A) Example serial brain sections from mice expressing AAV1-Cre or AAV1-Flp in SNr/DCN and AAV-cDIO-fDIO-eYFP in thalamus that are aligned for 3D reconstruction following imaging.
(B) Aligned sections are registered to the Allen Brain Atlas CCFv3 using a sequence of affine transformations derived from matching brain landmark fiducials and coronal bounding boxes around the thalamus. Yellow circles/3D volume show a set of these registration landmarks for the experimental brain and red circles/3D volume show the corresponding and aligned landmarks from the Allen Brain Atlas (ABA).
(C) Example section showing labeled neurons (red circles) mapped to thalamic nuclei from the Allen Brain Atlas. Inset shows the entire coronal section with enlarged region marked with a red rectangle.
(D) Serial 2D coronal sections at 100-μm intervals of the Allen Brain Atlas. The distribution of labeled neurons with SNr and DCN inputs is shown as the average relative density in 100 × 100 μm bins (green, see methods) from n=9 mice.
(E) 3D projection of the thalamus with individual labeled neurons from all 9 mice overlayed (left) and the average relative density of labeled neurons in 100 × 100 × 100 μm bins (right). Thalamus volume in light gray, VM and VAL highlighted in dark gray. Green circles denote average relative density. Inset shows 3D reconstruction of the entire brain with the enlarged region marked with a red rectangle.
(F) Distribution of neurons with SNr and DCN inputs across brain regions. Bars denote mean and circles individual mice. Error bars, SEM. n=12,181 cells from 9 mice.
(G) Distribution of neurons with SNr and DCN inputs within the thalamus. Individual thalamic nuclei with an average of ≥1% of labeled cells are listed, remaining nuclei are combined as “other”. Bars denote mean and circles individual mice. Error bars, SEM. n=7,514 cells from 9 mice.

