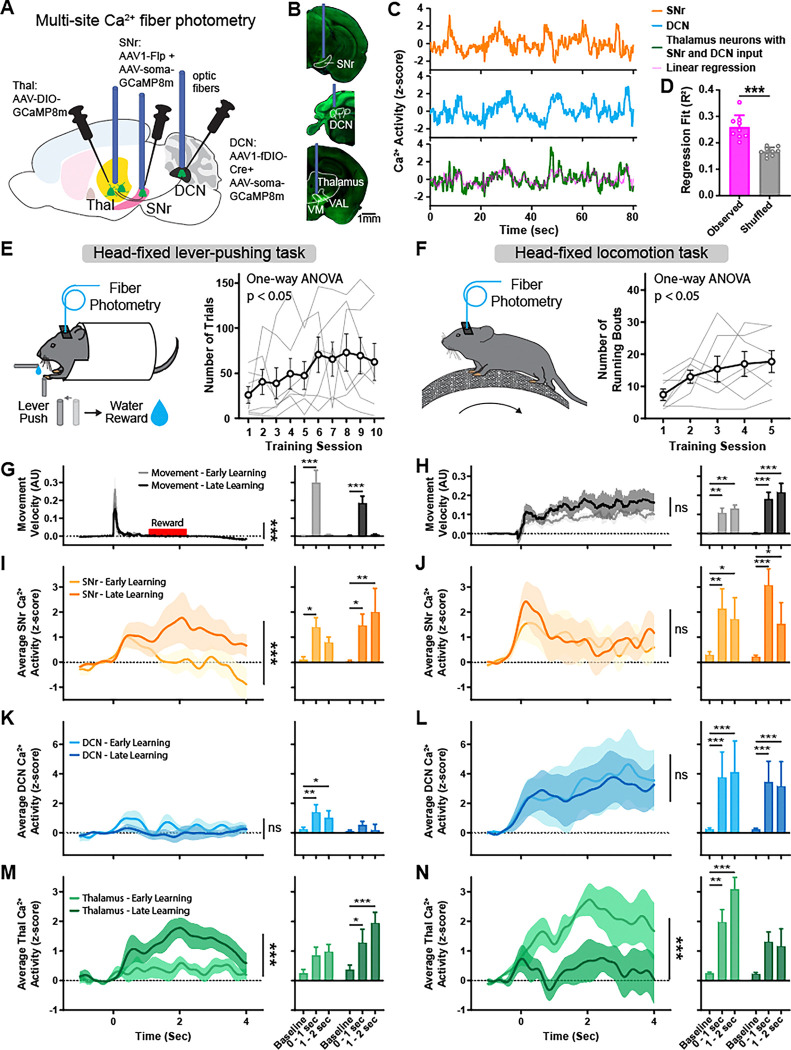
Figure 3: Functional integration of BG and CB activity in the thalamus during motor learning.
(A) Schematic diagram of virus injections and optic fiber placement for multi-site fiber photometry of Ca2+ activity in SNr, DCN, and thalamus neurons with dual inputs.
(B) Example coronal sections showing AAV-soma-GCaMP8m (SNr and DCN, green) and AAV-GCaMP8m (thalamus, green) expression and optic fiber placement. Scale bar, 1 mm
(C) Example fiber photometry recording traces from SNr (orange), DCN (blue), and dual-input thalamus neurons (green) in one mouse. Predicted thalamus signal based on linear regression of SNr and DCN signals (A × Ca2+SNr + B × Ca2+DCN + C = Ca2+Thalamus) shown in magenta.
(D) Regression fit (R2) of predicted thalamus signal calculated from linear regression of random 135 sec time intervals (see methods) from observed data (magenta) and predicted signal calculated from control shuffled data with SNr and DCN signals randomly shifted in time by up to ±67.5 sec relative to the thalamus signal (grey). Bars denote mean and circles individual mice. Error bars, SEM. R2 of observed data: 0.26±0.015; R2 of shuffled data 0.17±0.005, n=9 mice. p<0.001, paired T-test.
(E) Left: Schematic of mouse performing head-fixed lever-pushing task. Right: Behavior performance of mice learning the lever-pushing task over the course of 10 days. Thin grey lines represent individual mice and bold line denotes mean. Error bars, SEM. n=7 mice. p=0.04, repeated measure one-way ANOVA.
(F) Left: Schematic of mouse performing head-fixed locomotion task. Right: Behavior performance of mice learning the locomotion task over the course of 5 days. Thin grey lines represent individual mice and bold line denotes mean. Error bars, SEM. n=7 mice. p=0.02, repeated measure one-way ANOVA.
(G) Left: Average velocity of lever movements aligned to movement onset during early (grey) and late (black) training sessions. Time window of water reward delivery shown in red. Solid lines represent mean and shaded areas denote SEM. n=7 mice. p<0.001, two-way ANOVA interaction. Right: Average maximal movement velocity at baseline, during movement (0–1 sec), and after movement (1–2 sec). Bars denote mean. Error bars, SEM. Two-way ANOVA with Holm-Sidak multiple comparisons test.
(H) Left: Average velocity of wheel movements aligned to movement onset during early (grey) and late (black) training sessions. Solid lines represent mean and shaded areas denote SEM. n=7 mice. p=0.883, two-way ANOVA interaction. Right: Average maximal movement velocity at baseline, at movement onset (0–1 sec), and during continuous movement (1–2 sec). Bars denote mean. Error bars, SEM. Two-way ANOVA with Holm-Sidak multiple comparisons test.
(I) Left: Average z-scored Ca2+ activity in SNr aligned to lever movement onset during early (light orange) and late (dark orange) training sessions. Solid lines represent mean and shaded areas denote SEM. n=7 mice. p<0.001, two-way ANOVA interaction. Right: Average maximal z-scored Ca2+ activity at baseline, during movement (0–1 sec), and after movement (1–2 sec). Bars denote mean. Error bars, SEM. Two-way ANOVA with Holm-Sidak multiple comparisons test.
(J) Left: Average z-scored Ca2+ activity in SNr aligned to wheel movement onset during early (light orange) and late (dark orange) training sessions. Solid lines represent mean and shaded areas denote SEM. n=7 mice. p=0.709, two-way ANOVA interaction. Right: Average maximal z-scored Ca2+ activity at baseline, at movement onset (0–1 sec), and during continuous movement (1–2 sec). Bars denote mean. Error bars, SEM. Two-way ANOVA with Holm-Sidak multiple comparisons test.
(K) Left: Average z-scored Ca2+ activity in DCN aligned to lever movement onset during early (light blue) and late (dark blue) training sessions. Solid lines represent mean and shaded areas denote SEM. n=7 mice. p=0.898, two-way ANOVA interaction. Right: Average maximal z-scored Ca2+ activity at baseline, during movement (0–1 sec), and after movement (1–2 sec). Bars denote mean. Error bars, SEM. Two-way ANOVA with Holm-Sidak multiple comparisons test.
(L) Left: Average z-scored Ca2+ activity in DCN aligned to wheel movement onset during early (light blue) and late (dark blue) training sessions. Solid lines represent mean and shaded areas denote SEM. n=7 mice. p=0.976, two-way ANOVA interaction. Right: Average maximal z-scored Ca2+ activity at baseline, at movement onset (0–1 sec), and during continuous movement (1–2 sec). Bars denote mean. Error bars, SEM. Two-way ANOVA with Holm-Sidak multiple comparisons test.
(M) Left: Average z-scored Ca2+ activity in thalamus neurons with SNr and DCN inputs aligned to lever movement onset during early (light green) and late (dark green) training sessions. Solid lines represent mean and shaded areas denote SEM. n=7 mice. p<0.001, two-way ANOVA interaction. Right: Average maximal z-scored Ca2+ activity at baseline, during movement (0–1 sec), and after movement (1–2 sec). Bars denote mean. Error bars, SEM. Two-way ANOVA with Holm-Sidak multiple comparisons test.
(N) Left: Average z-scored Ca2+ activity in thalamus neurons with SNr and DCN inputs aligned to wheel movement onset during early (light green) and late (dark green) training sessions. Solid lines represent mean and shaded areas denote SEM. n=7 mice. p<0.001, two-way ANOVA interaction. Right: Average maximal z-scored Ca2+ activity at baseline, at movement onset (0–1 sec), and during continuous movement (1–2 sec). Bars denote mean. Error bars, SEM. Two-way ANOVA with Holm-Sidak multiple comparisons test.
*p<0.05, **p<0.01, ***p<0.001

