

Abstract
Complement-dependent cytotoxicity (CDC) is a primary mechanism-of-action of monoclonal antibody (mAb) immunotherapies used to treat haematological cancers, including rituximab and daratumumab. However, mAb efficacy may be limited by reduced bioavailability of complement C1q – which activates the complement classical pathway following interactions with mAb-opsonised target cells. C1q is secreted by phagocytes upon recruitment to sites of muscle damage to facilitate muscular repair, hence we hypothesised that muscle damaging exercise may increase C1q ‘spill-over’ into blood. Additionally, other complement proteins (e.g., C1s) have been reported to increase following ultra-endurance and resistance exercise. Taken together, we hypothesised that muscle damaging exercise could be harnessed to enhance mAb-mediated CDC. In this study, n = 8 healthy males (28 ± 5-years) completed two 45-minute treadmill running protocols: (1) a flat running protocol at a speed 15% above anaerobic threshold, and (2) a downhill running protocol (− 10% slope) at the same speed. Blood samples were collected before, immediately after, and 1-hour, 24-hours, 2-days, and 4-days after exercise. Isolated serum was assessed for C1q by ELISA, and used to measure mAb (rituximab, daratumumab) mediated CDC against two haematological cancer cell lines (Raji, RPMI-8226) in vitro. Isolated plasma was assessed for markers of inflammation (C-reactive protein [CRP]), and muscle damage (creatine kinase [CK]) by turbidimetry. C1q and CDC activity were not different between running protocols and did not change over time (p > 0.05). Significantly greater perceived muscle soreness (p < 0.001) and fluctuations observed from baseline to 24-hours post-exercise in the downhill running trial in CK (+ 171%) and CRP (+ 66%) suggests some degree of muscle damage was present. It is possible that any increase in C1q post-exercise may have been masked by the increase and subsequent interaction with CRP, which utilises C1q to facilitate muscular repair. This is the first study to investigate whether exercise can increase circulating C1q and improve mAb-mediated CDC and our findings show that downhill running exercise does not increase circulating C1q nor improve CDC in vitro.
Keywords: Complement-dependent cytotoxicity, Immunotherapy, Exercise, Muscle damage, Complement C1q
Subject terms: Biochemistry, Biological techniques, Cancer, Immunology, Physiology, Biomarkers, Diseases, Oncology
Introduction
The development of monoclonal antibody (mAb) immunotherapy over the past two decades has revolutionised the treatment of haematological cancers and is considered a standard of care1. Several mAbs are now used to treat haematological cancers including the first mAb approved for oncological treatment, rituximab, which is an anti-CD20 mAb used to treat chronic lymphocytic leukaemia (CLL)2 and other B-cell haematological cancers. More recently, mAbs have become available for the treatment of other B-cell cancers, including daratumumab – an anti-CD38 mAb used to treat myeloma3.
The primary mechanisms-of-action for rituximab and daratumumab include antibody-dependent cellular cytotoxicity (ADCC), antibody-dependent cellular phagocytosis and complement dependent cytotoxicity (CDC)4–6. During an ADCC response, mAbs opsonise a specific antigen on the target cell surface allowing Fc𝛾 receptors (e.g. Fc𝛾IIIA/CD16a) on NK-cells and monocytes to interact with the Fc-portion of mAb-coated target cells. This results in cell death via exocytosis of perforins and granzymes7,8. We have shown that cycling at 15% above anaerobic threshold for ~ 30-minutes enhanced rituximab-mediated ADCC against autologous CLL cells ex vivo (129%)9. Additionally, we observed a trend towards greater ADCC post cycling exercise in the presence of autologous time-point matched plasma compared to heat-inactivated foetal calf serum (HI-FCS), which might be explained by the presence of complement proteins in autologous plasma. On the other hand, during a CDC response, complement component C1q interacts with the Fc-portion of mAb-opsonised target cells activating the classical complement pathway. Once activated, a proteolytic cascade of events occurs concluding with the assembly of a membrane attack complex (MAC) which alters cell permeability resulting in cell death10. Patients commonly exhibit a complete response following mAb-therapy, but disease eradication is uncommon. For example, rituximab and daratumumab achieve high complete remission rates, but persistence of minimal residual disease (MRD), and subsequent relapse, is inevitable11–14.
Interestingly, rituximab induces superior CDC activity compared to cellular-mediated effector mechanisms in vitro15,16 and in mouse models17. Daratumumab induces CDC activity similar to cellular-mediated mechanisms against primary myeloma cells in vitro18, and against myeloma cell lines in vitro19. As such, the efficacy of both of these mAbs can, at least in part, be attributed to CDC. One reason for CDC failure is reduced bioavailability of C1q20,21. To overcome this problem, patients with complement deficiencies have received rituximab therapy concomitantly with fresh-frozen plasma – containing complement proteins – resulting in enhanced rituximab activity22,23. The importance of C1q bioavailability to the efficacy of daratumumab is more pronounced in the setting of all-trans retinoic acid (ATRA), which upregulates surface CD38 expression and downregulates the expression of complement regulatory proteins such as CD55 and CD59, resulting in greater daratumumab-mediated CDC activity (+ 28% and + 20% cell lysis, respectively)19,24. Therefore, understanding and modifying complement kinetics in haematological malignancies provides an opportunity to improve the efficacy of mAb therapies that rely on CDC as a mechanism of action.
Complement system proteins are altered following exercise in healthy humans25, with proteins of the C1-complex (e.g. C1s) – important for classical pathway activation – increasing in the blood for up to three days following ultra-endurance and resistance exercise26–28. We have recently hypothesised that the elevation of complement proteins may be the result of increased monocyte/macrophage recruitment into damaged muscle29. In support of this, a study examining eccentric cycling for 30-minutes at 37% of concentric cycling maximal oxygen uptake (V̇O2MAX) in 13 healthy males was shown to increase the frequency of monocytes in blood, peaking 6-hours (+ 44.9%) and remaining elevated 24-hours (+ 16.2%) post-exercise. In addition, in muscle, expression of the macrophage marker CD163 was also shown to be increased, peaking at 48-hours30. Once monocytes have infiltrated muscle, their differentiation into M2-like macrophages facilitates the resolution of muscle injury30–32 and it has been shown that both monocytes and macrophages secrete C1q33–35. Therefore, it can be postulated that exercise-induced muscle damage may increase the intramuscular infiltration of monocytes and macrophages which secrete C1q that may ‘spill-over’ into blood 2- to 4-days post-exercise36,37 – alongside increases to other complement proteins in the cascade such as C1s26–28 – and thus, may improve the efficacy of mAb-mediated CDC. However, no study to date has investigated C1q kinetics in response to muscle damaging exercise and the effects of exercise on CDC responses in humans, and therefore further research is warranted.
In the present study we investigated the effects of downhill running – an established experimental method in humans for inducing muscle damage, previously shown to increase C-reactive protein (CRP)38 and creatine kinase (CK)39–41 – on serum C1q concentration and mAb-mediated CDC in vitro. We hypothesised that muscle damage would increase circulating C1q and, alongside other exercise-induced changes to the complement system, would enhance CDC of rituximab and daratumumab against haematological cancer cell lines in vitro25,29.
Methods
Participants
Eight healthy males (mean ± SD: age, 28 ± 5-years; height, 179.0 ± 7.2 cm; body mass, 73.4 ± 7.0 kg; body mass index, 22.9 ± 1.3 kg/m2; anaerobic threshold, 30.4 ± 5.4 mL⋅kg− 1⋅min− 1) provided written informed consent to participate in this study. All participants were between the ages of 18- to 35-years. Participants who regularly smoked, received medications, or reported health problems indicative of cardiovascular or inflammatory disease were excluded during screening. All experiments were performed in accordance with the Declaration of Helsinki and this study was approved by the Research Ethics Approval Committee for Health (REACH) at the University of Bath (EP 1920 036).
Experimental design
Participants were asked to visit the laboratory on multiple occasions (Fig. 1). The first visit consisted of an anaerobic threshold test and was followed by two steady-state exercise trials (i.e., flat and downhill running) performed in a randomised order. The exercise trials consisted of continuous running for 45-minutes at a speed corresponding to 15% above individual anaerobic threshold on a treadmill (Saturn, HP Cosmos, Nussdorf-Traunstein, Germany) with the gradient set at 0% (flat) or − 10% (downhill). Participants returned to the laboratory 24-hours, 2-days, and 4-days following both exercise trials for post-exercise blood sampling. Participants arrived to the laboratory following an overnight fast and replicated dietary habits in the 24-hours before both trials. Exercise trials were performed at the same time of day to minimise diurnal variation in complement proteins42 and were separated by a minimum of 4-weeks and a maximum of 10-weeks.
Fig. 1.

Schematic of the experimental procedures herein. Participants undertook a sub-maximal exercise test to a rating of perceived exertion of 17. Participants then completed a 45-minute bout of flat running (0% gradient) and downhill running (− 10% gradient) at a speed corresponding to 15% above their anaerobic threshold. Blood samples were collected following 30-minutes of rest and before exercise (baseline), immediately following exercise (within 3-minutes) and 1-hour following exercise. Participants were then invited back to laboratory for further post-exercise blood samples 24-hours following exercise, 2-days following exercise and 4-days following exercise.
Exercise procedures
An incremental sub-maximal treadmill test determined anaerobic threshold in participants who were fasted for at least 4-hours, and abstained from alcohol, caffeine, anti-inflammatory medication, and exercise for 24-hours. The treadmill test started at 5.0 km⋅h− 1 and increased by 0.5 km⋅h− 1 every 30-seconds at a gradient of 0%, until participants achieved a rating of perceived exertion (RPE) of 1743. Gas exchange and ventilation (K5 Metalyser, COSMED, Italy), and heart rate (Garmin, USA) were recorded continuously during exercise, whilst RPE was recorded every 30-seconds. Pulmonary oxygen uptake (V̇O2), carbon dioxide production (V̇CO2), and ventilatory equivalents of O2 (V̇E/V̇O2) and CO2 (V̇E/V̇CO2) data were interpolated to 15-second averages. The V-slope method44 was used to determine anaerobic threshold – independently by two researchers –, and was further confirmed through visual inspection of V̇E/V̇O2 and V̇E/V̇CO2.
Participants underwent a further two bouts of exercise – separated by 4- to 10-weeks – between 7-days and 6-weeks following the anaerobic threshold test. For both visits, participants arrived at the laboratory following an overnight (≥ 10-hours) fast, whilst also having refrained from alcohol, caffeine, anti-inflammatory medications for 24-hours and exercise for 48-hours. Following 30-minutes of supine rest and a 5-minute warm-up at a self-selected speed on a treadmill, participants completed a 45-minute continuous bout of running at a speed that corresponded to 15% above their pre-determined anaerobic threshold, and at a gradient of either 0% (flat running) or − 10% (downhill running). Upon completion of the acute bouts of running, participants rested for a further 60-minutes. Delayed onset muscle soreness (DOMS) scores were recorded on a 10 cm visual analogue scale (VAS) 24-hours, 2-days, and 4-days post-exercise.
Blood sampling and processing
During experimental trials, blood samples were collected at baseline and then at 0-hours, 1-hour, 24-hours, 2-days, and 4-days post-exercise. Using a 21-gauge needle (Becton & Dickinson, Oxford, UK), 25 mL of blood was drawn from an antecubital vein, with 5 mL collected into an ethylenediaminetetraacetic acid (EDTA) tube (K2E 6.0 mL, Becton & Dickinson, Oxford, UK), of which approximately 150 µL was used for the leukocyte differential and other haematological variables (Sysmex KX-21 N, Kobe, Japan). To minimise complement activation ex vivo, the remaining 20 mL of blood were distributed into two, sterile, plain glass vials (Kimble, Vineland NJ, USA)25.
EDTA treated blood was centrifuged (Heraeus Biofuge Primo R, Thermo Fisher Scientific, Loughborough, UK) within 15-minutes of collection at 2,000 × g, 4 °C for 15-minutes. Blood collected for the isolation of serum were stirred with an aseptic wooden spatula, left to clot at room temperature for 30- to 60-minutes, and subsequently centrifuged at 900 × g, 4 °C for 20-minutes. Plasma and serum were immediately aspirated and aliquoted into cold, sterile glass vials, and stored at − 80 °C for later analysis.
Quantification of plasma and serum proteins
Creatine kinase (CK) and C-reactive protein (CRP) were quantified in plasma using turbidimetry (CK-NAC and hsCRP, respectively; Randox, RX Daytona, Crumlin, UK). Serum C1q concentrations were determined using enzyme-linked immunosorbent assay (ELISA) (Hycult Biotech Incorporated, Plymouth Meeting, PA, USA) following manufacturer guidelines. Data quantified from plasma and serum isolated from blood samples collected after the baseline time-point were adjusted for plasma volume changes using haematocrit and haemoglobin via an automated haematology analyser (Sysmex KX-21 N, Kobe, Japan)45.
Cell Culture
The effects of exercise on complement-dependent cytotoxicity (CDC) were assessed in two haematological cancer cell line settings including, Raji (CD20+, lymphoma; ECACC 85011429), RPMI-8226 (CD38+, myeloma; ECACC 87012702) – purchased from the UK Health Security Agency – and RPMI-8226 cells which were also treated with all-trans retinoic acid (Sigma-Aldrich, Missouri, USA) (ATRA-8226; CD38++) for 48-hours prior to assays. Raji and RPMI-8226 cells were cultured in medium containing glutamine enriched RPMI-1640 (Gibco™, MA, USA), supplemented with 10% (v/v) HI-FCS (Gibco™, MA, USA), 1% (v/v) penicillin/streptomycin (Thermo Fischer Scientific, Loughborough, UK), and 1% (v/v) sodium pyruvate (Gibco™, MA, USA). ATRA-8226 were cultured in the same medium supplemented with 2 µM/mL of ATRA, which as described earlier is used to upregulate CD38, and downregulate CD55 and CD59 on the target cell surface19,24. All cell lines were maintained at 5 × 10⁵ cells/mL, 5% CO2, 37 °C and passaged into fresh medium every 2-days.
Complement-dependent cytotoxicity (CDC) assay
To analyse the effects of exercise on CDC against haematological cancer cell lines, 2 × 10⁶ cells of each cell line were labelled with the membrane permeable molecule, calcein acetoxymethyl ester (calcein-AM) (Invitrogen™, Thermo Fisher Scientific, Loughborough, UK) following manufacturers protocol. Briefly, this method relies on the principle that calcein-AM passively diffuses across the target cell membrane into the cell cytoplasm where hydrolysis by intracellular esterases converts it to calcein, a fluorescent dye. Calcein is unable to diffuse back across the membrane and is retained in the cytoplasm until cell lysis occurs. Following the removal of excess calcein-AM through washing, the amount of calcein released is proportional to the amount of cell lysis.
Serum samples from each time-point per participant were thawed at 4 °C the morning of each assay and diluted 1:1 with cold phosphate buffered saline (PBS; KCl 0.2 g/L, KH2PO4 0.2 g/L, NaCl 8.0 g/L, Na2HPO4 1.15 g/L; without CaCl2 and MgCl2 herein) (Dulbecco’s PBS, Sigma Aldrich, Kent, UK) in sterile, cold, glass vials and kept on ice. Then, 40 µL of diluted serum were added to respective wells of a non-treated, U-shaped-bottom, 96-well plate (Falcon™, Thermo Fischer Scientific, Loughborough, UK) and placed on ice. Serum from a resting sample was heat-inactivated for 30-minutes at 57 °C, diluted 1:1 with cold PBS and used in lieu of normal human serum in spontaneous lysis (negative control) and maximum lysis (positive control) conditions. Anti-CD20 mAb rituximab (final concentration: 0.1 µg/mL; Selleckchem, TX, USA), anti-CD38 mAb daratumumab (final concentration: 10 µg/mL; Janssen, UK), or PBS – used for antibody-independent CDC controls – at a volume of 50 µL were added to respective wells (excluding spontaneous and maximum lysis conditions) before labelled Raji, RPMI-8226, and ATRA-8226 cells were seeded at 5 × 10³ cells per well in 25 µL PBS. PBS was added to ensure all wells achieved a final volume of 200 µL. Maximum lysis replicates remained as a 100 µL volume during incubation after which time 100 µL of lysis buffer was added to achieve a 200 µL final volume, as discussed next. Plates were incubated for 45-minutes in the dark at 37 °C, 5% CO2.
Following incubation, 100 µL of lysis buffer (4% Triton X-100; Invitrogen™, Thermo Fisher Scientific, Loughborough, UK) was added to maximum lysis replicates and plates were centrifuged at 100 × g for 2-minutes. Next, 75 µL of acellular supernatant from each well was transferred to a non-treated flat-bottom, black, 96 well plate (Corning™, Thermo Fischer Scientific, Loughborough, UK) and fluorescence (485 nm, 530 nm) was measured using a Pherostar plate reader (BMG Labtech, Ortenberg, Germany) with the gain – based on positive controls –, and the focal height optimised per plate. Relative fluorescence units produced were converted into a percentage of specific lysis using the following equation:
Experimental conditions were seeded in triplicate, and spontaneous and maximum conditions were seeded in six replicates. All procedures involved in CDC assays were undertaken in aseptic conditions.
Statistical analysis
Statistical analysis was carried out using SPSS (IBM SPSS Statistics Version 28, IL, USA). Data are presented as means ± SD unless otherwise stated. Repeated measures analysis of variance (ANOVA) with Bonferroni corrected pairwise comparisons – where significant effects were observed – were performed to determine main effects of condition (flat running, downhill running), time (baseline, immediately post-, 1-hour post-, 24-hours post-, 2-days post-, 4-days post-exercise), and condition*time interactions for all parameters except for DOMS scores which were analysed using the same repeated measures ANOVA but for time-points 24-hours, 2-days, and 4-days post-exercise only, and data for assessing exercise intensity that was averaged across the exercise portion of the trial. Paired sample t-tests (following confirmation of parametric distribution via a Shapiro-Wilk test) were used to determine differences between conditions for data assessing exercise intensity averaged across the exercise trial. Effect sizes from repeated measures ANOVA were reported as partial eta squared (ηp2). Effect sizes were determined small (ηp2 = 0.01), medium (ηp2 = 0.06), or large (ηp2 = 0.14)46. Statistical significance was accepted at p ≤ 0.05. Occasional missing data are reflected in the reported degrees of freedom.
Results
Characteristics of exercise
All participants completed one bout of flat running and one bout of downhill running. Anaerobic threshold occurred at a V̇O2 of 30.4 ± 5.4 mL⋅kg−1⋅min−1, corresponding to a speed of 8.1 ± 1.2 km⋅hr−1. Table 1 presents results from the exercise trials, including speed corresponding to + 15% of anaerobic threshold (km⋅hr−1), V̇O2 (mL⋅kg−1⋅min−1), relative V̇O2 as a percentage of anaerobic threshold (%), V̇CO2 (mL⋅kg− 1⋅min−1), respiratory exchange ratio, heart rate (bpm), heart rate as a percentage of age-predicted maximum (%), and RPE (Borg 6–20 scale). During flat running trials, participants ran approximately 13% above anaerobic threshold, whilst during downhill running trials, participants ran below anaerobic threshold (− 16%), which is expected due to the lower aerobic cost running downhill.
Table 1.
Characteristics of exercise during flat running and downhill running conditions. Data are mean ± SD, n = 8.
| Flat running | Downhill Running | |
|---|---|---|
| Speed (km⋅hr− 1) | 9.4 ± 1.3 | 9.4 ± 1.3 |
| V̇O2 (mL⋅kg−1⋅min−1) | 33.6 ± 5.8 | 25.0 ± 4.9*** |
| V̇O2 (% anaerobic threshold) | 112.9 ± 25.7 | 84.3 ± 19.7*** |
| V̇CO2 (mL⋅kg−1⋅min−1) | 27.9 ± 4.8 | 20.7 ± 4.2** |
| Respiratory exchange ratio | 0.83 ± 0.06 | 0.82 ± 0.07 |
| Heart rate (bpm) | 152 ± 23 | 134 ± 23* |
| Heart rate (% age predicted max) | 78.8 ± 12.4 | 69.9 ± 12.1* |
| Rating of perceived exertion | 14 ± 1 | 13 ± 1 |
*indicates a significant difference at p < 0.05, **indicates a significant difference at p < 0.01, ***indicates a significant difference at p < 0.001.
Delayed onset muscle soreness (DOMS) following treadmill running
A significant main effect of condition (F(1,7) = 67.50, p < 0.001, ηp2 = 0.91), time (F(2,14) = 38.94, p < 0.001, ηp2 = 0.85), and condition*time interaction (F(2,14) = 21.33, p < 0.001, ηp2 = 0.75) were observed for DOMS scores. Self-reported DOMS scores were greater following downhill running when compared to flat running at 24-hours (+ 463%, p < 0.001), 2-days (+ 371%, p < 0.001), and 4-days (+ 583%, p = 0.003) post-exercise (Fig. 2).
Fig. 2.
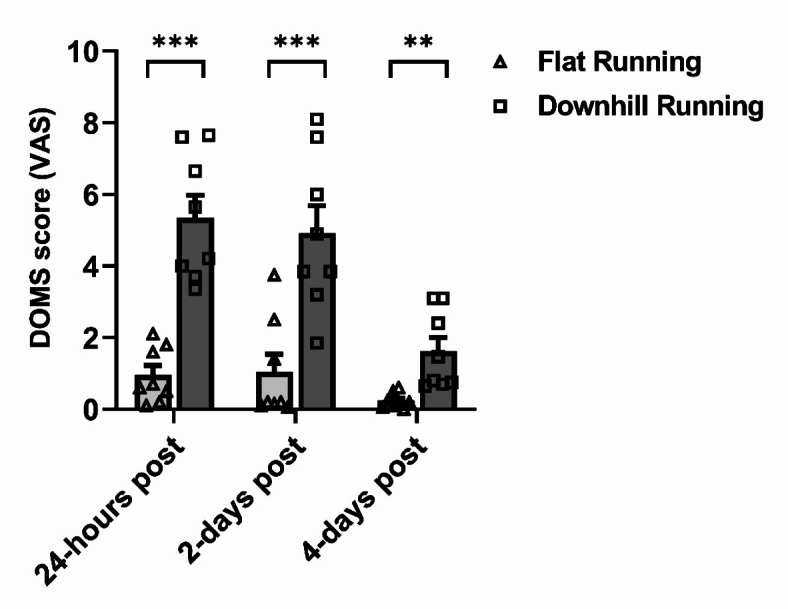
Delayed onset muscle soreness (DOMS) reported on a 10 cm visual analogue scale (VAS) following flat running (light grey bars, triangle data points) and downhill running (dark grey bars, square data points) trials. **indicates a significant difference between running conditions at p < 0.01, ***indicates a significant difference between running conditions at p < 0.001, following post hoc Bonferroni comparisons. Data are mean ± SEM, n = 8.
Plasma volume changes in response to treadmill running
Plasma volume was not different between conditions (F(1,6) = 0.001, p = 0.98, ηp2 < 0.001) but significantly changed over time (F(5,30) = 4.90, p = 0.002, ηp2 = 0.45), with no interaction effects (F(1.79,10.75) = 1.10, p = 0.38, ηp2 = 0.16) (Table 2). Plasma volume increased significantly from 0-hours to 1-hour (+ 14%, p = 0.002), 24-hour (+ 10%, p = 0.002), and 2-days (+ 16%, p = 0.037) following downhill running with no changes observed following flat running. These changes were used to correct data quantified from plasma and serum samples.
Table 2.
Haemodynamic variables from baseline to 4-days post-exercise in flat running and downhill running conditions, with results from repeated measures ANOVA. aValues reflect the summation of monocytes, basophils, and eosinophils. Data are mean ± SD, n = 8.
| Running condition | Baseline | 0-hour | 1-hour | 24-hour | 2-day | 4-day | Effect of condition | Effect of time | Interaction effect | |
|---|---|---|---|---|---|---|---|---|---|---|
| Plasma volume (% whole blood) | Flat | 58.1 ± 2.1 | 56.8 ± 1.6 | 58.4 ± 1.5 | 57.8 ± 2.6 | 58.0 ± 2.9 | 59.7 ± 2.4 |
F(1,6) = 0.001, p = 0.98, ηp2 < 0.001 |
F(5,30) = 4.9, p = 0.002, ηp2 = 0.45 |
F(1.79,10.75) = 1.1, p = 0.36, ηp2 = 0.16 |
| Downhill | 57.6 ± 4.1 | 55.7 ± 2.4 | 58.4 ± 2.2†† | 57.7 ± 2.6†† | 58.8 ± 2.3† | 58.5 ± 2.1 | ||||
| Blood Lactate (mmol/L) | Flat | 0.8 ± 0.2 | 1.9 ± 0.9 | 1.0 ± 0.4 | 0.8 ± 0.3 | 0.9 ± 0.5 | 0.7 ± 0.2 |
F(1,7) = 5.08, p = 0.059, ηp2 = 0.42 |
F(2.00,13.98) = 8.97, p = 0.003, ηp2 = 0.56 |
F(1.69,11.82) = 2.93, p = 0.099, ηp2 = 0.30 |
| Downhill | 0.9 ± 0.4 | 1.1 ± 0.5 | 0.7 ± 0.3 | 1.0 ± 0.3 | 0.8 ± 0.3 | 0.7 ± 0.3 | ||||
| Blood Glucose (mmol/L) | Flat | 5.4 ± 0.2 | 5.7 ± 0.4 | 4.9 ± 0.4 | 5.1 ± 0.4 | 5.1 ± 0.5 | 4.7 ± 1.0 |
F(1,7) = 0.14, p = 0.72, ηp2 = 0.02 |
F(5,35) = 4.08, p = 0.005, ηp2 = 0.37 |
F(5,35) = 1.64, p = 0.18, ηp2 = 0.19 |
| Downhill | 5.1 ± 0.3 | 5.3 ± 0.5 | 4.9 ± 0.4 | 4.9 ± 0.4 | 5.4 ± 0.6 | 5.0 ± 0.5 | ||||
| Leukocytes (×10 9 /L) | Flat | 5.02 ± 1.29 | 6.85 ± 2.08 | 5.57 ± 2.12 | 5.05 ± 1.46 | 4.49 ± 0.92 | 4.56 ± 0.96 |
F(1,6) = 1.4, p = 0.28, ηp2 = 0.19 |
F(5,30) = 11.51, p < 0.001, ηp2 = 0.66 |
F(5,30) = 1.23, p = 0.32, ηp2 = 0.17 |
| Downhill | 5.01 ± 1.33 | 6.38 ± 1.82* | 5.25 ± 1.52† | 4.74 ± 1.23 | 4.70 ± 1.13† | 5.05 ± 1.36 | ||||
| Lymphocytes (×10 9 /L) | Flat | 1.52 ± 0.33 | 2.34 ± 0.74 | 1.27 ± 0.20 | 1.48 ± 0.29 | 1.44 ± 0.36 | 1.42 ± 0.20 |
F(1,6) = 0.01, p = 0.92, ηp2 = 0.002 |
F(1.26,7.55) = 13.23, p = 0.006, ηp2 = 0.69 |
F(2.01,12.04) = 1.43, p = 0.28, ηp2 = 0.19 |
| Downhill | 1.58 ± 0.21 | 2.13 ± 0.49 | 1.34 ± 0.26† | 1.47 ± 0.21 | 1.47 ± 0.17† | 1.48 ± 0.27 | ||||
| Mixed a (×10 9 /L) | Flat | 0.51 ± 0.14 | 0.59 ± 0.21 | 0.44 ± 0.13† | 0.44 ± 0.12 | 0.45 ± 0.10 | 0.46 ± 0.13 |
F(1,6) = 0.36, p = 0.57, ηp2 = 0.06 |
F(5,30) = 9.09, p < 0.001, ηp2 = 0.60 |
F(2.00,11.97) = 1.44, p = 0.28, ηp2 = 0.19 |
| Downhill | 0.52 ± 0.18 | 0.56 ± 0.16 | 0.51 ± 0.17 | 0.43 ± 0.14 | 0.44 ± 0.13 | 0.50 ± 0.16 | ||||
| Neutrophils (×10 9 /L) | Flat | 3.01 ± 1.09 | 3.93 ± 1.48 | 3.85 ± 1.99 | 3.13 ± 1.20 | 2.60 ± 0.74 | 2.68 ± 0.79 |
F(1,6) = 0.47, p = 0.52, ηp2 = 0.07 |
F(5,30) = 6.77, p < 0.001, ηp2 = 0.53 |
F(1.84,10.89) = 0.38, p = 0.67, ηp2 = 0.06 |
| Downhill | 2.90 ± 1.02 | 3.70 ± 1.29* | 3.59 ± 1.53 | 2.84 ± 0.99 | 2.80 ± 0.95 | 3.08 ± 1.30 | ||||
| Platelets (×10 9 /L) | Flat | 215 ± 28 | 292 ± 55* | 215 ± 26† | 216 ± 31† | 213 ± 31† | 219 ± 35† |
F(1,6) = 4.06, p = 0.09, ηp2 = 0.40 |
F(1.70,10.20) = 28.65, p < 0.001, ηp2 = 0.83 |
F(5,30) = 2.50, p = 0.053, ηp2 = 0.29 |
| Downhill | 212 ± 32 | 277 ± 45** | 222 ± 37†† | 227 ± 37† | 223 ± 29 | 230 ± 36 |
*indicates significant difference from Baseline at p < 0.05, **indicates a significant difference from baseline at p < 0.01, †indicates a significant difference from 0-hours post-exercise at p < 0.05, ††indicates a significant difference from 0-hours post exercise at p < 0.01 following post hoc Bonferroni comparisons. Occasional missing data is reflected in the reported degrees of freedom. Due to whole blood count data missing from a baseline sample for one participant, all data corrected for plasma volume change are n = 7. ANOVA, analysis of variance.
C-reactive protein (CRP) changes in response to treadmill running
No significant main effects of condition (F(1,6) = 0.14, p = 0.72, ηp2 = 0.02), or time (F(1.29,7.75) = 0.98, p = 0.38, ηp2 = 0.14), but a significant interaction effect was observed for plasma CRP (F(5,30) = 3.41, p = 0.015, ηp2 = 0.36) (Fig. 3). There were fluctuations observed for CRP 24-hours and 2-days (+ 66% and + 72%, respectively) following downhill running before returning to baseline.
Fig. 3.

Plasma C-reactive protein concentration. (a) C-reactive protein was unchanged between flat and downhill running with no significant changes over time, p > 0.05. (b) Individual responses (transparent lines) and mean (solid black line) during flat running. (c) Individual responses (transparent lines) and mean (solid black line) during downhill running. Data are mean ± SEM, n = 8.
Creatine kinase (CK) changes in response to treadmill running
No significant main effects of condition (F(1,7) = 2.38, p = 0.17, ηp2 = 0.25), time (F(1.33,9.29) = 1.51, p = 0.26, ηp2 = 0.18), or interaction (F(1.09,7.64) = 1.02, p = 0.35, ηp2 = 0.13) were observed for plasma CK concentration (Fig. 4). CK concentrations remained stable from baseline to 1-hour post exercise, after which, there was a fluctuation observed from baseline to 24-hours post flat running (+ 54%), and from baseline to 24-hours and 4-days post downhill running (+ 171% and + 200%, respectively).
Fig. 4.

Plasma Creatine Kinase concentration. (a) Creatine kinase was not different between flat and downhill running conditions and did not significantly change over time, p > 0.05. (b) Individual responses (transparent lines) and mean (solid line) during flat running. (c) Individual responses (transparent lines) and mean (solid line) during downhill running. Data are mean ± SEM, n = 8.
Complement C1q changes in response to treadmill running
The effects of flat and downhill running on blood C1q are displayed in Fig. 5. ANOVA revealed no significant main effects of time (F(5,35) = 0.19, p = 0.96, ηp2 = 0.03), condition (F(1,7) = 0.19, p = 0.97, ηp2 = 0.01), or interaction effect (F(5,35) = 1.37, p = 0.26, ηp2 = 0.16) on C1q concentration. C1q concentration appeared to fluctuate across the blood sampling sessions, with the greatest fluctuation observed from baseline to 2-days (+ 15.7%) post downhill running. Individual variance in C1q concentrations is shown in Fig. 5b and c.
Fig. 5.

Serum C1q concentration during flat and downhill running trials. (a) C1q was not significantly different between flat and downhill running or between time-points, p > 0.05. (b) individual responses (transparent lines) and mean (solid line) during flat running. (c) individual responses (transparent lines) and mean (solid line) during downhill running. Data are mean ± SEM, n = 8.
Complement dependent cytotoxicity (CDC) changes in response to treadmill running
Daratumumab-mediated CDC against RPMI-8226 and ATRA-8226 is shown in Fig. 6A and B, respectively. ANOVA revealed a significant main effect of time for RPMI-8226 and ATRA-8226 (F(2.95,20.68) = 4.05, p = 0.021, ηp2 = 0.37 and F(1.67,10.02) = 8.07, p = 0.01, ηp2 = 0.57, respectively), with no effects of condition (F(1,7) = 1.32, p = 0.29, ηp2 = 0.16 and F(1,6) = 2.30, p = 0.18, ηp2 = 0.28, respectively) or interaction (F(2.37,16.57) = 1.83, p = 0.19, ηp2 = 0.21 and F(5,30) = 0.92, p = 0.48, ηp2 = 0.13 respectively). Lysis of RPMI-8226 and ATRA-8226 was similar across both exercise modalities, with fluctuations observed immediately post-exercise in flat running (+ 73% and + 38%, respectively) and downhill running (+ 49% and + 40%, respectively) trials. ATRA-8226 cell lysis appeared consistently higher than RPMI-8226 during flat running and downhill running trials, but this difference was not statistically significant (F(1,6) = 0.64, p = 0.45, ηp2 = 0.10 and F(1,6) = 1.05, p = 0.35, ηp2 = 0.15, respectively).
Fig. 6.

Monoclonal antibody-mediated CDC against haematological cancer cell lines. (a) Daratumumab-mediated CDC against RPMI-8226 cells was unchanged between flat running and downhill running, and across time points following post hoc Bonferroni comparisons, p > 0.05, n = 8. (b) Daratumumab-mediated CDC against ATRA-8226 cells was unchanged between flat running and downhill running, and across time points following post hoc Bonferroni comparisons (p > 0.05), but was consistently higher than untreated RPMI-8226, p > 0.05, n = 7. (c) Rituximab-mediated CDC against Raji cells was unchanged between flat and downhill running, and across timepoints, p > 0.05, n = 8. Data are mean ± SEM.
Rituximab-mediated CDC against Raji cells is shown in Fig. 6C. A significant main effect of time (F(2.20,15.42) = 3.66, p = 0.047, ηp2 = 0.34) and condition (F(1,7) = 7.72, p = 0.027, ηp2 = 0.53) was observed for Raji cell lysis. Raji cell lysis remained relatively unchanged overtime but was significantly greater in downhill running trials compared to flat running trials 1-hour and 24-hours post exercise (p = 0.041 and p = 0.02, respectively). However, no interaction effect was observed (F(5,35) = 0.83, p = 0.53, ηp2 = 0.11) and thus, significant differences 1-hour and 24-hours post exercise may be driven by baseline differences between running conditions (p = 0.056).
Leukocyte kinetics during treadmill running
Leukocyte kinetics are displayed in Table 2. A significant effect of time was observed for leukocytes (F(5,30) = 11.51, p < 0.001, ηp2 = 0.66), lymphocytes (F(1.26,7.55) = 13.23, p = 0.006, ηp2 = 0.69), mixed cells (reflects the summation of monocytes, basophils, and eosinophils) (F(5,30) = 9.09, p < 0.001, ηp2 = 0.60), neutrophils (F(5,30) = 6.77, p < 0.001, ηp2 = 0.53), and platelets (F(1.70,10.20) = 28.65, p < 0.001, ηp2 = 0.83). Leukocytes (p = 0.048), and neutrophils (p = 0.038) were significantly elevated immediately post downhill running, whilst platelets were significantly elevated immediately post-exercise in both flat running and downhill running trials (p = 0.031 and p = 0.004, respectively) before returning to normal concentrations 1-hour post-exercise and thereafter.
Discussion
The primary objective of this study was to determine if downhill running increased blood C1q and enhanced rituximab- and daratumumab-mediated CDC activity against two haematological cancer cell lines in vitro. A secondary aim was to assess muscle damage and inflammation induced by downhill running. Circulating C1q fluctuated around baseline levels in the hours and days after both flat and downhill running with no differences observed between trials. Additionally, exercise had no effect on CDC activity against haematological cell lines in vitro.
Few studies have investigated the effects exercise-induced muscle damage on blood C1q concentration. Previous research in mouse models shows that serum C1q is significantly elevated by ~ 50 µg/mL following cryo-induced muscle damage47. Although in contrast with our findings, this disparity may be due to the difference in the severity of muscle damage induced. Specifically, the muscle damage induced previously consisted of a liquid nitrogen dipped probe applied directly to exposed muscle of mice47. Although C1q kinetics have not been investigated in the presence of muscle damage induced by an individual bout of exercise in humans, two studies have investigated C1q following individual bouts of aerobic exercise48,49. It was reported that C1q was reduced immediately following 20-minutes of high intensity treadmill running in trained (− 5.2%), and untrained (− 6.4%) prepubescent females aged 10- to 12-years48. Another study reported no change in C1 proteins following 10- to 20-minutes of a moderate-intensity cycling test in healthy humans49. Our findings are consistent with the latter, however they are not comparable with the former study given the differences in age and biological sex48, particularly given that there is an age-associated increase to circulating C1q, linked to sarcopenia50. It is possible that any increase in intramuscular or circulating C1q following downhill running herein may have been used by CRP to facilitate in muscle repair51,52, as previously purported25. This is supported by a study showing that following 12-weeks of descending stair walking (eccentric exercise) plasma C1q is reduced by − 51%, in 30 obese, sedentary females53, indicating that a degree of muscle damage is required for C1q reduction, consistent with resistance training interventions50.
The fluctuations observed in CRP from baseline to 24-hours and 2-days post downhill running herein (+ 66% and + 72%, respectively) in addition to the fluctuations observed in CK from baseline to 24-hours following downhill running (+ 176%) – indicating some degree of muscle damage was present – provides further support to the argument above. However, these fluctuations were largely driven by one individual. Indeed, the elevated CK from baseline to 24-hours following downhill running herein was far less in our study when compared with previous findings (%Δ from baseline to 24-hours post downhill running = + 171% vs. + 710%, respectively)41, likely due to a more vigorous exercise intensity utilised previously (80% of V̇O2 maximum) and that on average, participants V̇O2 herein were below anaerobic threshold (− 16%) when running downhill which might equate to an intensity < 60% of V̇O2 maximum54.
Analogous to the C1q response, mAb-mediated CDC of haematological cancer cell lines was unchanged following either running protocol. CDC mediated by rituximab and daratumumab relies on the binding of C1q to the mAbs Fc-portion following opsonisation of target cells9. Thus, the observation of no change in C1q could support the lack of change observed in CDC activity, however, it is important to acknowledge that other proteins required for classical complement activation were not measured herein. It was observed that ATRA-8226 cell lysis was consistently higher (~ 5%) than RPMI-8226, which aligns with previous findings19. The authors suggested that the non-significant increase in CDC may be the result of a smaller relative increase in the expression of CD38 induced by ATRA treatment when compared to other myeloma cell lines such as, XG119.
These results have clinical implications. We have recently suggested that individual bouts of muscle damaging exercise such as downhill running or resistance training, could be harnessed as a way of improving the efficacy of mAb-mediated CDC in vivo25,29. However, our findings show that muscle damaging exercise provides no additional benefit to mAb efficacy, and therefore, future research should focus on other ways in which exercise may be used as an adjuvant to mAb therapy29. For example, we have shown that cycling for 30-minutes at an intensity 15% above anaerobic threshold increases the frequency of natural killer (NK)-cells in the blood of patients with CLL, resulting in an enhancement of rituximab-mediated ADCC against autologous CLL cells ex vivo9.
It is important to acknowledge that C1q requires other complement proteins (e.g., C1s) to activate the classical complement pathway55. Indeed, previous research has demonstrated increased C1s concentrations for up to three days following ultra-endurance and resistance exercise – which may induce a degree of muscle damage –26–28. Thus, it can be speculated that an increase to C1s concentration occurred herein, however, this was not measured in our study. We sought to focus on C1q because of its clinical relevance to mAb immunotherapy and the limited research investigating C1q kinetics in response to muscle damaging exercise in humans. Nevertheless, future research should quantify various complement protein changes in response to downhill running. Another limitation to this study is that the intensity and/or duration of exercise may not have been sufficient to induce a substantial degree of muscle damage to cause significant changes in CK as seen previously in downhill running models39–41. Indeed, previous studies have increased the speed of the treadmill during downhill running to induce a similar physiological response as flat running to investigate the effects of muscle damaging exercise on blood lymphocytes41. In the present study, despite no change in CK, the differences found in self-reported DOMS scores (1.38–4.40 VAS, Fig. 2) between flat and downhill running indicate that the procedures induced significant stress on the lower limb musculature. The concentration of C1q pre-exercise and over time in flat and downhill running trials was heterogenous, but no trends specific to downhill running were observed for our primary outcome measures – C1q, and CDC activity.
In summary, this is the first study to investigate C1q kinetics, and examine the efficacy of rituximab- and daratumumab-mediated CDC against haematological cell lines following muscle damaging exercise in humans in vitro. Our findings show that blood C1q was unchanged in response to downhill or flat running, and there was no effect of exercise on mAb-mediated CDC in vitro.
Author contributions
H.D.C-B., F.F.B., A.J.C., J.E.T. and J.P.C. designed the study. K.L.C., J.C.G. and M.S.C. provided expertise for the development of the methodologies used. H.D.C-B., F.F.B., A.J.C., D.R.R. and L.R. optimised experimental assay’s. H.D.C-B. recruited the participants. H.D.C-B., F.F.B., A.J.C., L.R., D.R.R., N.B., and R.E., collected data and were present for trial days. H.D.C-B. and L.R. performed experiments and analysed data. H.D.C-B. drafted the first version of the manuscript. S.M., J.E.T. and J.P.C. secured funding that supported this work. S.M., J.M., J.E.T. and J.P.C. provided supervision and critical review of the results. H.D.C-B., J.E.T. and J.P.C finalised the manuscript. All authors contributed to the article and approved the submitted version.
Funding
This study was supported by Cancer Research UK (grant number: C60293/A28497).
Data availability
The datasets generated during and/or analysed during the current study are available from the corresponding author on reasonable request.
Declarations
Competing interests
The authors declare no competing interests.
Footnotes
Publisher’s note
Springer Nature remains neutral with regard to jurisdictional claims in published maps and institutional affiliations.
References
- 1.Weiner, L. M., Surana, R. & Wang, S. Monoclonal antibodies: versatile platforms for cancer immunotherapy. Nat. Rev. Immunol.10, 317–327. 10.1038/nri2744 (2010). [DOI] [PMC free article] [PubMed] [Google Scholar]
- 2.Salles, G. et al. Rituximab in B-Cell Hematologic malignancies: a review of 20 years of clinical experience. Adv. Ther.34, 2232–2273. 10.1007/s12325-017-0612-x (2017). [DOI] [PMC free article] [PubMed] [Google Scholar]
- 3.Lokhorst, H. M. et al. Targeting CD38 with daratumumab monotherapy in multiple myeloma. N. Engl. J. Med.373, 1207–1219. 10.1056/NEJMoa1506348 (2015). [DOI] [PubMed] [Google Scholar]
- 4.Tsao, L. C., Force, J. & Hartman, Z. C. Mechanisms of therapeutic antitumor monoclonal antibodies. Cancer Res.81, 4641–4651. 10.1158/0008-5472.CAN-21-1109 (2021). [DOI] [PMC free article] [PubMed] [Google Scholar]
- 5.Scott, A. M., Wolchok, J. D. & Old, L. J. Antibody therapy of cancer. Nat. Rev. Cancer. 12, 278–287. 10.1038/nrc3236 (2012). [DOI] [PubMed] [Google Scholar]
- 6.Grandjean, C. L. et al. Intravital imaging reveals improved Kupffer cell-mediated phagocytosis as a mode of action of glycoengineered anti-CD20 antibodies. Sci. Rep.6, 1–6. 10.1038/srep34382 (2016). [DOI] [PMC free article] [PubMed] [Google Scholar]
- 7.Iannello, A. & Ahmad, A. Role of antibody-dependent cell-mediated cytotoxicity in the efficacy of therapeutic anti-cancer monoclonal antibodies. Cancer Metastasis Rev.24, 487–499. 10.1007/s10555-005-6192-2 (2005). [DOI] [PubMed] [Google Scholar]
- 8.an De Donk, N. W. C. J., Usmani, S. Z. & V, CD38 antibodies in multiple myeloma: mechanisms of action and modes of resistance. Front. Immunol.9, 2134. 10.3389/fimmu.2018.02134 (2018). [DOI] [PMC free article] [PubMed] [Google Scholar]
- 9.Collier-Bain, H. D. et al. A single bout of vigorous intensity exercise enhances the efficacy of rituximab against human chronic lymphocytic leukaemia B-cells ex vivo. Brain Behav. Immun.118, 468–479. 10.1016/J.BBI.2024.03.023 (2024). [DOI] [PubMed] [Google Scholar]
- 10.Wang, S. Y. & Weiner, G. Complement and cellular cytotoxicity in antibody therapy of cancer. Expert Opin. Biol. Ther.8, 759–768. 10.1517/14712598.8.6.759 (2008). [DOI] [PubMed] [Google Scholar]
- 11.Cramer, P. et al. Outcome of advanced chronic lymphocytic leukemia following different first-line and relapse therapies: a meta-analysis of five prospective trials by the German CLL study group (GCLLSG). Haematologica. 100, 1451–1459. 10.3324/haematol.2015.124693 (2015). [DOI] [PMC free article] [PubMed] [Google Scholar]
- 12.Fink, A. M. et al. Prediction of poor outcome in CLL patients following first-line treatment with fludarabine, cyclophosphamide and rituximab. Leuk. 2013. 27, 9. 10.1038/leu.2013.190 (2013). [DOI] [PMC free article] [PubMed] [Google Scholar]
- 13.Moreau, P. et al. Bortezomib, thalidomide, and dexamethasone with or without daratumumab before and after autologous stem-cell transplantation for newly diagnosed multiple myeloma (CASSIOPEIA): a randomised, open-label, phase 3 study. Lancet. 394, 29–38. 10.1016/S0140-6736(19)31240-1 (2019). [DOI] [PubMed] [Google Scholar]
- 14.Paiva, B. et al. Multiparameter flow cytometric remission is the most relevant prognostic factor for multiple myeloma patients who undergo autologous stem cell transplantation. Blood. 112, 4017–4023. 10.1182/blood-2008-05-159624 (2008). [DOI] [PMC free article] [PubMed] [Google Scholar]
- 15.Harjunpää, A., Junnikkala, S. & Meri, S. Rituximab (anti-CD20) therapy of B-cell lymphomas: direct complement killing is superior to cellular effector mechanisms. Scand. J. Immunol.51, 634–641. 10.1046/j.1365-3083.2000.00745.x (2000). [DOI] [PubMed] [Google Scholar]
- 16.Golay, J. et al. Biologic response of B lymphoma cells to anti-CD20 monoclonal antibody rituximab in vitro: CD55 and CD59 regulate complement-mediated cell lysis. Blood. 95, 3900–3908. 10.1182/blood.v95.12.3900 (2000). [PubMed] [Google Scholar]
- 17.Di Gaetano, N. et al. Complement activation determines the therapeutic activity of Rituximab in vivo. J. Immunol.171, 1581–1587. 10.4049/jimmunol.171.3.1581 (2003). [DOI] [PubMed] [Google Scholar]
- 18.de Weers, M. et al. Daratumumab, a Novel Therapeutic Human CD38 monoclonal antibody, induces killing of multiple myeloma and other hematological tumors. J. Immunol.186, 1840–1848. 10.4049/jimmunol.1003032 (2011). [DOI] [PubMed] [Google Scholar]
- 19.Nijhof, I. S. et al. Upregulation of CD38 expression on multiple myeloma cells by all-trans retinoic acid improves the efficacy of daratumumab. Leukemia. 29, 2039–2049. 10.1038/leu.2015.123 (2015). [DOI] [PubMed] [Google Scholar]
- 20.Middleton, O. et al. Complement deficiencies limit CD20 monoclonal antibody treatment efficacy in CLL. Leukemia. 29, 107–114. 10.1038/leu.2014.146 (2015). [DOI] [PubMed] [Google Scholar]
- 21.Yang, R. et al. Is complement C1q a potential marker for tumor burden and immunodeficiency in multiple myeloma? Leuk. Lymphoma. 60, 1812–1818. 10.1080/10428194.2018.1543883 (2019). [DOI] [PubMed] [Google Scholar]
- 22.Xu, W. et al. Enhancing the action of rituximab by adding fresh frozen plasma for the treatment of fludarabine refractory chronic lymphocytic leukemia. Int. J. Cancer. 128, 2192–2201. 10.1002/ijc.25560 (2011). [DOI] [PubMed] [Google Scholar]
- 23.Klepfish, A., Gilles, L., Ioannis, K., Eliezer, R. & Ami, S. Enhancing the action of rituximab in chronic lymphocytic leukemia by adding fresh frozen plasma: Complementrituximab interactions & clinical results in refractory CLL. Ann N Y Acad Sci, vol. 1173, John Wiley & Sons, Ltd; pp. 865–73. (2009). 10.1111/j.1749-6632.2009.04803.x [DOI] [PubMed]
- 24.Nijhof, I. S. et al. CD38 expression and complement inhibitors affect response and resistance to daratumumab therapy in myeloma. Blood. 128, 959–970. 10.1182/blood-2016-03-703439 (2016). [DOI] [PubMed] [Google Scholar]
- 25.Rothschild-Rodriguez, D. et al. The effects of exercise on complement system proteins in humans: a systematic scoping review. Exerc. Immunol. Rev.28, 1–35 (2022). [PubMed] [Google Scholar]
- 26.Balfoussia, E. et al. A proteomic study of plasma protein changes under extreme physical stress. J. Proteom.98, 1–14. 10.1016/j.jprot.2013.12.004 (2014). [DOI] [PubMed] [Google Scholar]
- 27.Semple, S., Smith, L., McKune, A., Neveling, N. & Wadee, A. Alterations in acute-phase reactants (CRP, rheumatoid factor, complement, factor B, and immune complexes) following an ultramarathon. South. Afr. J. Sports Med.16, 17. 10.17159/2413-3108/2004/v16i2a183 (2004). [Google Scholar]
- 28.Oberbach, A. et al. Combined proteomic and metabolomic profiling of serum reveals association of the complement system with obesity and identifies novel markers of body fat mass changes. J. Proteome Res.10, 4769–4788. 10.1021/pr2005555 (2011). [DOI] [PubMed] [Google Scholar]
- 29.Collier-Bain, H. D. et al. Harnessing the immunomodulatory effects of exercise to enhance the efficacy of monoclonal antibody therapies against B-cell haematological cancers: a narrative review. Front. Oncol.13, 1244090. 10.3389/FONC.2023.1244090 (2023). [DOI] [PMC free article] [PubMed] [Google Scholar]
- 30.Malm, C. et al. Immunological changes in human skeletal muscle and blood after eccentric exercise and multiple biopsies. J. Physiol.529, 243–262. 10.1111/j.1469-7793.2000.00243.x (2000). [DOI] [PMC free article] [PubMed] [Google Scholar]
- 31.Frenette, J., Cai, B. & Tidball, J. G. Complement activation promotes muscle inflammation during modified muscle use. Am. J. Pathol.156, 2103–2110. 10.1016/S0002-9440(10)65081-X (2000). [DOI] [PMC free article] [PubMed] [Google Scholar]
- 32.Yang, W. & Hu, P. Skeletal muscle regeneration is modulated by inflammation. J. Orthop. Translat. 13, 25–32. 10.1016/j.jot.2018.01.002 (2018). [DOI] [PMC free article] [PubMed] [Google Scholar]
- 33.Castellano, G. et al. Maturation of dendritic cells abrogates C1q production in vivo and in vitro. Blood. 103, 3813–3820. 10.1182/blood-2003-09-3046 (2004). [DOI] [PubMed] [Google Scholar]
- 34.Tenner, A. J. & Volkin, D. B. Complement subcomponent C1q secreted by cultured human monocytes has subunit structure identical with that of serum C1q. Biochem. J.233, 451–458. 10.1042/bj2330451 (1986). [DOI] [PMC free article] [PubMed] [Google Scholar]
- 35.Zhou, A., Herriott, M. J. & Leu, R. W. Kinetics of the biosynthesis of complement subcomponent C1q by Murine macrophages: effects of Stimulation by Interferon-γ. J. Interferon Res.11, 111–119. 10.1089/jir.1991.11.111 (1991). [PubMed] [Google Scholar]
- 36.Yabumoto, C. et al. Angiotensin II receptor blockade promotes repair of skeletal muscle through down-regulation of aging-promoting C1q expression. Sci. Rep.5, 14453. 10.1038/srep14453 (2015). [DOI] [PMC free article] [PubMed] [Google Scholar]
- 37.Zhang, C. et al. Complement C3a signaling facilitates skeletal muscle regeneration by regulating monocyte function and trafficking. Nat. Commun. 2017;8. 10.1038/s41467-017-01526-z [DOI] [PMC free article] [PubMed]
- 38.Köhne, J. L., Ormsbee, M. J. & McKune, A. J. The effects of a multi-ingredient supplement on markers of muscle damage and inflammation following downhill running in females. J. Int. Soc. Sports Nutr.13, 1–13. 10.1186/s12970-016-0156-5 (2016). [DOI] [PMC free article] [PubMed] [Google Scholar]
- 39.Peake, J. M. et al. Exercise-induced muscle damage, plasma cytokines, and markers of neutrophil activation. Med. Sci. Sports Exerc.37, 737–745. 10.1249/01.MSS.0000161804.05399.3B (2005). [DOI] [PubMed] [Google Scholar]
- 40.Malm, C. et al. Leukocytes, cytokines, growth factors and hormones in human skeletal muscle and blood after uphill or downhill running. J. Physiol.556, 983–1000. 10.1113/jphysiol.2003.056598 (2004). [DOI] [PMC free article] [PubMed] [Google Scholar]
- 41.Simpson, R. J., Florida-James, G. D., Whyte, G. P. & Guy, K. The effects of intensive, moderate and downhill treadmill running on human blood lymphocytes expressing the adhesion/activation molecules CD54 (ICAM-1), CD18 (β2 integrin) and CD53. Eur. J. Appl. Physiol.97, 109–121. 10.1007/s00421-006-0146-4 (2006). [DOI] [PubMed] [Google Scholar]
- 42.Reis, E. S. et al. Sleep and circadian rhythm regulate circulating complement factors and immunoregulatory properties of C5a. Brain Behav. Immun.25, 1416–1426. 10.1016/j.bbi.2011.04.011 (2011). [DOI] [PubMed] [Google Scholar]
- 43.Borg, G. Perceived exertion as an indicator of somatic stress. Scand. J. Rehabil Med.2, 92–98 (1970). [PubMed] [Google Scholar]
- 44.Beaver, W. L., Wasserman, K. & Whipp, B. J. A new method for detecting anaerobic threshold by gas exchange. J. Appl. Physiol.121, 2020–2027. 10.1152/jappl.1986.60.6.2020 (1986). [DOI] [PubMed] [Google Scholar]
- 45.Dill, D. B. & Costill, D. L. Calculation of percentage changes in volumes of blood, plasma, and red cells in dehydration. J. Appl. Physiol.37, 247–248. 10.1152/jappl.1974.37.2.247 (1974). [DOI] [PubMed] [Google Scholar]
- 46.Lakens, D. Calculating and reporting effect sizes to facilitate cumulative science: a practical primer for t-tests and ANOVAs. Front. Psychol.4, 863. 10.3389/fpsyg.2013.00863 (2013). [DOI] [PMC free article] [PubMed] [Google Scholar]
- 47.Yabumoto, C. et al. Angiotensin II receptor blockade promotes repair of skeletal muscle through down-regulation of aging-promoting C1q expression. Sci. Rep.5, 1–15. 10.1038/srep14453 (2015). [DOI] [PMC free article] [PubMed] [Google Scholar]
- 48.Wolach, B. et al. Aspects of leukocyte function and the complement system following aerobic exercise in young female gymnasts. Scand. J. Med. Sci. Sports. 8, 91–97. 10.1111/j.1600-0838.1998.tb00174.x (1998). [DOI] [PubMed] [Google Scholar]
- 49.Nielsen, E. W. et al. C3 is activated in Hereditary Angioedema, and C1/C1-Inhibitor complexes rise during physical stress in untreated patients. Scand. J. Immunol.42, 679–685. 10.1111/j.1365-3083.1995.tb03711.x (1995). [DOI] [PubMed] [Google Scholar]
- 50.Watanabe, S. et al. Serum C1q as a novel biomarker of Sarcopenia in older adults. FASEB J.29, 1003–1010. 10.1096/fj.14-262154 (2015). [DOI] [PubMed] [Google Scholar]
- 51.Mold, C., Gewurz, H. & Du Clos, T. W. Regulation of complement activation by C-reactive protein. Immunopharmacology, vol. 42, Elsevier; pp. 23–30. (1999). 10.1016/S0162-3109(99)00007-7 [DOI] [PubMed]
- 52.Black, S., Kushner, I. & Samols, D. C-reactive protein. J. Biol. Chem.279, 48487–48490. 10.1074/jbc.R400025200 (2004). [DOI] [PubMed] [Google Scholar]
- 53.Chen, T. C. et al. Changes in plasma C1q, apelin and adropin concentrations in older adults after descending and ascending stair walking intervention. Sci. Rep.11, 1–11. 10.1038/s41598-021-96631-x (2021). [DOI] [PMC free article] [PubMed] [Google Scholar]
- 54.Ghosh, A. K. Anaerobic threshold: its Concept and Role in endurance Sport. Malays J. Med. Sci.11, 24 (2004). [PMC free article] [PubMed] [Google Scholar]
- 55.Merle, N. S., Noe, R., Halbwachs-Mecarelli, L., Fremeaux-Bacchi, V. & Roumenina, L. T. Complement system part II: role in immunity. Front. Immunol.6, 1. 10.3389/fimmu.2015.00257 (2015). [DOI] [PMC free article] [PubMed] [Google Scholar]
Associated Data
This section collects any data citations, data availability statements, or supplementary materials included in this article.
Data Availability Statement
The datasets generated during and/or analysed during the current study are available from the corresponding author on reasonable request.