

Abstract
Acute kidney injury (AKI)‐to‐chronic kidney disease (CKD) transition involves a complex pathomechanism, including inflammation, apoptosis, and fibrosis where long non‐coding RNAs (lncRNAs) play a crucial role in their regulation. However, to date, only a few lncRNAs have been discovered to be involved in the AKI‐to‐CKD transition. Therefore, this study aims to investigate the dysregulated lncRNAs in the AKI‐to‐CKD transition in vitro and in vivo. To mimic AKI‐to‐CKD transition both in vivo and in vitro, bilateral ischemia‐reperfusion (IR) kidney injury was performed in Wistar rats (male), and normal rat kidney epithelial cell (NRK52E) cells were treated with exogenous transforming growth factor‐β1 (TGF‐β1). Further processing and analysis of samples collected from these studies (e.g., biochemical, histopathology, immunofluorescence, and RNA isolation) were also performed, and transcriptomic analysis was performed to identify the dysregulated lncRNAs. Rats subjected to IR showed a significant increase in kidney injury markers (creatinine, blood urea nitrogen (BUN), kidney injury molecule‐1(KIM‐1), and neutrophil gelatinase‐associated lipocalin (NGAL) along with altered cell morphology). Apoptosis, inflammation, and fibrosis markers were markedly increased during the AKI‐to‐CKD transition. Furthermore, transcriptomic analysis revealed 62 and 84 unregulated and 95 and 92 downregulated lncRNAs in vivo and in vitro, respectively. Additionally, functional enrichment analysis revealed their involvement in various pathways, including the tumor necrosis factor (TNF), wingless‐related integration site (Wnt), and hypoxia‐inducible factor‐1 (HIF‐1) signaling pathways. These identified dysregulated lncRNAs significantly contribute to AKI‐to‐CKD transition, and their knockin/out can aid in developing targeted therapeutic interventions against AKI‐to‐CKD transition.
Keywords: acute kidney injury‐to‐chronic kidney disease transition, apoptosis, fibrosis, inflammation, long non‐coding RNAs
A study representing novel dysregulated lncRNAs in AKI‐to‐CKD transition.

Abbreviations
- BUN
blood urea nitrogen
- ELISA
enzyme‐linked immunosorbent assay
- H&E
hematoxylin and eosin
- IR
ischemia‐reperfusion
- KIM‐1
kidney injury molecule 1
- NC
normal control
- NGAL
neutrophil gelatinase‐associated lipocalin
- NRK52E
normal rat kidney tubular epithelial cells
- PSR
picrosirus red
- TGF‐β1
transforming growth factor‐beta1
- TUNEL
terminal deoxynucleotidyl transferase dUTP nick‐end labeling
1. INTRODUCTION
Acute kidney injury (AKI) is a worldwide health concern associated with high morbidity and mortality rates. Approximately 2 million deaths occur annually across the globe due to its severe complications. 1 Recently, AKI has been recognized as a long‐term risk factor for the development of chronic kidney disease (CKD), end‐stage kidney disease (ESKD), and increased mortality. 2 Reports indicate that regardless of total or partial recovery of kidney function after repeated episodes of AKI, the majority of patients tend to develop CKD. Around 15%–20% of the 1.5 million AKI patients develop CKD. 3 The rising burden of the AKI‐to‐CKD transition has pushed researchers to focus on the early identification and treatment of AKI, thus enhancing adequate kidney function recovery. Unfortunately, the commonly used biomarker of kidney function, serum creatinine (Scr), does not always accurately indicate full recovery from AKI. 4 This warrants investigations into newer robust biomarkers that could indicate the exact status of kidney recovery and AKI‐to‐CKD transition. Hypoxia is the primary cause of AKI, which causes endothelial cell dysfunction, disruption of peritubular capillaries, and apoptosis of tubular epithelial cells in the kidney. 5 The transition phase contains a more complex pathophysiological environment that alters kidney function during the transition, including oxidative stress, inflammation, and fibrosis. 6 The exact mechanism of the AKI‐to‐CKD transition is still poorly understood.
Importantly, these pathomechanisms are extensively regulated by long non‐coding RNAs (lncRNAs) in various diseases, including kidney disease. 7 Recently, lncRNAs have emerged as a biomarker, contributor, and therapeutic target in AKI, AKI‐to‐CKD transition, and CKD. 8 For instance, Ma T et al. demonstrated that the upregulation of lncRNA nuclear paraspeckle assembly transcript 1 (NEAT1) leads to tubular epithelial cell apoptosis, tubulointerstitial inflammation, and fibrosis, thereby promoting AKI‐to‐CKD transition. 9 Further, Dong X et al. showed that upregulation of lncRNA H19 increased the progression of fibrosis in IR‐induced AKI‐to‐CKD transition. 10 However, only a few lncRNAs have been discovered as therapeutic targets in the AKI‐to‐CKD transition. Therefore, it is essential to identify dysregulated lncRNAs and understand their role in the progression of AKI‐to‐CKD. Moreover, epithelial‐to‐mesenchymal transition (EMT) plays an important role in the development of tubulointerstitial fibrosis during the AKI‐to‐CKD transition. 11 Further, transforming growth factor‐β1 (TGF‐β1) is a key inducer of EMT in various in vitro models to mimic the EMT during the AKI‐to‐CKD transition. 12 , 13 Hence, to mimic the AKI‐to‐CKD transition in the present study, the bilateral ischemia‐reperfusion injury (IRI) in kidneys was performed in vivo, and NRK52E cells were exposed to exogenous TGF‐β1in vitro. Finally, we conducted transcriptomic analysis to identify dysregulated lncRNAs in the AKI‐to‐CKD transition both in vitro and in vivo.
2. MATERIALS AND METHODS
2.1. Chemicals, kits, and antibodies
Recombinant Human TGF‐β1 (#10021) was purchased from PeproTech USA. ELISA kits for kidney injury molecule‐1 (KIM‐1; #E–EL‐R3019), neutrophil gelatinase‐associated lipocalin (NGAL; #E–E–EL‐R3055), rat TGF‐β (#E‐E‐EL‐0162), rat fibronectin (#E‐EL‐R0578) ELISA kit were purchased from Elabscience, USA. Creatinine (#Creatinine 200) and blood urea nitrogen (BUN; #BUN 200) estimation kits were procured from Accurex, India. The antibodies against α‐Smooth Muscle (#19245), Collagen I (#72026), and TNF‐α (#11948S) were obtained from Cell Signaling Technology (Danvers, MA, USA). Reagents used in cell culture studies, including Dulbecco's Modified Eagle Medium (DMEM; #ATat006F) and fetal bovine serum (FBS; #RM1112), were obtained from HiMedia Laboratories (India).
2.2. Animal study
Male Wistar rats (200–220 gm) were procured from the Central Animal Facility at BITS Pilani, Rajasthan, following ethical approval (IAEC/RES/31/21). The animals were housed in a controlled environment with a 12‐h light‐dark cycle and maintained temperatures between 20°C and 25°C and humidity levels ranging from 40% to 70%. Animals were divided into the following n = 6 per group with three different time points: (1) Normal control (NC) 24 h, (2) NC 14 days, (3) NC 28 days, (4) Ischemia‐reperfusion (IR) 24 h, (5) IR 14 days, (6) IR 28 days (Figure 1). To induce the AKI‐to‐CKD transition, bilateral IRI model was used involving 20 min ischemia followed by reperfusion for the next 24 h, 14 days, and 28 days, respectively. Briefly, rats were anesthetized, and then a half‐inch incision was made on the flank portions of the abdomen, and kidneys were pulled out using blunt forceps. Non‐traumatic bulldog clamps were applied across the renal pedicles for 20 min. After the ischemia period, the clamps were removed, and the layers of skeletal muscle and skin were sutured separately. Animals received 1 mL of normal saline and were maintained for 24 h, 14 days, or 28 days. Blood and urine were collected at specified times, and animals were sacrificed for kidney tissue collection.
FIGURE 1.

Experimental design for in vivo and in vitro work.
2.3. Biochemical analysis
Biochemical parameters, including plasma creatinine (PCr) with the limit of quantification (LOQ 52.2 μmol/L), blood urea nitrogen (BUN; LOQ 2.1 mmol/L), kidney injury molecule‐1 (KIM‐1; LOQ 0.19 ng/mL), and neutrophil gelatinase‐associated lipocalin (NGAL; LOQ 37.5 pg/mL), were measured. Additionally, the progression of AKI‐to‐CKD was evaluated by detecting the levels of fibrosis markers, including transforming growth factor‐β (TGF‐β; LOQ 0.1 ng/mL) and fibronectin (FN; LOQ 0.75 ng/mL). All of these parameters were estimated according to the manufacturer's instructions.
2.4. RNA isolation
Total RNA was isolated from the proximal convoluted tubule of the rat kidney and NRK52E cells. The proximal tubules from the kidney were isolated using the percoll gradient method, following a previously described protocol. 14 Briefly, rat kidneys were washed with the ice‐cold phosphate buffer solution (PBS), minced, and sieved with a mesh size of 250 μm. The resulting mixture was centrifuged, and the pellet was rewashed with ice‐cold PBS. To each pellet, 20% percoll reagent was added, followed by another round of centrifugation at 30 000 g for 30 min, a distinct tubular band from four bands (B1–B4) was separated and lysed to isolate the total RNA. RNA isolation was performed using an RNA isolation kit (Invitrogen) following the manufacturer's guidelines. Transcriptomic analysis was performed at the Unipath Specialty Laboratory Limited to identify dysregulated lncRNAs during the AKI‐to‐CKD transition.
2.5. Histological analysis and immunohistochemistry
To evaluate morphological changes in kidney tissue, hematoxylin, and eosin (H&E), staining was performed (like tubular vacuolation, necrosis, and dilatation). 15 In brief, parts of the kidney tissue were taken from each rat and fixed in 10% formalin in PBS, followed by paraffin embedding, 3–5 μm sections were taken using a microtome and stained with H&E, 4–5 stained kidney sections were observed under the brightfield microscope for histological alteration. Semi‐quantitative scoring ranging from 0 to 3 to assess tubular injury in the kidneys, with 0 indicating no abnormalities, 1 indicating less than 25% affected area, 2 indicating 25–50% affected area, and 3 indicating more than 50% affected area in the tissue was given to the stained images by a blinded observer. Similarly, picrosirius red (PSR) staining was performed to measure collagen deposition during the AKI‐to‐CKD transition. 16 For immunohistochemistry (IHC), the sections were incubated with the anti‐alpha smooth muscle actin (α‐SMA) primary antibody in 1:200 v/v dilutions followed by horseradish peroxidase (HRP) conjugated secondary antibody incubation, diaminobenzidine (DAB), and dehydration step. Stained sections (n = 6) were observed, and images were collected using a bright‐field Zeiss microscope with 400× magnification. Further, the PSR and α‐SMA‐positive area were quantified using ImageJ software.
2.6. Development of AKI‐to‐CKD transition in normal tubular kidney cells (NRK52E)
NRK52E cells were procured from NCCS, Pune, India. Cells were maintained in the appropriate growth media DMEM with 10% FBS, 5% CO2, 37°C temperature, and controlled humidified conditions. Cells were divided into the following groups: (1) NC 24 h, (2) NC 48 h, (3) TGF‐β1 24 h [NC exposed with exogenous TGF‐β1 (10 ng/mL)], (4) TGF‐β1 48 h (Figure 1). 13 After that, the cell's morphology was observed under the microscope.
2.7. TUNEL assay
Terminal deoxynucleotidyl transferase dUTP nick‐end labeling (TUNEL) assay was carried out in vitro to examine apoptotic cells in AKI‐to‐CKD transition by using the commercial TUNEL assay kit (Elabscience) according to the manufacturer's instructions. The number of TUNEL‐positive cells in five random areas per group was counted using a confocal microscope (Carl Zeiss LSM 880). Apoptotic cells were identified as green fluorescent cells, and the nuclei were stained with 4′, 6‐diamidino‐2‐phenylindole (DAPI). TUNEL‐positive cells were quantified using ImageJ software.
2.8. Immunofluorescence analysis
An immunofluorescence assay was used to measure tumor necrosis factor‐alpha (TNF‐α) and collagen I expression following the AKI‐to‐CKD transition. NRK52E cells were grown on coverslips, fixed with 2% paraformaldehyde for 15 min, and washed with PBS. 17 Later, the cells were permeabilized with 0.2% Triton X‐100, blocked with BSA for 1 h, and incubated with primary antibodies (1:2000) overnight at 4°C. After incubating the secondary antibody (Alexa‐Fluor 488) for 90 min, the cells were stained with DAPI and visualized with a Carl Zeiss confocal microscope.
2.9. Functional enrichment analysis
Gene ontology (GO) enrichment and Kyoto encyclopedia of gene and genome (KEGG) pathway analysis were performed for the differentially expressed lncRNAs, which were identified by transcriptomic analysis. GO analysis consists of three parts: biological processes (BP), cellular components (CC), and molecular function (MF). 18 Moreover, KEGG pathways were assessed using the database for annotation, visualization, and integrated discovery (DAVID; https://david.abcc.ncifcrf.gov/). The top 20 KEGG pathways were selected based on the fold enrichment score. Moreover, enrichment analysis results were visualized by an online interface, SRPLOT.
2.10. Statistical analysis
Throughout the manuscript, experimental values are expressed as mean ± SD (n = 6 or 3). All n values represent independent biological replicates, with each n corresponding to an individual animal or independent cell‐based assay. Two‐way ANOVA was used for analysis and statistical comparison between different groups. Tukey test was employed for multiple comparisons using Graph Pad Prism software. Data were considered statistically significant if p < .05.
3. RESULTS
3.1. Alteration in biochemical parameters during IR‐induced AKI‐to‐CKD transition
IR rats showed increased PCr and BUN levels compared to NC rats. Additionally, eGFR significantly decreased in IR rats (Figure 2A,C). KIM‐1, a type‐1 transmembrane protein, is elevated in response to proximal tubular damage post‐IR. Similarly, NGAL, a promising AKI biomarker, significantly increased in IR rats compared to NC (Figure 2D,E). Kidney function and injury biomarkers increased with longer reperfusion durations (24 h, 14 days, 28 days), while eGFR significantly reduced, indicating AKI‐to‐CKD progression.
FIGURE 2.

Altered kidney function parameters indicating the transition of AKI toward CKD. The bar graphs represent (A) Plasma creatinine, (B) Blood urea nitrogen (BUN), (C) estimated glomerular filtration rate (eGFR), (D) Kidney injury molecule‐1(KIM‐1), and (E) Neutrophile gelatinase‐associate lipocalin (NGAL). The data are represented as mean ± SD n = 6 independent biological replicates, with each replicate corresponding to a different animal. For statistical comparison, two‐way ANOVA was used where (*) p < .05 vs. NC 24 h, 14 days, and 28 days.
3.2. Morphological alteration in rat kidneys and NRK52E cells during AKI‐to‐CKD transition
H&E staining was performed to examine the morphological alteration in kidney structure. IR leads to pathological changes in kidney structure, including glomerular structural alterations, necrosis, and tubular dilatation compared to control groups. These features were significantly elevated in IR at 14 days and more aggravated in IR at 28 days (Figure 3A,B). NRK52E cells were exposed for 24 and 48 h with exogenous TGF‐β1 (10 ng/mL). Microscopic observation of cultured cells revealed that exogenous TGF‐β1 altered cell morphology, such as condensed structure, loss of cell membrane, and floating dead cells (Figure 3C).
FIGURE 3.
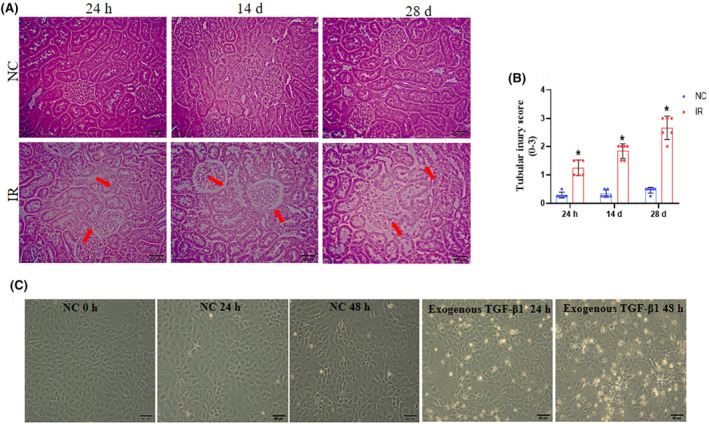
Alteration in the morphology of rat kidney sections and NRK52E cells during AKI‐to‐CKD transition. (A) Representative H&E staining images of the cortical region of the kidney transverse sections (original magnification 400× and scale bar‐50 μm). Tubular dilation and glomerular necrosis are indicated by red arrows. (B) The tubular dilation and glomerular necrosis were analyzed semi‐quantitatively and scored 0 to 3 by a blinded observer. For statistical comparison, two‐way ANOVA was used where (*) p < .05 vs. NC 24 h, 14 days, and 28 days. (C) After exogenous TGF‐β1 (10 ng/mL) treatment, the alteration in tubular cell morphology (cell shrinking and loss of membrane) was observed under a bright field microscope by using a Zeiss microscope.
3.3. Elevated apoptosis and inflammation during AKI‐to‐CKD transition
Apoptosis and inflammation are significant contributors to the pathophysiology of AKI‐to‐CKD transition. 19 To analyze the apoptosis in the AKI‐to‐CKD transition, we performed a TUNEL assay using NRK52E cells. We observed that the TUNEL‐positive cells indicated by a green color significantly (Figure 4A,B) increased at 24 h and 48 h in the exogenous TGF‐β1 group. Furthermore, to check the role of inflammation in the AKI‐to‐CKD transition, the inflammatory maker TNF‐α expression was assessed by immunofluorescence analysis (Figure 4C,D). The result indicates that the expression of TNF‐α was markedly increased in TGF‐β1 24 h compared to NC. It was further notably aggravated in the group exposed to exogenous TGF‐β1 for 48 h, indicating the progression of AKI toward CKD.
FIGURE 4.

Exogenous TGF‐β1 aggravates apoptosis and inflammation in NRK52E cells. (A) TUNEL staining assessed kidney apoptotic cells. (B) Mean TUNEL‐positive NRK52E cells were quantified with green and blue fluorescence marking cells and nuclei, respectively (n = 3). (C) Immunofluorescence showed TNF‐α expression (green color) in NRK52E cells post TGF‐β1 exposure for 24 and 48 h, with blue DAPI‐stained in nuclei (Magnification 630×, scale bar 50 μm). (D) Bar graph displays TNF‐α quantification mean ± SD, n = 3 representing the number of independent biological replicates, with each replicate corresponding to a different batch of cells. Two‐way ANOVA (*) p < .05 vs. NC 24, 48 h.
3.4. IR‐induced increased fibrosis indicating AKI‐to‐CKD transition
AKI undergoes a maladaptive repair process, potentially leading to kidney fibrosis and CKD after IR. 20 We investigated fibrosis progression in the AKI‐to‐CKD transition, the ELISA result demonstrated a substantial increase in fibrosis markers TGF‐β and FN in the 14 days compared to the IR 24 h and NC group. Notably, the rise in these fibrotic markers was more significant in the IR 28 days group (Figure 5A,B). Further, collagen deposition by PSR staining (Figure 5C,D) and α‐SMA expression by immunohistochemistry (Figure 5E,F) was checked. We observed that deposition of collagen and α‐SMA expression was significantly increased in the 14 and 28 days IR groups in a time‐dependent manner. These findings confirmed that the AKI started transitioning toward CKD, consequently leading to the development of CKD in 28 days.
FIGURE 5.

Progression of fibrosis in IR‐induced AKI‐to‐CKD transition. The representative bar graph indicates (A, B) TGF‐β and fibronectin expression levels. (C) PSR‐stained kidney sections show collagen around the glomeruli (red arrows, 400x magnification). (D) Semi‐quantitative analysis of PSR‐positive area. (E) α‐SMA immunohistochemistry (red arrows). (F) Semi‐quantitative analysis. Data presented as mean ± SD n = 6 from individual biological replicates, with each replicate derived from different animals. Image‐J software was used for quantifying the PSR and α‐SMA positive area. Two‐way ANOVA (*) p < .05 vs. NC at 24, 14, and 28 days.
3.5. Exogenous TGF‐β1 triggered fibrosis during AKI‐to‐CKD transition
The transition from AKI‐to‐CKD is characterized by intestinal fibrosis and proliferation of collagen‐secreting myofibroblasts. 21 Furthermore, exogenous TGF‐β1 is a key regulator of collagen deposition. 13 We performed immunofluorescence analysis to confirm collagen I deposition after exposing the NRK52E cells to exogenous TGF‐β1. The expression of collagen I was significantly increased in the exogenous TGF‐β1 24 h group compared to NC, while further, it was markedly elevated in 48 h exogenous TGF‐β1 group, indicating the initiation of fibrosis from 24 h after exposure to exogenous TGF‐β1 and its significant progression at 48 h showed the development of CKD (Figure 6A,B).
FIGURE 6.
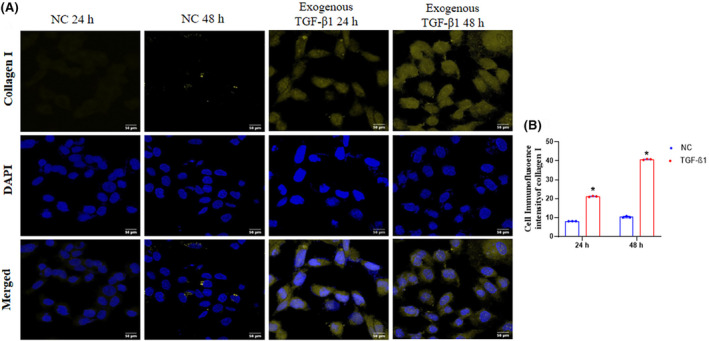
Deposition of collagen in NRK52E after exogenous TGF‐β1 exposure. (A) Immunofluorescence of collagen I (Magnification 630×). Collagen I expression is shown by yellow, and cell nuclei were stained with DAPI, which showed in blue fluorescence. (B) Collagen I fluorescent intensity per group quantified by ImageJ software. Statistical values were represented as mean ± SD n = 3 with each independent biological replicate of different batches of cells. Where (*) p < .05, vs. NC 24 h, NC 48 h.
3.6. Differentially expressed lncRNAs in the kidney during the AKI‐to‐CKD transition
The present study performed deep RNA sequencing to analyze lncRNA landscape and expression in vivo (Wistar rats) and in vitro (NRK52E) samples with different time points. The heatmap (Figure 7A,B) depicts the differential expression of lncRNAs in in vitro and in vivo. We found 62 upregulated and 95 downregulated lncRNAs in the IR groups compared to NC (p < .05). Moreover, in in vitro, 92 lncRNAs were downregulated, and 84 lncRNAs were upregulated in the exogenous TGF‐β1 exposed groups than NC (p < .05). The top 50 highly expressed lncRNAs were selected for the heatmap cluster. The change in expression levels of lncRNAs in AKI, AKI‐to‐CKD transition, and CKD are displayed in heatmaps (Figure 7A,B). Furthermore, we screened the dysregulated lncRNAs that were common in vitro and in vivo using Venn analysis. We observed a total of 24 lncRNAs common in in vitro and in vivo out of the 50 significantly dysregulated lncRNAs (Figure 7C; Table 1; File S1).
FIGURE 7.
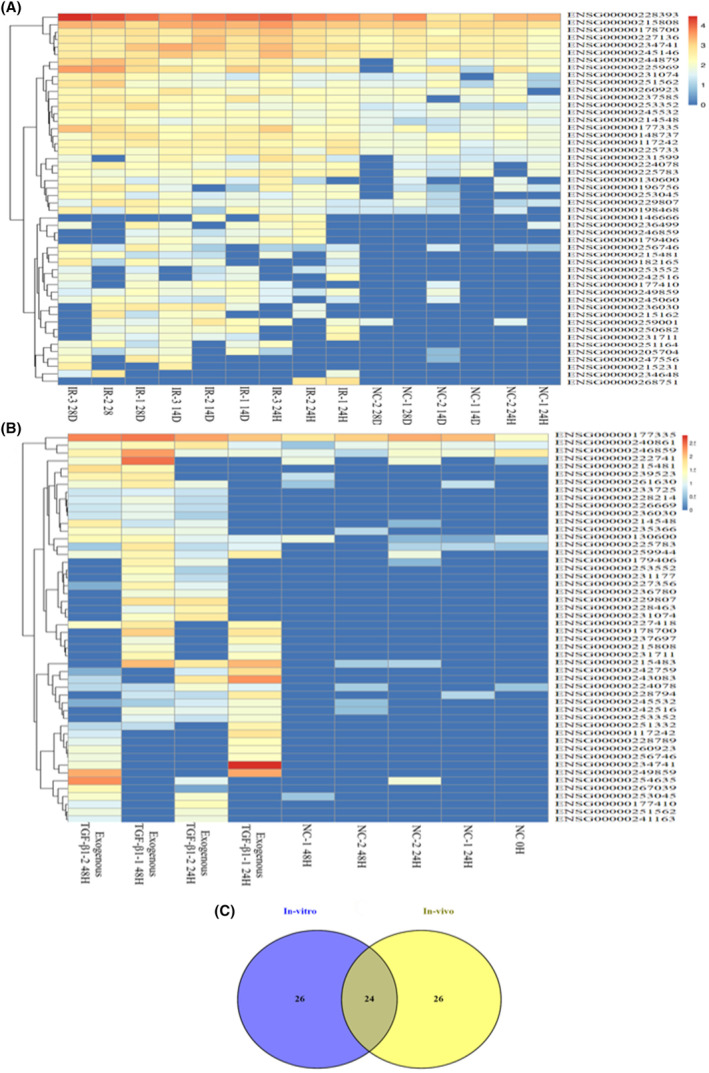
Differentially expressed lncRNAs in vitro and in vivo. The corresponding heat maps represent the differentially expressed lncRNAs (A) in vivo between the IR and NC groups at three different time points (24 h, 14 days, and 28 days). (B) The differentially expressed lncRNAs in vitro between the exogenous TGF‐β1 and NC groups at two different time points (24 and 48 h). The color code in each heat map is linear, with blue indicating the least and red indicating the most significant differentiation. (C) Venn analysis of both in vitro and in vivo showed a total of 24 lncRNAs common out of the 50 dysregulated lncRNAs.
3.7. Functional pathway enrichment analysis of lncRNAs
LncRNAs regulate various pathways involved in the development and progression of kidney disease. In the present study, we conducted functional pathway enrichment analysis to identify dysregulated lncRNAs from in vitro and in vivo studies involved in AKI‐to‐CKD progression. GO enrichment analysis revealed that these lncRNAs are involved in biological processes such as mitochondrial autophagy, histone deacetylase activity, heparan sulfate proteoglycan biosynthesis, mitochondrial electron transport, and hypoxia‐induced apoptotic signaling (Figure 8A). Furthermore, the lncRNAs were enriched in different cellular components, including the beta‐catenin‐TCF7L2 complex, myosin filament, extracellular matrix, and beta‐catenin‐TCF complex (Figure 8B). In addition, these lncRNAs are involved in the modulation of diverse molecular functions, including armadillo repeats domain binding, protein kinase B binding, gamma‐catenin binding, cytokine activity, fibronectin binding, and calcium‐dependent protein kinase activity (Figure 8C).
FIGURE 8.

GO enrichment and KEGG pathway analysis. (A) Top 10 enriched biological processes, (B) Top 10 enriched cellular components, (C) Top 10 enriched molecular function, (D) Top 20 KEGG enriched pathways of the differentially expressed lncRNAs of in vitro and in vivo.
The KEGG pathway enrichment analysis indicated that these lncRNAs play a crucial role in regulating the hippo signaling pathway, Wnt signaling pathway, p53 signaling pathway, HIF‐1 signaling pathway, nod‐like receptor signaling pathway, MAPK signaling pathway, TNF signaling pathway, VEGF signaling pathway, ECM receptor signaling pathway, oxidative phosphorylation, PPAR signaling pathway, mitophagy, and mTORC signaling pathways (Figure 8D). To counter the lncRNAs, modulating these signaling pathways could provide a novel therapeutic approach in the AKI‐to‐CKD transition (Table 2; File S2).
4. DISCUSSION
AKI is a serious health problem with high mortality and morbidity rates. 22 For AKI patients, incomplete recovery may lead to the risk of progression to CKD and ESKD. 23 Previously published evidence has shown that failure in tubular recovery was potentially caused by the severity of the AKI episodes, resulting in the AKI‐to‐CKD transition. 11 , 24 One of the major hindrances to preventing the AKI‐to‐CKD transition is the availability of a reliable biomarker that more accurately indicates kidney health post‐AKI episode and therapeutic targets for the transition toward CKD.
Recently, lncRNAs have been used as a therapeutic target in multiple diseases, such as cancer, neurological disorders, cardiovascular disorders, and kidney disease. 25 , 26 , 27 Furthermore, lncRNAs are known to regulate inflammation, apoptosis, and fibrosis in AKI, AKI‐to‐CKD transition, and CKD. 28 For instance, LncRNA PVT1 upregulation leads to the activation of the NF‐κB pathway, consequently resulting in inflammation during AKI. 29 Further, upregulation of lncRNA XIST increases kidney inflammation, apoptosis, and fibrosis, leading to the development of CKD. 30 Nevertheless, to date, only a few lncRNAs have been identified in the AKI‐to‐CKD transition. Several lncRNAs that can modulate AKI‐to‐CKD progression are yet to be revealed. A comprehensive analysis might reveal more lncRNAs that play a key role in the AKI‐to‐CKD transition.
In the present study, we used a rat bilateral IRI model to mimic AKI‐to‐CKD transition in vivo and a TGF‐β1 (10 ng/mL)‐induced model NRK52E cells to mimic AKI‐to‐CKD transition in vitro. Studies showed that TGF‐β1 at a concentration of 10 ng/mL is a key inducer of tubular and glomerular EMT and ECM deposition during the AKI‐to‐CKD transition. 13 , 31 An increase in the expression of kidney function and injury biomarkers (PCr, BUN, KIM‐1, and NGAL) indicates the severity of AKI. Further, there is a decline in eGFR, a hallmark of CKD. 32 , 33 In this study, the IR‐induced model showed that PCr, BUN, KIM‐1, and NGAL levels were elevated in plasma, which was further increased as the duration of reperfusion prolonged at 14 days and 28 days and decreased in eGFR level, indicating the kidney injury after IR (Figure 2A–E). These findings are consistent with the previously reported study of the bilateral IRI model in AKI‐to‐CKD transition. 33 Apart from these biochemical alterations, IR leads to morphological changes such as loss of brush border and proximal and distal tubular damage diffuse tubular dilation. 34 In the present study, H&E staining showed that the severity of the injury increased with the prolonged duration of reperfusion (Figure 3 A&B). Similar results were observed in in vitro morphology alteration in NRK52E cells after exogenous TGF‐β1 (10 ng/mL) treatment. The alteration in tubular cell morphology (cell shrinking and loss of membrane) and increased cell death was observed at 24 h, which was increased further at 48 h (Figure 3C). It is known that apoptosis causes the death of kidney epithelial cells, which is characteristic of acute and chronic kidney disorders. 35 Further, the TUNEL assay emerges as a potent tool for assessing kidney injury because of the endonuclease enzymes, particularly in the kidney. 36 In the present study, we detected tubular cell apoptosis using a TUNEL assay in NRK52E cells. The green color indicates apoptotic cells after exogenous TGF‐β1 exposed at 24 and 48 h (Figure 4A,B). Additionally, chronic inflammation, oxidative stress, and hypoxia contribute to the AKI‐to‐CKD transition by activating immune cells and the release of pro‐inflammatory cytokines, interleukin‐1‐beta (IL‐1β), TNF‐α results in impaired kidney function, and tissue damage. 37 In the present study, we checked that the expression of TNF‐α is increased in the cells exposed to exogenous TGF‐β1 24 h. Notably, the inflammation significantly increased in exogenous TGF‐β1 48 h group cells (Figure 4C,D).
Various cellular processes and signaling pathways, such as myofibroblast activation, tubular epithelial‐to‐mesenchymal transition (EMT), production of inflammatory molecules, and matrix expansion and remodeling, are associated with AKI‐to‐CKD progression. 38 The TGF‐β signaling pathway activates kidney cells to generate fibrotic extracellular matrix proteins, resulting in glomerulosclerosis and tubulointerstitial fibrosis in CKD progression. 39 The differentiation of myofibroblasts from various potential precursor cells can be identified through the expression of α‐SMA. 40 In this study, we found significantly increased fibrosis markers such as TGF‐β and fibronectin from the 14 and 28 day IR group (Figure 5A,B). Likewise, the PSR and IHC showed the deposition of collagen around the glomeruli and increased expression of α‐SMA was progressively elevated from 14 days to 28 days IR rats (Figure 5C–F). Previous reports have shown increased collagen deposition and α‐SMA expression after IR during AKI‐to‐CKD transition. 20 Fibronectin, produced mainly by fibroblasts, is present in specialized basement membranes and the interstitial matrix. Its secretion initiates the polymerization process, which precedes the deposition and maturation of various other extracellular matrix (ECM) proteins, such as collagen. 41 In the present study, the immunofluorescence assay showed the expression of collagen‐I increased at 24 h and further elevated at 48 h (Figure 6A,B). Taken together, these findings suggested that IR‐induced hypoxia in vivo and exogenous TGF‐β1‐mimick AKI‐to‐CKD transition model. Furthermore, recently, many lncRNAs have been reported as biomarkers in AKI and CKD. LncRNAs H19, metastasis‐associated lung adenocarcinoma transcript 1 (MALAT1), and NEAT1 were upregulated in human biopsies and plasma of AKI patients. 8 In addition, lncRNAs are reported as a therapeutic target in different kidney disease stages, such as lncRNA ischemia‐reperfusion‐associated RNA (IRAR) overexpressed in AKI via modulating inflammation, further knockdown of IRAR significantly reduced the IR‐induced inflammation and subsequently attenuated AKI. 42 Further, HOXA‐AS2 was downregulated in sepsis AKI by regulating Wnt/β‐catenin and NF‐κB pathway. 43 Human leucocyte antigen complex group‐18 (HCG18) was downregulated in AKI by promoting inflammation and apoptosis. 44 Besides AKI, lncRNAs are reported to be equally involved in CKD development, such as lncRNA taurine‐upregulated gene 1(TUG1) was found downregulated in CKD patients. 45 In addition, lncRNA growth arrest‐specific 5 (GAS5) was upregulated in CKD by modulating the MMP9/PTEN pathway leading to fibrosis. 46 Emerging studies also showed the role of few lncRNAs in the AKI‐to‐CKD transition. LncRNAs H19 was upregulated in the AKI‐to‐CKD transition by modulating the fibrosis. 10 Further, the upregulation of lncRNA NEAT1 regulates apoptosis and fibrosis in AKI‐to‐CKD transition. 9 Finding more lncRNAs involved in the AKI‐to‐CKD transition is essential to track disease progression. Therefore, this study conducted transcriptomic analysis to uncover more lncRNAs that play a significant role in the AKI‐to‐CKD transition (Figure 7A,B).
In the present study, lncRNA NEAT1 was upregulated both in vitro and in vivo. Previous reports showed that lncRNA NEAT1 upregulated in ischemia‐induced AKI by modulating the nucleotide‐binding domain, leucine‐rich repeat, and pyrin domain‐containing protein 3 (NLRP3) pathway. 47 In addition, lncRNA maternally expressed gene 3 (MEG3) was upregulated in LPS‐induced AKI by modulating the Gasdermin‐D mediated pyroptosis. 48 This study found that lncRNA MEG3 was upregulated in IR‐induced rats and NRK52E cells. In accordance with previous findings, MALAT1 was upregulated in IR‐induced AKI by regulating inflammation and fibrosis. 49 Another study showed the upregulation of lncRNA MALAT1 in CKD via modulating the NLRP3 signaling cascade. 50 In the present study, MALAT1 was upregulated in both in vitro and in vivo models of AKI‐to‐CKD transition. Further, lncRNAs H19 regulate the Wnt/β‐catenin signaling pathway, leading to AKI‐to‐CKD progression. 10 In this study, lncRNA H19 was also upregulated. Furthermore, lncRNA LINC00174 was upregulated in diabetic retinopathy via miR‐26a‐5p/PTEN/Akt signaling mediated pyroptosis. 51 In the present study, lncRNA LINC00174 was upregulated during the AKI‐to‐CKD transition. Moreover, lncRNA myocardial infarction‐associated transcript (MIAT) was upregulated in LPS‐induced AKI via BECN1‐dependent autophagy and TGF‐β1, IR, and UUO‐induced CKD. 52 In this study, MIAT was upregulated in exogenous TGF‐β1‐induced and IR‐induced AKI‐to‐CKD transition models. In addition, lncRNAs SNHG14 was upregulated in diabetic nephropathy (DN) via the miR‐30e‐5p/SOX4 axis. 53 In the current study, lncRNA, SNHG14, was also upregulated in the AKI‐to‐CKD transition. We observed the altered lncRNA expression in both in vivo and in vitro models of AKI‐to‐CKD transition. Furthermore, the functional enrichment analysis showed the involvement of these identified lncRNAs in various pathways such as the hippo signaling pathway, wnt signaling pathway, p53 signaling pathway, Nod‐like receptor signaling pathway, mTORC pathway, PI3K‐Akt signaling pathway and MAPK signaling pathway (Figure 8A,D). Reported study showed lncRNA MALAT1 regulates the diabetic cardiac fibroblast via the hippo‐YAP signaling pathway. 54 Overexpression of lncRNA HOXA‐AS2 regulates the NF‐κB signaling pathway and contributes to sepsis‐induced AKI development. 43 In addition, lncRNA NEAT1 regulates the p53 signaling pathway in the AKI‐to‐CKD transition. 9 LncRNA LINC00520 promotes AKI through the PI3K/Akt signaling pathway. 55 Furthermore, lncRNA NEAT1 overexpression regulates the NLRP3 inflammasome pathway in AKI. 56 Targeting the candidate lncRNA that regulates these pathways could offer a new therapeutic approach for managing the AKI‐to‐CKD transition.
Besides these findings, our study has some limitations. We have not checked the mechanistic understanding of how these lncRNAs contribute to the progression of AKI‐to‐CKD transition and the possible therapeutic approach to target these lncRNAs to prevent the AKI‐to‐CKD transition. Moreover, future studies can be done to address the precise role and mechanism of these lncRNAs in AKI‐to‐CKD transition.
5. CONCLUSION
The study findings demonstrated the AKI‐to‐CKD transition model in rats by bilateral IRI and chemically mimicked the condition in NRK52E cells using exogenous TGF‐β1. Significant alterations in kidney injury markers (PCr, BUN, KIM‐1, NGAL) and reduced eGFR, significant morphological changes, and increased inflammation and fibrosis markers in both in vivo and in vitro. Transcriptomic analysis revealed the dysregulation of several lncRNAs, including NEAT1, MEG3, MALAT1, H19, and MIAT, in different stages of the AKI‐to‐CKD transition. Functional pathway enrichment analysis revealed these lncRNAs involved in various pathways such as the Hippo‐YAP signaling pathway, MAPK signaling pathway, mitophagy, Wnt signaling pathway, apoptosis pathways, and HIF‐1 signaling pathway. Further research is needed to explore the role of these identified dysregulated lncRNAs in regulating these pathways so that target interventions can be developed to mitigate the AKI‐to‐CKD transition.
AUTHOR CONTRIBUTIONS
BP: Conceptualization, manuscript designing, writing—original draft, methodology, investigation, data analysis. SM: Manuscript review & editing. ABG: Conceptualization, design of the experiment, supervision, writing‐ review & editing of the manuscript. All authors read and approved the final manuscript.
CONFLICT OF INTEREST STATEMENT
The authors declare no conflicts of interest.
ETHICS STATEMENT
The animal experimentation of this study was performed as per the ARRIVE guidelines and approval of the institutional animal ethical committee (Approval no. IAEC/RES/31/21).
Supporting information
Table 1.
Table 2.
ACKNOWLEDGMENTS
ABG sincerely acknowledges the financial support provided by the Indian Council of Medical Research, Government of India [Grant No. 54/14/2022‐HUM/BMS] to carry out this work.
Puri B, Majumder S, Gaikwad AB. Novel dysregulated long non‐coding RNAs in the acute kidney injury‐to‐chronic kidney diseases transition unraveled by transcriptomic analysis. Pharmacol Res Perspect. 2024;12:e70036. doi: 10.1002/prp2.70036
DATA AVAILABILITY STATEMENT
The data that support the findings of this study are available on request from the corresponding author.
REFERENCES
- 1. Sawhney S, Bell S, Black C, et al. Harmonization of epidemiology of acute kidney injury and acute kidney disease produces comparable findings across four geographic populations. Kidney Int. 2022;101(6):1271‐1281. [DOI] [PubMed] [Google Scholar]
- 2. James MT, Bhatt M, Pannu N, et al. Long‐term outcomes of acute kidney injury and strategies for improved care. Nat Rev Nephrol. 2020;16(4):193‐205. [DOI] [PubMed] [Google Scholar]
- 3. Habshi T, Shelke V, Kale A, et al. Hippo signaling in acute kidney injury to chronic kidney disease transition: current understandings and future targets. Drug Discov Today. 2023;28(8):103649. [DOI] [PubMed] [Google Scholar]
- 4. Gorelik Y, Abassi Z, Bloch‐Isenberg N, et al. Changing serum creatinine in the detection of acute renal failure and recovery following radiocontrast studies among acutely ill inpatients: reviewing insights regarding renal functional reserve gained by large‐data analysis. Practical Laboratory Medicine. 2022;30:e00276. [DOI] [PMC free article] [PubMed] [Google Scholar]
- 5. Ullah MM, Basile DP. Role of renal hypoxia in the progression from acute kidney injury to chronic kidney disease. Semin Nephrol. 2019;39(6):567‐580. [DOI] [PMC free article] [PubMed] [Google Scholar]
- 6. Song Y, Tao Q, Yu L, et al. Activation of autophagy contributes to the renoprotective effect of postconditioning on acute kidney injury and renal fibrosis. Biochem Biophys Res Commun. 2018;504(4):641‐646. [DOI] [PubMed] [Google Scholar]
- 7. Moreno JA, Hamza E, Guerrero‐Hue M, et al. Non‐coding RNAs in kidney diseases: the long and short of them. Int J Mol Sci. 2021;22(11):6077. [DOI] [PMC free article] [PubMed] [Google Scholar]
- 8. Puri B, Majumder S, Gaikwad AB. Significance of LncRNAs in AKI‐to‐CKD transition: a therapeutic and diagnostic viewpoint. Life Sci. 2024;342:122509. [DOI] [PubMed] [Google Scholar]
- 9. Ma T, Li H, Liu H, et al. Neat1 promotes acute kidney injury to chronic kidney disease by facilitating tubular epithelial cells apoptosis via sequestering miR‐129‐5p. Mol Ther. 2022;30(10):3313‐3332. [DOI] [PMC free article] [PubMed] [Google Scholar]
- 10. Dong X, Cao R, Li Q, et al. The long noncoding RNA‐H19 mediates the progression of fibrosis from acute kidney injury to chronic kidney disease by regulating the miR‐196a/Wnt/β‐catenin signaling. Nephron. 2022;146(2):209‐219. [DOI] [PubMed] [Google Scholar]
- 11. Guzzi F, Cirillo L, Roperto RM, et al. Molecular mechanisms of the acute kidney injury to chronic kidney disease transition: an updated view. Int J Mol Sci. 2019;20(19):4941. [DOI] [PMC free article] [PubMed] [Google Scholar]
- 12. Garmaa G, Manzéger A, Haghighi S, et al. HK‐2 cell response to TGF‐β highly depends on cell culture medium formulations. Histochem Cell Biol. 2024;161(1):69‐79. [DOI] [PMC free article] [PubMed] [Google Scholar]
- 13. Takaori K, Nakamura J, Yamamoto S, et al. Severity and frequency of proximal tubule injury determines renal prognosis. J Am Soc Nephrol. 2016;27(8):2393‐2406. [DOI] [PMC free article] [PubMed] [Google Scholar]
- 14. Sharma N, Malek V, Mulay SR, et al. Angiotensin II type 2 receptor and angiotensin‐converting enzyme 2 mediate ischemic renal injury in diabetic and non‐diabetic rats. Life Sci. 2019;235:116796. [DOI] [PubMed] [Google Scholar]
- 15. Shelke V, Dagar N, Gaikwad AB. Phloretin as an add‐on therapy to losartan attenuates diabetes‐induced AKI in rats: a potential therapeutic approach targeting TLR4‐induced inflammation. Life Sci. 2023;332:122095. [DOI] [PubMed] [Google Scholar]
- 16. Sankrityayan H, Shelke V, Kale A, et al. Evaluating the potential of tauroursodeoxycholic acid as add‐on therapy in amelioration of streptozotocin‐induced diabetic kidney disease. Eur J Pharmacol. 2023;942:175528. [DOI] [PubMed] [Google Scholar]
- 17. Dagar N, Habshi T, Shelke V, et al. Renoprotective effect of esculetin against ischemic acute kidney injury‐diabetic comorbidity. Free Radic Res. 2024;58(2):1‐47. [DOI] [PubMed] [Google Scholar]
- 18. Dagar N, Jadhav HR, Gaikwad AB. Network pharmacology combined with molecular docking and dynamics to assess the synergism of esculetin and phloretin against acute kidney injury‐diabetes comorbidity. Mol Divers. 2024;1‐19. doi: 10.1007/s11030-024-10829-5 [DOI] [PubMed] [Google Scholar]
- 19. Sato Y, Yanagita M. Immune cells and inflammation in AKI to CKD progression. Am J Physiol‐Renal Physiol. 2018;315(6):F1501‐F1512. [DOI] [PubMed] [Google Scholar]
- 20. Dong Y, Zhang Q, Wen J, et al. Ischemic duration and frequency determine AKI‐to‐CKD progression monitored by dynamic changes of tubular biomarkers in IRI mice. Front Physiol. 2019;10:153. [DOI] [PMC free article] [PubMed] [Google Scholar]
- 21. Xu C, Hong Q, Zhuang K, et al. Regulation of pericyte metabolic reprogramming restricts the AKI to CKD transition. Metabolism. 2023;145:155592. [DOI] [PubMed] [Google Scholar]
- 22. Prasad N, Jaiswal A, Meyyappan J, et al. Community‐acquired acute kidney injury in India: data from ISN‐acute kidney injury registry. The Lancet Regional Health‐Southeast Asia. 2024;21:100359. [DOI] [PMC free article] [PubMed] [Google Scholar]
- 23. See EJ, Jayasinghe K, Glassford N, et al. Long‐term risk of adverse outcomes after acute kidney injury: a systematic review and meta‐analysis of cohort studies using consensus definitions of exposure. Kidney Int. 2019;95(1):160‐172. [DOI] [PubMed] [Google Scholar]
- 24. Chawla LS, Bellomo R, Bihorac A, et al. Acute kidney disease and renal recovery: consensus report of the acute disease quality initiative (ADQI) 16 workgroup. Nat Rev Nephrol. 2017;13(4):241‐257. [DOI] [PubMed] [Google Scholar]
- 25. Bhatti GK, Khullar N, Sidhu IS, et al. Emerging role of non‐coding RNA in health and disease. Metab Brain Dis. 2021;36:1119‐1134. [DOI] [PMC free article] [PubMed] [Google Scholar]
- 26. Nadhan R, Isidoro C, Song YS, et. al. Signaling by LncRNAs: structure, cellular homeostasis, and disease pathology. Cells. 2022;11(16):2517. [DOI] [PMC free article] [PubMed] [Google Scholar]
- 27. Zhou Q, Chen W, Yu X‐Q. Long non‐coding RNAs as novel diagnostic and therapeutic targets in kidney disease. Chronic Dis Transl Med. 2019;5(4):252‐257. [DOI] [PMC free article] [PubMed] [Google Scholar]
- 28. Tanemoto F, Mimura I. Therapies targeting epigenetic alterations in acute kidney injury‐to‐chronic kidney disease transition. Pharmaceuticals. 2022;15(2):123. [DOI] [PMC free article] [PubMed] [Google Scholar]
- 29. Yang Q, Sun Q, Jin P. Long non‐coding RNA PVT1 regulates LPS‐induced acute kidney injury in an in vitro model of HK‐2 cells by modulating the miR‐27a‐3p/OXSR1 axis. Exp Ther Med. 2022;24(3):1‐10. [DOI] [PMC free article] [PubMed] [Google Scholar]
- 30. Xia W‐P, Chen X, Ru F, et al. Knockdown of lncRNA XIST inhibited apoptosis and inflammation in renal fibrosis via microRNA‐19b‐mediated downregulation of SOX6. Mol Immunol. 2021;139:87‐96. [DOI] [PubMed] [Google Scholar]
- 31. Harzandi A, Lee S, Bidkhori G, et al. Acute kidney injury leading to CKD is associated with a persistence of metabolic dysfunction and hypertriglyceridemia. Science. 2021;24(2):102046. [DOI] [PMC free article] [PubMed] [Google Scholar]
- 32. Umate S, Choudhary M, Sayyad A, et al. Navigating the landscape: a comprehensive review of biomarkers in acute kidney injury. Multidisciplinary Reviews. 2024;7(7):2024125. [Google Scholar]
- 33. McCallion S. Biomarkers Associated with AKI and CKD and their Progression. Ulster University; 2023. [Google Scholar]
- 34. Nguyen TTU, Nguyen AT, Kim H, et al. Deep‐learning model for evaluating histopathology of acute renal tubular injury. Sci Rep. 2024;14(1):9010. [DOI] [PMC free article] [PubMed] [Google Scholar]
- 35. Sanz AB, Santamari B, Ruiz‐Ortega M, et al. Mechanisms of renal apoptosis in health and disease. J Am Soc Nephrol. 2008;19(9):1634‐1642. [DOI] [PubMed] [Google Scholar]
- 36. Moore CL, Savenka AV, Basnakian AG. TUNEL assay: a powerful tool for kidney injury evaluation. Int J Mol Sci. 2021;22(1):412. [DOI] [PMC free article] [PubMed] [Google Scholar]
- 37. Stenvinkel P, Chertow GM, Devarajan P, et al. Chronic inflammation in chronic kidney disease progression: role of Nrf2. Kidney International Reports. 2021;6(7):1775‐1787. [DOI] [PMC free article] [PubMed] [Google Scholar]
- 38. Huang R, Fu P, Ma L. Kidney fibrosis: from mechanisms to therapeutic medicines. Signal Transduct Target Ther. 2023;8(1):129. [DOI] [PMC free article] [PubMed] [Google Scholar]
- 39. He L, Wei Q, Liu J, et al. AKI on CKD: heightened injury, suppressed repair, and the underlying mechanisms. Kidney Int. 2017;92(5):1071‐1083. [DOI] [PMC free article] [PubMed] [Google Scholar]
- 40. Niculae A, Gherghina ME, Peride I, et al. Pathway from Acute kidney injury to chronic kidney disease: molecules involved in renal fibrosis. Int J Mol Sci. 2023;24(18):14019. [DOI] [PMC free article] [PubMed] [Google Scholar]
- 41. He J, Xu Y, Koya D, et al. Role of the endothelial‐to‐mesenchymal transition in renal fibrosis of chronic kidney disease. Clin Exp Nephrol. 2013;17:488‐497. [DOI] [PubMed] [Google Scholar]
- 42. Jia P, Xu S, Ren T, et al. LncRNA IRAR regulates chemokines production in tubular epithelial cells thus promoting kidney ischemia‐reperfusion injury. Cell Death Dis. 2022;13(6):562. [DOI] [PMC free article] [PubMed] [Google Scholar]
- 43. Wu H, Wang J, Ma Z. Long noncoding RNA HOXA‐AS2 mediates microRNA‐106b‐5p to repress sepsis‐engendered acute kidney injury. J Biochem Mol Toxicol. 2020;34(4):e22453. [DOI] [PubMed] [Google Scholar]
- 44. Zhao W, Zhang Y, Zhang M, et al. Effects of total glucosides of paeony on acute renal injury following ischemia–reperfusion via the lncRNA HCG18/miR‐16‐5p/Bcl‐2 axis. Immunobiology. 2022;227(2):152179. [DOI] [PubMed] [Google Scholar]
- 45. Zhao W, Zhang Y, Zhang M, et al. LncRNA‐TUG1 downregulation is correlated with the development of progressive chronic kidney disease among patients with congestive heart failure. Mol Biotechnol. 2022;64(5):493–498. [DOI] [PubMed] [Google Scholar]
- 46. Guo Y, Li G, Gao L, et al. Exaggerated renal fibrosis in lncRNA Gas5‐deficient mice after unilateral ureteric obstruction. Life Sci. 2021;264:118656. [DOI] [PubMed] [Google Scholar]
- 47. Jiang X, Li D, Shen W, et al. LncRNA NEAT1 promotes hypoxia‐induced renal tubular epithelial apoptosis through downregulating miR‐27a‐3p. J Cell Biochem. 2019;120(9):16273‐16282. [DOI] [PubMed] [Google Scholar]
- 48. Deng J, Tan W, Luo Q, et al. Long non‐coding RNA MEG3 promotes renal tubular epithelial cell pyroptosis by regulating the miR‐18a‐3p/GSDMD pathway in lipopolysaccharide‐induced acute kidney injury. Front Physiol. 2021;12:663216. [DOI] [PMC free article] [PubMed] [Google Scholar]
- 49. Kölling M, Genschel C, Kaucsar T, et al. Hypoxia‐induced long non‐coding RNA Malat1 is dispensable for renal ischemia/reperfusion‐injury. Sci Rep. 2018;8(1):3438. [DOI] [PMC free article] [PubMed] [Google Scholar]
- 50. Huang J, Xu C. LncRNA MALAT1‐deficiency restrains lipopolysaccharide (LPS)‐induced pyroptotic cell death and inflammation in HK‐2 cells by releasing microRNA‐135b‐5p. Ren Fail. 2021;43(1):1288‐1297. [DOI] [PMC free article] [PubMed] [Google Scholar]
- 51. Wang J‐J, Chen ZL, Wang DD, et al. linc00174 deteriorates the pathogenesis of diabetic retinopathy via miR‐26a‐5p/PTEN/Akt signalling cascade‐mediated pyroptosis. Biochem Biophys Res Commun. 2022;630:92‐100. [DOI] [PubMed] [Google Scholar]
- 52. Okuyan HM, Dogan S, Terzi MY, et al. Association of serum lncRNA H19 expression with inflammatory and oxidative stress markers and routine biochemical parameters in chronic kidney disease. Clin Exp Nephrol. 2021;25:522‐530. [DOI] [PubMed] [Google Scholar]
- 53. Wang Y, Yang JJ, Wu C, et al. LncRNA SNHG14 silencing attenuates the progression of diabetic nephropathy via the miR‐30e‐5p/SOX4 axis. J Diabetes. 2024;16(6):e13565. [DOI] [PMC free article] [PubMed] [Google Scholar]
- 54. Wei L, Gao J, Wang L, et al. Hippo/YAP signaling pathway: a new therapeutic target for diabetes mellitus and vascular complications. Ther Adv Endocrinol Metab. 2023;14:20420188231220134. [DOI] [PMC free article] [PubMed] [Google Scholar]
- 55. Tian X, Ji Y, Liang Y, et al. LINC00520 targeting miR‐27b‐3p regulates OSMR expression level to promote acute kidney injury development through the PI3K/AKT signaling pathway. J Cell Physiol. 2019;234(8):14221‐14233. [DOI] [PubMed] [Google Scholar]
- 56. Xue R, Yiu WH, Chan KW, et al. Long non‐coding RNA Neat1, NLRP3 inflammasome, and acute kidney injury. J Am Soc Nephrol. 2024;35(8):998‐1015. doi: 10.1681/ASN.0000000000000362 [DOI] [PMC free article] [PubMed] [Google Scholar]
Associated Data
This section collects any data citations, data availability statements, or supplementary materials included in this article.
Supplementary Materials
Table 1.
Table 2.
Data Availability Statement
The data that support the findings of this study are available on request from the corresponding author.