

Abstract
Background
The immune landscape of breast cancer (BC) in patients from Sub Saharan Africa is understudied. Our aims were to describe the distribution of Tumour Infiltrating Lymphocytes (TILs) within the intratumoural stroma (sTILs) and the leading/invasive edge stroma (LE-TILs), and to evaluate TILs across BC subtypes with established risk factors and clinical characteristics in Kenyan women.
Methods
Visual quantification of sTILs and LE-TILs were performed on Haematoxylin and eosin -stained pathologically confirmed BC cases based on the International TIL working group guidelines. Tissue Microarrays were constructed and stained with immunohistochemistry (IHC) for CD3, CD4, CD8, CD68, CD20, and FOXP3.
Linear and logistic regression models were used to assess associations between risk factors and tumour features with IHC markers and total TILs, after adjusting for other covariates.
Results
A total of 226 invasive BC cases were included. Overall, LE-TIL (mean = 27.9, SD = 24.5) proportions were significantly higher than sTIL (mean = 13.5, SD = 15.8). Both sTILs and LE-TILs were predominantly composed of CD3, CD8, and CD68. We found higher TILs to be associated with high KI67/high grade and aggressive tumour subtypes, although these associations varied by TIL locations. Older age at menarche (≥ 15 vs. < 15 years) was associated with higher CD3 (OR: 2.06, 95%CI:1.26–3.37), but only for the intra-tumour stroma.
Conclusion
The TIL enrichment in more aggressive BCs is similar to previously published data in other populations. The distinct associations of sTIL/LE-TIL measures with most examined factors highlight the importance of spatial TIL evaluations in future studies.
Keywords: Tumour Infiltrating Lymphocytes (TIL), Breast cancer, Tumour characteristics, Immune composition, TIL distribution, Spatial distribution
Background
Although pre-existing inflammation is not currently considered as a risk factor for breast cancer (BC) development, it is generally accepted that infiltration of immunosuppressive leukocytes and accompanying chronic inflammation during tumour progression can influence BC biology [1, 2].
Tumour infiltrating lymphocytes (TILs) are defined as immune cells that are present in or have moved to the tumour and its surrounding microenvironment [3, 4], and are produced by the immune system in response to a neoplastic transformation [5]. Denkert and colleagues [5] demonstrated that a high TIL count in breast tumour tissues was associated with a significant pathologic complete remission (pCR) rate following neoadjuvant therapy compared to low TIL tumours. Further, TILs have been consistently associated with a more favourable prognosis amongst patients with HER2-enriched and triple-negative tumours [6, 7]. Amongst BC molecular subtypes, luminal-A tumours showed the greatest heterogeneity in immune subtypes [8] and a subset of luminal tumours showed higher levels of TILs comparable to those of HER2-enriched and basal-like tumours [9].
Higher levels of TILs also predict for increased responsiveness to chemotherapy independent of estrogen receptor (ER), progesterone receptor (PR), with each 10% increment in TILs associated with a further increase in the rate of pCR [6].
The evaluation of TILs in BC follows standardized guidelines developed by the International TIL working group [4]. Although stromal TILs defined as TILs occupying the stromal areas between the tumour nests are recommended for TIL estimation in routine practice, the evaluation of TILs also includes stroma within the tumour boundaries including the invasive edge [4]. A systematic review and meta-analysis has shown that the predictive value of TILs in treatment response and prognosis might vary not only by TIL densities but also by spatial localizations [10].
The immune landscape of BC in patients from Sub Saharan Africa is understudied and findings are mainly extrapolated from studies in Caucasians and African Americans. We have previously shown that associations between certain BC risk factors such as breastfeeding and obesity and BC subtypes demonstrated different patterns between Kenyan women and African Americans [11].
Although the International TILs working group’s current recommendation is to evaluate stromal TILs as the principal parameter the group still recommends that additional parameters, including TILs at the invasive edge can be included for research purposes to further determine and/or confirm their potential clinical relevance[4]. Furthermore, recent studies have highlighted the importance of spatial distribution of TILs in tumour response to neoadjuvant chemotherapy [12] and in predicting breast cancer recurrence[13]. Additionally, there is limited literature on TILs from underrepresented populations from Sub- –Saharan Africa (SSA) where a large number of genetic variants that are common in African populations may result from the adaptation to unique exposures through natural selection. For example, a recent study found that pathways enriched for signals of adaptation tend to be involved in immune response and wound healing [14], suggesting that African breast cancer may have distinct immune profiles. Recent TCGA (The Cancer Genome Atlas) Pan-Cancer studies identified substantial heterogeneity in immune profiles across and within cancer types as well as within cancer subtypes [8] yet information on spatial immune composition is missing in these TCGA studies based on bulk sequencing analysis, thus studying the spatial distribution of TILs adds to the scant body of knowledge in this area especially in an understudied SSA population.
Given the prognostic value of TILs in BC subtypes, the paucity of specific TIL marker data amongst BC patients from Africa, and the limited data on TIL spatial heterogeneity, our aims were to describe the spatial distributions of TILs and to evaluate their associations across BC subtypes with established risk factors in Kenyan women with BC.
Methods
Case selection
A total of 347 cases with definitive surgical procedures (lumpectomies or mastectomies) were identified for review from a previous study of 838 invasive BC cases collected from multiple hospitals in Kenya [15].
Haematoxylin and eosin (H&E) stained slides and/or corresponding formalin fixed paraffin embedded (FFPE) blocks were retrieved and reviewed. Slides /FFPE blocks were not available for 85 patients hence these cases were excluded from further analysis.
After excluding male breast cancer, DCIS, and duplicated cases and cases with uninterpretable TIL data, a total of 226 invasive BC cases were included in the final analysis for TILs and immune cell markers (Supplementary Figure 1). Compared with 617 remaining cases in the original study but not included in the TIL analysis, these 226 cases had smaller tumours (65.9% vs. 57.9% with <5cm tumours) but had similar distribution of body mass index (BMI) and tumour subtypes (Supplementary Table 1).
Data for BC molecular subtypes were extracted from the previously annotated database as previously described [11]. In brief, molecular subtypes were defined based on the 2013 St. Gallen’s definition [16]; Luminal A: ER+ and PR+, HER2−, and low Ki-67 (<20%) /histologic grade (I or II); luminal B-HER2+: ER+ and/or PR+, and HER2+; luminal B-high proliferative: ER+ and/or PR+, HER2−, and high Ki-67 (≥20%) /histologic grade (III); HER2-enriched: ER−, PR−, and HER2+; and triple-negative (TN): ER−, PR−, HER2−. We combined the two luminal B subtypes as one group in TIL analyses because of the small sample size (Supplementary Figure 2).
Overall TIL quantification on H&E-stained whole slide sections
Semi quantification of the TILs was done on one full thickness 4 um H/E stained section. at a total magnification of 200x on the Olympus microscopeBX43 Model U-SD03, as per current recommended international TIL reporting guidelines [4]. The TILs were counted separately in the tumour stroma within the tumour borders and at the leading/ invasive edge of the tumour. Intratumoural stromal TILs (sTILs) were defined as those dispersed in the stroma between the carcinoma cells and did not directly contact carcinoma cells [4]. Leading/ invasive edge TILs (LE-TILs) were defined as those that were in invasive/leading edge of the tumour but within the tumour boundary. Both the sTILs and LE-TILs were counted within the tumour boundary as per the International TILs Working Group guideline [4]. However, there was no overlap between the two compartments since sTILs were counted in the stroma between the tumour nests whilst LE-TILs were counted in the stroma of the leading edge of the tumour which are a different compartment from the sTILs.
Briefly, TIL (mononuclear cells, lymphocytes, and plasma cells) proportion score of stromal and leading/ invasive edge of BC was assessed in increments of 10 to the nearest 10%. The denominator was the total stromal area and the numerator the TIL quantity occupying the stromal area. As an example, a score of 80% stromal TILs meant that 80% of the stromal area showed a dense mononuclear cell infiltrate. TILs were evaluated only within the borders of the invasive tumour. TILs located outside the tumour border, around DCIS and normal lobules were excluded. Additionally, TILs in tumour zones with crush artefacts, necrosis, regressive hyalinization and in previous core biopsy sites were excluded. In tumours with heterogeneous distribution of TILs, five different fields were counted, and the scores were summarized using an average percentage score for that case. [18]. All TILs were scored blinded to clinicopathologic characteristics. The percent positive stained cells with the total stromal TILs as a denominator were used for analysis for both sTILs and LE-TILs. For this analysis overall stromal TILs were grouped into subgroups. Different cut-off points for sTIL and LE-TIL were used based on their distributions (Figure 1). The distribution for each marker was presented as a mean and range.
Fig. 1.
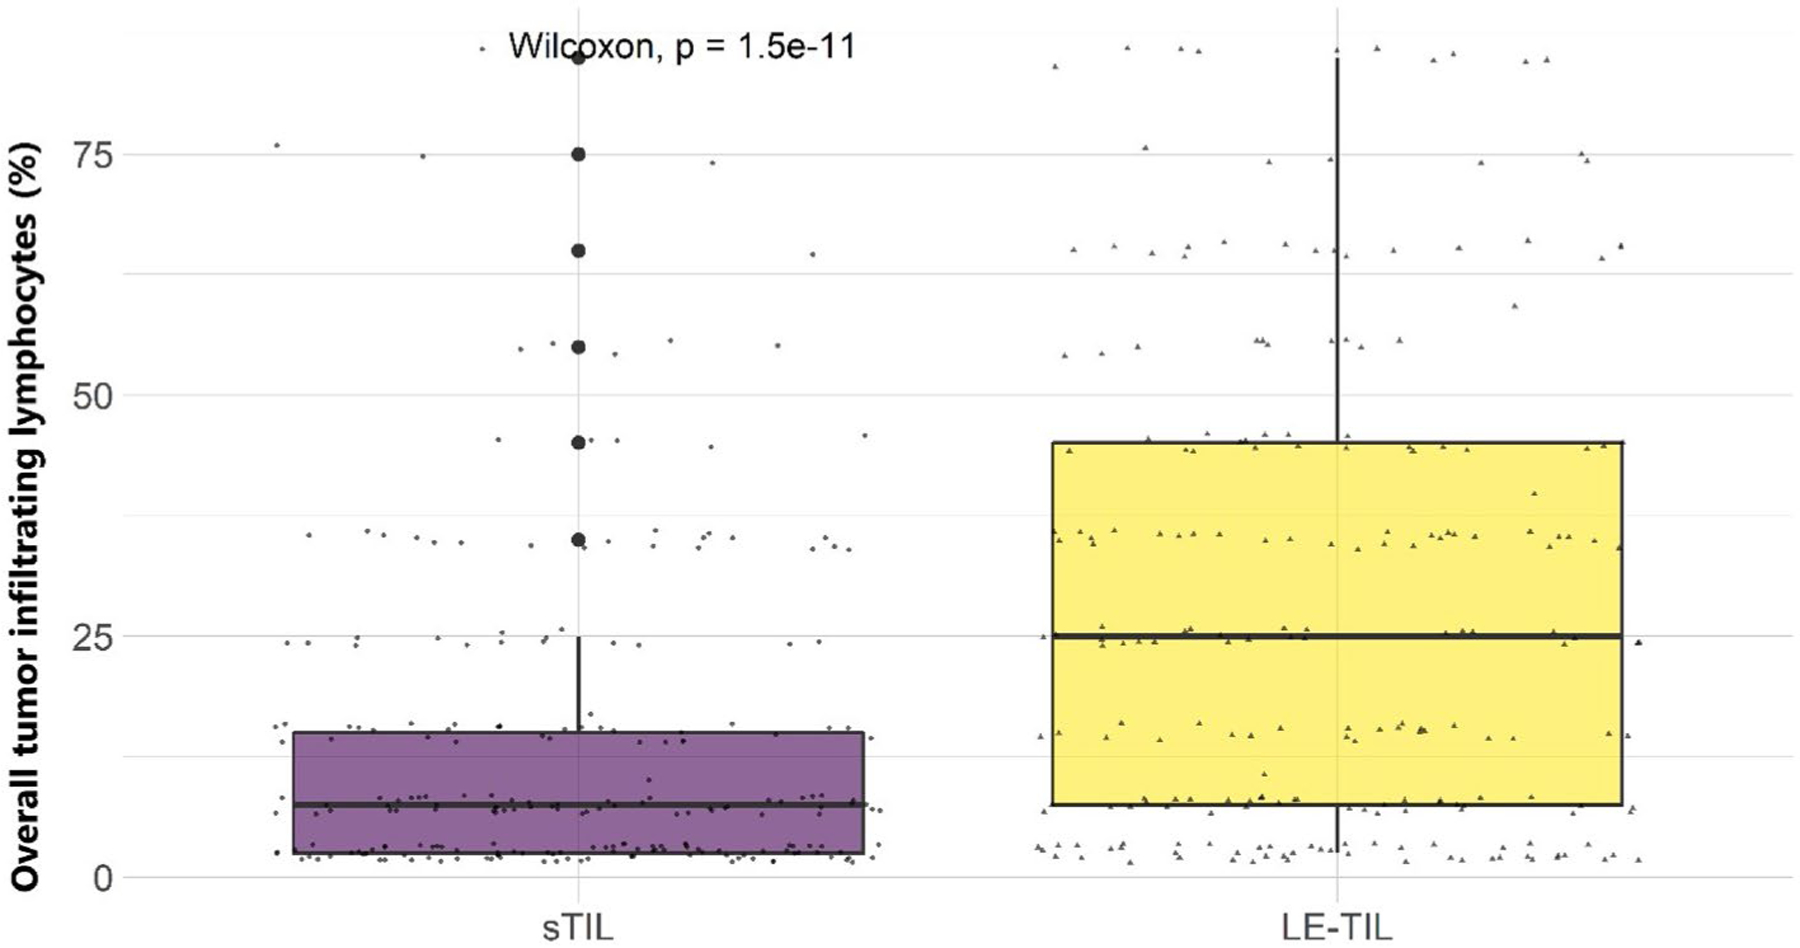
Distributions of overall tumour infiltrating lymphocytes (TILs) by location: intratumoural stromal (sTIL) and leading edge (le-TIL) amongst 226 Kenyan women. The bottom of each boxplot represents the first quartile (25%), the middle line of the box is the median, and the top line represents the third quartile (75%) of the data. The lower and the higher whiskers represent the minimum and the maximum points, respectively, and the outliers are denoted by single points outside the whiskers. The Wilcoxon rank test was used to compare mean differences in overall TILs across the different locations
Tissue microarray (TMA) Construction, Immunohistochemistry (IHC), and TIL assessment
A tissue block of the tumour was used for TMA construction from a total of 262 donor blocks using the semiautomatic tissue microarray instrument (Beecher Instruments Inc., Silver Spring, MD, USA). For each case, two replicate 1-mm core-diameter samples were collected from the marked 6mm circle representing the intratumoural stroma and the leading/invasive edge stroma and each was placed on the same recipient block.
The final TMA consisted of blocks containing duplicates of spots. All samples were spaced 0.5 mm apart.
Immunohistochemical (IHC) stains were performed on an automated tissue-staining system using the Bond Polymer Refine Detection (Leica Biosystems, Buffalo Grove, IL). Tissue sections were stained with monoclonal antibodies: CD3, clone LN10]; CD4, clone 4B12; CD8, clone 4B11; CD20, clone MJI; CD68, clone 514H12and FoxP3 (Abcam ab20034). IHC Detection was done using polymer reagent conjugated with horseradish peroxidase followed by the 3,3′-Diaminobenzidine (DAB) Chromogen Kit (Leica Bio systems, Buffalo Grove, IL). Appropriate positive (lymph node) controls were included. Negative controls were performed without any primary antibody. IHC-stained TMA slides were scanned on the Aperio Digital pathology slide scanner (Leica Biosystems) and imported into the Aperio ImageScope viewer (https://www.leicabiosystems.com/digital-pathology/manage/aperio-imagescope/) for scoring at the Digital and Computational Laboratory, Department of Pathology, Columbia University, NYC.
The IHC regions were defined similarly as previously described for sTILs and LE-TILs. Annotations within regions of interest were performed by the pathologist (SS). For each IHC marker, the expression was quantified using a nuclear algorithm defined as the proportion of positive staining in the specific area (stroma or LE) and not the overall tissue area.
Statistical analysis
For TMA analysis, four cores were available (two that consisted of intratumoural stroma and the other two from leading/invasive edge stromal compartment) for each patient. For each core, we estimated percentage value of positive cells for each IHC marker. Spearman correlation was used to test for concordance between their average and maximum values. We used the average score for the intra-tumoural and the leading-edge compartment for total TILs and the immune cell type after observing a high correlation between the two values (Supplementary figure 3) and based on international TIL working group recommendations [19]. A summary TIL score was also obtained through taking the average of sTILs and LE-TIL scores. Each IHC marker and total TILs were transformed either by square-root or by log transformation, to ensure the normality assumption was met when used as the outcome variable. Generalized linear and logistic regression models were used to assess the associations between risk factors and tumour features with IHC markers and total TILs, after mutually adjusting for other covariates. IHC markers were modelled as outcome variables and were analysed as either continuous variables after appropriate transformation or categorical defined by quartiles or tertiles. We classified the immune markers using quartiles for all but CD20, for which we used tertiles. Overall TIL quantity was also modelled both as a continuous and as a categorical outcome variable. We used different cut-off points for sTIL and LE-TIL based on their distributions (Figure 1). Wilcoxon rank or Kruskal-Wallis test was used to compare mean differences in TILs across locations, or to compare mean differences in immune markers across different TIL subgroups.
All statistical tests in the present study were two-sided and performed using SAS version 9.4 (SAS Institute, Cary, NC, USA) or R version 3.6.3 (R Foundation for Statistical Computing, Vienna, Austria).
Results
After excluding male, DCIS, and duplicated cases and cases with uninterpretable TIL data, a total of 226 invasive BC cases were included in the final analysis for TILs and immune cell markers (Supplementary Figure 1). The mean age at diagnosis amongst these BC patients was 48.3 years and the mean body mass index (BMI) was 27 kg/m2 (overweight category) (Table 1). Our study cases in general are characterized by older age of menarche (mean =15 years), young age at first pregnancy amongst parous women (mean=23 years), higher parity (mean=3 children), and longer cumulative breastfeeding duration (mean=67 months) compared to women in most other populations. The distribution of the tumour subtypes defined by IHC markers was 46.5%, 26.5%, 9.3%, and 17.7 % for luminal A, luminal B, HER2-enriched, and TNBC, respectively (Supplementary Figure2, Table 1). Of the cases included in the analysis, 55% were pre-menopausal and 52% presented at advanced stage of disease (Stages III/IV) (Table 1).
Table 1.
Characteristics of Kenyan breast cancer patients included in the analysis (n = 226)
| N (%), Mean (Range) | |
|---|---|
| Age at diagnosis (year) | 48.33 (26.0–100.0) |
| < 40 | 54 (23.9) |
| 40–50 | 85 (37.6) |
| 50–60 | 46 (20.4) |
| ≥ 60 | 41 (18.1) |
| Body mass index (kg/m2) | 27.33 (15.1–46.9) |
| < 25 | 61 (34.3) |
| ≥ 25 | 117 (65.7) |
| Age at menarche (year) | 14.63 (10.0–20.0) |
| < 15 | 109 (51.2) |
| ≥ 15 | 104 (48.8) |
| Number of children | 3 (0–10) |
| 0 | 9 (4.0) |
| 1 | 22 (9.9) |
| 2 | 50 (22.4) |
| ≥ 3 | 142 (63.7) |
| Age at first pregnancya (year) | 22.79 (14.0–39.0) |
| < 20 | 47 (22.1) |
| 20–25 | 99 (46.5) |
| ≥ 25 | 67 (31.4) |
| Duration of breastfeeding per childa,b (month) | 19.18 (0.2–39.6) |
| < 12 | 32 (15.8) |
| 12–24 | 94 (46.5) |
| ≥ 24 | 76 (37.6) |
| Cummulative duration of breastfeedinga,b (month) | 66.75 (1.0–360.0) |
| < 48 | 67 (33.0) |
| 48–72 | 54 (26.6) |
| ≥ 72 | 82 (40.4) |
| Menopausal status | |
| Pre | 123 (55.2) |
| Post | 100 (44.8) |
| Estrogen receptor status | |
| Negative | 62 (27.4) |
| Positive | 164 (72.6) |
| Progesterone receptor status | |
| Negative | 83 (36.7) |
| Positive | 143 (63.3) |
| Human epidermal growth factor receptor 2 status | |
| Negative | 167 (73.9) |
| Positive | 59 (26.1) |
| KI67c (%) | |
| Low | 156 (70.3) |
| High | 66 (29.7) |
| Tumour subtypes | |
| Luminal A | 105 (46.5) |
| Luminal B | 60 (26.5) |
| HER2-enriched | 21 (9.3) |
| Triple negative | 40 (17.7) |
| Tumour size (cm) | |
| < 2 | 16 (7.5) |
| 2–4 | 94 (43.9) |
| 4–5 | 31 (14.5) |
| ≥ 5 | 73 (34.1) |
| Tumour grade | |
| 1 | 12 (5.3) |
| 2 | 92 (40.9) |
| 3 | 121 (53.8) |
| Lymph nodal involvement | |
| No | 50 (25.9) |
| Yes | 143 (74.1) |
| TNM stage | |
| I | 11 (5.1) |
| II | 93 (42.6) |
| III | 108 (49.5) |
| IV | 6 (2.8) |
Amongst parous women
Amongst women who breastfed
20% was used to separate the population into two groups with respect to their KI67% staining
TIL spatial distribution through H&E assessment in relation to breast cancer risk factors and tumour characteristics
Amongst 226 women, the mean total TILs was 20.7% (SD=18.2), but we found that LE-TIL proportions (mean=27.9, SD= 24.5) were higher than sTIL (mean=13.5, SD=15.8). The spatial distribution of overall TILs obtained by the assessment of H&E-stained whole sections in relation to risk factors and tumour characteristics is presented in Table 2. After adjusting for age at diagnosis and ER status (ER negative used as a reference), we did not observe significant associations between mean total TILs (sTILs, LE-TILs, or the average TIL count) and BC risk factors we examined. However, we found higher TILs associated with high KI67 and high grade (for both sTIL and LE-TIL), TNBC (for sTIL only), and HER2 positive status, luminal B subtype, and smaller tumour size (<5 cm) (for LE-TIL only), after mutually adjusting for other tumour characteristics (Table 2).
Table 2.
Patient and tumour characteristics by Visual Stromal Intratumour (sTIL) and Leading-edge Tumour Infiltrating Lymphocytes (LE-TIL)
| Characteristic | Visual sTIL | Visual LE-TIL | Average of both | ||||||
|---|---|---|---|---|---|---|---|---|---|
|
|
|
|
|||||||
| Mean (SD) | OR (95% CI)a | P valuea | Mean (SD) | OR (95% CI)a | P valuea | Mean (SD) | OR (95% CI)a | P valuea | |
| Age at diagnosisb (year) | |||||||||
| < 40 | 10.93 (13.78) | Reference | 24.17 (25.07) | Reference | 17.55 (18.16) | Reference | |||
| 40–50 | 12.21 (12.67) | 1.54 (0.78–3.05) | 0.2172 | 29.06 (25.31) | 1.41 (0.72–2.75) | 0.3205 | 20.56 (15.81) | 1.47 (0.75–2.88) | 0.2641 |
| ≥ 50 | 16.26 (19.16) | 1.09 (0.39–3.08) | 0.8684 | 29.23 (23.24) | 1.12 (0.40–3.13) | 0.8251 | 22.66 (20.18) | 1.13 (0.41–3.11) | 0.8178 |
| Body mass indexb (kg/m2) | |||||||||
| < 25 | 12.70 (15.30) | Reference | 26.58 (25.22) | Reference | 19.45 (18.56) | Reference | |||
| ≥ 25 | 15.11 (17.23) | 1.67 (0.92–3.03) | 0.0926 | 29.83 (24.87) | 1.31 (0.73–2.36) | 0.3703 | 22.46 (18.80) | 1.40 (0.78–2.52) | 0.2561 |
| Age at menarcheb(year) | |||||||||
| < 15 | 11.79 (13.71) | Reference | 27.03 (23.90) | Reference | 19.43 (17.22) | Reference | |||
| ≥ 15 | 14.42 (16.91) | 1.29 (0.77–2.16) | 0.3345 | 28.81 (24.38) | 1.14 (0.69–1.89) | 0.6129 | 21.49 (18.85) | 1.34 (0.81–2.23) | 0.2529 |
| Number of childrenb | |||||||||
| < 3 | 9.69 (9.65) | Reference | 25.74 (21.91) | Reference | 17.72 (14.01) | Reference | |||
| ≥ 3 | 15.81 (18.19) | 1.29 (0.73–2.28) | 0.3868 | 29.64 (25.90) | 1.10 (0.63–1.94) | 0.7332 | 22.62 (20.06) | 0.99 (0.56–1.73) | 0.9592 |
| Age at first pregnancyc (year) | |||||||||
| < 25 | 15.26 (18.15) | Reference | 28.71 (26.21) | Reference | 21.89 (20.21) | Reference | |||
| ≥ 25 | 10.63 (9.81) | 1.13 (0.64–2.01) | 0.6711 | 27.16 (21.12) | 1.22 (0.70–2.14) | 0.4901 | 18.90 (13.78) | 1.22 (0.69–2.14) | 0.4950 |
| Duration of breastfeeding per childd (month) | |||||||||
| < 24 | 15.58 (18.25) | Reference | 29.65 (25.70) | Reference | 22.50 (19.86) | Reference | |||
| ≥ 24 | 11.81 (12.59) | 0.87 (0.50–1.52) | 0.6270 | 26.94 (23.60) | 0.88 (0.51–1.52) | 0.6467 | 19.38 (16.55) | 0.73 (0.42–1.25) | 0.2490 |
| Cummulative duration of breastfeedingd (month) | |||||||||
| < 72 | 12.79 (15.87) | Reference | 26.69 (24.08) | Reference | 19.74 (17.60) | Reference | |||
| ≥ 72 | 16.20 (17.11) | 1.40 (0.78–2.49) | 0.2579 | 31.60 (25.99) | 1.58 (0.89–2.79) | 0.1181 | 23.69 (20.12) | 1.14 (0.65–2.02) | 0.6432 |
| Menopausal statusb | |||||||||
| Pre | 11.30 (12.27) | Reference | 26.65 (23.46) | Reference | 18.97 (16.14) | Reference | |||
| Post | 16.40 (19.13) | 1.25 (0.55–2.84) | 0.6013 | 30.18 (25.79) | 1.30 (0.58–2.93) | 0.5291 | 23.14 (20.34) | 1.34 (0.60–3.00) | 0.4747 |
| Estrogen receptor statuse | |||||||||
| Negative | 19.76 (19.19) | Reference | 31.58 (24.25) | Reference | 25.63 (20.48) | Reference | |||
| Positive | 11.08 (13.67) | 0.56 (0.22–1.44) | 0.2297 | 26.60 (24.49) | 0.60 (0.23–1.55) | 0.2925 | 18.77 (16.92) | 0.55 (0.21–1.41) | 0.2116 |
| Progesterone receptor statuse | |||||||||
| Negative | 17.86 (18.92) | Reference | 30.40 (24.65) | Reference | 24.11 (20.44) | Reference | |||
| Positive | 10.91 (13.11) | 1.05 (0.44–2.50) | 0.9111 | 26.53 (24.35) | 1.26 (0.52–3.04) | 0.6118 | 18.64 (16.47) | 1.31 (0.55–3.14) | 0.5474 |
| Human epidermal growth factor receptor 2 statuse | |||||||||
| Negative | 13.74 (16.20) | Reference | 26.09 (23.70) | Reference | 19.93 (18.07) | Reference | |||
| Positive | 12.67 (14.79) | 0.84 (0.45–1.56) | 0.5809 | 33.19 (26.04) | 1.71 (0.92–3.19) | 0.0892 | 22.67 (18.50) | 1.46 (0.79–2.70) | 0.2322 |
| KI67e,f (%) | |||||||||
| Low | 11.09 (13.43) | Reference | 24.95 (22.90) | Reference | 18.04 (16.05) | Reference | |||
| High | 19.02 (19.27) | 1.63 (0.90–2.96) | 0.1056 | 35.65 (26.79) | 2.24 (1.23–4.07) | 0.0085 | 27.08 (21.27) | 2.18 (1.20–3.96) | 0.0102 |
| Subtypesg | |||||||||
| Luminal A | 10.98 (14.19) | Reference | 24.50 (23.44) | Reference | 17.66 (16.47) | Reference | |||
| Luminal B | 11.78 (11.90) | 1.01 (0.49–2.09) | 0.9763 | 33.75 (26.56) | 1.91 (0.93–3.93) | 0.0802 | 22.76 (17.88) | 1.82 (0.89–3.74) | 0.1038 |
| HER2-enriched | 14.29 (19.19) | 1.13 (0.46–2.83) | 0.7869 | 32.13 (25.67) | 1.89 (0.75–4.80) | 0.1783 | 22.50 (20.02) | 1.52 (0.61–3.77) | 0.3713 |
| Triple negative | 22.50 (19.05) | 2.19 (1.03–4.65) | 0.0416 | 31.22 (24.15) | 1.88 (0.90–3.96) | 0.0955 | 27.16 (21.03) | 2.08 (1.00–4.34) | 0.0500 |
| Tumour sizeg (mm) | |||||||||
| < 5 | 13.14 (15.50) | Reference | 30.97 (23.42) | Reference | 22.03 (17.44) | Reference | |||
| ≥ 5 | 14.01 (16.70) | 0.94 (0.51–1.72) | 0.8270 | 25.29 (25.50) | 0.41 (0.22–0.76) | 0.0047 | 19.54 (19.18) | 0.56 (0.30–1.02) | 0.0589 |
| Tumour gradeg | |||||||||
| ½ | 9.74 (12.98) | Reference | 24.34 (23.75) | Reference | 17.08 (16.33) | Reference | |||
| 3 | 16.65 (17.38) | 2.64 (1.49–4.67) | 0.0009 | 31.10 (24.82) | 1.70 (0.96–3.01) | 0.0678 | 23.76 (19.23) | 1.97 (1.12–3.46) | 0.0185 |
| Lymph nodal involvementg | |||||||||
| No | 18.40 (19.63) | Reference | 34.69 (25.43) | Reference | 26.43 (19.45) | Reference | |||
| Yes | 11.64 (14.11) | 0.69 (0.32–1.46) | 0.3257 | 26.97 (24.43) | 0.71 (0.34–1.50) | 0.3730 | 19.22 (17.50) | 0.70 (0.33–1.48) | 0.3553 |
| TNM stageg | |||||||||
| I/II | 15.12 (17.45) | Reference | 30.15 (24.57) | Reference | 22.62 (18.44) | Reference | |||
| III/IV | 11.86 (14.10) | 0.70 (0.35–1.39) | 0.3010 | 26.15 (24.68) | 0.81 (0.41–1.60) | 0.5503 | 18.90 (17.97) | 0.75 (0.38–1.48) | 0.4042 |
Modelling total tumour infiltrating lymphocytes (TIL) percent of positive cells (PPC) as the outcome variable; associations were adjusted for age at diagnosis in addition to other covariates. TILs were categorized into tertiles and used as nominal variables using cut-off points as follows: TIL in intratumour stromal (sTIL), TIL in leading edge (LE-TIL), and the average of TIL read in the two compartments, respectively: [1 = < 5; 2 = 5–10; 3 = > 10%], [1 = < 10; 2 = 10–35; 3 = > 35%], [1 = < 8; 2 = 8–26; 3 = > 26%]
Models were mutually adjusted for age at diagnosis, body mass index, age at menarche, number of children, menopausal status, and ER status
Amongst parous women, only, and further adjusted for cumulative duration of breastfeeding
Amongst women who breastfed and further adjusted for age at first pregnancy
Models were mutually adjusted for age at diagnosis, ER, PR and HER2 status, KI67, tumour size and grade, lymph nodal involvement and TNM stage
Ki67 was dichotomized at 20%
Models were mutually adjusted for age at diagnosis, tumour subtypes as defined molecularly, tumour size and grade, lymph nodal involvement and TNM stage
Bold indicates p ≤ 0.05
TIL assessment through specific IHC markers
To better characterize the immune profile of these patients, we conducted IHC staining of six immune markers on TMAs constructed from the same set of patients. Figure 2 shows the distribution of each marker. We used different cut-off points for sTIL and LE-TIL based on their distributions (Supplementary Table 2, Figure 2). As expected, higher overall TIL densities were associated with increasing expression levels of CD3, CD4, CD8, and CD20, however, the associations were only seen for sTILs but not for LE-TILs. As illustrated by Figure 2, both sTILs and LE-TILs were predominantly composed of CD3, CD8 and CD68 with a much smaller contribution of CD4 and CD20. The percent positive cells for FOXP3 were markedly lower compared to other IHC markers for both sTILs and LE-TILs.
Fig. 2.
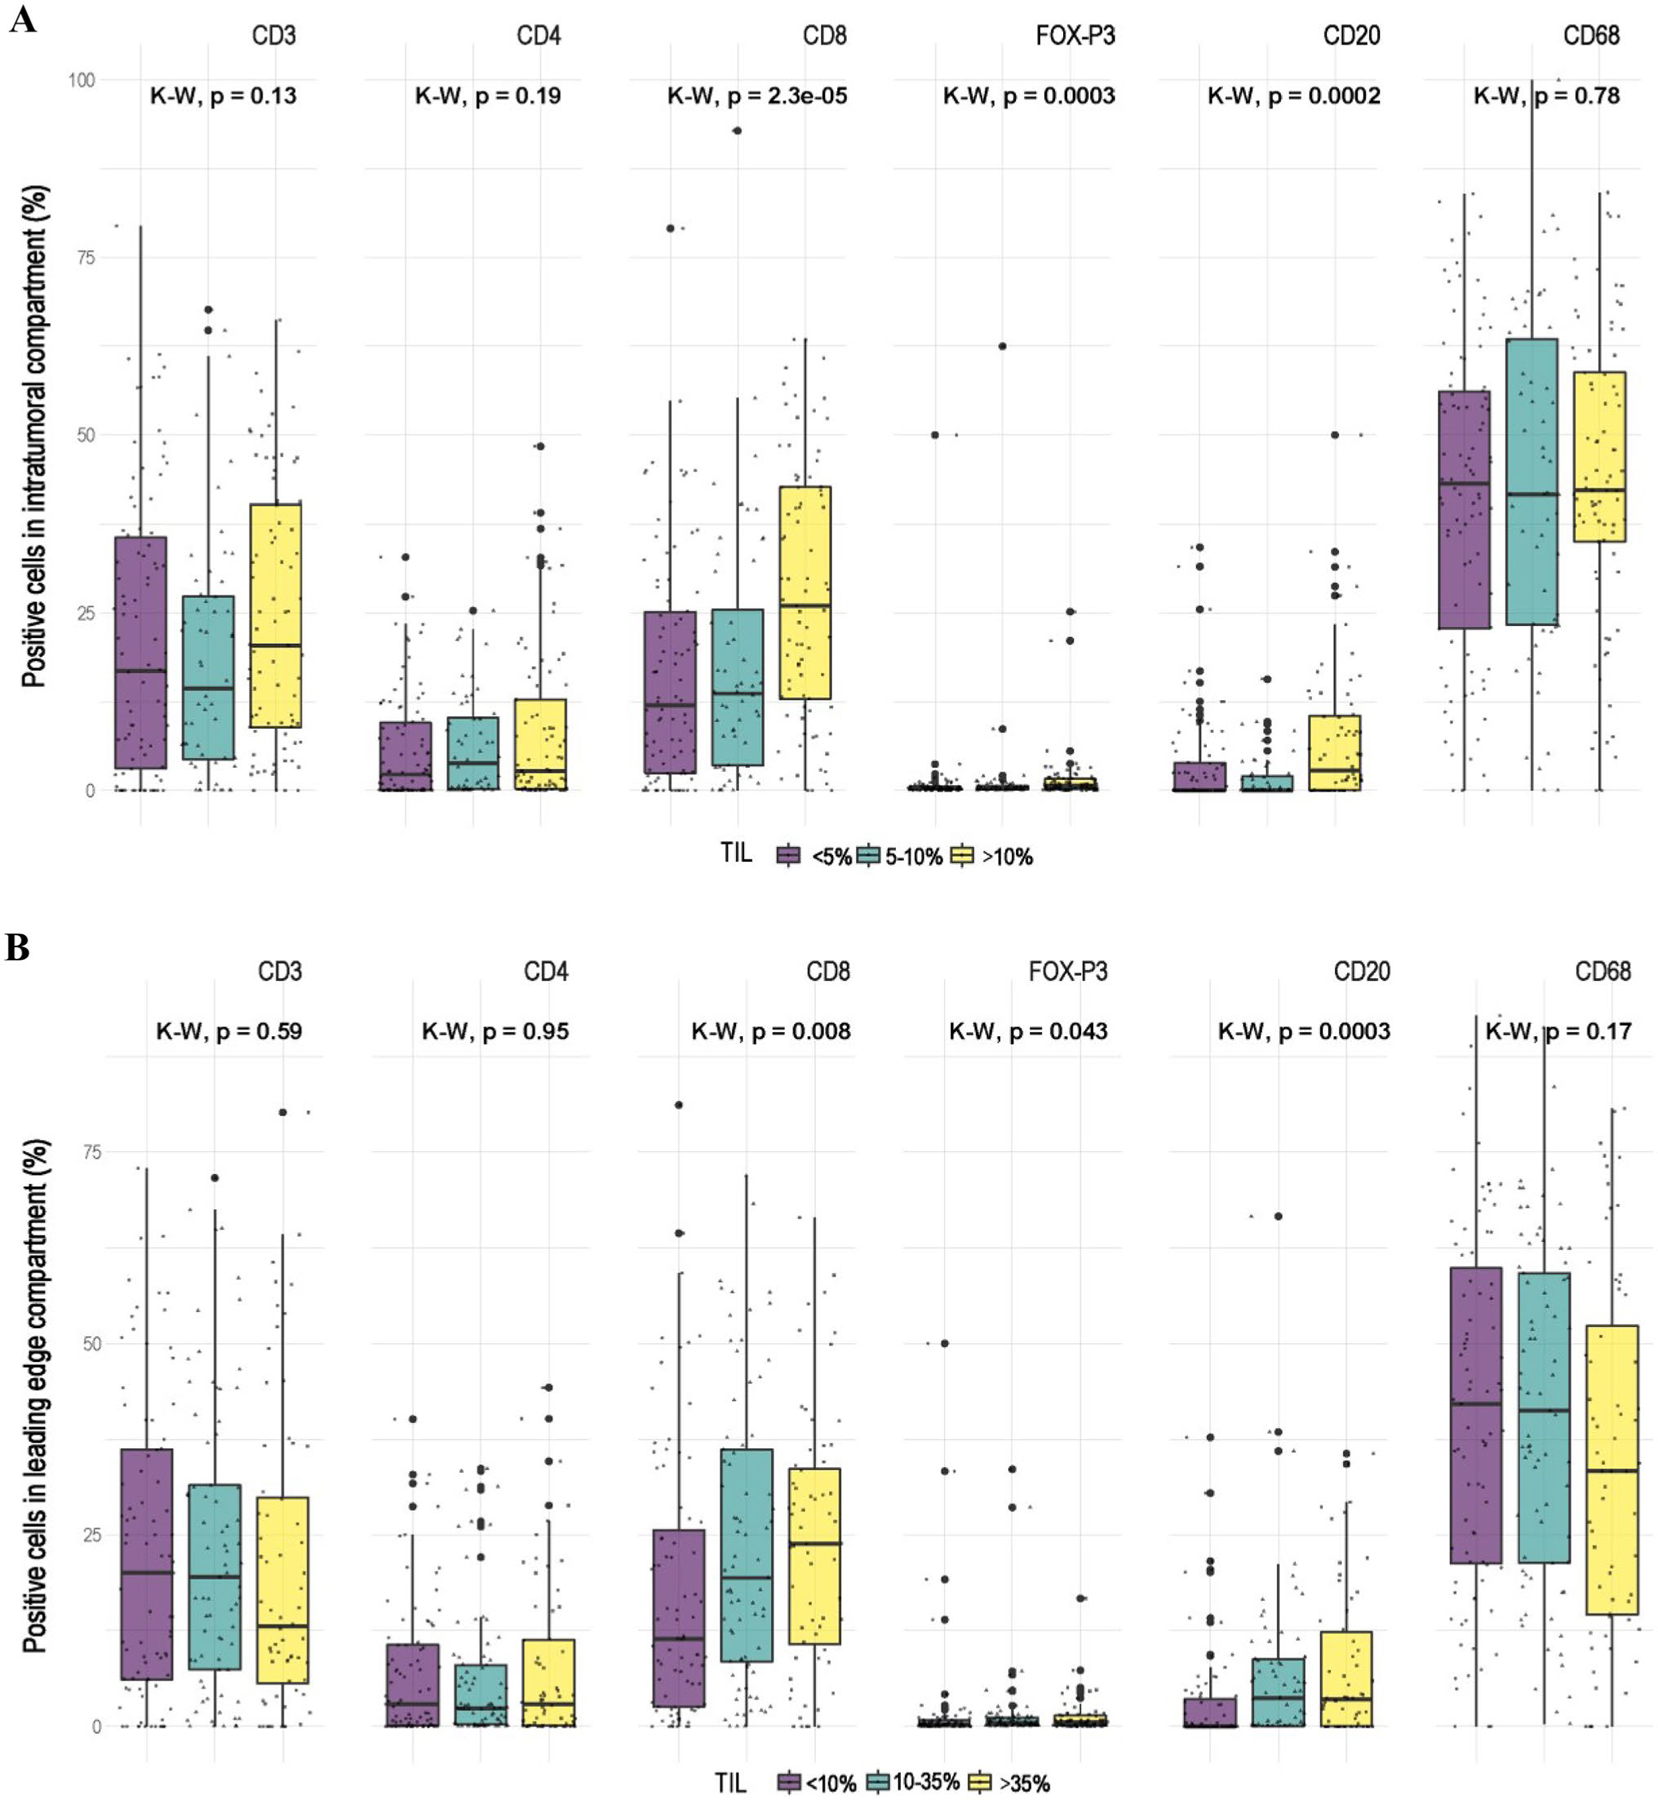
Distributions of immune markers with respect to the overall tumour infiltrating lymphocytes (TIL) subgroups, as defined by their respective tertiles amongst 226 Kenyan women, in A) the intra-tumoural stromal (sTIL) and B) leading edge (LE- TIL) compartments. The subgroups of overall TILs for each compartment were determined based on their respective distributions and to ensure three balanced subgroups. Purple represents the lowest tertile, green denotes the middle one, and yellow represent the highest subgroup. The Kruskal–Wallis test was used to compare mean differences in percent’s positive cells of immune markers across the different TIL subgroups
Figure 3 and Supplementary Tables 3–8 show the adjusted associations of expression of each IHC marker, intra-tumour and leading-edge separately, with BC risk factors (Figure 3 panel A) and tumour characteristics (Figure 3 panel B). As expected, we observed negative associations between CD3 and older age for both the intra-tumour and the leading-edge stroma. Interestingly, there was a positive age association for FOXP3, but only for the intra-tumour stroma. We also observed that higher CD3 (OR: 2.06, 95%CI:1.26–3.37) expression level was associated with older age at menarche (≥15 vs. <15 years), but only for the intra-tumour stroma. In addition, parity and long-term breastfeeding appeared to be associated with decreasing expression levels of most IHC markers, although these associations did not reach statistical significance probably due to small sample size. Breastfeeding per child and cumulative breastfeeding both were associated with lower expression of CD3 for both intra-tumour (OR: 0.68, 95%CI: 0.40–1.15; breastfeeding per child ≥24 vs. <24 months) and leading-edge (OR: 0.64, 95%CI:0.38–1.08) stroma (Figure 3 panel A, Supplementary Table 3).
Fig. 3.
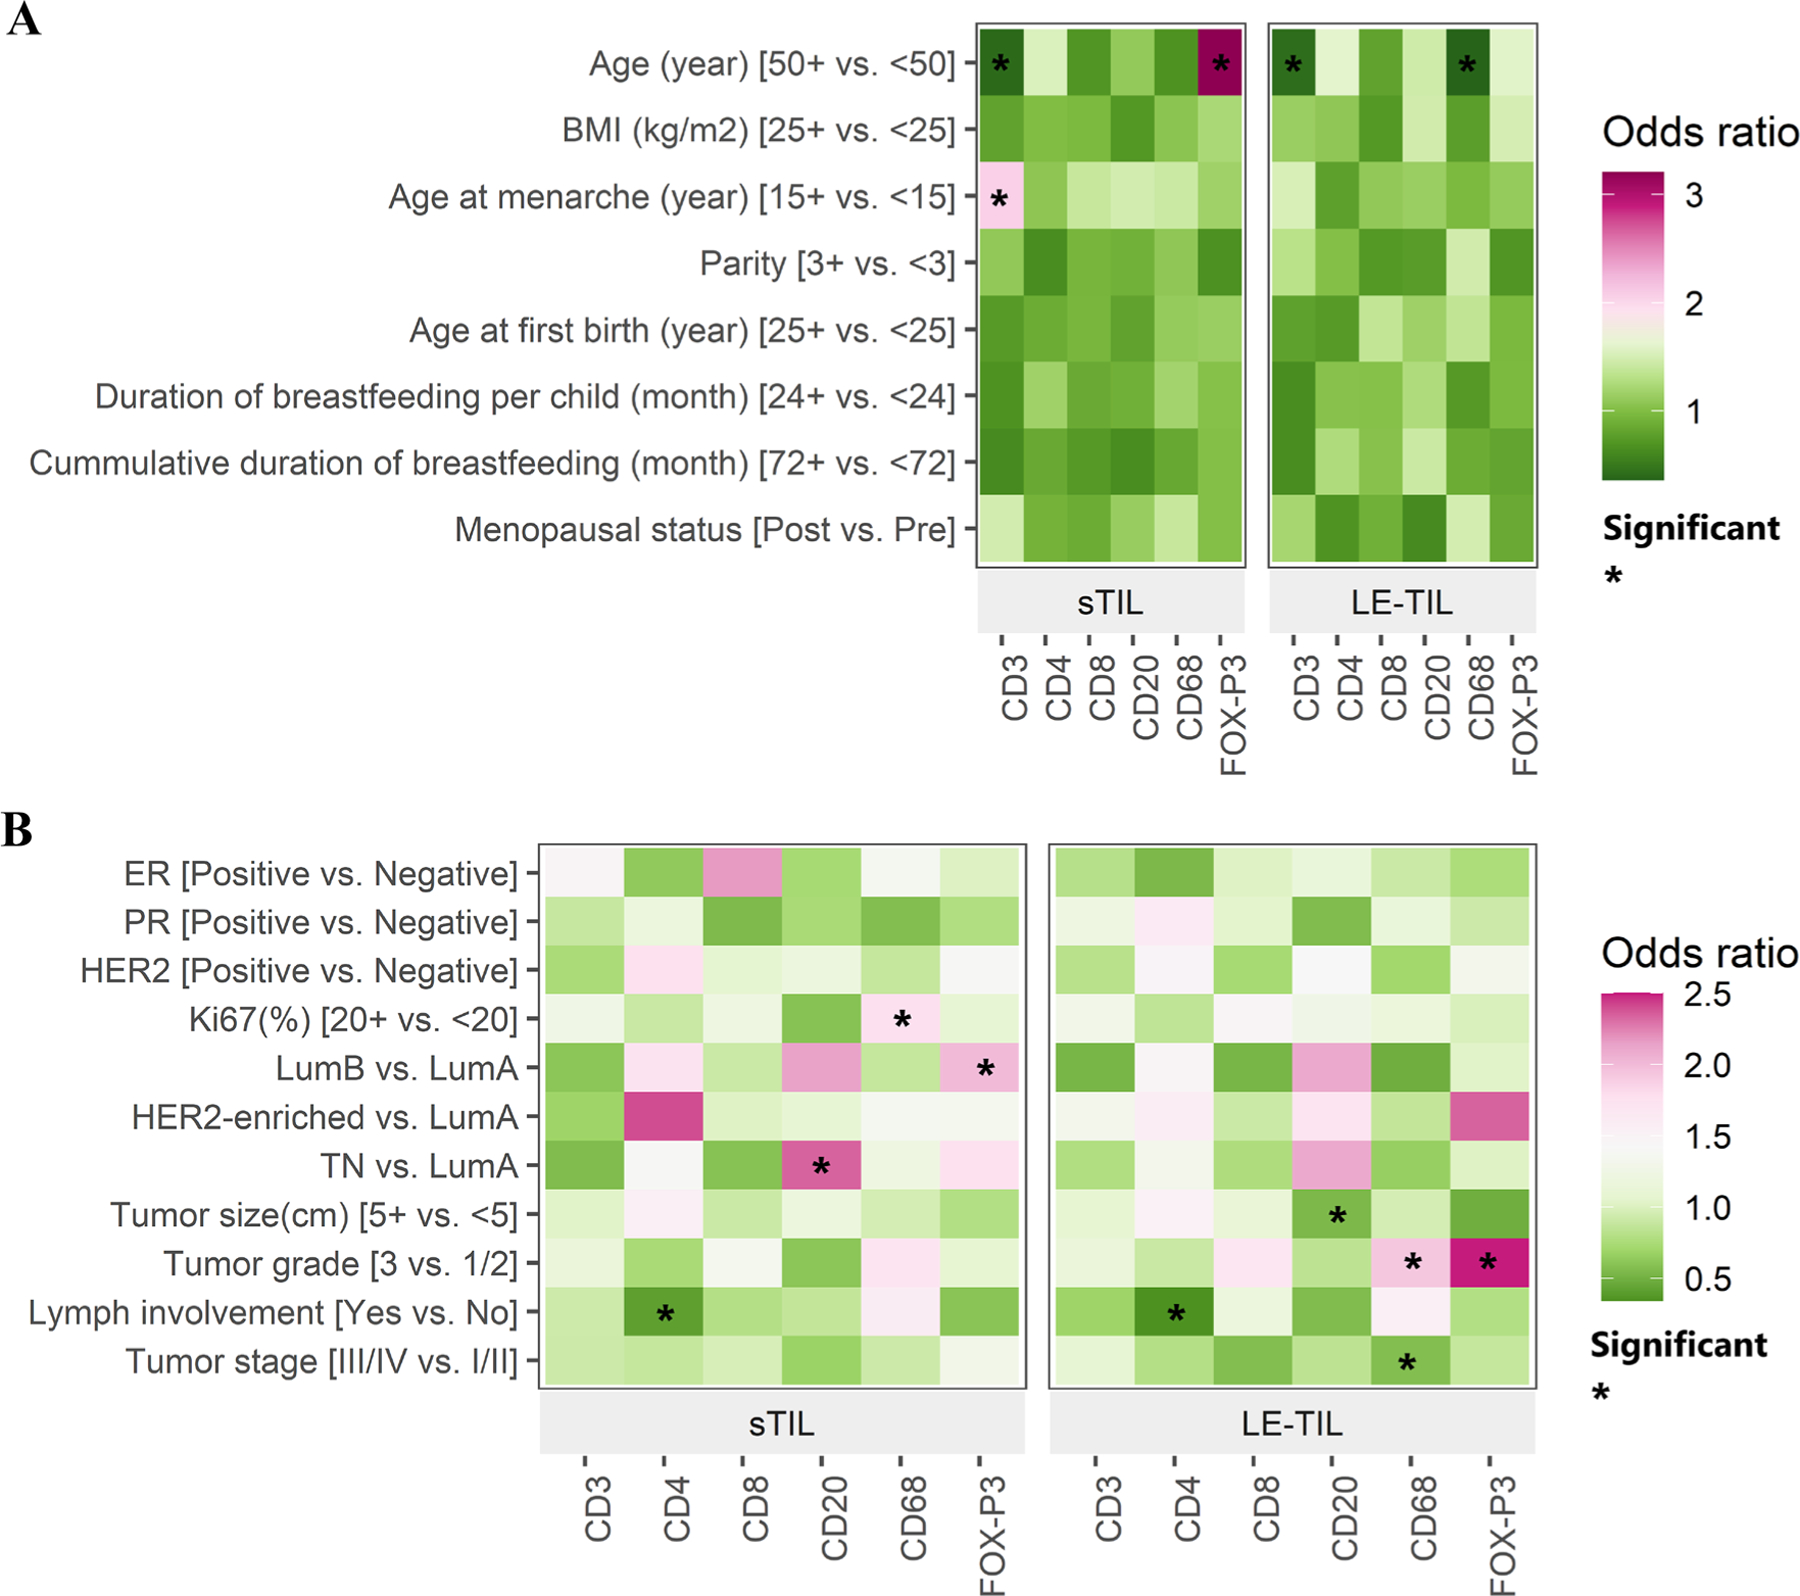
Associations between A) established breast cancer risk factors and B) tumour features with immune markers, in intratumour stromal (sTIL) and leading edge (le- TIL) compartments. We classified the immune markers using quartiles for all but CD20, for which we used tertiles (Supplementary Table 2). Each immune marker was treated as the outcome and each risk factor/tumour characteristic was the exposure in a logistic regression model, which included age, BMI, age at menarche, parity, menopausal status, and ER status. The heat maps show the directions of associations between immune markers and risk factors and tumour features by use of colour, where red depicts a positive association and green represents a negative association. The shade of each colour represents the magnitude of the association, and ‘*” denotes a statistically significant (p < 0.05) result
We observed similar patterns of associations of intra-tumour stromal and leading-edge measurements for some immune markers with clinical variables, such as negative associations between CD4 and Lymph node (LN) involvement, positive associations between CD20 and luminal B and TNBC although the associations were stronger for intra-tumour stroma, and negative association between FOXP3 and tumour size (stronger for leading edge stroma). On the other hand, the positive associations of CD68 with Ki67 and FOXP3 with luminal B subtype were only seen for intra-tumour stroma but not for leadingedge. In contrast, the positive associations of FOXP3 with HER2-enriched subtype and CD8, CD68, and FOXP3 with tumour grade were only seen for leading-edge but not for intra-tumour stroma (Figure 3 panel B, Supplementary Tables 5–8).
Discussion
In this case series of Kenyan BC patients, we performed detailed characterization of TILs in H&E and subsequent IHC staining of immune population subsets. The novelty of our study lies in the fact that we have described the spatial distribution of TILs and immune cell subtypes on both whole tissue sections and TMAs, respectively. We have also analysed the association of the spatial distribution of TILs and immune cells with breast cancer risk factor data specifically patient characteristics such as sociodemographic and reproductive factors.
We observed higher TIL values for LE-TILs compared to sTILs. We did not notice any pattern with regards to location of TILs between sTIL and LE-TIL or combined average TIL in association with risk factors and tumour features, however, most associations of TILs with BC risk factors and clinical features we observed in this study varied by TIL location. For both sTILs and LE-TILs, CD3 and CD8 constituted the most predominant immune populations whilst FOXP3 was the lowest proportion. We observed that breastfeeding per child and cumulative breastfeeding were associated with lower expression of CD3 in both TIL compartments but only higher sTILs were associated with older age at menarche. We noted that TIL location varied by breast cancer subtype with higher sTILs associated with TNBC whilst higher LE-TILs were more likely observed in HER2 and luminal B subtypes. Overall, we did not observe any distinct patterns of TIL profiles in relation to clinical characteristics that are specific to this African population. Further studies with larger sample sizes are warranted to follow up on our findings and to assess the clinical utility of spatially assessing the TILs.
Using TILs through overall assessment of H&E-stained whole sections, we found that higher TIL levels were associated with higher tumour grade, higher Ki67 levels, and non-luminal A tumour subtypes. These associations are similar to what were previously reported in other populations [17]. For example, a recent study of TILs using both pathologic and molecular methods in breast tumours from the Women’s Circle of Health Study (920 Black and 395 White patients in the United States) showed that TIL scores differed by race, but on the whole were higher in hormone receptor-negative tumours compared to hormone receptor-positive and HER2-negative tumours [18]. Interestingly, they found that tumours from Black patients had higher TILs than their White counterparts, especially T cell exhaustion markers, which might underpin the aggressive nature and poor outcomes of breast cancers in women of African descent [18]. Our study findings are also similar to those of Mremi et al. [19], which examined specific prognostic and predictive features of BC that included TILs in a population of 90 Tanzanian, 120 African American and 120 White American women. The authors observed higher TILs in Tanzanian women with TNBC, which appeared to confer in these women a better prognosis.
However, a recent study of 49 breast cancer tissues from Kenya [20] showed a correlation of TIL with Ki67 but not with tumour grade or subtype. This study examined the correlations between TIL density and tumour-related factors, namely, grade, molecular subtypes, and proliferation index. The authors used TMA sections from 49 breast tissue samples and reported that there was a significant correlation with CD68, CD163, and CD25 with Ki67 but not with tumour grade nor BC subtype. On the other hand, we found that higher TIL levels were associated with higher tumour grade, higher Ki67 levels, and non-luminal A tumour subtypes, which is consistent with the literature. This observed difference is likely due to the study’s small sample size.
In addition to the overall TIL density, we also used immunohistochemistry and digital pathology analysis to quantitatively measure specific immune markers in the breast cancer microenvironment of this well characterized cohort. As expected, older age was associated with decreased expression of most immune markers especially CD3, CD8, and CD68. Interestingly, older ages at diagnosis were associated with increased intratumoural expression of FOXP3, a marker of T- regulatory cells (Tregs) which is known to increase with age and cause T cell dysregulation leading to increased susceptibility to disease including cancer [24]. The relation between TILs and age is currently being studied and there is an increasing recognition that this relationship depends on the breast cancer subtype. For example, in the HER2+ subtype young patients have been observed to have higher TILs than older patients, and this is reflected in the pCR-rates, accordingly [25].
We also observed that older age at menarche, a protective factor for BC risk, was associated with increasing levels of intratumoural stromal CD3 and CD20, markers for T cells and B cells, respectively. Studies on TILs and specific immune cell markers in relation to BC risk factors are very scant even in European populations. Our previous study conducted in an East Asian population reported an association between high BMI and high-TIL amongst luminal BC patients [9]. In the current study, BMI was not significantly associated with either overall TIL density or any specific IHC markers we examined. The different results may be due to small sample sizes in both studies but may also reflect differences in populations with markedly different risk factor profiles.
We observed that increasing expression of CD68, a marker for tumour associated macrophages (TAMs), was associated with higher tumour grade and a high proliferation index. These results are in general consistent with those from a recent meta-analysis of TAMs and primary BC in Chinese BC patients over a six-year period including 1576 patients showing that CD68 was significantly associated with lymph node metastasis, high Ki67, high histological grade, and hormonal receptor negativity [26]. These findings suggest that CD68 is associated with tumour aggressiveness, but larger studies are needed to further confirm the role of TAMs in breast cancer subtypes and outcomes.
The strengths of our study include the well annotated study sample in a unique ethnic African population with availability of risk factor and clinical data, centralized high-quality biomarker assessment to define molecular subtypes, and a comprehensive and spatial evaluation of TILs using both overall assessment and quantification of multiple immune markers. We also used automated imaging analysis for marker scoring to reduce the chance of inter-observer variations.
The major limitation of our study is the small sample size, which limited the power to make statistical inferences on the TIL associations with risk factors and tumour characteristics. Although we collected outcome data, the survival analysis was not informative due to the few events reported (225 cases with 34 events- data not shown). Another limitation could be that we used TMAs instead of whole section slides for IHC thus precluding assessment of TIL subtype heterogeneity across the cores. However, the 1 mm size of each core for a total of 4 cores per case has been determined to be more than adequate for accurate assessment of TILs and TIL subtypes [27]. Furthermore, there have been several studies that have analysed the prognostic impact of immune-variables in large cohorts and on TMA’s [21]. It also needs to be noted that patients included in the current analysis were selected based on tissue availability and therefore our results may not be generalized to the breast cancer patient population in Kenya.
Conclusion
Our findings with regards to enrichment of TILs in more aggressive breast cancers are similar to what has been previously published. The distinct associations between intratumoural stroma and leading-edge TIL measures for some factors highlight the importance of spatial TIL evaluations in future studies. Our findings add to the body of knowledge regarding TILs and TIL subtypes in breast cancer, which underscore the need to conduct studies specific to African populations and to further evaluate TILs and TIL subsets in spatial context.
Characterizing the immune profile in relation to cancer risk and tumour progression in diverse populations is critical for reducing cancer disparities with regard to treatment responses and outcomes in breast cancer.
Supplementary Material
Acknowledgements
Tissue microarrays were constructed by the Human Tissue Acquisition & Pathology Core at Baylor College of Medicine. HTAP is funded by P30 Cancer Center Support Grant (NCI-CA125123). The authors would like to acknowledge Dr. Gretchen Gierach (Division of Cancer Epidemiology & Genetics, National Cancer Institute, USA) for her support. Angela Mutuku, Subash Govender, Johnstone Ngao, Raymond Kriel for providing logistical and technical support. JF/SS/FM acknowledge funding from UKRI grant reference MR/S015027/1. This research was supported by the Digital Computational Pathology Laboratory in the Department of Pathology and Cell Biology at Columbia University Irving Medical Center.
Funding
This research received no external funding. It was funded internally through the Deans Fund, Faculty of Health Sciences—East Africa Aga Khan University, Nairobi, Kenya. The research was partially supported by the intramural research program of the Division of Cancer Epidemiology & Genetics, National Cancer Institute, USA.
Abbreviations
- BC
Breast Cancer
- BMI
Body Mass Index
- CTLs
Cytotoxic T lymphocytes
- ER
Estrogen receptor
- FFPE
Formalin Fixed Paraffin Embedded
- H & E
Haematoxylin and Eosin
- HER2
Human Epidermal Growth Factor Receptor 2
- IHC
Immunohistochemistry
- LE
Leading edge stroma
- LPBC
Lymphocyte Predominant Breast Carcinoma
- MDSC
Myeloid-Derived Suppressor Cells
- NACOSTI
National Commission for Science Technology and Innovation
- PCR
Pathologic Complete Remission
- PR
Progesterone Receptor
- TAM
Tumour Associated Macrophages
- TCGA
The Cancer Genome Atlas
- TIL
Tumour Infiltrating Lymphocytes
- TMA
Tissue Microarrays
- TN
Triple Negative
- TNBC
Triple Negative Breast Cancer
Footnotes
Supplementary Information The online version contains supplementary material available at https://doi.org/10.1007/s10549-023-06921-3.
Conflict of interest The authors declare no conflict of interest. The funders had no role in the design of the study; in the collection, analyses, or interpretation of data; in the writing of the manuscript, or in the decision to publish the results.
Declarations
Ethical approval The study was conducted in accordance with the Declaration of Helsinki and approved by the Research Ethics Committees of the Aga Khan University Hospital Nairobi (2016/REC-32 (v3) and the Faculty of Health Sciences Research Ethics Committee of the University of Cape Town (HREC 427/2016). The study was also permitted by the National Commission for Science Technology and Innovation, Kenya (Ref No: NACOSTI/P/19/72237/28785), License number: NACOSTI/P/19/993). The Reporting Recommendations for Tumour Marker Prognostic Studies (REMARK) criteria were observed. (McShane LM, Altman DG, Sauerbrei W, Taube SE, Gion M, Clark GM (2005) Reporting recommendations for tumour marker prognostic studies. J Clin Oncol 23(36):9067–9072).
Informed consent Patient consent was waived due to this being a retrospective study.
Data availability
The datasets used and/or analysed during the current study are available from the corresponding author upon request.
References
- 1.P.J. Coussens LM, Leukocytes in mammary development and cancer. Cold Spring Harbor perspectives in biology., (2011). [DOI] [PMC free article] [PubMed] [Google Scholar]
- 2.Z.L. Coussens LM, Palucka AK, Neutralizing Tumour-Promoting Chronic Inflammation: A Magic Bullet ?, (2013). [DOI] [PMC free article] [PubMed] [Google Scholar]
- 3.Badr NM, Berditchevski F, Shaaban AM (2020) The immune microenvironment in breast carcinoma: predictive and prognostic role in the neoadjuvant setting. Pathobiology 87:61–74. 10.1159/000504055 [DOI] [PubMed] [Google Scholar]
- 4.Salgado R, Denkert C, Demaria S, Sirtaine N, Klauschen F, Pruneri G, Wienert S, Van den Eynden G, Baehner FL, Penault-Llorca F, Perez EA, Thompson EA, Symmans WF, Richardson AL, Brock J, Criscitiello C, Bailey H, Ignatiadis M, Floris G, Sparano J, Kos Z, Nielsen T, Rimm DL, Allison KH, Reis-Filho JS, Loibl S, Sotiriou C, Viale G, Badve S, Adams S, Willard-Gallo K, Loi S (2015) The evaluation of tumor-infiltrating lymphocytes (TILs) in breast cancer: recommendations by an International TILs Working Group 2014. Ann Oncol 26:259–271. 10.1093/annonc/mdu450 [DOI] [PMC free article] [PubMed] [Google Scholar]
- 5.Tower H, Ruppert M, Britt K (2019) The immune microenvironment of cancer. Cancers 11:1–15 [DOI] [PMC free article] [PubMed] [Google Scholar]
- 6.Denkert C, Loibl S, Noske A, Roller M, Müller BM, Komor M, Budczies J, Darb-Esfahani S, Kronenwett R, Hanusch C, von Törne C, Weichert W, Engels K, Solbach C, Schrader I, Dietel M, von Minckwitz G (2010) Tumor-associated lymphocytes as an independent predictor of response to neoadjuvant chemotherapy in breast cancer, Journal of clinical oncology : official journal of the American Society of. Clin Oncol 28:105–113. 10.1200/jco.2009.23.7370 [DOI] [PubMed] [Google Scholar]
- 7.Dushyanthen S, Beavis PA, Savas P, Teo ZL, Zhou C, Mansour M, Darcy PK, Loi S (2015) Relevance of tumor-infiltrating lymphocytes in breast cancer. BMC Med 13:202–202. 10.1186/s12916-015-0431-3 [DOI] [PMC free article] [PubMed] [Google Scholar]
- 8.Loi S, Michiels S, Salgado R, Sirtaine N, Jose V, Fumagalli D, Kellokumpu-Lehtinen PL, Bono P, Kataja V, Desmedt C, Piccart MJ, Loibl S, Denkert C, Smyth MJ, Joensuu H, Sotiriou C (2014) Tumor infiltrating lymphocytes are prognostic in triple negative breast cancer and predictive for trastuzumab benefit in early breast cancer: Results from the FinHER trial. Ann Oncol 25:1544–1550. 10.1093/annonc/mdu112 [DOI] [PubMed] [Google Scholar]
- 9.Thorsson V, Gibbs DL, Brown SD, Wolf D, Bortone DS, Yang T-HO, Porta-Pardo E, Gao GF, Plaisier CL, Eddy JA (2019) The immune landscape of cancer. Immunity 51:411–412 [DOI] [PubMed] [Google Scholar]
- 10.Zhu B, Tse LA, Wang D, Koka H, Zhang T, Abubakar M, Lee P, Wang F, Wu C, Tsang KH (2019) Immune gene expression profiling reveals heterogeneity in luminal breast tumors. Breast Cancer Res 21:1–11 [DOI] [PMC free article] [PubMed] [Google Scholar]
- 11.Yu X, Zhang Z, Wang Z, Wu P, Qiu F, Huang J (2016) Prognostic and predictive value of tumor-infiltrating lymphocytes in breast cancer: a systematic review and meta-analysis. Clin Transl Oncol 18:497–506. 10.1007/s12094-015-1391-y [DOI] [PMC free article] [PubMed] [Google Scholar]
- 12.Sayed S, Fan S, Moloo Z, Wasike R, Bird P, Saleh M, Shaikh AJ, Figueroa JD, Naidoo R, Makokha FW, Gardner K, Oigara R, Njoroge FW, Magangane P, Mutebi M, Chauhan R, Mwanzi S, Govender D, Yang XR (2021) Breast cancer risk factors in relation to molecular subtypes in breast cancer patients from Kenya. Breast Cancer Res 23:68. 10.1186/s13058-021-01446-3 [DOI] [PMC free article] [PubMed] [Google Scholar]
- 13.König L, Mairinger FD, Hoffmann O et al. (2019) Dissimilar patterns of tumor-infiltrating immune cells at the invasive tumor front and tumor center are associated with response to neoadjuvant chemotherapy in primary breast cancer. BMC Cancer 19:120. 10.1186/s12885-019-5320-2 [DOI] [PMC free article] [PubMed] [Google Scholar]
- 14.Romagnoli G, Wiedermann M, Hübner F, Wenners A, Mathiak M, Röcken C, Maass N, Klapper W, Alkatout I (1936) Morphological evaluation of Tumor-Infiltrating Lymphocytes (TILs) to investigate invasive breast cancer immunogenicity, reveal lymphocytic networks and help relapse prediction: a retrospective study. Int J Mol Sci 2017:18. 10.3390/ijms18091936 [DOI] [PMC free article] [PubMed] [Google Scholar]
- 15.Daub JT, Hofer T, Cutivet E, Dupanloup I, Quintana-Murci L, Robinson-Rechavi M et al. (2013) Evidence for polygenic adaptation to pathogens in the human genome. Mol Biol Evol 30(7):1544–1558 [DOI] [PubMed] [Google Scholar]
- 16.Sayed S, Moloo Z, Wasike R, Bird P, Oigara R, Njoroge FW, Shaikh AJ, Prasad SV, Vinayak S, Gierach GL, Dawsey SM, Palakal M, Fan S, Mullooly M, Chauhan R, Okiro P, Gakinya S, Nzioka A, Kyobutungi C, Mohamed S, Haregu T, Mussajee M, Bonass B, Mariwa C, Sherman OA, Mohammed A, Gachii A, Githaiga J, Karanu J, Nyagah R, Njoroge R, Muramba I, Otieno JO, Raburu DO, Mwachiro EB, Abayo I, Saleh M (2018) Ethnicity and breast cancer characteristics in Kenya. Breast Cancer Res Treat 167:425–437. 10.1007/s10549-017-4511-2 [DOI] [PMC free article] [PubMed] [Google Scholar]
- 17.Maisonneuve P, Disalvatore D, Rotmensz N, Curigliano G, Colleoni M, Dellapasqua S, Pruneri G, Mastropasqua MG, Luini A, Bassi F, Pagani G, Viale G, Goldhirsch A (2014) Proposed new clinicopathological surrogate definitions of luminal A and luminal B (HER2-negative) intrinsic breast cancer subtypes. Breast Cancer Res 16:R65–R65. 10.1186/bcr3679 [DOI] [PMC free article] [PubMed] [Google Scholar]
- 18.Mastropasqua MG, Luini A, Bassi F, Pagani G, Viale G, Goldhirsch A (2014) Proposed new clinicopathological surrogate definitions of luminal A and luminal B (HER2-negative) intrinsic breast cancer subtypes. Breast Cancer Res 16:R65–R65. 10.1186/bcr3679 [DOI] [PMC free article] [PubMed] [Google Scholar]
- 19.Luen SJ, Savas P, Fox SB, Salgado R, Loi S (2017) Tumour-infiltrating lymphocytes and the emerging role of immunotherapy in breast cancer. Pathology 49:141–155. 10.1016/j.pathol.2016.10.010 [DOI] [PubMed] [Google Scholar]
- 20.Hendry S, Salgado R, Gevaert T, Russell PA, John T, Thapa B, Christie M, Van De Vijver K, Estrada MV, Gonzalez-Ericsson PI, Sanders M, Solomon B, Solinas C, Van Den Eynden GGGM, Allory Y, Preusser M, Hainfellner J, Pruneri G, Vingiani A, Demaria S, Symmans F, Nuciforo P, Comerma L, Thompson EA, Lakhani S, Kim SR, Schnitt S, Colpaert C, Sotiriou C, Scherer SJ, Ignatiadis M, Badve S, Pierce RH, Viale G, Sirtaine N, Penault-Llorca F, Sugie T, Fineberg S, Paik S, Srinivasan A, Richardson A, Wang Y, Chmielik E, Brock J, Johnson DB, Balko J, Wienert S, Bossuyt V, Michiels S, Ternes N, Burchardi N, Luen SJ, Savas P, Klauschen F, Watson PH, Nelson BH, Criscitiello C, O’Toole S, Larsimont D, De Wind R, Curigliano G, André F, Lacroix-Triki M, Van De Vijver M, Rojo F, Floris G, Bedri S, Sparano J, Rimm D, Nielsen T, Kos Z, Hewitt S, Singh B, Farshid G, Loibl S, Allison KH, Tung N, Adams S, Willard-Gallo K, Horlings HM, Gandhi L, Moreira A, Hirsch F, Dieci MV, Urbanowicz M, Brcic I, Korski K, Gaire F, Koeppen H, Lo A, Giltnane J, Rebelatto MC, Steele KE, Zha J, Emancipator K, Juco JW, Denkert C, Reis-Filho J, Loi S, Fox SB, Assessing Tumor-infiltrating Lymphocytes in Solid Tumors: A Practical Review for Pathologists and Proposal for a Standardized Method from the International Immunooncology Biomarkers Working Group: Part 1: Assessing the Host Immune Response, TILs in Invasive Breast Carcinoma and Ductal Carcinoma in Situ, Metastatic Tumor Deposits and Areas for Further Research, Lippincott Williams and Wilkins, 2017, pp. 235–251. [DOI] [PMC free article] [PubMed] [Google Scholar]
- 21.Glajcar A, Szpor J, Hodorowicz-Zaniewska D, Tyrak KE, Okoń K (2019) The composition of T cell infiltrates varies in primary invasive breast cancer of different molecular subtypes as well as according to tumor size and nodal status. Virchows Arch 475:13–23 [DOI] [PMC free article] [PubMed] [Google Scholar]
- 22.Yao S, Cheng T-YD, Elkhanany A, Yan L, Omilian A, Abrams SI, Evans S, Hong C-C, Qi Q, Davis W, Breast Tumor Microenvironment in Black Women: A Distinct Signature of CD8+ T-Cell Exhaustion, JNCI: Journal of the National Cancer Institute (2021). [DOI] [PMC free article] [PubMed] [Google Scholar]
- 23.Mremi A, Broadwater G, Jackson K, Amsi P, Mbulwa C, Hyslop T, Ong C, Hall A (2019) Breast cancer in Tanzanian, black American, and white American women: An assessment of prognostic and predictive features, including tumor infiltrating lymphocytes. PLoS ONE 14:e0224760–e0224760. 10.1371/journal.pone.0224760 [DOI] [PMC free article] [PubMed] [Google Scholar]
- 24.Sawe RT, Mining SK, Ofulla AV, Patel K, Guyah B, Chumba D, Prosperi JR, Kerper M, Shi Z, Sandoval-Cooper M (2017) Tumor infiltrating leukocyte density is independent of tumor grade and molecular subtype in aggressive breast cancer of Western Kenya. Tropical medicine and health 45:1–11 [DOI] [PMC free article] [PubMed] [Google Scholar]
- 25.Gupta S, Joshi K, Wig J, Arora SK (2007) Intratumoral FOXP3 expression in infiltrating breast carcinoma: Its association with clinicopathologic parameters and angiogenesis. Acta Oncol 46:792–797 [DOI] [PubMed] [Google Scholar]
- 26.Takada K, Kashiwagi S, Asano Y, Goto W, Morisaki T, Shibutani M, Tanaka H, Hirakawa K, Ohira M (2022) Differences in tumor-infiltrating lymphocyte density and prognostic factors for breast cancer by patient age. World J Surg Oncol 20:38. 10.1186/s12957-022-02513-5 [DOI] [PMC free article] [PubMed] [Google Scholar]
- 27.Ni C, Yang L, Xu Q, Yuan H, Wang W, Xia W, Gong D, Zhang W, Yu K (2019) CD68-and CD163-positive tumor infiltrating macrophages in non-metastatic breast cancer: a retrospective study and meta-analysis. J Cancer 10:4463. [DOI] [PMC free article] [PubMed] [Google Scholar]
- 28.Althobiti M, Aleskandarany MA, Joseph C, Toss M, Mongan N, Diez- Rodriguez M, Nolan CC, Ashankyty I, Ellis IO, Green AR, Heterogeneity of tumour- infiltrating lymphocytes in breast cancer and its prognostic significance, Histopathology 73 (2018) 887–896. [DOI] [PubMed] [Google Scholar]
- 29.Burugu S, Gao D, Leung S, Chia SK, Nielsen TO (2017) LAG-3+ tumor infiltrating lymphocytes in breast cancer: clinical correlates and association with PD-1/PD-L1+ tumors. Ann Oncol 28:2977–2984. 10.1093/annonc/mdx557 [DOI] [PubMed] [Google Scholar]
Associated Data
This section collects any data citations, data availability statements, or supplementary materials included in this article.
Supplementary Materials
Data Availability Statement
The datasets used and/or analysed during the current study are available from the corresponding author upon request.