

Abstract
When measuring maximum strength, a high accuracy and precision is required to monitor the training adaptations. Based on available reliability parameters, the literature suggests the replacement of the one repetition maximum (1RM) by isometric testing to save testing time. However, from a statistical point of view, correlation coefficients do not provide the required information when aiming to replace one test by another. Therefore, the literature suggests the inclusion of the mean absolute error (MAE), the mean absolute percentage error (MAPE) for agreement analysis. Consequently, to check the replaceability of 1RM testing methods, the current study examined the agreement of isometric and dynamic testing methods in the squat and the isometric mid-thigh pull. While in accordance with the literature, correlations were classified high r = 0.638–0.828 and ICC = 0.630–0.828, the agreement analysis provided MAEs of 175.75–444.17 N and MAPEs of 16.16–57.71% indicating an intolerable high measurement error between isometric and dynamic testing conditions in the squat and isometric mid-thigh pull. In contrast to previous studies, using MAE, MAPE supplemented by CCC and BA analysis highlights the poor agreement between the included strength tests. The recommendation to replace 1RM testing with isometric testing routines in the squat does not provide suitable concordance and is not recommended.
Keywords: Maximal strength, Squat, Isometric mid-thigh pull, Agreement, Concordance, Testing specificity
Introduction
Maximum strength is considered a fundamental motor skill, influencing the specific performance in several sports. For example, in team sports such as soccer (Wisløff et al. 2004), handball (McGhie et al. 2020), and basketball (Warneke et al. 2022) high correlations between maximum strength and jumping or sprinting performance were reported. Furthermore, track and field (Loturco et al. 2018) and swimming (Wirth et al. 2022) athletes can improve their performance by exerting higher impulses against their respective resistance to optimize acceleration of their own body or an external resistance. Considering its crucial importance, many athletic training programs are designed to increase maximum strength, to augment sport-specific performance parameters, while diagnostics aim to screen the assumed success of the made effort (Chelly et al. 2009; Styles et al. 2016).
When aiming for maximize lower extremity speed strength, mostly to enhance jumping, sprinting or change of direction performance, the barbell squat is one of the most recommended exercises to implement in athletic training programs (Chelly et al. 2009; Lohmann et al. 2022; Styles et al. 2016). Indeed, available literature proofed strength increases between 10.0 and 32.3% dependent on used training periods, ranging between 6 and 12 weeks (Colquhoun et al. 2018; Green and Gabriel 2018; Lynch et al. 2020). However, especially in team sports, performance testing in a group setting is time consuming, and reaching maximal loads for 1RM testing is considered to induce fatigue. Therefore, the literature suggests to reduce the testing items to a very minimum and, based on correlation coefficients classified as high (> 0.7) between isometric and dynamic testing procedures, recommended the substitution of 1RM testing conditions by maximal isometric tests (McGuigan et al. 2006; McGuigan and Winchester 2008).
Indeed, the literature described isometric tests to be more time efficient and reliable while easy to standardize (McGuigan and Winchester 2008). Furthermore, due to less coordinative requirements compared to 1RM testing, they are considered safe and easy to conduct, thus, indicating substantial benefits in performance tests (Beckham et al. 2013; McGuigan et al. 2010). Consequently, McGuigan et al. (2010) proposed replacing dynamic testing of the squat and the bench press by using the isometric mid-thigh pull (IMTP), referring to high Pearson correlation coefficients of r = 0.69–0.97. However, when aiming to replace the dynamic testing by isometrics, two requirements need to be considered. First, a high agreement (low error) between testing procedures is necessary. Second, if there was a systematic error leading to limited agreement, it must be possible to calculate the maximal dynamic strength from the isometrics. To explore agreement, the magnitude of the unsystematic error can be performed by calculating the mean absolute error (MAE) (Willmott and Matsuura 2006) and the mean absolute percentage error (MAPE) (Hyndman and Koehler 2006), which can be supplemented by the concordance correlation coefficient (CCC) (Lin 1989) and graphically illustrated by a Bland–Altman (BA) analysis (Doğan 2018; Giavarina 2015). This procedure is also frequently recommended in methodological journals (Kim and Lee 2022; King and Chinchilli 2001) and already performed in different disciplines (Vetter and Schober 2018) to evaluate the agreement between different measurements (medical measurement devices) (Singh et al. 2020).
Due to high specificity in training-induced adaptations (Behm and Sale 1993) and an assumed disadvantageous transferability from isometric testing conditions to sports-specific performance parameters (Murphy and Wilson 1996), the usage of isometric tests could be questioned. Therefore, this study was conducted to first investigate the Pearson correlation coefficient and the ICC to ensure comparability to previous studies. Second, the corresponding MAE and MAPE were calculated and supplemented by the CCC and BA analysis to explore the replaceability of the 1RM testing by isometric condition, considering different knee joint angles in the squat (Hartmann et al. 2012) and the overall substitution of the 1RM squat testing by the IMTP.
Materials and methods
To answer the research question, 53 healthy participants were recruited for participation, while 7 were excluded based on exclusion criteria. The maximum strength in the squat (isometrically and dynamically) as well as the IMTP were tested using a Smith machine. Tests were performed on two separated, non-consecutive days to avoid fatigue from testing. Dynamic tests were performed on the first day, isometric tests on the second testing day.
Subjects
Considering a power of β − 1 error of 0.8, and an α error of 0.05, a priori G-Power sample size estimation suggested the inclusion of a minimum total sample size of n = 26 (Wagner et al. 2022). To enhance the statistical power, 46 healthy and recreationally trained participants (male: n = 33 age: 24.7 ± 3.6 years, height: 184.1 ± 6.2 cm, weight: 80.7 ± 7.7 kg, female: n = 13, age: 22.8 ± 2.2 years, height: 174.0 ± 6.2 cm, weight: 66.3 ± 9.5 kg) were recruited from the sport science program of the university campus. Participants were classified as recreationally trained if they performed at least three sessions of strength training per week or participated at least three times per week in the university sports program within the last year. All participants were considered experienced in resistance training by including squats in their regular training routine at least once per week within the last 6 months. Participants with a serious injury, leading to prolonged times of immobilization, within the last 6 months were excluded from the study. Seven participants were not able to perform a deep back squat or were not able to produce reliable isometric testing values and were, therefore, excluded from the data analysis.
Procedures
Maximum strength testing
Before testing, a standardized general warm-up program was conducted. The participants were instructed to perform a 5-min ergometer cycling with 60 rpm, and 2 × 10 bodyweight squats. Under dynamic testing conditions, the participants used their individualized warm-up routine to reach 1RM in the squat, progressively increasing the weight. To prepare for isometrics, participants were instructed to perform submaximal isometric contractions against the fixed bar.
Isometric mid-thigh pull (IMTP)
To investigate the maximum strength in the IMTP, the barbell was fixed at the height of the patella of the participants, who were instructed to place themselves on a force plate (Kistler, Sindelfingen, Germany) with a shoulder-width stance. The participants were allowed to use a cross grip as the aim was not to investigate the grip strength as a limiting factor in the exercise. The back was to be held in a straight position, while the knees had to stay in line with the hips and ankle joints. The barbell was fixed in the Smith machine. The participant was instructed to perform a maximal pulling movement on the bar, pushing the scapula together and fixating the lower back in a straight position. The bar was positioned at the mid of the thigh to use the starting position of the second pull of the clean and jerk. For each trial of the IMTP, contractions were performed for 3 s with a rest of 2 min between each trial. The participants performed both movements until no maximum strength increase could be observed, with a minimum of three trials (Beckham et al. 2018; Kawamori et al. 2006).
Squat testing
Maximum squat strength was tested using the back squat movement. Therefore, the bar was placed on the trapezius muscle. For the isometric testing, the bar was fixed using the Smith machine after the participant took the corresponding position to perform the testing at the required knee joint angle (90°, parallel squat, deep squat). The maximum isometric strength was determined using a Kistler force plate (Kistler, Sindelfingen, Germany) (Fig. 1a).
Fig. 1.
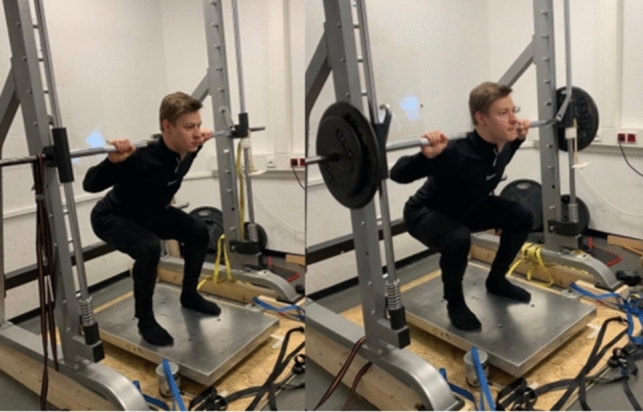
The 90° isometric squat test and the dynamic parallel 1RM squat test
For the 1RM testing, the participants started in an upright position, standing on the force plate. The testing was initiated by flexing the knees (Fig. 1b). Two experienced investigators rated the depth and movement execution independently and the trial was only considered appropriate if both investigators rated it positively. Between each trial, there was a rest of 2 min. The participants started with a weight equivalent to 70% of the isometric maximum strength value. Weight was added until no valid trial could be performed. The participant was allowed to try the maximum weight twice. A spotter ensured safety for the participants. For each trial of the squat contractions were performed for 3 s with a rest of 2 min between each trial. The participants performed both movements until no maximum strength increase could be observed, with a minimum of three trials.
Statistical analysis
The data were analyzed using SPSS 28.0 (IBM, Ehningen, DE, Germany). The significance level for all statistical tests was set at p < 0.05. The descriptive statistics are presented as the mean (M) ± standard deviation (SD). Normal distribution was ensured using the Kolmogorov–Smirnov test. Reliability values were calculated providing ICC (95% confidence intervals (CI)) and the coefficient of variability (CV). To determine significant differences in the correlation coefficients between subgroups (male and female) the data were z-transformed according to the Fisher method. The difference between the two transformed values after standardization was assessed for significance (Ferreira and Zwinderman 2006). Results are provided after calculating bivariate two-tailed Pearson correlation analysis as well as presenting ICCs with 95% CIs between all maximum strength testing conditions, to ensure a comparability to previous study results. Moreover, the CCC (ρc) (King and Chinchilli 2001; Singh et al. 2020) as well as BA analysis (Doğan 2018) are presented to adequately investigate the agreement between the different testing conditions. The MAE (Willmott and Matsuura 2006) is stated as a measuring of errors between paired observations evaluating the same parameter, while the MAPE (Hyndman and Koehler 2006) expresses accuracy, providing quantitative information about the deviation between two measuring procedures (Warneke et al. 2023). Therefore, both parameters can be stated to investigate the difference between a measured and predicted parameter and were commonly used to validate testing batteries (Gao et al. 2021). Since isometric measurement was performed on a force plate, while for 1RM calculation the added weight on the bar was used, the pure strength values (without inclusion of the bodyweight) were used for calculation.
The MAE and the MAPE were calculated using the following formula:
with xi being the values from the first testing, yi being values from the second testing and n being number of the testing.
Concordance analysis was performed with “R” (Version R 64 4.1.3, Lucent Technologies, Dormagen, Germany). Lastly, as the agreement of two testing procedures could not be seen as given if in the one test, one athlete is ranked best, while in another testing procedure measuring the same motor ability, the same athlete is ranked worse, the Spearman rank correlation coefficient was determined and illustrated graphically (see Fig. 2).
Fig. 2.
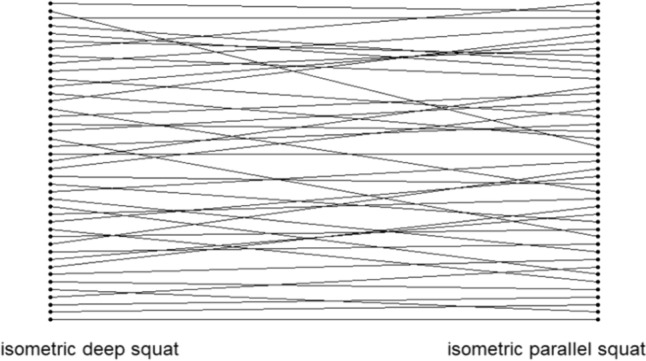
Exemplary illustrates Spearman’s ranking correlation coefficient, showing that the best participant in the one test is obviously not automatically the best participant in the other test
Results
Normal distribution of parameters was ensured using the Shapiro–Wilk test (p > 0.05). Since no significant difference between correlation coefficients between male and female participants was observed, the overall statistics including both sexes is provided in the following table. The descriptive statistics is provided in Table 1, and reliability is reported in Table 2.
Table 1.
Descriptive statistics for included parameters
| Parameter | Mean ± standard deviation (in N) |
|---|---|
| Isometric mid-thigh pull | 1303.3 ± 333.5 |
| Isometric deep squat | 841.8 ± 285.4 |
| Isometric parallel squat | 777.7 ± 258.2 |
| Isometric 90° squat | 1124.4 ± 374.2 |
| 1RM deep squat | 865.7 ± 244.7 |
| 1RM parallel squat | 956.9 ± 262.8 |
| 1RM 90° squat | 1212.9 ± 323.8 |
Isometric strength is provided without the body weight, 1RM maximal strength is provided as added weight to the bar * 9.81, to provide comparability in measurement units
1RM one repetition maximum
Table 2.
Reliability of included testing procedures
| Parameter | ICC [95% CI] | CV ± SD [95% CI] in % |
|---|---|---|
| Isometric mid-thigh pull | 0.998 [0.997, 0.999] | 1.29 ± 0.82 [1.05, 1.55] |
| Isometric deep squat | 0.996 [0.993, 0.998] | 1.90 ± 1.21 [1.54, 2.26] |
| Isometric parallel squat | 0.966 [0.992, 0.998] | 1.74 ± 1.07 [0.15, 0.21] |
| Isometric 90° squat | 0.984 [0.971, 0.991] | 2.02 ± 2.04 [1.52, 2.66] |
| 1RM deep squat | 0.996 [0.992 0.998] | 1.76 ± 2.05 [1.18, 2.41] |
| 1RM parallel squat | 0.997 [0.995, 0.998] | 0.97 ± 1.74 [0.49, 1.48] |
| 1RM 90° squat | 0.995 [0.991, 0.997] | 1.05 ± 2.01 [0.49, 1.70] |
1RM one repetition maximum, ICC intraclass correlation coefficient, CV coefficient of variability, SD standard deviation, 95% CI 95% confidence interval
Table 3 provides the statistics including Pearson correlation coefficients (r), ICCs, CCCs, MAPEs, MAEs, and the maximal percentage error (MPE) between the parameters, indicating moderate to high magnitude correlations with r = 0.645–0.961, ICC = 0.645–0.86. Correlation coefficients between IMTP and isometric squats range from 0.688 to 0.833 and between IMTP and 1RM squat testing from r = 0.701–0.743 showing a moderate to high relationship between these testing conditions. There were moderate to high correlation coefficients between isometric squat test and dynamic testing conditions ranging from r = 0.645–0.961. The highest correlation coefficient could be determined between 1RM testing in the deep squat and parallel squat with r = 0.961.
Table 3.
Measurements of agreement between isometric and dynamic testing conditions
| Parameters | rp | ICC (95% CI) | rs | CCC ρc (95% CI) | MAE (N) | MAPE (%) | MPE (%) |
|---|---|---|---|---|---|---|---|
| IMTP/1RM deep squat | 0.722* | 0.688 (0.492–0.818) | 0.736 (0.552–0.851) | 0.32 (0.19–0.44) | 444.17 | 57.71 | 74.47 |
| IMTP/1RM parallel squat | 0.715* | 0.695 (0.502–0.823) | 0.696 (0.493–0.827) | 0.41 (0.25–0.55) | 363.47 | 27.19 | 51.76 |
| IMTP/1 RM 90° squat | 0.691* | 0.691 (0.496–0.820) | 0.683 (0.475–0.819) | 0.67 (0.47–0.8) | 219–11 | 16.60 | 46.88 |
| Isometric deep squat/1RM deep squat | 0.638* | 0.630 (0.410 –0.781) | 0.664 (0.447–0.807) | 0.63 (0.41–0.78) | 175.75 | 23.77 | 125.90 |
| Isometric parallel squat/1RM parallel squat | 0.828* | 0.828 (0.704–0.903) | 0.793 (0.641–0.885) | 0.67 (0.51–0.78) | 189.27 | 29.86 | 125.90 |
| Isometric 90° squat/90° 1RM squat | 0.723* | 0.716 (0.532–0.835) | 0.687 (0.480–0.822) | 0.69 (0.51–0.82) | 218.63 | 22.44 | 74.25 |
1RM one repetition maximum, rp Person correlation coefficient, rs Spearman ranking correlation coefficient, ICC intraclass correlation coefficient, CCC ρc concordance correlation coefficient, MAE mean absolute error, MAPE mean absolute percentage error, MPE maximal percentage error, * = p < 0.001
The performed agreement analysis including the MAE and MAPE are provided in Table 3, while graphically illustrated in Fig. 3 showing the CCC as well as Fig. 4 the BA analysis. Furthermore, Fig. 4 exemplary provides a graphical presentation of the Spearman ranking correlation coefficient (rs).
Fig. 3.

Graphical illustration of the concordance correlation coefficient by Lin (1989) for the isometric and dynamic squat test and the IMTP and the 1RM deep squat
Fig. 4.

The agreement between measurements for a 1RM deep squat and isometric deep squat, b 1RM parallel squat and isometric parallel squat, c 1RM 90° squat and d isometric 90° squat and the IMTP and the 1RM deep squat
In the current study, the results showed correlation coefficients ranging from r = 0.638–0.828 with ICCs of 0.630–0.828 between isometric and dynamic maximum strength tests in the squats. The corresponding agreement analysis showed a MAE of 175.75–218.63 N with a MAPE of 22.44–29.86%. The correlation coefficients between the IMTP and the 1RM squat ranged from r = 691–0.722 with ICCs of 0.683–0.695, with MAE of 219.11–444.17 N and MAPE between 16.60 and 57.71%. The graphical illustration of the Spearman correlation coefficients is included to demonstrate the level of heterogeneity considering rs = 0.664–0.793.
Discussion
In the literature, the replacement of 1RM squat tests by isometric tests (such as the IMTP) was suggested based on correlation coefficients with r > 0.7. Regarding the replaceability of the 1RM squat test using the IMTP, McGuigan et al. (2010) stated “Strength and conditioning coaches and other practitioners with access to a force plate can consider using the isometric mid-thigh pull test as a potential alternative to traditional 1RM testing. In recreationally trained subjects, it appears to correlate extremely well with both the 1RM squat and bench press”.
In the current study, the results showed correlation coefficients ranging from r = 0.638–0.828 with ICCs = 0.630–0.828 between isometric and dynamic maximum strength tests in the squats, which is in accordance with previous literature (Bazyler et al. 2015). Considering ρc = 0.63–0.69 substituted by the graphical illustrations of the CCC and BA analyses (Figs. 2, 3, 4, 5) a high agreement between isometric and dynamic strength testing in the squat seems questionable, especially taking into account the MAEs ranging from 175.75 to 218.63 N with corresponding MAPEs between 22.44 and 29.86%. In accordance with previous research, correlation coefficients between the IMTP and the 1RM squat were classified moderate to high r = 0.691–0.722 with ICCs of 0.688–0.695 (Spiteri et al. 2014; Townsend et al. 2019), however, showing MAEs of 219.11–444.17 N and MAPEs of 16.60–57.71%. Claiming a substitution of the 1RM squat test by the IMTP (McGuigan et al. 2006, 2010; McGuigan and Winchester 2008), the reported measurement error arising from limited agreement must be considered and reviewed from a practitioner’s point of view.
When classifying correlation coefficients in sport and exercise science, authors commonly refer to Cohen (1988). Interestingly, it seems that authors neglect the recommendation to interpretate correlations in the respective topic. Examples provided by Cohen (1988), mostly refer to behavior sciences and psychology when describing a relationship between two measured values. When aiming to explore the replaceability of two measurements, we are not interested in the relationship, but the agreement of the measurements of interest, as correlations and agreement are two very different constructs (Liu et al. 2016). Accordingly, a recent review using simulated data provided measurement errors corresponding to different ICCs, applicable to strength testing conditions (Warneke et al. 2023), challenging the classification of correlation coefficients and ICCs > 0.7 as high. In accordance with the presented results, under scientific criteria, assuming an average maximal strength increase of up to 32.3% using common intervention periods of 6–12 weeks, a measurement error between dynamic and isometric conditions of 22.4–29.9% in the squatting test seems intolerably high.
Similar approaches are provided by Cataldi et al. (2022) who suggested to rate CCC values ρc < 0.9 as poor agreement in the field of body composition measurements, while a moderate agreement would be given with ρc = 0.90–0.95, a substantial agreement with ρc = 0.95–0.99, with an almost perfect agreement with ρc = 0.99. Accordingly, Dominguez Jimenéz (2016) described ρc = 0.68–0.77 as “no agreement”. With a ρc = 0.70, a MAPE of at least 17.36% and a MAE of 304 N can be assumed (Warneke et al. 2023), this claim can be supported also for strength testing. Based on listed classifications, the findings of the current concordance analyses could be classified as no—poor agreement between isometric and dynamic testing conditions. Accordingly, even with high correlation coefficients of > 0.7, considering the comparably high MAE and MAPE values of up to 57.71%, it seems questionable to classify Pearson correlation coefficients as high when aiming the replaceability of two measurements.
The practical relevance of the topic is underlined by a recent systematic review with meta-analysis performed by James et al. (2023) showing significant differences between isometric and dynamic strength increases in response to resistance training. Accordingly, the authors suggested both strength qualities to represent different strength constructs, consequently, in accordance with the presented results, separated testing protocols are required. Differences between isometric and dynamic testing conditions can possibly attributed to different factors. Assuming angle specificity as a moderating factor for isometric strength (Bazyler et al. 2015) would be an appropriate explanation of the comparatively low concordance between different angles in isometric testing and full ROM 1RM testing conditions (Wagner et al. 2022). Furthermore, angle specific training adaptations can be assumed, which must be considered in testing protocols. For example, Yahata et al. (2021) stretched the calf muscles exclusively reporting strength increases in the stretched ankle angle, while the neutral as well as the plantar flexed strength assessment did not show significant increases. Accordingly, the presented results show the highest agreement in similar knee angles (IMTP and 90° isometric squat with a MAE: 219.11 N, MAPE: 16.60%) and movement pattern (90° isometric squat and 90° 1RM squat MAE: 218.63 N, MAPE: 22.44%), while the worst agreement was found for the IMTP and the 1RM deep squat (MAE: 444.17 N, MAPE: 57.71%).
A further considerable aspect when performing diagnostics which could cause intolerable measurement errors is the contraction type. There seems to be a difference between isometric and dynamic testing conditions, possibly depending on familiarization with testing conditions (Drake et al. 2019). Noticeably, McGuigan et al. (2006) reported very high correlations between isometric testing and 1RM squat and bench press tests with elite wrestlers, who can be assumed to be familiar with isometric contractions while in a general population (not specialized on isometric muscle contractions) lower correlations were observed (Drake et al. 2019). A high specificity in testing conditions was earlier highlighted by Behm and Sale (1993) pointing out a high contraction velocity specificity. These studies suggested a high relevance of familiarization with testing conditions and support the demand for designing highly specific tests (Warneke et al. 2023). Although it seems that both contraction types require similar activational patterns, apart from the synchronically maximal fiber recruitment, maximal frequent (up to) tetanic activation depends on the optimum preset of the muscle spindle, which is influenced by the alpha-gamma-co-activation in regard of increased fusi-motor drive (Hagbarth et al. 1986; Holtermann et al. 2007). This preset of the central neural drive depends on the expected contraction form (Grabiner and Owings 2002) and the load-height that is meant to be accelerated (Hernández-Davó et al. 2015). Participants in studies Grabiner and Owings (2002) had to perform an isometric contraction in the isokinetic dynamometer, which was followed by a maximal eccentric OR maximal concentric contraction. The eccentric contraction led to significant lower initial EMG-amplitude (100 ms before execution, which means in the isometric condition) compared to the concentric one.
When the following contraction form was insufficiently announced, subjects showed the initial activation pattern in the isometric phase, which corresponded the one which was expected. Accordingly, the expectation of performing a following movement seems to determine central nervous activation patterns, making it complicated to sufficiently active the muscles if the following contraction form was unfamiliar. As a consequence, it could be hypothesized that subjects which are not familiarized with isometric contractions have difficulties in performing maximal effort against an immovable weight. Therefore, investigators and coaches should be aware that testing isometric maximum strength for reasons of time efficiency, does not allow a (precise) statement about dynamic force development in more sport-specific movements. Since in most sports (except for a low number of specific sports) athletes perform mostly dynamic movements and are not accustomed to isometric muscle contractions, dynamic testing conditions seem more appropriate, especially when aiming to screen the results of a dynamic squat training intervention.
The described statistics indicates that there is only poor agreement between IMTP and 1RM squatting conditions as well as between isometric and dynamic testing conditions in the squat. In addition, the Spearman ranking correlation coefficient was calculated and exemplary illustrated in Fig. 4. Reviewing the graphic underlines the limited possibility to predict the 1RM maximum strength from the isometric testing, since there is no consistency in the ranks (rank six in the isometric test is not necessarily the rank six in the dynamic testing). Therefore, there is no accurate and precise determination of the exact strength value from isometric to dynamic testing.
Limitations
Based on exclusion criteria, it was not possible to include a well-balanced distribution between males and females in the current study. However, since no significant difference in the correlations was observed, no sex specificity was initially assumed. Furthermore, the inclusion and exclusion criteria allowed the participation of subjects from different fields of sports with a potential influence on the correlations, especially since an influence of familiarization is hypothesized. Using more homogenous participants could lead to different results; however, it can be assumed that a more heterogenous field of testing subjects would even overestimate the correlation coefficients. Another limitation can be seen in the determination of the 1RM strength values, since those were calculated by using the kg value multiplicated with 9.81, to reach the same unit as used in the isometric testing. Otherwise, the calculation of the ICC, CCC and BA would obviously produce problems, just because of using different units. In the presented study, only the agreement between two different testing conditions was examined. However, no statement about the possibility to calculate, for example, the 1RM squat strength using the corresponding maximum isometric strength value. However, because of the comparative high variability, which can be reviewed in the Bland–Altman Plots, there are reasonable doubts about an accurate calculation of 1RM values based on isometric strength values in the squat.
Practical application
Considering the comparatively low expected increases in strength capacity in response to short intervention periods of a few weeks, an “almost perfect agreement” (Domínguez Jiménez and Fernández Suárez 2016) seems necessary between two measurement devices to replace one of those with the other. There are no general recommendations available about the tolerable measurement error, however, even with a CCC of ρc = 0.96, a MAPE of 11.11% with a MAE of 91.26 N was found in the current study. Under scientific criteria, assuming a strength increase of up to 32.3% (Green and Gabriel 2018; Lynch et al. 2020), a MAPE of approximately one-third seems intolerably high. Therefore, aiming to replace 1RM testing conditions, high magnitude agreement between measurement devices and higher expected strength increases are required. This can be reached, for example, with longer training interventions, since Sander et al. (2013) showed strength increases in 1RM back squat of about 101–291% (d = 5.5–5.6) with a 2-year strength training intervention, while Keiner et al. (2022) enhanced maximum strength with 12% (d = 1.0) by performing a 10 month strength training intervention in soccer players.
Conclusion
The demand to replace 1RM testing conditions with isometric tests in the squat or the replacement of the 1RM squat test by the IMTP seems without adequate evidence. Previous literature stating a high agreement between isometric and dynamic testing conditions using Pearson correlations or ICCs (> 0.70) should be questioned, since the classification of the correlation coefficients should be performed based on the agreement or measurement error between the testing conditions. The presented study, however, showed intolerable high MAE and MAPE values even with high correlation coefficients, supporting the initial demand for a content dependent classification of the correlation coefficient, if the aim is to investigate the agreement. Therefore, further agreement calculations should include a quantification of the error between the two testing conditions to improve the classification of the correlation analysis, targeting the agreement of two methods.
Acknowledgements
The authors acknowledge the financial support by the University of Graz.
Author contributions
KW developed the idea of the manuscript, took part in the research design, performed the statistical calculation and provided the first draft of the manuscript. MiK, DGB, KW and AK included their respective expertise in the field. Graphical illustration was performed by MS. Data were collected by MaK, while SW included his statistical expertise. MH supervised the project. All the authors contributed to the manuscript.
Funding
Open access funding provided by University of Graz. This research was supported by Austrian Science Fund (Grant P32078-B).
Data availability
Original data can be provided due to reasonable request.
Declarations
Conflict of interest
None of the included author declares a conflict of interest.
Footnotes
Publisher's Note
Springer Nature remains neutral with regard to jurisdictional claims in published maps and institutional affiliations.
References
- Bazyler CD, Beckham GK, Sato K (2015) The use of the isometric squat as a measure of strength and explosiveness. J Strength Cond Res 29(5):1386–1392. 10.1519/JSC.0000000000000751 [DOI] [PubMed] [Google Scholar]
- Beckham G, Mizuguchi S, Carter C, Sato K, Ramsex M, Lamont H, Hornsby G, Haff G, Stone M (2013) Relationships of isometric mid-thigh pull variables to weightlifting performance. J Sports Med Phys Fitness 53(5):573–581 [PubMed] [Google Scholar]
- Beckham GK, Sato K, Santana HA, Mizuguchim S, Haff GG, Stone MH (2018) Effect of body position on force production during the isometric midthigh pull. J Strength Cond Res 32(1):48–56 [DOI] [PubMed] [Google Scholar]
- Behm DG, Sale DG (1993) Velocity specificity of resistance training. Sports Med 15(6):374–388. 10.2165/00007256-199315060-00003 [DOI] [PubMed] [Google Scholar]
- Cataldi D, Bennett JP, Quon BK, Liu YE, Heymsfield SB, Kelly T, Shepherd JA (2022) Agreement and precision of deuterium dilution for total body water and multicompartment body composition assessment in collegiate athletes. J Nutr 152(9):2048–2059. 10.1093/jn/nxac116 [DOI] [PubMed] [Google Scholar]
- Chelly MS, Fathloun M, Cherif N, Amar MB, Tabka Z, Van Praagh E (2009) Effects of back squat training program on leg power, jump, and sprint performance in junior soccer player. J Strength Cond Res 23(8):2241–2249 [DOI] [PubMed] [Google Scholar]
- Cohen J (1988) Statistical power analysis for behavioral sciences (2nd ed.)
- Colquhoun RJ, Gai CM, Aguilar D, Bove D, Dolan J, Vargas A, Couvillion K, Jenkins NDM, Campbell BI (2018) Training volume, not frequency, indicative of maximal strength adaptations to resistance training. J Strength Cond Res 32(5):1207–1213. 10.1519/JSC.0000000000002414 [DOI] [PubMed] [Google Scholar]
- Doğan NÖ (2018) Bland-Altman analysis: a paradigm to understand correlation and agreement. Turkish J Emerg Med. 10.1016/j.tjem.2018.09.001 [DOI] [PMC free article] [PubMed] [Google Scholar]
- Domínguez Jiménez JL, Fernández Suárez A (2016) Correlation between capillary and venous blood glucose in the lactose tolerance test. Dig Dis Sci 61(1):208–214. 10.1007/s10620-015-3851-1 [DOI] [PubMed] [Google Scholar]
- Drake D, Kennedy RA, Wallace ES (2019) Multi-joint rate of force development testing protocol affects reliability and the smallest detectible difference. J Sports Sci 37(14):1570–1581. 10.1080/02640414.2019.1576258 [DOI] [PubMed] [Google Scholar]
- Ferreira JA, Zwinderman AH (2006) On the Benjamini-Hochberg method. Ann Stat 34(4):1827–1849. 10.1214/009053606000000425 [Google Scholar]
- Gao WD, Nuuttila O-P, Fang HB, Chen Q, Chen X (2021) A new fitness test of estimating VO2max in well-trained rowing athletes. Front Physiol. 10.3389/fphys.2021.701541 [DOI] [PMC free article] [PubMed] [Google Scholar]
- Giavarina D (2015) Understanding Bland Altman analysis Lessons in biostatistics. Biochemia Medica 25(2):141–151. 10.11613/BM.2015.015 [DOI] [PMC free article] [PubMed] [Google Scholar]
- Grabiner MD, Owings TM (2002) EMG differences between concentric and eccentric maximum voluntary contractions are evident prior to movement onset. Exp Brain Res 145(4):505–511. 10.1007/s00221-002-1129-2 [DOI] [PubMed] [Google Scholar]
- Green LA, Gabriel DA (2018) The cross education of strength and skill following unilateral strength training in the upper and lower limbs. J Neurophysiol 120:468–479. 10.1152/jn.00116.2018.-Cross [DOI] [PMC free article] [PubMed] [Google Scholar]
- Hagbarth KE, Kunesch EJ, Nordin M, Schmidt R, Wallin EU (1986) Gamma loop contributing to maximal voluntary contractions in man. J Physiol 380(1):575–591. 10.1113/jphysiol.1986.sp016303 [DOI] [PMC free article] [PubMed] [Google Scholar]
- Hartmann H, Wirth K, Klusemann M, Dalic J, Matuschek C, Schmidtbleicher D, Hartmann S (2012) Influence of squatting depth on jumping performance. J Strength Cond Res 26(12):3243–3261 [DOI] [PubMed] [Google Scholar]
- Hernández-Davó JL, Sabido R, Moya-Ramón M, Blazevich AJ (2015) Load knowledge reduces rapid force production and muscle activation during maximal-effort concentric lifts. Eur J Appl Physiol 115(12):2571–2581. 10.1007/s00421-015-3276-8 [DOI] [PubMed] [Google Scholar]
- Holtermann A, Roeleveld K, Engstrøm M, Sand T (2007) Enhanced H-reflex with resistance training is related to increased rate of force development. Eur J Appl Physiol 101(3):301–312. 10.1007/s00421-007-0503-y [DOI] [PubMed] [Google Scholar]
- Hyndman RJ, Koehler AB (2006) Another look at measures of forecast accuracy. Int J Forecast 22(4):679–688. 10.1016/j.ijforecast.2006.03.001 [Google Scholar]
- James LP, Weakley J, Comfort P, Huynh M (2023) The relationship between isometric and dynamic strength following resistance training: a systematic review, meta-analysis, and level of agreement. Int J Sports Physiol Perform. 10.1123/ijspp.2023-0066 [DOI] [PubMed] [Google Scholar]
- Kawamori N, Rossi SJ, Justice BD, Haff EE, Pistilli EE, O’Bryant HS, Stone MH, Haff GG (2006) Peak force and rate of force development during isometric and dynamic mid-thigh clean pulls performed at various intensities. J Strength Cond Res 20(3):483. 10.1519/18025.1 [DOI] [PubMed] [Google Scholar]
- Keiner M, Kadlubowski B, Sander A, Hartmann H, Wirth K (2022) Effects of 10 months of speed, functional, and traditional strength training on strength, linear sprint, change of direction and jump performance in trained adolescent soccer player. J Strength Cond Res 36(8):2236–2246 [DOI] [PubMed] [Google Scholar]
- Kim J, Lee J-H (2022) A novel graphical evaluation of agreement. BMC Med Res Methodol 22(1):51. 10.1186/s12874-022-01532-w [DOI] [PMC free article] [PubMed] [Google Scholar]
- King TS, Chinchilli VM (2001) A generalized concordance correlation coefficient for continuous and categorical data. Stat Med 20(14):2131–2147. 10.1002/sim.845 [DOI] [PubMed] [Google Scholar]
- Lin LI-K (1989) A concordance correlation coefficient to evaluate reproducibility (Vol. 45, Issue 1). https://www.jstor.org/stable/2532051 [PubMed]
- Liu J, Tang W, Chen G, Lu Y, Feng C, Tu XM (2016) Correlation and agreement: overview and clarification of competing concepts and measures. Shanghai Arch Psychiatry 28(2):115–120 [DOI] [PMC free article] [PubMed] [Google Scholar]
- Lohmann LH, Warneke K, Schiemann S, Faber IR (2022) High-load squat training improves sprinting performance in junior elite-level soccer players: a critically appraised topic. Int J Athl Ther Train. 10.1123/ijatt.2021-0066 [Google Scholar]
- Loturco I, Contreras B, Kobal R, Fernandes V, Moura N, Siqueira F, Winckler C, Suchomel T, Pereira LA (2018) Vertically and horizontally directed muscle power exercises: relationships with top-level sprint performance. PLoS One 13(7):e0201475. 10.1371/journal.pone.0201475 [DOI] [PMC free article] [PubMed] [Google Scholar]
- Lynch HM, Buman MP, Dickinson JM, Ransdell LB, Johnston CS, Wharton CM (2020) No significant differences in muscle growth and strength development when consuming soy and whey protein supplements matched for leucine following a 12 week resistance training program in men and women: a randomized trial. Int J Environ Res Public Health. 10.3390/ijerph17113871 [DOI] [PMC free article] [PubMed] [Google Scholar]
- McGhie D, Østerås S, Ettema G, Paulsen G, Sandbakk Ø (2020) Strength determinants of jump height in the jump throw movement in women handball players. J Strength Cond Res 34(10):2937–2946. 10.1519/JSC.0000000000002684 [DOI] [PubMed] [Google Scholar]
- McGuigan MR, Winchester JB (2008) The relationship between isometric and dynamic strength in college football players. J Sports Sci Med 7:101–105 [PMC free article] [PubMed] [Google Scholar]
- McGuigan MR, Newton MJ, Winchester JB, Nelson AG (2010) Relationship between isometric and dynamic strength in recreationally trained men. J Strength Cond Res 24(9):2570–2573 [DOI] [PubMed] [Google Scholar]
- McGuigan MR, Winchester JB and Erickson T (2006) The importance of isometric maximum strength in college wrestlers. J Sports Sci Med 108–113 [PMC free article] [PubMed]
- Murphy AJ and Wilson GJ (1996) Poor correlations between isometric tests and dynamic performance: relationship to muscle activation. In Eur J Appl Physiol (Vol. 73). Springer-Verlag [DOI] [PubMed]
- Sander A, Keiner M, Wirth K, Schmidtbleicher D (2013) Influence of a 2-year strength training programme on power performance in elite youth soccer players. Eur J Sport Sci 13(5):445–451. 10.1080/17461391.2012.742572 [DOI] [PubMed] [Google Scholar]
- Singh S, Kumar D, Kashyap V, Singh S (2020) A comparative study of automated blood pressure device and mercury-free LED blood pressure device using Lin’s concordance correlation coefficient and other validity measures in Indian population. J Family Med Primary Care 9(3):1464. 10.4103/jfmpc.jfmpc_796_19 [DOI] [PMC free article] [PubMed] [Google Scholar]
- Spiteri T, Nimphius S, Hart NH, Specos C, Sheppard JM, Newton RU (2014) Contribution of strength characteristics to change of direction and agility performance in female basketball athletes. J Strength Cond Res 28(9):2415–2423 [DOI] [PubMed] [Google Scholar]
- Styles WJ, Matthews MJ, Comfort P (2016) Effects of strength training on squat and sprint performance in soccer players. J Strength Cond Res 30(6):1534–1539 [DOI] [PubMed] [Google Scholar]
- Townsend JR, Bender D, Vantrease WC, Hudy J, Huet K, Williamson C, Bechke E, Serafini PR, Mangine GT (2019) Isometric Midthigh pull performance is associated with athletic performance and sprinting kinetics in division I men and women’s basketball players. J Strength Cond Res 33(10):2665–2673 [DOI] [PubMed] [Google Scholar]
- Vetter TR, Schober P (2018) Agreement analysis. Anesth Analg 126(6):2123–2128. 10.1213/ANE.0000000000002924 [DOI] [PubMed] [Google Scholar]
- Wagner C-M, Warneke K, Bächer C, Liefke C, Paitner P, Kuhn L, Brauner T, Wirth K, Keiner M (2022) Despite good correlations, there is no exact coincidence between isometric and dynamic strength measurements in elite youth soccer players. Sports. 10.3390/sports10110175 [DOI] [PMC free article] [PubMed] [Google Scholar]
- Warneke K, Keiner M, Schiemann S, Lohmann LH, Wirth K (2022) The influence of maximal strength performance in the front squat and deadlift on linear sprint and jump performance in male youth elite basketball players. Ger J Sport Res. 10.1007/s12662-022-00863-6 [Google Scholar]
- Warneke K, Wagner C-M, Keiner M, Hillebrecht M, Schiemann S, Behm DG, Wallot S, Wirth K (2023) Maximal strength measurement: a critical evaluation of common methods—a narrative review. Front Sports Active Living 5:1105201. 10.3389/fspor.2023.1105201 [DOI] [PMC free article] [PubMed] [Google Scholar]
- Willmott CJ, Matsuura K (2006) On the use of dimensioned measures of error to evaluate the performance of spatial interpolators. Int J Geogr Inf Sci 20(1):89–102. 10.1080/13658810500286976 [Google Scholar]
- Wirth K, Keiner M, Fuhrmann S, Nimmerichter A, Haff GG (2022) Strength training in swimming. Int J Environ Res Public Health 19(9):5369. 10.3390/ijerph19095369 [DOI] [PMC free article] [PubMed] [Google Scholar]
- Wisløff U, Castagna C, Helgerud J, Jones R, Hoff J (2004) Strong correlation of maximal squat strength with sprint performance and vertical jump height in elite soccer players. Br J Sports Med 38:285–288. 10.1136/bjsm.2002.002071 [DOI] [PMC free article] [PubMed] [Google Scholar]
- Yahata K, Konrad A, Sato S, Kiyono R, Yoshida R, Fukaya T, Nunes JP, Nakamura M (2021) Effects of a high-volume static stretching programme on plantar-flexor muscle strength and architecture. Eur J Appl Physiol 121(4):1159–1166 [DOI] [PubMed] [Google Scholar]
Associated Data
This section collects any data citations, data availability statements, or supplementary materials included in this article.
Data Availability Statement
Original data can be provided due to reasonable request.