Abstract
One of the key factors in manufacturing products by fused deposition molding (FDM) or layer-by-layer printing technology is the material intensity of the product. The task of reducing the amount of material required to manufacture a product without significant loss of mechanical properties is one of the most practically important technological tasks. Material saving in FDM printing of products allows to reduce financial costs and increase the speed of manufacturing of the final product without reducing (or not significantly reducing) the quality properties of the product. In our work it is demonstrated that using Combs filling type and materials of poly lactic acid (PLA) and polyethylene terephthalate glycol (PETG) it is possible to achieve material savings of up to 23% at 50% filling for PLA and 17% at 75% filling for PETG without significant reduction of product strength in comparison with other filling types. Exceptions are PLA samples with 100% fill and Lateral fill. Application of Kruskal-Wallis criterion and Dunn’s criterion with Bonferroni multiple comparison correction showed that there were no statistically significant differences within the strength limits of samples made by FDM printing technology from PLA and PETG plastics (p-value = 0.0514), as well as samples with Triangle and Grid filling type (p-value = 1). Based on this result, three groups of samples statistically significantly differing in ultimate strength were identified by methods of hierarchical cluster analysis; in each group (except for group 1, which included samples made of PLA plastic with Lateral filling type and 100% filling), correlation analysis was performed (Spearman correlation was used). The results of the correlation analysis showed a stable average correlation between the percentage of filling, modulus along the secant 0.05–0.2% strain, ultimate strength and strain corresponding to the yield stress. Analysis of the correlation graph showed that the main parameter correlating with all mechanical properties of the specimen is the 0.05–0.2% strain modulus. Based on this conclusion, robust regression equations predicting the 0.05–0.2% strain modulus as a function of the percentage of specimen filling were constructed for the two selected groups. Analysis of the equations showed that in the third group of specimens, the average modulus of 0.05–0.2% strain is more than twice the modulus of 0.05–0.2% strain in the second group. The detected statistical regularities can be explained by the mechanism of strain hardening, the actual value of which depends on the structure of the macrodefect (type of filling), properties and volume of the material (percentage of filling) used in the fabrication of samples using FDM printing technology.
Supplementary Information
The online version contains supplementary material available at 10.1038/s41598-024-79213-5.
Keywords: ABS, PLA, PETG, FDM, Mechanical properties, Filling type, Statistical analysis, Hierarchical classification
Subject terms: Materials science, Mathematics and computing, Physics
Introduction
The use of additive technologies in the production of products is finding increasing application in various industries. The oldest, and therefore the most mature, technologies are stereolithography (SLA, 1984), selective laser sintering (SLS, 1987) and fused deposition method (FDM, 1988), and the most widespread in the latter1–3. In the discussed work, FDM printing of model samples is considered as the main additive manufacturing technology.
For more than 30 years of FDM printing technology existence, many thermoplastics1–4 designed for layer-by-layer printing of various products (from children’s toys to functional elements of aircraft structures) have been developed and are being developed. In addition to the widespread use of 3D printing technologies in industrial production, three-dimensional printing has simplified and reduced the cost of many scientific and practical medical processes, as well as made previously impossible ideas possible. For medical purposes, the accuracy and efficiency of manufacturing various types of models is more important than anywhere else, and human life often directly depends on this5–8. 3D printing is successfully used in medicine for the manufacture of complex individual prostheses or surgical implants. Creating a prosthesis using traditional methods is an extremely long, complex, and often painful process for the patient. Thanks to the technology of three-dimensional printing, the creation of an individual, most complex prosthesis is simplified, and its cost is significantly reduced. These can be metal implants (for example, joints) printed on a three-dimensional printer, as well as complex electronic and mechanical bioprostheses of lost limbs. The use of 3D printing to make models of organs, bones, and joints to make a more accurate diagnosis, as well as in the preparation of complex operations, has become commonplace. Conventional 3D printers using cheap polymer materials for printing are quite suitable for these tasks. In addition, by printing an exact model of an organ (for example, a heart), doctors produce elastic sensors of exact shape and size, which are then transferred to a living organ and eventually installed with perfect accuracy. Among the whole list of materials, polyacrylonitrile butadiene styrene (ABS) and polylactide acid (PLA) are the most widespread.
The main distinguishing feature of ABS and PLA plastics is a relatively low melting point. In the case of PLA plastic 170–180 °C. ABS plastic does not have a pronounced melting point, but the extrusion start temperature is 180 °C. PLA plastic is an environmentally friendly material with low shrinkage upon solidification and relatively low cost. Whereas ABS plastic is resistant to most solvents (except acetone) and moisture, has a fairly high temperature resistance from 90 °С to 110 °С. The main technological difference between ABS and PLA is the large shrinkage (about 0.8% of the total volume) of ABS plastic when manufacturing products using FDM printing technology9. PETG plastic has a higher softening point than PLA plastic, higher density than ABS and PLA. The melting point of PETG is around 240 °C and the glass transition temperature is around 85 °C10,11.
The plastics under consideration are widely used in various industries and various medical applications. PLA and PETG plastics are widely used in dentistry. PLA plastic is widely used for prototyping of dental prostheses12,13, PETG plastic is also used14.
When considering ABS and PLA plastic, the main factor affecting the mechanical properties of filament and final products is the presence of moisture, air bubbles and anisotropy of plastic properties in the final product. Peculiarities of possible defects of filament structure and products manufactured by FDM printing technology from ABS and PLA plastic allow to apply deterministic methods of predicting mechanical characteristics of final products15.
Despite the relatively long history of FDM printing technology, the issues of optimizing the parameters of parts manufacturing by the criterion of achieving maximum mechanical properties remain open. In several works it was noted that the main parameters affecting the mechanical properties of samples are layer height, shell thickness, fill density, orientation angle, printing speed, nozzle diameter, fill percentage, fill cell geometry, printing temperature, and sample thickness5,6,16–40. John, Joel, et al.20 note that PLA plastic with diamond angle geometric pattern showed relatively low relative mechanical properties, while samples printed with a nozzle diameter of 0.8 mm showed optimum tensile properties compared to samples printed with nozzle diameters of 0.4 mm and 0.6 mm. In the analysis of the experiment conducted by the authors, the central part of the tested specimen is an open cellular structure, which on the one hand removes the influence of the filling surface, and on the other hand emits the failure of the cellular structure rather than the specimen with a certain type of filling, which corresponds to decorative products rather than products made for industry. The results of the analysis of nozzle diameter and filling pattern closer to industrial products made by FDM printing technology from PETG plastic were presented in31. Vosynek, Petr, et al. have shown that in tensile tests the shape of the filler has a significant effect, and the maximum strength is demonstrated by samples with a hexagonal filling structure. It is shown that samples with a hexagonal structure and a filling density of 50%, using 23% less material than samples with 100% filling density have the maximum strength.
When adjusting the other process parameters, the authors come to the same conclusions. Thus, one of the problems of optimization of technological parameters is the choice of filling type and filling percentage for different thermoplastics.
In the presented work based on the original method of statistical analysis of modeling is analyzed the dependence of mechanical properties of samples made by FDM printing technology from ABS, PLA and PETG plastic having four types of filling Comb, Triangle, Grid and Lateral and 4% of filling 25%, 50%, 75% and 100%. The aim of the work is to show the dependence of mechanical behavior depending on the type and percentage of filling.
Materials and methods
Material and manufacture
Samples for mechanical studies were printed on a Black Widow 3D printer (Tevo 3D, Guangdong, China) at the following printing modes: number of contours – 2; the number of solid top and bottom layers – 5 (Layer height was 0.2 mm; shell thickness was 1 mm); the value of the Extrusion multiplier – 1; adhesion layer – 2; nozzle diameter – 0.6 mm, layer height – 0.4 mm, printing speed – 50 mm/s. Samples were printed without the use of supports. Printing temperature conditions and fan speed are shown in Table 1.
Table 1.
Printing temperature modes and fan speed.
| Material | Printing temperature, °С | Desk temperature, °С | Percentage of maximum fan speed, % |
|---|---|---|---|
| ABS | 260 | 100 | 15 |
| PLA | 200 | 70 | 100 |
| PETG | 240 | 85 | 15 |
Tensile tests were carried out using universal electrodynamic testing machine Electropuls E10000 (Instron, Norwood, MA, USA) equipped with a 10 kN capacity load cell. Load weighing accuracy ± 0.5%. The movement speed of the machine grips was 2 mm/min. Prior to testing, specimens were conditioned in accordance with ISO 291:2008 Plastics - Standard atmospheres for conditioning and testing at a standard atmosphere of 23/50 for 88 h. Tensile tests were performed in accordance with the provisions of ASTM D4018 and ISO 10,618.
The commercial PLA, ABS and PETG filaments (Shenzhen Esun Industrial Co., Ltd, Xiaogang City, Hubei Province, China) was used to fabricate the samples.
Table 2 shows full names and abbreviations, test condition, and material of all studied specimens.
Table 2.
Sample list, specimens’ type, and conditions static tensile test.
| Materials | Infill patterns | Fill rate, % | Static load, kN | Test speed, mm/min |
|---|---|---|---|---|
| ABS | Combs | 25 | 7 | 2 |
| Grid | 50 | |||
| Triangle | 75 | |||
| Lateral | 100 | |||
| PLA | Combs | 25 | ||
| Grid | 50 | |||
| Triangle | 75 | |||
| Lateral | 100 | |||
| PETG | Combs | 25 | ||
| Grid | 50 | |||
| Triangle | 75 | |||
| Lateral | 100 |
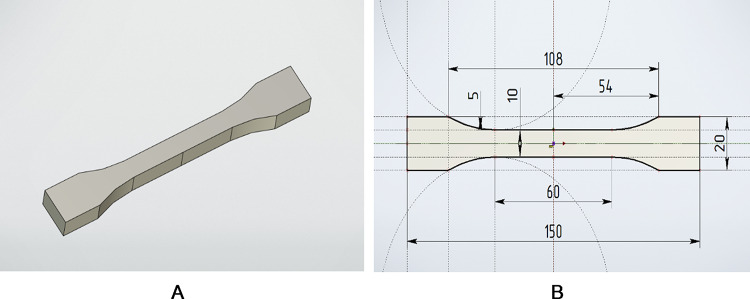
Figure 1 schematically shows the geometry of the specimen and its 3D model.
Fig. 1.
3D model (a) and external contour drawing (b) of tensile tested specimens.
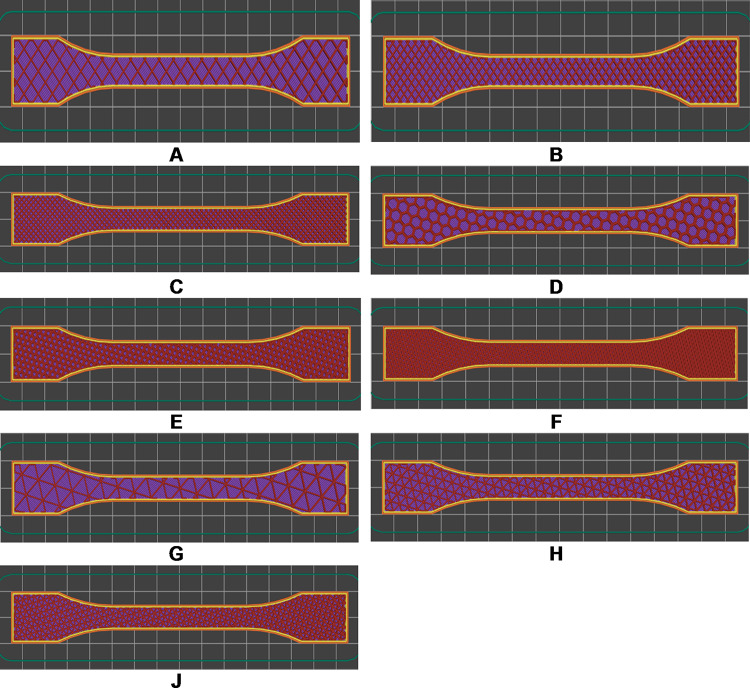
Figure 2 shows the model, and three filling structures of the samples fabricated by FDM printing technique from PLA, ABS and PETG plastics.
Fig. 2.
Internal filling structure of samples fabricated by FDM printing technique from ABS, PLA and PETG plastic. (a) Grid filling, 25% filling level; (b) Grid filling, 50% filling level; (c) Grid filling, 75% filling level; (d) Combs filling, 25% filling level; (e) Combs filling, 50% filling level; (f) Combs filling, 75% filling level; (g) Triangles filling, 25% filling level; (h) Triangles filling, 50% filling level; (j) Triangles filling, 75% filling level.
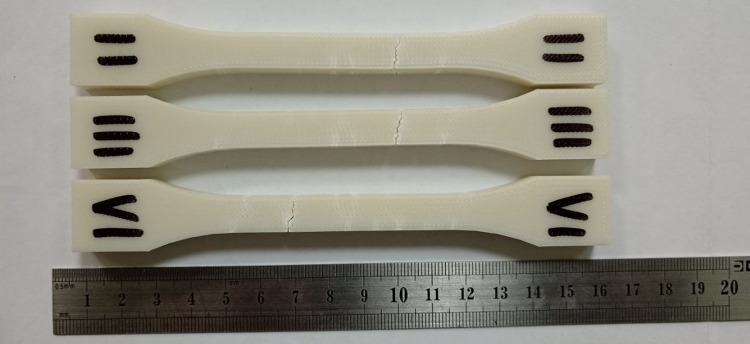
Figure 3 shows an example of specimens made of PLA plastic and tensile tested.
Fig. 3.
Samples made by FDM printing technology from PLA plastic and subjected to tensile tests.
A total of 180 specimens were made for tensile testing, 6 specimens with each fill type and from each type of plastic. In addition, 6 specimens each were made from ABS, PLA and PETG plastics with the Lateral fill type with 100% fill.
Statistical analysis and modeling
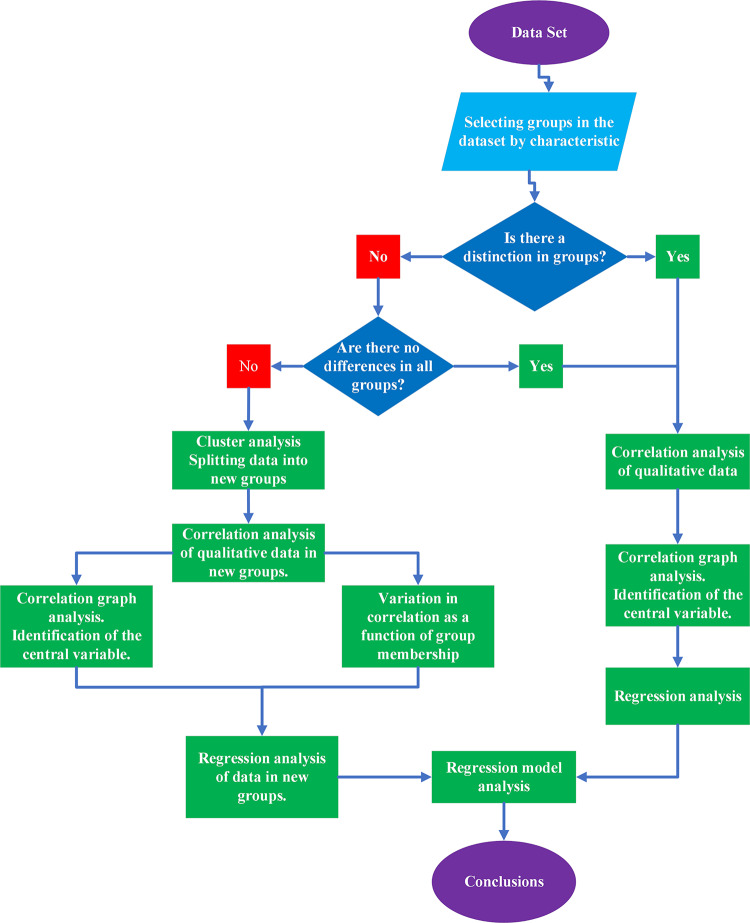
Statistical analysis of the data and construction of regression models for predicting tensile stress was carried out according to the algorithm shown in Fig. 4.
Fig. 4.
Algorithm for conducting statistical analysis and building regression models.
The structured data were analyzed using descriptive statistics methods in which sample mean, sample mean square deviation, maximum and minimum values, first and third quartiles and median value were estimated41.
Four statistical criteria (two parametric and two non-parametric) and two independent information criteria were used to analyze the distribution of the mechanical properties of the samples obtained by tensile tests of the FDM printing technology from ABS, PLA and PETG plastic for belonging to the normal distribution law, namely:
1. Shapiro-Wilk criterion42;
2. D’Agostino’s criterion43;
3. Kolmogorov-Smirnov criterion44;
4. Anderson-Darling criterion45;
5. Akaike’s criterion46;
6. Bayes criterion47.
The choice between parametric and non-parametric statistical criteria was made based on calculation of statistical power of the criterion depending on the number of tested samples by Monte Carlo method (the number of tests per point was 100000), the level of statistical significance was set equal to 0.05. The estimation of the closest to the data simple law of distribution was performed by the minimum of Akaike’s information criterion and Bayes criterion seven simple continuous distributions were considered:
-
7.
1. Normal;
-
8.
2. Logarithmically Normal;
-
9.
3. Logistic;
-
10.
4. Cauchy;
-
11.
5. Gamma;
-
12.
6. Weibull;
-
13.
7. Exponential;
-
14.
8. Gumbel.
Parameters of the distributions were calculated using the maximum likelihood method48.
The result of the assessment of statistical power of the criterion for checking the conformity of the data to the normal law of distribution and the closest to the data theoretical distribution is the choice of the criterion that has the maximum statistical power for the data under study. According to the result of applying the criterion, a conclusion should be made about statistically significant difference of the distribution law from the normal law. In further analysis, in those cases when in the data set at least one of the parameters does not obey the normal distribution law, nonparametric statistical criteria are applied. If all the variables under study obey the normal distribution law, parametric statistical criteria are applied.
Based on this conclusion, the selection of criteria is carried out to evaluate statistically significant differences in groups of samples made by FDM printing technology from ABS, PLA and PETG plastics with four different types of filling (Lateral, Combs, Triangles and Grid) and four filling levels of 25%, 50%, 75% and 100%. In the presented work, the following algorithm was adopted: if the closest to the law of data distribution is the normal distribution law, ANOVA together with Tukey’s test is applied, otherwise the Kruskal-Wallis criterion49 combined with Dunn’s criterion50 is applied, and the Bonferroni correction51 was used as a correction for multiple comparisons. Bonferroni correction in multiple comparisons was applied as the most conservative of the existing statistical corrections52.
As a result of applying these tests, the output is a division into groups of data that statistically significantly differ or do not differ from each other by some characteristic. The result obtained about the number of statistically significantly different groups serves as a basis for hierarchical cluster analysis53. In the presented work, when conducting data clustering, the distance between the elements included in one cluster was calculated as the maximum difference between any paired elements with subsequent averaging of the distance in each cluster. The quality check of hierarchical clustering was performed based on the Spearman correlation between the maximized distance and the cofounded distance of hierarchical clustering. The data divided into new groups and when the hypothesis that the distribution law of the data differs from the Gaussian distribution law was confirmed, they were subjected to Spearman correlation analysis54, the strength of the correlation was interpreted using the Evans scale55. The obtained correlation matrices between variables and the statistical significance matrix (p-value matrix) were used to construct the connectedness graph between variables. When constructing the graph, variables with statistically significant correlation were considered as related variables.
The variables included in the correlation graph were ranked according to three different centrality measures: degree centrality56,57, closeness centrality58, and betweenness centrality59. The variable with maximum centrality was used as the dependent variable to build the regression model as a function of percent completion. In cases where the distribution of the data obeyed a distribution law other than normal, the robust regression method60 was used to build a model predicting the centrality variable depending on the percentage of occupancy in each of the selected groups.
Results and discussion
Results and statistical analysis
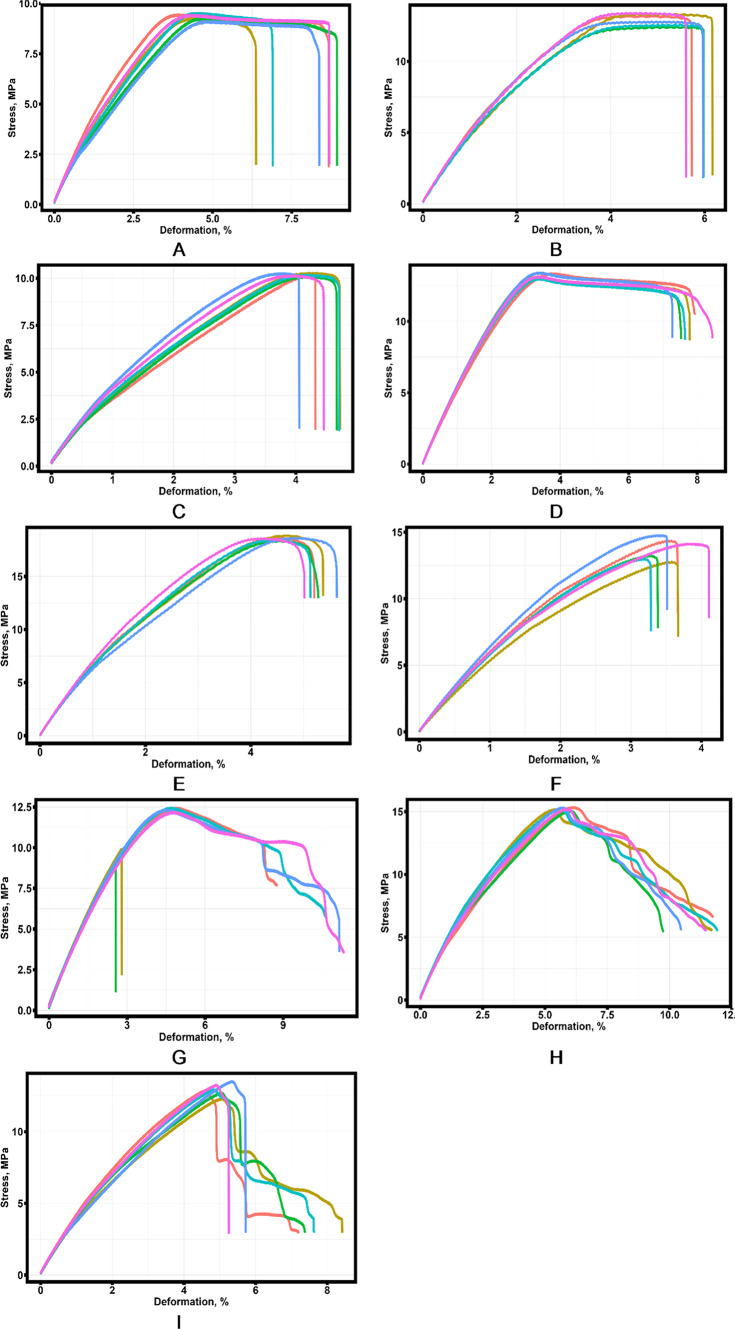
Figure 5 shows examples of engineering stress-strain diagrams of FDM printed samples made from ABS, PLA and PETG plastics with 25% fill level and different fill structures.
Fig. 5.
Engineering stress-strain diagrams of specimens fabricated by FDM printing technique with 25% fill level from: (a) Grid fill type, ABS material; (b) Combs fill type, ABS plastic material; (c) Triangles fill type, ABS plastic material; (d) Grid fill type, PLA plastic material; (e) Combs fill type, PLA plastic material; (f)Triangles fill type, PLA plastic material; (g) Grid fill type, PETG plastic material; (h)Combs structure type, PETG plastic material; (i) Triangles structure type, PETG plastic material.
Similar stress-strain diagrams were obtained for 50% and 75% fill levels (Appendix A). Appendix B presents mechanical properties of specimens with different filling levels, type of internal specimen structure and materials. Based on the results obtained, statistical analysis of the data was performed.
Table 3 presents the results of the basic statistical analysis of tensile tests, for specimens produced by FDM printing technology from ABS, with Grid fill type and 25% fill value.
Table 3.
Results of the basic statistical analysis of mechanical properties of the samples obtained by FDM printing technology from ABS, with Grid filling type and 25% filling value.
| Statistical quantity | Width, mm | Height, mm | EY, MPa | ET, MPa | σys, MPa | σts, MPa | εys, % | εts, % |
|---|---|---|---|---|---|---|---|---|
| Mean | 10.170 | 9.870 | 354.037 | 521.958 | 3.727 | 9.350 | 1.429 | 4.848 |
| Standard deviation | 0.060 | 0.0167 | 19.602 | 19.666 | 0.762 | 0.153 | 0.134 | 0.241 |
| Median | 10.185 | 9.870 | 354.910 | 514.360 | 3.660 | 9.365 | 1.378 | 4.863 |
| Maximum value | 10.240 | 9.890 | 381.240 | 553.960 | 4.720 | 9.530 | 1.683 | 5.119 |
| Minimum value | 10.090 | 9.840 | 326.020 | 506.020 | 2.680 | 9.120 | 1.324 | 4.525 |
| First quartile | 10.130 | 9.870 | 342.878 | 506.785 | 3.298 | 9.268 | 1.351 | 4.681 |
| Third quartile | 10.220 | 9.878 | 364.933 | 532.683 | 4.263 | 9.455 | 1.447 | 5.039 |
Where EY - Young modulus; ET - modulus along the 0.05–0.2% strain secant; σYS - yield stress; σTS – tensile stress; εYS - deformation corresponding to yield stress; εTS - deformation corresponding to tensile stress.
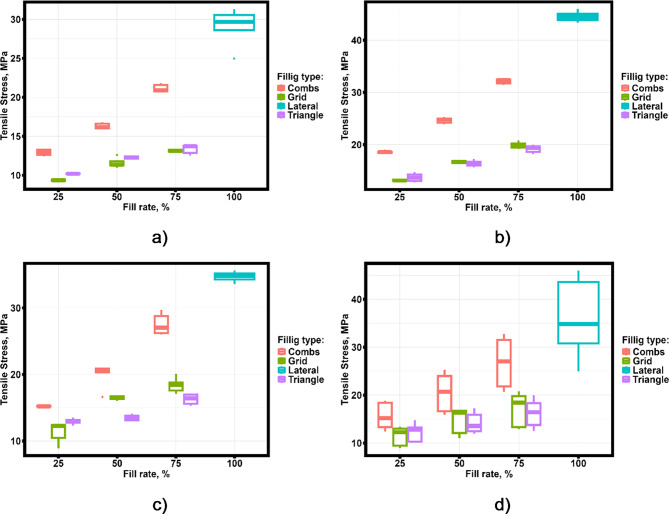
Figure 6 shows the dependence of tensile stress as a function of fill percentage and fill type for samples fabricated by FDM printing technique from ABS, PLA and PETG plastic.
Fig. 6.
Dependence of tensile stress on the percentage of filling of FDM printed specimens made from (a) ABS plastic; (b) PLA plastic; (c) PETG plastic; (d) in general for the three plastics.
Based on the results obtained from the basic statistical analysis, several hypotheses can be put forward. The tensile stress of samples made by FDM printing technology from ABS, PLA and PETG plastic varies linearly depending on the percentage of sample filling, the tensile stress of samples with Combs filling significantly exceeds the tensile stress of samples with Grids and Triangles filling regardless of the percentage of sample filling. It should be noted that for the other mechanical properties (e.g. yield stress) such an unambiguous dependence does not appear.
To confirm the hypotheses put forward, it is necessary to determine the closest type of distribution, to choose the criterion of testing for compliance with the normal law of distribution possessing maximum statistical power, to analyze differences in mean values and correlation analysis.
The analysis of the closest theoretical type of distribution was carried out by the minimum of Akaike and Bayes criteria, 8 types of distributions were compared, parameters of distributions were determined by the maximum likelihood method. Table 4 shows the results of calculations by Akaike and Bayes criteria.
Table 4.
Results of calculations by Akaike and Bayes information criteria for the closest law of distribution of tensile stress.
| Criterion | Normal | Log-Normal | Logistical | Gamma | Weibull | Exponential | Gumbel | Cauchy |
|---|---|---|---|---|---|---|---|---|
| Akaike | 1261.876 | 1182.857 | 1241.637 | 1202.161 | 1241.142 | 1412.201 | 1184.445 | 1238.681 |
| Bayes | 1268.262 | 1189.243 | 1248.023 | 1208.546 | 1247.527 | 1415.394 | 1190.831 | 1245.067 |
It follows from the results of calculations that the closest distribution law is the log-normal distribution law. Figure 7 shows the results of calculations of the average statistical power of the criteria of testing for compliance with the normal distribution law by the Monte Carlo method for data distributed according to the log-normal distribution law.
Fig. 7.
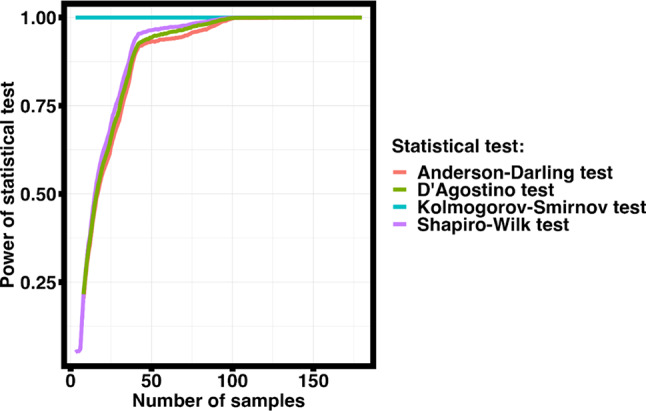
Dependence of the average statistical power of the criterion for testing the conformity of data to the normal distribution law on the number of test results calculated by the Monte Carlo method.
Analysis of the results of Monte Carlo calculations of the average statistical power show that if the closest type of distribution is the log-normal distribution law, and the number of values under study exceeds 100, then all the considered criteria have a power close to 1 and can be used to test the data for compliance with the normal distribution law. Considering the closest type of distribution defined by the information criteria, the Anderson-Darling test will be applied in this paper to test the conformity of the data to the normal law of distribution.
Table 5 shows the results of applying the Anderson-Darling test for the data collected from the experiment, the level of statistical significance was set at 0.05.
Table 5.
Results of testing the data for compliance with the normal law of distribution by means of the Anderson-Darling test.
| ws | hs | EY | ET | σYS | σTS | εYS | εTS | |
|---|---|---|---|---|---|---|---|---|
| p-value | 0.004 | < 0.00001 | < 0.00001 | < 0.00001 | 0.033 | < 0.00001 | < 0.00001 | 0.017 |
Where ws – width sample; hs – heights sample; EY - Young modulus; ET - modulus along the 0.05–0.2% strain secant; σYS - yield stress; σTS – tensile stress; εYS - deformation corresponding to yield stress; εTS - deformation corresponding to tensile stress.
The results of Anderson-Darling test show that all the studied data statistically significantly differ from the normal law of distribution, therefore, for further analysis will be applied non-parametric statistical criteria of data analysis.
Analysis of statistical significance of differences in mechanical properties of samples made by FDM printing technology from ABS, PLA and PETG plastics with different percentage and type of sample filling was carried out using Kruskal-Wallis criterion and Dunn’s criterion, Bonferroni correction was used as a correction for multiple comparison, the level of statistical significance was taken as 0.05.
The results of comparative analysis of the tensile stress of the specimens fabricated by FDM printing technique from ABS, PLA and PETG plastic with four different types of filling and 4% filling are presented in Tables 6, 7 and 8.
Table 6.
Results of analyzing the differences of tensile stress of specimens made from different plastics by FDM printing technology.
| p-value, Dunn’s criterion | ABS | PLA |
|---|---|---|
| PLA | 0.0000 | --- |
| PETG | 0.0002 | 0.0514 |
| p-value, Kruskal-Wallis criterion | 0.000 | |
Table 7.
Results of analyzing the differences in tensile stress of specimens fabricated by FDM technique from ABS, PLA and PETG plastics with different type of filler.
| p-value, Dunn’s criterion | Combs | Grid | Lateral |
|---|---|---|---|
| Grid | 0.0000 | --- | --- |
| Lateral | 0.0012 | 0.0000 | --- |
| Triangle | 0.0000 | 1.0000 | 0.0000 |
| p-value, Kruskal-Wallis criterion | 0.000 | ||
Table 8.
Results of analyzing the differences of tensile stress of specimens fabricated by FDM printing technique from ABS, PLA and PETG plastics and different filling structure.
| p-value, Dunn’s criterion | 100% | 25% | 50% |
|---|---|---|---|
| 25% | 0.0000 | --- | --- |
| 50% | 0.0000 | 0.0007 | --- |
| 75% | 0.0003 | 0.0000 | 0.0086 |
| p-value, Kruskal-Wallis criterion | 0.000 | ||
The results of the analysis of differences in strength limits show that there are no statistically significant differences between the strength limits of samples made of PLA and PETG plastics (Table 6), nor are there statistically significant differences between Grid and Triangle fill types (Table 7). In all other cases, the differences within the strength limits are statistically significant. Consequently, the experimental data obtained can be divided into three groups based on the fill type and the strength limit parameter. Hierarchical cluster analysis was applied to divide the data into groups. The distance between the elements included in one cluster was calculated as the maximum difference between any paired elements with subsequent averaging of the distance in each cluster.
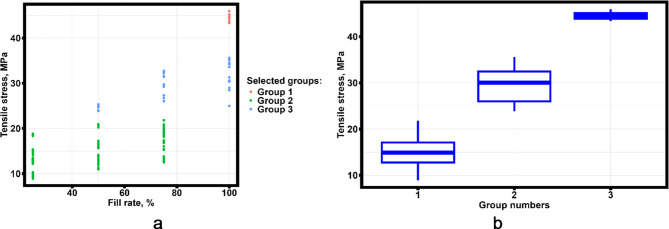
Figure 8 shows the result of dividing the data into three groups based on the results of cluster analysis for the tensile stress as a function of the variation in the percentage of filling of the FDM-printed ABS, PLA and PETG plastic samples.
Fig. 8.
Results of applying cluster analysis to divide the data into groups with different tensile stress behavior. Dependence of tensile stress on the percentage of filling (a) and variation of tensile stress in groups (b).
The Spearman’s correlation coefficient between the average maximized distance and the coffinite distance was 0.909, indicating a strong linear relationship between these two parameters.
The separation of the samples fabricated by FDM printing technique from ABS, PLA and PETG plastics is presented in Table 9.
Table 9.
Composition of groups separated according to the results of hierarchical cluster analysis.
| Group 3 | Group 1 | Group 2 | ||||||
|---|---|---|---|---|---|---|---|---|
| Materials | Infill pattern | Infill rate, % | Materials | Infill pattern | Fill rate,% | Materials | Infill pattern | Infill rate,% |
| PLA | Lateral | 100 | ABS | Grid | 25 | ABS | Lateral | 100 |
| ABS | Grid | 50 | PLA | Combs | 50 | |||
| ABS | Grid | 75 | PLA | Combs | 75 | |||
| ABS | Combs | 25 | PETG | Combs | 75 | |||
| ABS | Combs | 50 | PETG | Lateral | 100 | |||
| ABS | Combs | 75 | ||||||
| ABS | Triangle | 25 | ||||||
| ABS | Triangle | 50 | ||||||
| ABS | Triangle | 75 | ||||||
| PLA | Grid | 25 | ||||||
| PLA | Grid | 50 | ||||||
| PLA | Grid | 75 | ||||||
| PETG | Combs | 25 | ||||||
| PETG | Combs | 50 | ||||||
| PETG | Triangle | 25 | ||||||
| PETG | Triangle | 50 | ||||||
| PETG | Triangle | 75 | ||||||
| PETG | Grid | 25 | ||||||
| PETG | Grid | 50 | ||||||
| PETG | Grid | 75 | ||||||
From the results of the cluster analysis, it follows that if it is necessary to save material and provide an average level of mechanical properties of the product, one of the good solutions will be the use of Combs filling type and PLA material when printing products using FDM technology.
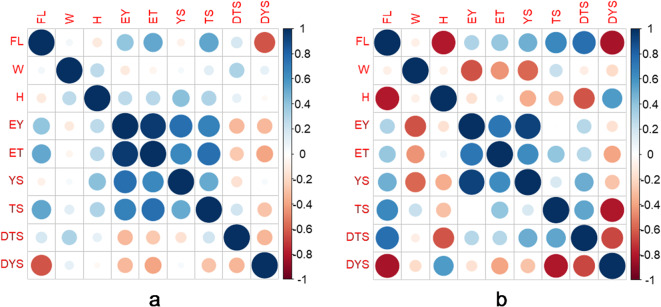
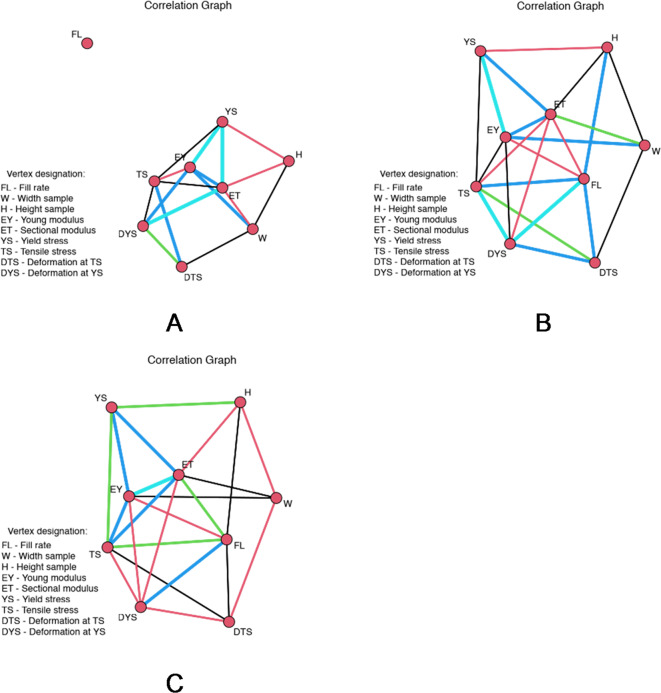
Further correlation analysis of relationships between mechanical properties and geometric parameters of samples was carried out within the selected groups, Spearman correlation was used for analysis, and the stress of correlation was interpreted according to the Evans scale. The correlation matrices in graphical form are presented in Fig. 9.
Fig. 9.
Correlation between mechanical properties in groups identified based on cluster analysis (a) in the first group; (b) in the second group. Where FL – fill rate; W - sample width; H – sample height; EY - Young modulus; ET - modulus along the 0.05–0.2% strain secant; YS - yield stress; TS - tensile stress; DTS - deformation corresponding to tensile stress; DYS - deformation corresponding to yield stress.
In group 1 of FDM-printed specimens, a medium level of correlation is observed between the percentage of filling, secant modulus, tensile stress and strain corresponding to yield stress. In group 2, a high level of correlation is observed between the percentage of filling and strains corresponding to the tensile stress and yield stress (negative correlation). Average level of correlation between percentage of filling, tensile strength and yield stress and low statistically significant level of correlation between percentage of filling and modulus by secant of 0.05–0.2% strain.
The results of the correlation analysis are presented in the form of a graph of correlation of the analyzed parameters in Fig. 10.
Fig. 10.
Correlation graphs between variables included in the data set for: (a) group 3; (b) group 2; (c) group 1. Where FL – fill rate; W - sample width; H - sample height; EY - Young modulus; ET - modulus along the 0.05–0.2% strain secant; YS - yield stress; TS - tensile stress; DTS - deformation corresponding to tensile stress; DYS - deformation corresponding to yield stress.
Measures of predictor centrality were computed for each correlation graph and graph nodes, and the computational results are presented in Table 10.
Table 10.
Centrality analysis results for each variable included in the correlation graph.
| Pred. | Group 1 | Pred. | Group 2 | Pred. | Group 3 | ||||||
|---|---|---|---|---|---|---|---|---|---|---|---|
| Degree centrality | Closeness centrality | Betweenness centrality | Degree centrality | Closeness centrality | Betweenness centrality | Degree centrality | Closeness centrality | Betweenness centrality | |||
| ET | 7.000 | 0.889 | 2.917 | ET | 7.000 | 0.889 | 2.917 | ET | 6.000 | 0 | 3.167 |
| FL | 6.000 | 0.800 | 2.083 | FL | 6.000 | 0.800 | 2.083 | EY | 5.000 | 0 | 1.333 |
| EY | 6.000 | 0.800 | 1.833 | EY | 6.000 | 0.800 | 1.833 | TS | 5.000 | 0 | 2.000 |
| TS | 6.000 | 0.800 | 2.083 | TS | 6.000 | 0.800 | 2.083 | W | 4.000 | 0 | 2.000 |
| DYS | 5.000 | 0.727 | 0.500 | DYS | 5.000 | 0.727 | 0.500 | YS | 4.000 | 0 | 0.833 |
| W | 4.000 | 0.667 | 1.250 | W | 4.000 | 0.667 | 1.250 | DYS | 4.000 | 0 | 0.667 |
| H | 4.000 | 0.667 | 0.833 | H | 4.000 | 0.667 | 0.833 | H | 3.000 | 0 | 0.333 |
| YS | 4.000 | 0.667 | 0.583 | YS | 4.000 | 0.667 | 0.583 | DTS | 3.000 | 0 | 0.667 |
| DTS | 4.000 | 0.667 | 0.917 | DTS | 4.000 | 0.667 | 0.917 | FL | 0.000 | 0 | 0.000 |
| Centr. | 0.304 | 0.185 | 0.059 | Centr. | 0.304 | 0.185 | 0.059 | Centr. | 0.357 | 0 | 0.078 |
Where FL – fill rate; W - sample width; H - sample height; EY - Young modulus; ET - modulus along the 0.05–0.2% strain secant; YS - yield stress; TS - tensile stress; DTS - deformation corresponding to tensile stress; DYS - deformation corresponding to yield stress.
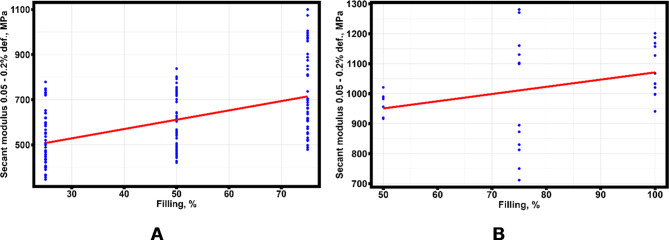
It follows from the presented results of the correlation graph analysis that the maximum number of statistically significant correlations is possessed by the modulus along the 0.05–0.2% strain secant (ET). The study of the behavior of the 0.05–0.2% strain secant modulus considering the division of samples into groups depending on the percentage of filling is presented in Fig. 11 (group 3 is not presented because it includes samples made by FDM printing technology from PLA with 100% filling).
Fig. 11.
Variation of modulus along the 0.05–0.2% strain secant (ET) as a function of the percentage of specimen filling in the first group (a) and in the second group (b).
Table 11 presents the robust regression equations obtained from the modeling.
Table 11.
Robust regression equations.
| Group Number | Regression equation | Standard deviation, MPa | Experimental standard deviation, MPa |
|---|---|---|---|
| Group 1 |
|
164.200 | 169.0439 |
| Group 2 |
|
133.600 | 145.2301 |
The analysis of regression equations shows that specimens in group 2 have an average modulus along the 0.05–0.2% strain secant almost twice as high as specimens in group 1. However, the rate of increase of modulus in group 2 is half that of group 1. Comparison of the mean square deviations of the robust regression equations with the mean square deviation of the experimentally obtained results shows that the obtained models predict the modulus values no worse than the experimentally obtained values.
Summarizing the results of the analysis, we can conclude that if it is necessary to manufacture full-fledged body products and the need to save material, we can recommend using PLA plastic with Combs type filling and the percentage of filling 50%, which will save up to 23% of material. This conclusion is consistent with the earlier studies conducted in20.
Discussion
The statistical analysis shows that the main quantity with the maximum number of correlations is the modulus along the 0.05–0.2% strain secant. Calculation of the secant modulus is performed using the equation:
| 1 |
Where
| 2 |
Where
Authors61 there are two stages of hardening - linear and Taylor hardening62,63 and note that the main factor affecting the strain hardening of the material is the defect structure. Two types of defects can be distinguished in the samples studied in the presented work:
Defects resulting from the layer-by-layer direction of the material (pores, non-fusion between layers, etc.)
Macro-defects - absence of material in unfilled areas of the specimen with different filling patterns
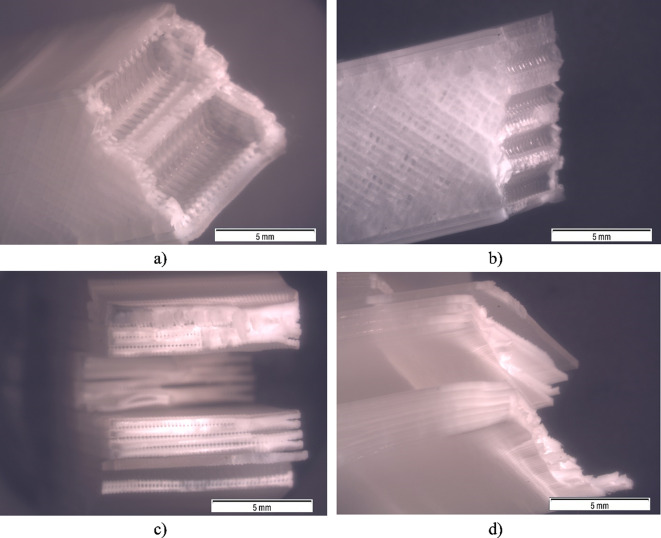
Figure 12 shows the fracture structure of the samples obtained by FDM printing technique from PLA plastic with 25%, 50% and 100% fill percentage and Combs and Lateral fill type.
Fig. 12.
Fracture pattern of FDM printed PLA plastic samples with (a) 25% fill percentage; (b) 50% Combs fill type and (c, d) 100% fill and Lateral fill type.
Analysis of fracture character of specimens with 25% and 50% filling and Combs type of filling shows that fracture occurs by brittle mechanism. The occurrence of brittle fracture mechanism can be related to several factors. The first factor may be the printing speed chosen during sample fabrication. Ergene, Berkay, and Çağın Bolat64 showed that increasing the printing speed shifts the fracture type from ductile to brittle. The second reason could be the influence of macro-defects on the fracture behavior, as the size of macro-defects decreases, the ductility of the material increases.
For specimens with 100% filling and Lateral type of filling, the fracture of the fracture area has a pronounced “neck” and there is a delamination of the specimen along the boundary of the cladding layers, which indicates the plastic nature of fracture. At 100% filling and Lateral type of filling there is no influence of macrodefects and there are only microdefects characteristic of samples made by FDM printing technology65, and the influence of printing speed [68]. Consequently, the increase in the strain hardening coefficient and the shift of the fracture character from brittle to plastic can be explained by the decrease in the influence (absence) of macrodefects. Which leads to a 50% increase in strain hardening coefficient compared to the Combs fill type (text under Table 11).
Generalization of the results of the fracture structure analysis and the revealed statistical regularities shows that with the increase of the filling percentage, the amount of material in the internal area of the specimen increases and, therefore, the defect structure changes, which finally leads to strain hardening of the specimens. The strain hardening value depends not only on the nature of the defect structure, but also on the type of material (this explains the difference in the strain hardening value between ABS and PLA plastic with 100% filling and Lateral type of filling).
Conclusion
Statistical analysis of the tensile test results showed that there were no statistically significant differences between the tensile stress limits of the PETG and PLA plastic specimens, and between the specimens with Grid and Triangle filling types. Based on this result, a cluster analysis was performed dividing all tensile test results into three groups. As a result of the cluster analysis, a group of PLA specimens with 100% filling had the maximum tensile stress value. Group of samples with intermediate average value of tensile stress and group of samples with low value of tensile stress. The middle group included samples made by FDM technology from ABS, PLA and PETG plastics and having Combs (PLA, PETG) and Lateral (ABS) type of filling. From a practical point of view, the most interesting result was the result for PLA plastic with Combs type filling and percentage of filling 50 and 75%, which showed average values of the tensile stress, which allows us to recommend this type of filling for the purposes of material saving with a low risk of loss of mechanical properties of the product. The conducted correlation analysis showed the presence of stable statistically significant correlation between the percentage of specimen filling, 0.05–0.2% strain modulus, tensile stress, and strain corresponding to yield stress. The analysis of the graph of statistically significant correlations showed that for all the selected groups the 0.05–0.2% strain modulus has the maximum number of correlations, based on this conclusion regression models linking the percentage of filling and modulus on the secant were constructed. The results of the regression analysis show that the average secant modulus of the samples assigned to the second group is more than twice as high as that of the samples in the first group, while the average modulus of the first group is only 50% higher than that of the second group.
The detected statistical regularities can be explained by the mechanism of strain hardening, the actual value of which depends on the type of defect structure and properties of the material used in the manufacture of samples. It is necessary to distinguish between macro and micro defects present in the final product, the structure and distribution of which affects the strain hardening value.
Thus, when manufacturing products by FDM printing technology from PLA and PETG plastics to reduce the material intensity of the product can be recommended type of filling Combs with a percentage of filling from 50 to 75%.
Electronic supplementary material
Below is the link to the electronic supplementary material.
Author contributions
Conceptualization, N.N., N.W.S.P; methodology, N.N., N.W.S.P.; software, N.N., O.Y.; validation, N.N.; formal analysis, P.P., N.N., D.S.; investigation, R.K., M.S.; resources, N.N., O.Y.; data curation, N.K., O.Y.; writing—original draft preparation, N.N., A.S.; writing—review and editing, N.N., A.S.; visualization, P.P., N.K., O.Y.; supervision, S.G., N.K.; project administration, S.G., P.P.; funding acquisition, P.P., N.K., O.Y. All authors have read and agreed to the published version of the manuscript.
Funding
This work was supported by the Ministry of Health ofthe Russian Federation under project 056-00041-23-00.
Data availability
Data is provided within the manuscript in Appendix B.
Declarations
Competing interests
The authors declare no competing interests.
Footnotes
Publisher’s note
Springer Nature remains neutral with regard to jurisdictional claims in published maps and institutional affiliations.
Contributor Information
Nikita Nikitin, Email: nikitin5@yandex.ru.
Anton Smirnov, Email: a.smirnov@stankin.ru.
References
- 1.Gibson, I. & Rosen, D. Brent Stucker. Additive Manufacturing Tecnologies. 3D Printing, Rapid Prototyping and Direct Digital Manufacturing//Springer, – P.P. 648 (2015).
- 2.Sandeep Rauta, V. S., Jattib, Nitin, K. & Khedkarc, T. P. S. Investigation of the effect of built orientation on mechanical properties and total cost of FDM parts //. Procedia Mater. Sci.6, 1625–1630 (2014). [Google Scholar]
- 3.Ludmila Novakova - Marcincinova, Jozef Novak - Marcincin. Verification of mechanical Properties of ABS materials used in FDM rapid prototyping technology// Proceedings in manufacturing systems/vol. 8. ISS. 2. 87–92. (2013).
- 4.Dudek, P. FDM 3D printing technology in manufacturing composite elements. Archives Metall. materials// vol. 58 ISS.4/dol (2013).
- 5.Rodríguez, J. F., Thomas, J. P. & Renaud, J. E. Mechanical behavior of acrylonitrile butadiene styrene (ABS) fused deposition materials. Experimental investigation //. Rapid Prototyp. J.7, 148–158 (2001). [Google Scholar]
- 6.Johnson, G. A. & French, J. J. Evaluation of infill effect on mechanical properties of consumer 3D printing materials. Adv. Technol. Innov.3, 179–184 (2018). [Google Scholar]
- 7.Sotova, C. et al. Dental implants: modern materials and methods of their surface modification. Materials. 16, 7383. 10.3390/ma16237383 (2023). [DOI] [PMC free article] [PubMed] [Google Scholar]
- 8.Smirnov, A., Volosova, M., Peretyagin, P. & Bartolomé, J. F. Tribological behaviour of a 3Y-TZP/Ta ceramic-metal biocomposite against ultrahigh molecular weight polyethylene (UHMWPE), Ceramics International, Volume 44, Issue 2, Pages 1404–1410, ISSN 0272–8842, (2018). 10.1016/j.ceramint.2017.09.186
- 9.Bogue, R. 3D printing: the dawn of a new era in manufacturing? Assembly Autom.33 (4), 307–311 (2013). [Google Scholar]
- 10.Bremer, M. et al. Influence of plastic recycling—a feasibility study for additive manufacturing using glycol modified polyethylene terephthalate (PETG). SN Appl. Sci.4 (5), 156 (2022). [Google Scholar]
- 11.Panneerselvam, T., Raghuraman, S. & Vamsi Krishnan, N. Investigating mechanical properties of 3D-printed polyethylene terephthalate glycol material under fused deposition modeling. J. Institution Eng. (India): Ser. C. 102, 375–387 (2021). [Google Scholar]
- 12.DeStefano, V., Khan, S. & Tabada, A. Appl. PLA Mod. Med. Eng. Regeneration1 : 76–87. (2020). [DOI] [PMC free article] [PubMed] [Google Scholar]
- 13.Moraru, E. et al. Study and realization of prosthetic dental models by additive technologies. IOP Conference Series: Materials Science and Engineering. Vol. 444. IOP Publishing, (2018).
- 14.Fujiwara, K. et al. Mechanical evaluation of newly developed mouthpiece using polyethylene terephthalate glycol for transoral robotic surgery. J. Robotic Surg.9, 347–354 (2015). [DOI] [PMC free article] [PubMed] [Google Scholar]
- 15.Petrova, G. N., Platonov, M. M., Bolshakov, V. A. & Ponomarenko, S. A. Study of the complex characteristics of base materials for FDM technology of additive synthesis. Physico-mechanical and thermophysical properties//Plastic masses № 5–6, pp. 53–58 (2016). (In Russia).
- 16.Marșavina, L. et al. Effect of the manufacturing parameters on the tensile and fracture properties of FDM 3D-printed PLA specimens. Eng. Fract. Mech.274, 108766 (2022). [Google Scholar]
- 17.Fountas, N. A. et al. Experimental investigation and statistical modelling for assessing the tensile properties of FDM fabricated parts. Procedia Struct. Integr.26, 139–146 (2020). [Google Scholar]
- 18.Smirnov, A. et al. Experimental and statistical modeling for effect of nozzle diameter, filling pattern, and Layer Height of FDM-Printed ceramic–polymer green body on Biaxial Flexural Strength of Sintered Alumina Ceramic. J. Compos. Sci.7, 381. 10.3390/jcs7090381 (2023). [Google Scholar]
- 19.Smirnov, A. et al. Correction: Smirnov et al. Experimental and statistical modeling for effect of nozzle diameter, filling pattern, and Layer Height of FDM-Printed ceramic–polymer green body on Biaxial Flexural Strength of Sintered Alumina Ceramic. J. Compos. SciJ Compos. Sci.78 (38195). 10.3390/jcs8030095 (20232024).
- 20.John, J. et al. Optimization of 3D printed polylactic acid structures with different infill patterns using Taguchi-grey relational analysis. Adv. Industrial Eng. Polym. Res.6 (1), 62–78 (2023). [Google Scholar]
- 21.Kopar, M. Experimental investigation of mechanical properties of PLA, ABS, and PETG 3-d printing materials using fused deposition modeling technique. Mater. Test.65 (12), 1795–1804 (2023). [Google Scholar]
- 22.Erdaş, M. & Umut Betül Sultan Yıldız, and Ali Rıza Yıldız. Experimental analysis of the effects of different production directions on the mechanical characteristics of ABS, PLA, and PETG materials produced by FDM. Mater. Test.66 (2), 198–206 (2024). [Google Scholar]
- 23.Özsoy, K., Erçetin, A. & Alp, Z. Çevik. Comparison of mechanical properties of PLA and ABS based structures produced by fused deposition modelling additive manufacturing. Avrupa Bilim ve Teknoloji Dergisi 27 : 802–809. (2021).
- 24.Kartal, F. L. A. N. Kaptan. Effect of filling ratio-pattern parameters on Mechanical properties of PLA filaments used in 3D Printing. Black Sea J. Eng. Sci.7 (2), 13–14 (2024). [Google Scholar]
- 25.Smirnov, A., Peretyagin, P. & Nikitin, N. Modeling of stress distribution and fracture in ABS, PLA, and Alumina-filled PLA filaments and FDM-Printed specimens. J. Compos. Sci.7, 265. 10.3390/jcs7070265 (2023). [Google Scholar]
- 26.Mengesha Medibew Tesfaye. A comprehensive review on the optimization of the fused deposition modeling process parameter for better tensile strength of PLA-printed parts. Advances in Materials Science and Engineering (2022). (2022).
- 27.Algarni, M. & Ghazali, S. Comparative study of the sensitivity of PLA, ABS, PEEK, and PETG’s mechanical properties to FDM printing process parameters. Crystals 11.8 : 995. (2021).
- 28.Smirnov, A., Peretyagin, P. & Nikitin, N. Assessment Effect of Nanometer-Sized Al2O3 Fillers in Polylactide on fracture probability of filament and 3D printed samples by FDM. Materials. 16, 1671. 10.3390/ma16041671 (2023). [DOI] [PMC free article] [PubMed] [Google Scholar]
- 29.Dimitrescu, A. et al. Theoretical and experimental research on the mechanical tests of 3D printed samples from various materials. IOP Conference Series: Materials Science and Engineering. Vol. 1303. No. 1. IOP Publishing, (2024).
- 30.Berihun Sitotaw et al. Investigation of Parameters of Fused Deposition Modelling 3D Prints with Compression Properties. Advances in Materials Science and Engineering (2022). (2022).
- 31.Vosynek, P. et al. Influence of process parameters of printing on mechanical properties of plastic parts produced by FDM 3D printing technology. MATEC web of conferences. Vol. 237. EDP Sciences, (2018).
- 32.Rodríguez-Panes, A., Claver, J. & Ana María, C. The influence of manufacturing parameters on the mechanical behaviour of PLA and ABS pieces manufactured by FDM: a comparative analysis. Materials. 11, 1333 (2018). [DOI] [PMC free article] [PubMed] [Google Scholar]
- 33.Farbman, D. & McCoy, C. Materials testing of 3D printed ABS and PLA samples to guide mechanical design. International manufacturing science and engineering conference. Vol. 49903. American Society of Mechanical Engineers, (2016).
- 34.Smirnov, A. et al. Rheological characterization and printability of Polylactide (PLA)-Alumina (Al2O3) filaments for fused deposition modeling (FDM). Materials. 15, 8399. 10.3390/ma15238399 (2022). [DOI] [PMC free article] [PubMed] [Google Scholar]
- 35.Gong, K. et al. Optimizing process parameters of a material extrusion–based overprinting technique for the fabrication of tensile specimens. Int. J. Adv. Manuf. Technol.127 (7), 3513–3524 (2023). [Google Scholar]
- 36.Afshari, H. et al. Studying the effects of FDM process parameters on the mechanical properties of parts produced from PLA using response surface methodology. Colloid Polym. Sci. : 1–16 (2024).
- 37.Naveed, N. and Muhammad Naveed Anwar. Optimising 3D printing parameters through experimental techniques and ANOVA-Based statistical analysis. SPE Polymers (2024).
- 38.Bolat, Ç. An investigation on dimensional accuracy of 3D printed PLA, PET-G and ABS samples with different layer heights. Çukurova Üniversitesi Mühendislik Fakültesi Dergisi. 37 (2), 449–458 (2022). [Google Scholar]
- 39.Kumar, S. et al. Fused filament fabrication: a comprehensive review. J. Thermoplast. Compos. Mater.36 (2), 794–814 (2023). [Google Scholar]
- 40.Bolat, Ç., Ergene, B., Hasan & Ispartalı A comparative analysis of the effect of post production treatments and layer thickness on tensile and impact properties of additively manufactured polymers. Int. Polym. Proc.38 (2), 244–256 (2023). [Google Scholar]
- 41.Tukey, J. W. Exploratory data analysis. Addison-Wesley Pub. Co., c1977. - xvi, 688 p.
- 42.Shapiro, S. S. & Wilk, M. B. An analysis of variance test for normality. Biom Trust. 52, 591–611 (1965). [Google Scholar]
- 43.D’Agostino, R. B. & Pearson, E. S. Tests for departure from normality. Empirical results for the distributions of b2 and √b1. Biometrika. 60 (3), 613–622 (1973). [Google Scholar]
- 44.Kolmogorov, A. N. Sulla determinazione Empirica Di Une Legge Di distribuzione. G Ist Ital. Attuari. 4, 83–91 (1933). [Google Scholar]
- 45.AndersonW. On the distribution of the two-Sample Cramer-Von Mises Criterion. Ann. Math. Statist. 33 (3), 1148–1159 (1962). September. [Google Scholar]
- 46.Sakamoto, Y., Ishiguro, M. & Genshiro Kitagawa. and. Akaike information criterion statistics. Dordrecht, The Netherlands: D. Reidel 81.10.5555 : 26853. (1986).
- 47.Wit, Ernst, Edwin van den Heuvel, and Jan-Willem Romeijn. ‘All models are wrong…an introduction to model uncertainty. Statistica Neerlandica 66.3 (2012): 217–236.
- 48.Rossi, R. J. Mathematical Statistics: An Introduction to Likelihood Based Inference (Wiley, 2018).
- 49.Kruskal, W. H. & Allen Wallis, W. Use of ranks in one-criterion variance analysis. J. Am. Stat. Assoc.47 (260), 583–621 (1952). [Google Scholar]
- 50.Dunnett, C. W. New tables for multiple comparisons with a control. Biometrics 20.3 : 482–491. (1964).
- 51.Bonferroni, C. E. Teoria Statistica delle classi e calcolo delle probabilità, Pubblicazioni Del R Istituto Superiore Di Scienze Economiche e Commerciali di Firenze 1936.
- 52.Herzog, M. H., Francis, G. & Aaron Clarke. Understanding Statistics and Experimental Design: how to not lie with Statistics (Springer Nature, 2019).
- 53.Nielsen, F. Introduction to HPC with MPI for Data Science (Springer, 2016).
- 54.Spearman, C. The proof and measurement of association between two things. (1961). [DOI] [PubMed]
- 55.Evans, J. D. Straightforward Statistics for the Behavioral Sciences (Thomson Brooks/Cole Publishing Co, 1996).
- 56.Nieminen, J. On the centrality in a graph. Scand. J. Psychol.15.1 (1974): 332–336 . [DOI] [PubMed]
- 57.Freeman, L. C. Centrality in Social Networks: Conceptual Clarification. Social Network: Critical Concepts in Sociology1238–263 (Routledge, 2002).
- 58.Sabidussi, G. The centrality index of a graph. Psychometrika 31.4 : 581–603. (1966). [DOI] [PubMed]
- 59.Freeman, L. C. A set of measures of centrality based on betweenness. Sociometry : 35–41. (1977).
- 60.Huber, P. J. Robust Statistics (– Wiley, 2004). – Т. 523.
- 61.Zuev, L. & Borisovich Vladimir Ivanovich Danilov, and Svetlana Aleksandrovna Barannikova. Physics of Macrolocalization of Plastic flow//Novosibirsk. Nauka, p. 322. – 2008. (In Russia).
- 62.Taylor, G. I. The mechanism of plastic deformation of crystals. Part I.—Theoretical. Proceedings of the Royal Society of London. Series A, Containing Papers of a Mathematical and Physical Character 145.855 : 362–387. (1934).
- 63.Taylor, G. I. The mechanism of plastic deformation of crystals. Part II.—Comparison with observations. Proceedings of the Royal Society of London. Series A, Containing Papers of a Mathematical and Physical Character 145.855 : 388–404. (1934).
- 64.Ergene, B., Çağın & Bolat An experimental investigation on the effect of test speed on the tensile properties of the petg produced by additive manufacturing. International Journal of 3D Printing Technologies and Digital Industry 6.2 : 250–260. (2022).
- 65.Yadav, A. et al. Fused filament fabrication: a state-of-the-art review of the technology, materials, properties and defects. Int. J. Interact. Des. Manuf. (IJIDeM). 17 (6), 2867–2889 (2023). [Google Scholar]
Associated Data
This section collects any data citations, data availability statements, or supplementary materials included in this article.
Supplementary Materials
Data Availability Statement
Data is provided within the manuscript in Appendix B.


