Abstract
Aim:
The goals of this investigation were to 1) identify and measure exposures inside homes of individuals with chemical intolerance (CI), 2) provide guidance for reducing these exposures, and 3) determine whether our environmental house calls (EHCs) intervention could reduce both symptoms and measured levels of indoor air contaminants.
Background:
CI is an international public health and clinical concern, but few resources are available to address patients’ often disabling symptoms. Numerous studies show that levels of indoor air pollutants can be two to five (or more) times higher than outdoor levels. Fragranced consumer products, including cleaning supplies, air fresheners, and personal care products, are symptom triggers commonly reported by susceptible individuals.
Methods:
A team of professionals trained and led by a physician/industrial hygienist and a certified indoor air quality specialist conducted a series of 5 structured EHCs in 37 homes of patients reporting CI.
Results:
We report three case studies demonstrating that an appropriately structured home intervention can teach occupants how to reduce indoor air exposures and associated symptoms. Symptom improvement, documented using the Quick Environmental Exposure and Sensitivity Inventory Symptom Star, corresponded with the reduction of indoor air volatile organic compounds, most notably fragrances. These results provide a deeper dive into 3 of the 37 cases described previously in Perales et al. (2022).
Discussion:
We address the long-standing dilemma that worldwide reports of fragrance sensitivity have not previously been confirmed by human or animal challenge studies. Our ancient immune systems’ ‘first responders’, mast cells, which evolved 500 million years ago, can be sensitized by synthetic organic chemicals whose production and use have grown exponentially since World War II. We propose that these chemicals, which include now-ubiquitous fragrances, trigger mast cell degranulation and inflammatory mediator release in the olfactory-limbic tract, thus altering cerebral blood flow and impairing mood, memory, and concentration (often referred to as ‘brain fog’). The time has come to translate these research findings into clinical and public health practice.
Keywords: Fragrances, mast cells, mould, indoor air, volatile organic compounds, toxicant-induced loss of tolerance, sick building syndrome, medically unexplained symptoms, quick environmental exposure and sensitivity inventory, natural gas
Abbreviations: Quick Environmental Exposure and Sensitivity Inventory, QEESI; Volatile Organic Compounds (VOCs); Indoor Air Quality (IAQ); Toxicant-Induced Loss of Tolerance (TILT); Medically Unexplained Symptoms (MUS); Sick Building Syndrome (SBS)
Introduction
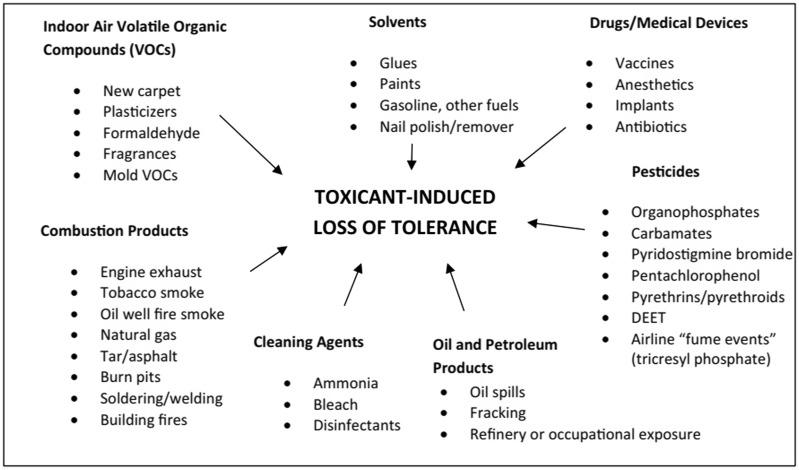
Chemical intolerance (CI) is characterized by multisystem symptoms and intolerances for structurally unrelated substances including chemical inhalants, foods, and drugs (see Figure 1) – the second stage of the disease process we have described as Toxicant-Induced Loss of Tolerance or TILT (Miller, 1997, 1999; Miller et al. 1997; Ashford and Miller, 1998). Frequent symptom triggers include a wide variety of air contaminants, such as combustion products from gas stoves and smoking; volatile organic compounds (VOCs) and semi-volatile organic compounds from products such as disinfectants, pesticides, and fragrances; and chemicals outgassing from new furnishings, paint, carpeting, flooring, glues, and construction materials (Miller and Mitzel, 1995; Miller and Prihoda, 1999a; 1999b; Fanger, 2006; Norbäck and Wang, 2021).
Figure 1.
Chemical exposures implicated as initiators and/or triggers of CI and TILT. Chemicals in every category, except for ‘Drugs/Medical Devices’, can contaminate the air inside homes and other buildings, provoking multisystem symptoms. The QEESI can help patients and their doctors make sense of so-called ‘medically unexplained symptoms’ which are characteristic of CI/TILT.
Worldwide estimated prevalence of CI ranges from 8 to 33% (Katerndahl et al., 2012; Azuma et al., 2015; Steinemann, 2018a). Our own population-based study of more than 10,000 US adults, which used the internationally validated Brief Environmental Exposure and Sensitivity Inventory (BREESI) and Quick Environmental Exposure and Sensitivity Inventory (QEESI), estimated a CI prevalence of 20% among US adults (Palmer et al. 2021). See the list of peer-reviewed journal articles using the QEESI by country in Appendix I. Researchers in both Japan and the US have documented increases in CI prevalence over a 10-year period (Hojo et al. 2018, Steinemann 2018a).
Studies show that levels of indoor air pollutants can be two to five times (or more) higher than outdoor levels and that most people spend close to 90% of their time indoors (U.S. Environmental Protection Agency, 2014). Furthermore, many national and international surveys implicate fragrances in consumer products such as laundry and cleaning supplies, air fresheners, and personal care products as frequent sources of personal exposure that trigger significant symptoms (Steinemann 2016, 2018b, 2019a; Caress and Steinemann, 2004).
To many physicians, policymakers, and the public, the term ‘environment’ denotes outdoor as opposed to indoor exposures. Unfortunately, this unintended bias has overshadowed the preeminent role of indoor air pollution in human health. Notably, Americans spend 70 years of an average 79-year life span indoors (Spengler and Sexton, 1983, Klepeis et al. 2001; Leech et al., 2002). Those who spend most of their time at home or indoors including infants and toddlers, the elderly, and the chronically ill or disabled, are particularly vulnerable (U.S. Consumer Product Safety Commission, 2020).
Patients with CI pose a major diagnostic challenge. They report a wide array of symptoms that wax and wane, including fatigue, memory and concentration difficulties, dizziness, depression, tenseness or nervousness, shortness of breath, irritability, problems focusing their eyes, chest pain, digestive problems, muscle aches, joint pain, tingling or numbness in fingers and/or toes, headaches, eye irritation, or slowed responses (Katerndahl et al., 2012; Palmer et al., 2021). Worldwide, ‘Medically Unexplained Symptoms’ (MUS) comprise 25–50% of complaints by patients, making them the most common category of problems seen by primary care physicians (Edwards et al., 2010).
Fragranced consumer products contain tens to hundreds of synthetic organic chemicals derived from petrochemicals developed since World War II. They are widely recognized symptom triggers reported by people with asthma, migraine sufferers, and CI individuals (Steinemann, 2019b; Wolkoff and Nielsen, 2017). In a US-based study, 35% of respondents attributed adverse health effects to fragranced consumer products. Among those with CI, over 80% described symptoms arising from exposure to fragrances (Potera, 2011; Steinemann, 2016, 2019a).
Indoor VOCs are chemical compounds released as gases/vapours at indoor temperatures from sources, such as construction/remodelling materials, carpeting, adhesives, furnishings, vinyl shower curtains, personal care items, and cleaning and laundry products (Mølhave et al., 1986; Kjærgaard et al., 1991; Hudnell et al., 1992; Loftness et al., 2007; Vardoulakis et al., 2020). Indoor levels of the known carcinogen benzene are higher in homes with attached garages than in homes without attached garages, due to migration from automobile gas tanks, mowers, gas cans, and other sources. This is the principal route of benzene exposure in homes (Mallach et al., 2017).
Study purpose
Our goals were to 1) identify and measure exposures inside the homes of individuals with CI, 2) provide guidance for reducing their exposures, and 3) determine whether our intervention – environmental house calls (EHCs) – could help reduce both reported symptoms and measured levels of indoor air contaminants.
The following 3 case studies, a subset of the 37 cases described in aggregate in Perales et al. (2022), demonstrate how the BREESI and QEESI, the Symptom Star, along with our educational materials available at www.TILTresearch.org might help clinicians and the public gain a better understanding of the critical importance of indoor environmental exposures in human health and well-being.
Materials and methods
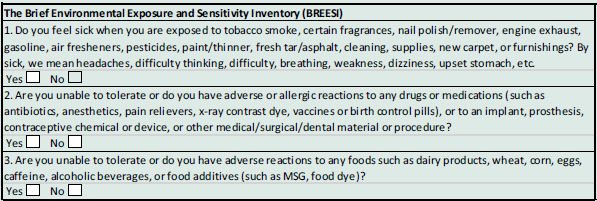
We recruited CI patients from a university-based family medicine clinic. The study was approved by the University of Texas Health Science Center IRB, protocol #HSC20150821H. The BREESI (Palmer et al., 2020) was used as a screener for CI and then the QEESI questionnaire for confirming CI status. The BREESI provides 91% sensitivity and 93% specificity in identifying CI individuals when used in combination with the QEESI (Palmer et al., 2021, 2022; Miller and Prihoda, 1999a,b). Answering ‘YES’ to one or more BREESI questions (Table 1) qualified participants to complete the 50-item QEESI (Appendix II).
Table 1.
The Brief Environmental Exposure and Sensitivity Inventory
The 50-item QEESI is an internationally validated, self-administered questionnaire designed to differentiate individuals with CI from the general population (Miller, 2001; Miller and Prihoda, 1999a,b). To date, researchers in 17 countries have used the QEESI, leading to over 100 peer-reviewed publications (Appendix I). The QEESI has four scales: Symptoms, Chemical Exposures, Other Exposures, and Impact of Sensitivities. Each scale contains 10 items rated from 0 to 10 in terms of severity, where 0 = ‘not a problem’ and 10 = ‘severe or disabling problem’. Scale totals range from 0 to 100. There is also a 10-item Masking Index which gauges ongoing exposures (such as caffeine, alcohol, tobacco use, and drugs) that can affect individuals’ awareness of their intolerances as well as the intensity of their responses to environmental exposures (Miller and Prihoda, 1999a,b). There are three classifications for CI, based on the QEESI Chemical Exposures and Symptoms scales. Scores ≥40 on both scales are very suggestive of CI. Scores from 20 to 39 on one or both scales are suggestive of CI. Scores <20 on both scales are not suggestive of CI (Miller and Prihoda, 1999a,b). To qualify for this study, participants had to have scores ≥40 on both the Symptoms Scale and the Chemical Exposures Scale.
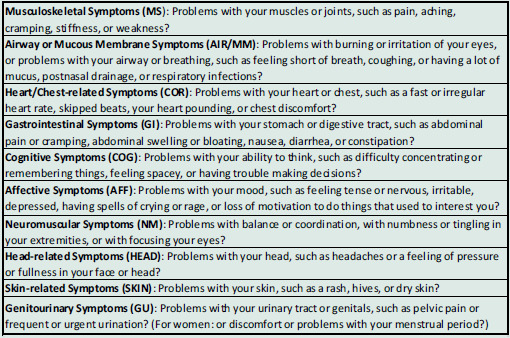
The Symptoms Scale rates 10 symptoms on a 10-point Likert-type scale (0 = not at all a problem, 5 = moderate symptoms, and 10 = disabling symptoms). The 10 symptoms evaluated on this scale are depicted in Table 2. In order to evaluate symptom changes, participants completed the Symptoms Scale at baseline prior to the EHC, and at a follow-up visit 8–12 months later (Perales et al. 2022).
Table 2.
QEESI Symptoms Scale items scored on a 10-point Likert-type scale (0 = not at all a problem, 5 = moderate symptoms, 10 = disabling symptoms)
We screened a total of 745 outpatients using the BREESI – 424 completed the QEESI. Forty-three met the EHC study qualifications which were QEESI scores ≥40 on both the Chemical Intolerance and Symptom Severity Scales and a willingness to participate in the five EHC visits over the course of one year. These 43 received the first house call. Six were lost to follow-up. Thirty-seven completed the entire EHC study. Of these 37 patients, 3 cases were selected for this report based on their notable improvement. Overall, the majority reported symptom improvement (Perales et al. 2022).
Environmental sampling and analysis
For this study, we used the IAQ Home Survey™ Reveal from PRISM Analytical Technologies (Prism Analytical, 2022). Airborne VOCs were collected using the custom multi-sorbent Tenax GR™, which contains graphitized carbon designed to capture a wide range of VOCs at a flow rate of 0.2 L/min for 2 hours for a total volume of 24 L. Samples were desorbed using a Markes Ultra X/Unity 2 into a Thermo Trace GC Ultra gas chromatograph followed by a Trace DSQ II or ISQ mass spectrometer detector. The lab reports included a Contamination Index™, which identifies air-contaminating sources in the homes. Each Contamination Index™ category shows the approximate contribution of that category to total VOCs (TVOCs), indicating how the home compares to thousands of other homes, and provides some suggestions as to where these products and materials might be found. The Contamination Index™ is divided into three sections: 1) Building-Related Sources, 2) Mixed Building and Lifestyle Sources, and 3) Lifestyle Sources. Building-Related Sources are typically part of the structure of the home and may be more difficult to correct in the short term. Mixed Building and Lifestyle Sources could belong to either or both categories, and further investigation is often necessary to determine which sources are more likely. Lifestyle Sources are those that occupants bring into the home and may be more readily identified and remediated. Levels indicated as ‘Elevated’, ‘High’, or ‘Severe’ are to be immediately addressed, and those listed as ‘Moderate’ may be improved over time. An example of a PRISM report appears in Appendix III.
Mould: Air samples for mould spores and particles were collected at three locations inside the home and outdoors as a control. Samples were collected with Buck cassettes for 10 minutes each at a calibrated flow rate of 15 minutes for a total sample volume of 150 L. Analysis was performed by EMSL Analytical, Inc. and documented in their Spore Trap Assessment Report™ and Air-O-Cell™ Analysis of Fungal Spores & Particulates. Mould was also assessed using the Environmental Relative Moldiness Index (ERMI) method. A minimum of 1.5 tablespoons of dust were collected in a cartridge by vacuuming carpet in the middle of a slightly used room (if no carpet was present, then fabrics on furniture, drapes, or bedding, and/or baseboards were sampled). This dust sample was analysed using Mold-Specific Quantitative Polymerase Chain Reaction per the ERMI specification and reported as an ERMI number/quartile. Finally, total mold volatile organic compounds were collected with one air sample taken in a central location at a calibrated flow rate of 200 mL/min (±5 mL/min) over a 2-hour period for a total volume of 24 L.
Blood from each participant was collected and analysed for specific antibodies using the Immuno-CAP IgE test from Quest Diagnostics. We screened for 16 antibodies against common indoor, outdoor, and food antigens: ragweed, mountain cedar, oak, cat dander, dog dander, mouse urine protein, Penicillium notatum, Cladosporium herbarum, Aspergillus fumigatus, Alternaria alternata, Dermatophagoides pteronyssinus, Dermatophagoides farinae, cockroach, egg white, cow’s milk, and wheat.
Summary of EHCs
A team led by a certified indoor environmental consultant (CIEC) conducted a total of 185 EHCs, 5 per home for the 37 participants whose QEESI scores confirmed CI. We visually assessed sources of common indoor air contaminants and measured levels of air and dust during Visit #2 (pre-EHC intervention) and Visit #4 (post-EHC intervention). The five visits to each home took place over a one-year period (Appendix IV. EHC Visits Schedule).
Visit #1: (1 hour) Participants completed a consent form and a pre-EHC questionnaire which included demographics and medical and exposure histories. Next, our team performed a detailed walkthrough assessment. A home evaluation checklist developed for this study was used to document the ages, sizes, and physical conditions of homes (carpet, construction, furniture, and major outgassing sources), as well as household products used for cleaning and the presence of pets and pests. We photographed pre-intervention conditions including personal care products, cleaning and laundry products, and other potential sources of exposure in the home. No coaching was provided during this visit. The Home Walk-Through Assessment we used is available in Appendix V.
Visit #2: (2 hours) During this visit, blood antibody testing and initial indoor air quality (IAQ) sampling were conducted. Participants were instructed to keep windows and doors closed for at least 24 hours prior to this visit in order to minimize the variability of fresh air intake, independent of the home’s heating, ventilation, and air conditioning system, that might reduce the concentration of indoor air contaminants and thus the likelihood of identifying certain ones. VOC sampling was performed for 2 hours using a pump with a charcoal filter inside a glass tube. Samples were analysed by PRISM Analytics (PRISM Analytical, 2020), which uses proprietary algorithms to estimate VOC levels (ng/L) and link them to specific sources. During an in-home teaching session, the team discussed indoor air exposures and their potential health effects with participants and their families and provided preliminary guidance for reducing exposures. We provided all families with comprehensive, personalized training to enable them to establish a ‘clean air oasis’ in their homes (Appendix VI-A). Participants received a free ‘starter kit’ which included safer cleaning products and ‘alternative cleaning recipes’ (Appendix VI-B).
Visit #3: (1 hour) Approximately 1 month after Visit #2, a personalized action plan was presented to participants in their homes. The plan focused on exposures of concern identified by the team during their walkthrough and any air or blood testing results that were outside normal laboratory ranges. Our team provided specific guidance for improving IAQ and answered any questions. Participants were to implement their action plan over the next 6–10 months.
Visit #4: (2 hours) The QEESI was re-administered to identify any changes in symptoms. All environmental sampling and analyses from Visit #2 were repeated.
Visit #5: (1 hour) A final report that included pre-/post-environmental findings was shared with participants and their families.
Personalized action plan and counselling
For each home, we developed a written personalized action plan which was discussed during Visits #3 and #5 with the participant and his/her family in their preferred language (English/Spanish). Each action plan included:
Exposure sources identified during the initial walkthrough assessment
Photo documentation of visible environmental triggers
Summary of environmental testing and analytical data
Potential health hazards of identified sources
Specific recommendations to eliminate or reduce exposures
During the EHCs, we learned that many patients had difficulty recognizing potential VOC sources in their homes. We found that placing a hand-held VOC measuring instrument (ppbRAE 3000) close to common VOC sources triggered an audible alarm. This helped patients and their families make the connection between invisible airborne VOCs and household products.
EHCs background
Professional home environmental testing and sampling are costly. However, in this study, we attempted to determine whether significant symptom improvement can be made by 1) screening patients using the three BREESI questions; 2) administering the 50-item QEESI to confirm CI if the answer to any BREESI question is ‘yes’; and 3) evaluating patients’ homes using EHC walkthrough assessment. These tools are available at no charge at www.TILTresearch.org.
As we and others previously have shown, the QEESI works well for assessing symptom severity in patients with CI because it was developed using factor analysis of symptoms reported by individuals who became chemically intolerant following identifiable, well-characterized exposure events. The QEESI, which has a demonstrated sensitivity of 92% and specificity of 95% (Miller and Prihoda, 1999a,b), has been translated and used worldwide (Appendix II).
To the BREESI and QEESI, we added a concise seven-item Exposure History (Appendix VII). This Brief Exposure History coupled with the QEESI enables patients to document their own intolerances and exposure histories. Clinicians can then place the Brief Exposure History and QEESI in patients’ charts, saving precious clinic time and potentially obviating referrals to multiple specialists.
The QEESI Symptom Star is a powerful visual tool that facilitates communication between clinicians and patients. It is a radar-style diagram on which the QEESI 0–10 symptom severity scores are plotted. The Symptom Star allows multiple comparisons of symptom severity before, during, and after an exposure event such as remodelling/new construction, pesticide application, etc. (Miller and Prihoda 1999a,b). Clinicians can also use the Symptom Star at intake, and to follow symptom progression or improvement over time, as well as to document the effects of any intervention such as removal from exposure, source reduction, lifestyle changes, or medications.
Case presentations
Case #1
A 68-year-old female who worked as a house cleaner for 16 years reported progressively worsening symptoms, including headaches, abdominal pain and cramping, memory difficulties, fatigue, coughing spells, throat irritation, watery eyes, and joint and muscle pains when exposed to multiple scented cleaners she used at work. She also developed intolerances for combustion products including smoke from cigarettes and from cooking and grilling. She said that her exposures led to depression, irritability, and worsening headaches, cognitive, and respiratory symptoms. Ultimately, her symptoms forced her to leave her job.
Pre-EHC observations
Multiple scented cleaning and personal care products were observed throughout the home. Candles were present in the bedrooms and living room. Mothballs were found in a closet.
Intervention
A detailed action plan was developed and discussed during the third visit, which included a targeted education session designed to help reduce sources of VOCs and eliminate mothballs. During the fourth visit, a second walkthrough and follow-up air sampling were conducted. The QEESI was also re-administered in order to document any changes in symptom severity.
Post-EHC observations
During the fourth visit, researchers observed fewer scented products, no candles, and no mothballs, suggesting compliance with the action plan. The participant had begun using natural, unscented cleaning recipes (Appendix VI).
Health outcomes
The patient’s initial QEESI Chemical Intolerance score was 80 (out of 100) and Symptom Severity score was 63. As previously described, scores ≥40 on these two scales are considered ‘very suggestive’ of CI. After the home intervention, her Chemical Intolerance score decreased from 80 to 43 and her Symptoms score went from 63 to 23.
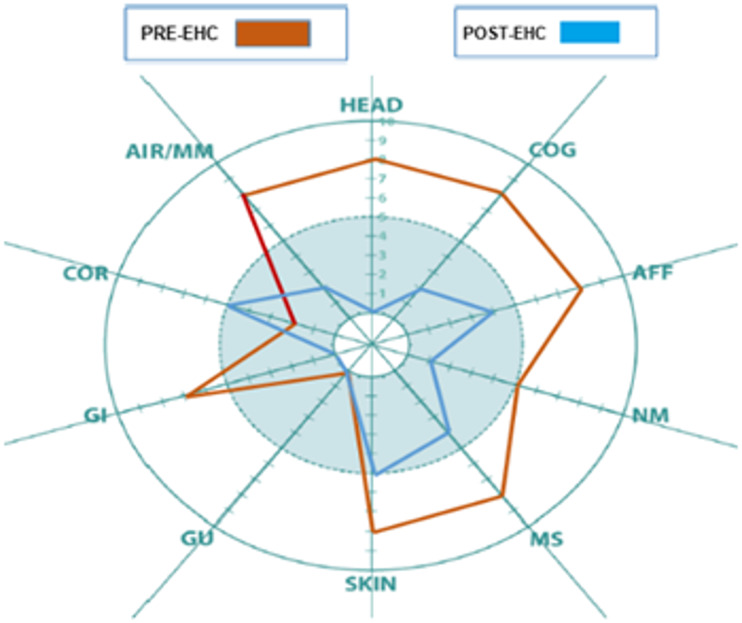
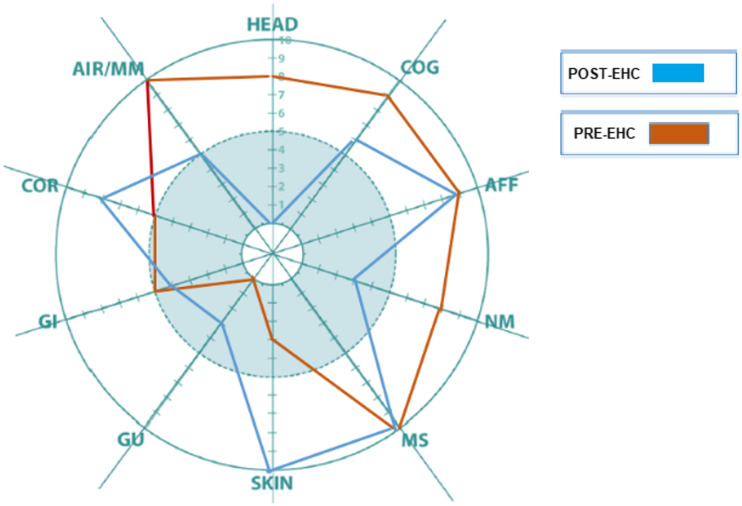
At the time of the final home visit, the patient reported significant improvement in symptoms in the following QEESI categories: head, cognitive, affective, neuromuscular, musculoskeletal, skin, gastrointestinal, and airway/mucous membrane. These improvements are reflected in her Symptom Star (Figure 2. Case #1).
Figure 2.
Case #1: QEESI Symptom Star showed significant pre- and post-intervention improvements in head-related, cognitive, affective, neuromuscular, musculoskeletal, skin, gastrointestinal, and airways/mucous membrane symptoms.
Environmental outcomes
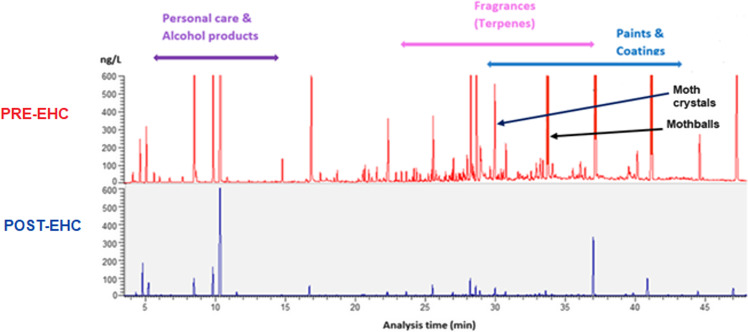
Pre-EHC air samples had shown significant VOC levels for personal care and alcohol products, fragrances (terpenes), paints and coatings, and mothballs and moth crystals. Post-EHC air sampling revealed a 52% decrease in airborne VOCs including naphthalene from mothballs and paradichlorobenzene from moth crystals (Table 3. Case #1 and Figure 3. Case #1).
Table 3.
Case #1. Indoor air sampling pre- and post-intervention shows a significant decrease in VOCs from mothballs, moth crystals, and coatings.
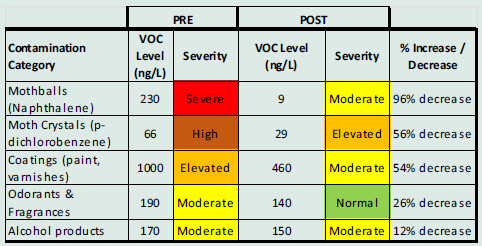
Figure 3.
Case #1: GC/MS air VOC sampling results, pre- (top) and post- (bottom) intervention. Significant VOC reductions were achieved for personal care and alcohol products, fragrances (terpenes), paints and coatings, and mothballs and moth crystals.
Blood allergy panel vs environmental allergens
Pre- and post-intervention home dust samples revealed low allergen levels for cat Fel d1 (pre- 0.12; post- 0.26 µg/g) and dog Can f1 (pre- 0.10; post- 0.03 µg/g) dander. Post-EHC dust sampling showed moderate dust mite Der f1 allergen level (8.33 µg/g), which was not identified on the pre-EHC sample. Because the patient’s blood allergen panel showed no elevated antibodies (IgE) to any of the 16 environmental antigens tested in her home, we concluded that no interventions for allergens were indicated.
Case #2
A 79-year-old male reported multisystem symptoms and CIs following repeated exposures to a rodenticide and an insecticide used for pest control in his home. In addition, the home was adjacent to an agricultural field that was aerially sprayed seasonally. Over time, he began to experience severe migraines, difficulty breathing, eye irritation, face swelling, hives, palpitations, muscle and joint pain, and cognitive difficulties. He noticed that fragrances from personal care products, household cleaners, laundry detergents, and dryer sheets triggered his symptoms. He also recalled staying in a hotel and being exposed to an unknown scented cleaner, causing his symptoms to become so severe that he was forced to sleep in his truck.
Pre-EHC observations
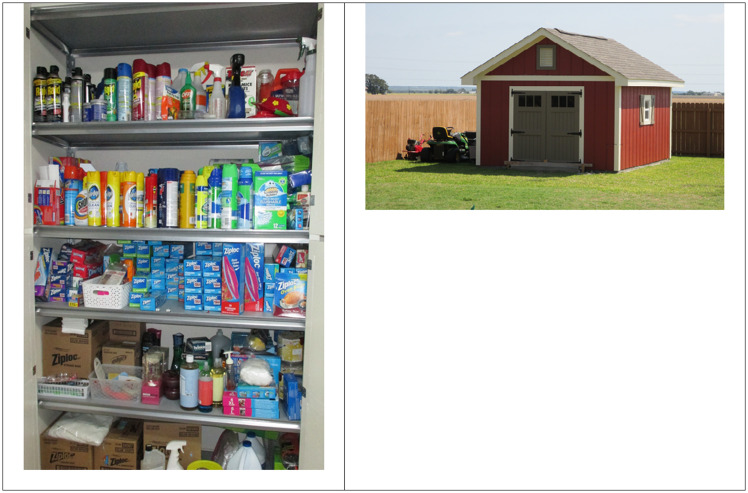
Stored inside the patient’s attached garage were hundreds of scented cleaning products, gasoline containers, solvents, and paints. Inside his house, several scented household cleaners and personal care products were observed (Figure 4. Case #2).
Figure 4.
Case #2: Multiple scented products (VOC sources) were seen during the initial EHC in the home’s attached garage. Detached storage shed built by the patient greatly reduced VOC levels in the home.
Intervention
The action plan for his home included recommendations to substitute unscented, safer cleaning, laundry, and personal care products and to isolate or eliminate all VOC sources in the garage and home. In order to reduce dust mites, the research team recommended humidity control, dust mite-resistant mattress/pillow covers, and vacuuming with a high efficiency particulate air filter when the patient was not present.
Post-EHC observations
The team returned after 9 months. In the interim, the patient had built a detached shed (Figure 4. Case #2) where most of the chemicals and scented products were stored.
Health outcomes
The patient reported improvement in head-related, cognitive, neuromuscular, and airway/mucous membrane symptoms. Despite overall improvement, his skin and cardiovascular symptoms increased when compared with his baseline QEESI (Figure 5. Case #2). The QEESI Symptom Star can help clinicians rule out other etiologies when symptoms exacerbate in the absence of specific exposures/triggers.
Figure 5.
Case #2: Patient reported significant improvement in head, cognitive, neuromuscular, and airways/mucous membrane symptoms.
Environmental outcomes
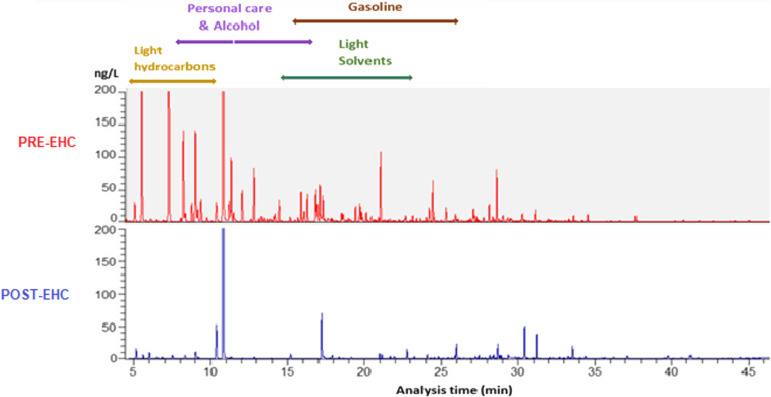
Post-EHC air testing showed a 76% reduction in TVOCs. The greatest improvements were for gasoline, light hydrocarbons and solvents, and personal care products (Table 4. Case #2 and Figure 6 Case #2).
Table 4.
Case #2. A substantial decrease in VOCs from gasoline, light hydrocarbons/solvents, and alcohol products occurred after the patient stored many products in the new storage room
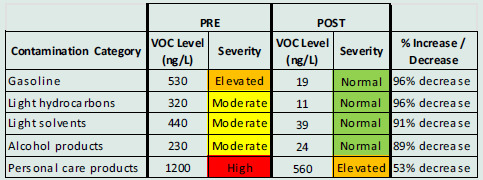
Figure 6.
Case #2: GCMS air VOC sampling results, pre- (top) and post- (bottom) intervention showed significant reductions in the following categories: personal care and alcohol products, light hydrocarbons, gasoline, and light solvents.
Blood allergy panel vs environmental allergens
A pre-EHC dust sample showed high levels of dust mite antigen Der f 1, 13.7 µg/g, which decreased to 1.67 µg/g in the post-EHC dust sample. Antibodies in the patient’s blood revealed a low level of sensitivity to all 16 antibodies, thus excluding allergies as a major cause of symptoms.
Case #3
A 50-year-old female reported feeling ill beginning in 2011 when exposed to perfumes, hair spray, cigarette smoke, scented candles, and gasoline. Her symptoms included headaches, abdominal discomfort and cramping, skin irritation, palpitations, irritability, and cognitive difficulties.
Pre-EHC observations
The walkthrough revealed scented cleaning products, mothballs, paints, solvents, and other chemicals. Lab analysis of air samples showed elevated levels of VOCs, including moth crystals (paradichlorobenzene).
Intervention
A detailed action plan was developed, and targeted training was provided. The action plan focused on eliminating/reducing VOC sources, including mothballs. The team returned after 10 months and observed fewer scented products and no mothballs. The patient had begun using unscented cleaning products and ‘recipes’ provided by the research team.
Health outcomes
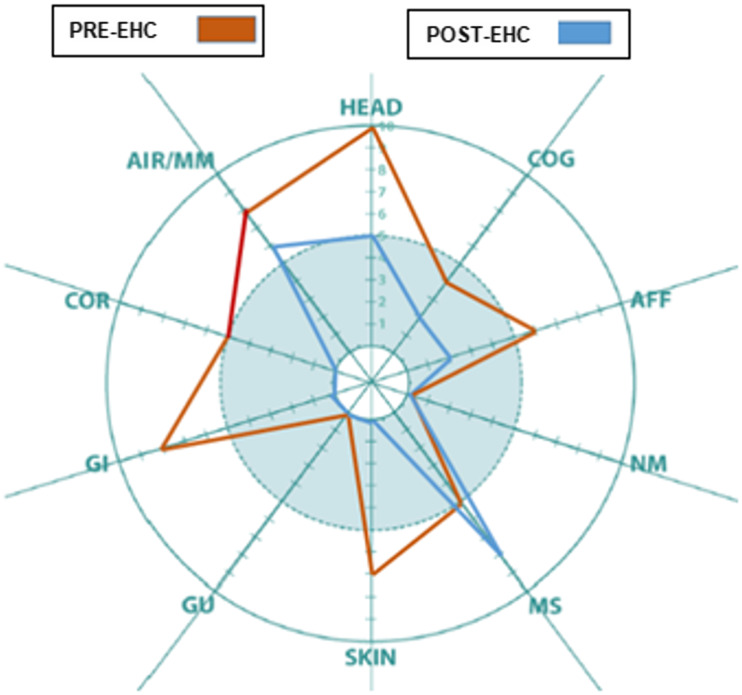
The patient’s initial QEESI scores were 74 for CI and 59 for Symptoms. After the intervention, her scores improved to 54 and 23, respectively. Her Symptom Star showed significant improvement in head-related, cognitive, affective, skin-related, and cardiovascular symptoms (Figure 7. Case #3).
Figure 7.
Case #3: Patient reported significant improvement in gastrointestinal, skin, head, cardiovascular, and affective symptoms.
Environmental outcomes
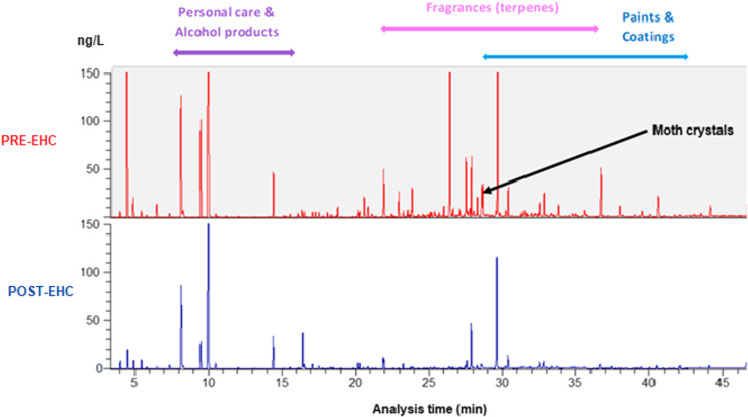
Post-EHC GCMS air analysis showed a significant reduction in VOCs (Table 5. Case #3 and Figure 8. Case #3).
Table 5.
Case #3. Lab reports showed significant reductions in VOCs from moth crystals, odorants/fragrances, and coatings
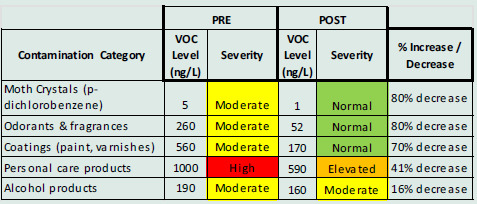
Figure 8.
Case #3: GCMS air VOC sampling results, pre- (top) and post- (bottom) intervention. A significant reduction of VOCs from personal care and alcohol products, fragrances (terpenes), paints and coatings, and moth crystals was recorded.
Blood allergy panel vs environmental allergens
Settled dust samples contained low levels of cat allergen (Fel d 1), however, the patient’s blood allergy panel showed no Fel d 1 antibodies.
Discussion
This paper is an extension of our prior published study ‘Does improving indoor air quality lessen symptoms associated with chemical intolerance?’ (Perales et al., 2022). The five VOC measurement categories identified in that paper were: TVOCs, light solvents, odorants and fragrances, personal care products, and a composite terpene variable representing the averaged indoor air concentrations of limonene, linalool, α-pinene, and β-pinene. The same study showed pre-post EHC reductions for TVOCs, odorants and fragrances, light solvents, personal care products, and terpenes, with patients stratified into three improvement groups on the Total Symptom Scale: no improvement, some improvement, and most improvement.
Although fragrances are not the sole source of indoor VOCs, based upon our research and that of many others, CI individuals frequently report fragrances as potent symptom triggers (Miller and Mitzel, 1995; Ashford and Miller, 1998; Miller and Prihoda, 1999a,b; Potera, 2011; Steinemann, 2016). Indeed, at the outset of our study, 60% of our sample reported being highly sensitive to ‘certain perfumes, air fresheners or other fragrances’ which is Item #7 on the QEESI Chemical Exposures Scale. In addition, 65% said they were highly sensitive to ‘cleaning products such as disinfectants, bleach, bathroom cleansers or floor cleaners’ (QEESI Item #6).
Wolkoff and Nielson (2017) published a comprehensive overview of four common airborne fragrances, three of which we measured in our patients’ homes: α-pinene, limonene, and linalool. Reviewing fragrance inhalation studies in humans and mice, these authors concluded that experimental evidence did not support fragrance sensitization via inhalation. They lamented that the discrepancy between the high prevalence of reported adverse effects of airborne fragrances and the lack of experimental evidence for them poses ‘a continuing challenge’.
We recruited participants to our house calls study from a primary care clinic based on their responses to the internationally validated BREESI and QEESI. None had been previously diagnosed with CI, multiple chemical sensitivity, idiopathic environmental illness, etc. To qualify, participants had to have scores greater than or equal to 40 on both the QEESI Symptoms and Chemical Exposures scales. In 2021, Miller et al. published a plausible and researchable two-stage biomechanism for TILT, originally proposed a quarter century ago (Miller 1996, 1997; Ashford and Miller 1998; Miller and Prihoda 1999a,b). The questions on the QEESI were derived from observations by US and European physicians and patients. These observations pointed to the initiation of CI by either an acute exposure such as a pesticide application or repeated lower-level exposures to toxicants such as VOCs associated with new construction/remodelling. Subsequently, symptoms were triggered by formerly tolerated, structurally unrelated VOCs, fragrances, foods, and drugs (Figure 1).
Mast cells are critical components of the immune system. They are white blood cells that originate in the bone marrow and migrate to the interface between all of our tissues and the external environment, including the airways, digestive tract, genitourinary tract, and skin. Mast cell alteration and sensitization appear to explain the two-stage TILT process: Stage I: Sensitization of mast cells following exposure to biogenic toxicants such as mould VOCs/particles or anthropogenic toxicants derived from fossil fuels; Stage II: Subsequent triggering by the same chemicals or structurally unrelated substances resulting in mast cell degranulation with the release of hundreds of mediators including histamines and other inflammatory molecules. Once sensitized, mast cells can be triggered by infinitesimally tiny exposures, even a few molecules, and initiate humoral immunity (immunoglobins) and/or cell-mediated immunity (delayed-type hypersensitivity). TILT/mast cell sensitization has the potential to explain responses to indoor air VOCs, particularly synthetic organic chemicals, fragrances, formaldehyde, plasticizers, and mould particles and VOCs (Miller et al., 2021). Examples of toxicants initiating illness indoors include Environmental Protection Agency workers and scientists who became chemically intolerant following remodelling and new carpet installation at the agency’s Waterside Mall headquarters building in Washington, DC, as well as increasingly common indoor mould exposures (Masri et al., 2021). Other instances involving TILT initiation include Gulf War Illness, casino workers exposed to pesticides, Aerotoxic Syndrome affecting airline pilots and crew, the World Trade Center tragedy, and Breast Implant Illness. In each case, a subset of those exposed developed new chemical, food, and/or drug intolerances.
Our EHC intervention clearly demonstrates symptom reduction among individuals with CI who are able to follow our recommendations. In every home, we observed scented personal care products, fragranced household cleaners, fragranced candles, and/or fragrance-emitting devices. In most homes, we also found insecticides. Based on results from our EHCs and gas chromatography/mass spectrometry (GC/MS) air testing, we provided individualized counselling for each household.
The QEESI Symptom Star offers an easily understood visual tool that can enhance patient-doctor communication. Providing healthcare that is ‘respectful and responsive to individual patient preferences, needs, and values’ and ‘ensuring that patient values guide all clinical decisions’ is one of six core domains of healthcare quality (Institute of Medicine, 2001; U.S. Department of Health and Human Services, 2018). Patients want their healthcare givers to explore and understand their feelings about their illness and express appropriate empathy (Hashim, 2017). CI is challenging for clinicians, and physically and emotionally frustrating for patients and their families. For example, patients often struggle with removing fragrances or stopping smoking/vaping in their homes (Gibson and Vogel, 2009). Since World War II, the promotion and use of fragranced personal care, cleaning, and laundry products have increased exponentially and today occupy a powerful place in American consumers’ lives. Scented products have become ubiquitous (Edmonds, 2008; Reischer and Koo, 2004; Scranton, 2001). In our study, although we saw reductions in the use of fragranced products, we learned that it is nearly impossible for most people to eliminate all fragrances from their lives. It requires sensitive and nuanced conversations to alter these practices. Some individuals literally become addicted to their fragrances and cannot fathom that fragrances are triggering symptoms in themselves or others (Miller, 2000). Asking patients to temporarily remove fragrances, paint cans, etc. can help ‘unmask’ them and facilitate awareness of their responses to other chemical inhalants. The higher a patient’s masking index on the QEESI, the less aware they are of common triggers. Fragrances along with nicotine and alcohol are powerful masking agents that can hide the relationship between symptoms and everyday, low-level exposures (see the QEESI Masking Index, Appendix II). Items on the Masking Index are as follows: smoking, drinking alcohol, consuming caffeinated beverages, routine use of perfume or hairspray, pesticide use at home or work, routine exposure to chemicals or smoke at work or in hobbies, use of gas or propane for cooking or heating, use of scented laundry products, or the routine use of drugs such as steroids, medications for anxiety/depression, or recreational drugs.
Twenty per cent of US adults meet QEESI criteria for CI (Palmer et al., 2021). The single most important public health intervention to prevent cognitive, affective, breathing, and other health concerns in this rapidly growing segment of the population would be to eliminate fragrances from schools, workplaces, public buildings, medical settings, and anywhere else air is shared, including homes where susceptible people may live, and housing for seniors and individuals with autism (Steinemann 2019b). We now know that our evolutionarily ancient mast cells, which guard every tissue in our bodies, can be sensitized and triggered by exposures to low-level indoor air VOCs such as fragrances (Miller et al., 2021). These exposures can initiate (TILT Stage I) or trigger (TILT Stage II) mast cells to release cascades of inflammatory mediators, resulting in symptoms ranging from mild to disabling. Fragrances are ubiquitous and the most prevalent, preventable, and unnecessary VOC exposure. In every one of our EHCs, we identified multiple fragrance sources.
Although many CI patients implicate mould as initiating and/or triggering their symptoms (Masri et al., 2021), our team saw no visible mould growth during the EHCs we conducted. Nor did any of the air or dust samples we took reveal elevated mould levels. Mould VOCs were all very low and did not indicate active mould growth. Nor did we observe any persistent or periodic evidence of dampness sufficient to support mould growth. Two participants had antibodies to fungi, but there were no identifiable sources in their homes.
We evaluated all 37 EHC patients for antibodies to common indoor allergens: dust mites (Der f1 and Der p1), cat (Fel d1), dog (Can f1), and cockroach (Blattella germanica/Bla g2). Only two patients (5.4%) had elevated antibodies to both dust mite (Der f1) and cockroach antigen (Bla g2). Both were provided instructions for reducing their exposures to dust mites and cockroaches. Of the 37 EHC patients, 22 (59%) had antibodies (IgE) to one or more common outdoor allergens including ragweed, mountain cedar, and oak. Two patients showed very high IgE levels of mountain cedar (28.9 and 86.5 uK/L). Mountain cedar pollen reaches extraordinarily high levels during the winter in San Antonio and Central Texas.
Patients can access our self-assessment tools at no charge – the BREESI, QEESI, and Brief Exposure History – fill them out and take them to their physicians and ask that these be placed in their medical records. Improved doctor–patient communication can increase satisfaction for all and promote adherence to recommendations (Kurtz and Silverman, 2005). Educators can develop and use case studies as presented here as teaching tools. Every patient deserves a careful evaluation for exposures at home, work, and school, which may be compromising their health. We have provided instructions for structured EHCs that every healthcare system should make available to their patient populations. Frank discussions of the opportunities and challenges involved in making necessary changes in products and practices such as eliminating fragrance use and smoking indoors are vital. Such changes can infringe on personal and familial relationships; therefore, it is important for practitioners to develop knowledge and skills in the behavioural and social sciences, training which is fundamental to good medical practice (National Academy of Medicine, formerly Institute of Medicine, 2004).
Strengths and limitations
To our knowledge, this is the first IAQ interventional study that has successfully correlated symptom improvement with a reduction in indoor air VOCs. Prior studies have not measured indoor VOCs at the parts per billion level in patients’ homes pre- and post-intervention. Uniformly, the most problematic and pervasive symptom triggers CI patients’ report involve fragrances. Our population-based survey of 10,000 US adults showed that 20% met the QEESI criteria for CI (Palmer et al., 2022). In our EHCs, every home contained measurable levels of fragrances arising from diverse sources including cosmetics and personal care products, air fresheners, cleaning and laundry products, fragrance-emitting devices, and candles. Our study is the first to demonstrate that reducing or eliminating VOC sources can reduce indoor air concentrations and improve patients’ symptoms as measured by the QEESI and depicted using the Symptom Star. Moreover, the EHCs in this study were thorough and uniform, conducted by an experienced team supervised by a physician/industrial hygienist and led by a CIEC with over 25 years of experience conducting EHCs. The same team evaluated all of the patients’ homes and counselled their families.
Systematic use of the BREESI, QEESI, Symptom Star, and our educational materials has the potential to reduce clinic and emergency room visits as well as medication use. These measures may result in significant economic gains through reduced absenteeism and increased productivity. Many CI individuals report interference with or loss of their productive work lives because of their exposures, especially fragrances (Gibson and Vogel, 2009). The use of the free educational resources available online at www.TILTresearch.org, even in the absence of sampling and laboratory analysis, potentially can lead to significant cost savings. This strategy and the piloting of virtual visits should be the subject of further study.
Although the size of the original cohort may seem small (n = 37) (Perales et al., 2022), it involved five home visits per participant over 12 months, amounting to more than 185 visits over the course of the study, providing robust pre- and post-assessments including approximately 60 pre- and 60 post-measures per home visit (60 × 2 × 37 homes = 4,440 measurements). When we embarked on this study, we were agnostic about potential contributory exposures in the homes of chemically intolerant individuals and explored any and all exposures that might shed light on this puzzling and vexing condition – a daunting undertaking. CI patients have long implicated fragrances as the most prevalent and unavoidable triggers for their symptoms. To paraphrase Sir William Osler around the turn of the 20th century, ‘Listen to your patients. They are telling you the diagnosis’.
The three cases presented here were selected from our previously reported 37 EHC participants (Perales et al., 2022) in order to illustrate the potential value of such intensive interventions. Most participants showed significant symptom improvement after the EHCs. The generalizability of our findings to other populations is yet to be determined. Although prior studies involving home visits have been conducted for asthma mitigation, most have not involved the same air sampling or used GC/MS analysis at a ng/L level or our comprehensive home-based educational intervention. It is important to note that not all individuals in the study adhered to the recommendations or followed the action plan. The team noted that the level of compliance was influenced by the degree of family support as well as the severity of an individual’s illness. Despite some non-adherence, air testing demonstrated quantitative improvement in air quality in a subset of homes, as reported here.
An important finding of this study was that we observed multiple fragrance sources in every home and a corresponding decrease in reported symptoms and measured fragrance (terpene) levels when those sources were reduced or eliminated following our EHCs. While not reported here, many other IAQ measurements were taken during the two sampling visits as part of the EHCs. One goal of our study was to identify the most efficient and informative air sampling possible in a 2-hour home visit.
An important limitation is that the air samples were so-called ‘grab samples’ and reflect exposures only at the time of testing. Continuous air monitoring, while preferable, would have been cost-prohibitive. Certain tests, such as for pesticides, were outside the scope of our study. We did, however, ask participants whether their home or workplace had been treated with pesticides during the past year. Another limitation is the fact that we could not measure or stop participants’ exposures to natural gas or its combustion products, which include both gases (nitrogen dioxide and carbon monoxide) and particulate matter that may cause or exacerbate asthma (Belanger and Triche, 2008). Natural gas and propane used for cooking and heating are common sources of these combustion products. Emissions from stoves can vary considerably depending on stove type, ventilation, and household practices. Older stoves with continuously burning pilot lights produce significantly more nitrogen dioxide and particulate matter than stoves with electronic ignition.
Innumerable influences and interactions, both known and unknown, involving temperature, humidity, gases, particles, and biologicals can affect the health of people in any building (ASHRAE Guideline 10-2016). Clearly, it would have been impossible to consider every potential variable, so we focused our inquiry on VOCs, as they are so often implicated by individuals with CI. Fielding an IAQ team and conducting intensive air sampling and counselling are costly. Our estimated cost per home was approximately $4,500, but health benefits may be substantial. Based on what we have learned from this study, we plan to streamline the EHCs to make them more cost-effective, for example, by conducting ‘virtual’ house calls.
Future considerations
Our approach may benefit other patients with MUS, which now affect one-quarter to one-half of primary care patients (Edwards et al., 2010). Our study has established an approach for helping the growing numbers of people suffering from CI. We are implementing EHCs at UT Health San Antonio and teaching medical personnel how to conduct EHCs and evaluate patients for CI. We look forward to further refinements. Because of COVID, we are developing virtual EHCs which we hope will offer the same improved health outcomes for patients as in-person visits. The time has come to translate these research findings into clinical practice. This will require technical support from a trained team to evaluate patients’ exposures and teach them how to reduce or eliminate potential environmental triggers. We are actively translating this research into clinical practice and we strongly encourage other institutions to do the same.
It is of utmost importance that public policies eliminate fragrances from multifamily housing, public spaces, and healthcare environments – anywhere air is shared. In addition, natural gas appliances and fireplaces burning carbonaceous materials such as wood or coal should be phased out, as is being done in California because of climate concerns. Fourteen of our 37 EHC homes had gas stoves, which have been linked to both asthma and CI (Randolph, 1970).
Supporting information
Rincón et al. supplementary material
Acknowledgements
We thank Marilyn Brachman Hoffman and the Foundation she established for funding our EHC study following her generous bequest prioritizing research on TILT. We also wish to acknowledge Ernie Hood for his editorial assistance and Dr. Alice Delia, Enthalpy Laboratory Director, for her help analysing and interpreting the home air samples. We especially thank all the patients and families who participated in our yearlong study, granted access to their homes, and actively participated in all phases.
Supplementary material
To view supplementary material for this article, please visit https://doi.org/10.1017/S146342362400046X
Author contributions
Conceptualization: Claudia S. Miller, Roger B. Perales, Carlos R. Jaén.
Data curation: Roger B. Perales, Rodolfo Rincon, Jackie V. Forster, Jessica F. Hernandez.
Formal analysis: Claudia S. Miller, Roger B. Perales, Raymond Palmer, Carl Grimes, Bryan Bayles.
Methodology: Claudia S. Miller, Roger B. Perales.
Project administration: Rodolfo Rincon, Jackie V. Forster, Jessica F. Hernandez.
Supervision: Claudia S. Miller, Raymond Palmer, Roger B. Perales.
Validation: Claudia S. Miller, Carl Grimes, Roger B. Perales.
Roles/Writing – original draft: Writing – review & editing: Rodolfo Rincon, Roger B. Perales, Raymond Palmer, Bryan Bayles, Carl Grimes, Claudia S. Miller.
Competing interests
The authors declare no financial interest or any conflict of interest related to this work.
References
- Ashford N and Miller CS (1998) Chemical Exposures: Low Levels and High Stakes, 2nd Edn. New York: Wiley. [Google Scholar]
- ASHRAE Guideline 10-2016 (Supersedes ASHRAE Guideline 10-2011) Includes ASHRAE addenda listed in Annex A, Interactions Affecting the Achievement of Acceptable Indoor Environments. chrome-extension://efaidnbmnnnibpcajpcglclefindmkaj/https://upgreengrade.ir/admin_panel/assets/images/books/25223276727.pdf (accessed 12/21/2022)
- Azuma K, Uchiyama I, Katoh T, Ogata H, Arashidani K and Kunugita N (2015) Prevalence and characteristics of chemical intolerance: a Japanese population-based study. Archives of Environmental & Occupational Health 70, 341–353. [DOI] [PubMed] [Google Scholar]
- Belanger K and Triche EW (2008) Indoor combustion and asthma. Immunology and Allergy Clinics of North America 28, 507–519. [DOI] [PMC free article] [PubMed] [Google Scholar]
- Caress SM and Steinemann AC (2004) A national population study of the prevalence of multiple chemical sensitivity. Archives of Environmental & Occupational Health 59, 300–305. [DOI] [PubMed] [Google Scholar]
- Edmonds A (2008) Beauty and health: anthropological perspectives. Medische Antropologie 20, 151–162. [Google Scholar]
- Edwards TM, Stern A, Clarke DD, Ivbijaro G and Kasney LM (2010) The treatment of patients with medically unexplained symptoms in primary care: a review of the literature. Mental Health in Family Medicine 7, 209–221. [PMC free article] [PubMed] [Google Scholar]
- Fanger P (2006) What is IAQ? Indoor Air 16, 328–334. [DOI] [PubMed] [Google Scholar]
- Gibson PR and Vogel VM (2009) Sickness-related dysfunction in persons with self-reported multiple chemical sensitivity at four levels of severity. Journal of Clinical Nursing 18, 72–81. [DOI] [PubMed] [Google Scholar]
- Hashim MJ (2017) Patient-centered communication: basic skills. American Family Physician 95, 29–34. [PubMed] [Google Scholar]
- Hojo S, Mizukoshi A, Azuma K, Okumura J, Ishikawa S, Miyata M, Mizuki M, Ogura H and Sakabe K (2018) Survey on changes in subjective symptoms, onset/trigger factors, allergic diseases, and chemical exposures in the past decade of Japanese patients with multiple chemical sensitivity. . International Journal of Environmental Research and Public Health 221, 1085–1096. [DOI] [PubMed] [Google Scholar]
- Hudnell HK, Otto DA, House DE and Mølhave L (1992) Exposure of humans to a volatile organic mixture. II. Sensory. Archives of Environmental Health: An International Journal 47, 31–38. [DOI] [PubMed] [Google Scholar]
- Institute of Medicine (US) (2001) Committee on Quality of Health Care in America. Crossing the Quality Chasm: A New Health System for the 21st Century. Washington (DC): National Academies Press (US). [Google Scholar]
- Institute of Medicine (US) (2004) Committee on Behavioral and Social Sciences in Medical School Curricula. In Cuff PA and Vanselow NA (eds), Improving Medical Education: Enhancing the Behavioral and Social Science Content of Medical School Curricula. Washington (DC): National Academies Press (US). [PubMed] [Google Scholar]
- Katerndahl DA, Bell IR, Palmer RF and Miller CS (2012) Chemical intolerance in primary care settings: prevalence, comorbidity, and outcomes. Annals of Family Medicine 10, 357–365. [DOI] [PMC free article] [PubMed] [Google Scholar]
- Kjærgaard SK, Mølhave L and Pedersen OF (1991) Human reactions to a mixture of indoor air volatile organic compounds. Atmospheric Environment. Part A. General Topics 25, 1417–1426. [Google Scholar]
- Klepeis NE, Nelson WC, Ott WR, Robinson JP, Tsang AM, Switzer P, Behar JV, Hern SC and Engelmann WH (2001) The National Human Activity Pattern Survey (NHAPS): a resource for assessing exposure to environmental pollutants. Journal of Exposure Science and Environmental Epidemiology 11, 231–252. [DOI] [PubMed] [Google Scholar]
- Kurtz S and Silverman J (2005) Teaching and Learning Communication Skills in Medicine, 2nd Edn. Oxford: Radcliffe Medical Press. [Google Scholar]
- Leech JA, Nelson WC, Burnett RT, Aaron S and Raizenne ME (2002) It’s about time: a comparison of Canadian and American time-activity patterns. Journal of Exposure Science and Environmental Epidemiology 12, 427–432. [DOI] [PubMed] [Google Scholar]
- Loftness V, Hakkinen B, Adan O and Nevalainen A (2007) Elements that contribute to healthy building design. Environmental Health Perspectives 115, 965–970. [DOI] [PMC free article] [PubMed] [Google Scholar]
- Mallach G, St-Jean M, MacNeill M, Aubin D, Wallace L, Shin T, Van Ryswyk K, Kulka R, You H, Fugler D, Lavigne E and Wheeler AJ (2017) Exhaust ventilation in attached garages improves residential indoor air quality. Indoor Air 27, 487–499. [DOI] [PubMed] [Google Scholar]
- Mallach G, St-Jean M, MacNeill M, Aubin D, Wallace L, Shin T, Van Ryswyk K, Kulka R, You H, Fugler D, Lavigne E and Wheeler AJ (2017) Exhaust ventilation in attached garages improves residential indoor air quality. Indoor Air 27, 487–499. [DOI] [PubMed] [Google Scholar]
- Masri S, Miller C.S., Palmer R and Ashford N (2021) Toxicant-induced loss of tolerance for chemicals, foods, and drugs: assessing patterns of exposure behind a global phenomenon. Environmental Sciences Europe Open Access. Available at 10.1186/s12302-021-00504-z [DOI]
- Miller C, Ashford N, Doty R, Lamielle M, Otto D, Rahill A and Wallace L (1997) Empirical approaches for the investigation of toxicant-induced loss of tolerance. Environmental Health Perspectives 105, 515–519. [DOI] [PMC free article] [PubMed] [Google Scholar]
- Miller CS (1996) Chemical sensitivity: symptom, syndrome or mechanism for disease? Toxicology 111, 69–86. [DOI] [PubMed] [Google Scholar]
- Miller CS (1997) Toxicant-induced loss of tolerance--an emerging theory of disease? Environmental Health Perspectives 105, 445–453. [DOI] [PMC free article] [PubMed] [Google Scholar]
- Miller CS (1999) Are we on the threshold of a new theory of disease? Toxicant-induced loss of tolerance and its relationship to addiction and abdiction. Toxicology & Industrial Health 15, 284–294. [DOI] [PubMed] [Google Scholar]
- Miller CS (2000) Mechanisms of action of addictive stimuli, toxicant-induced loss of tolerance. Addiction 96(1), 115–139. [DOI] [PubMed] [Google Scholar]
- Miller CS (2001) The compelling anomaly of chemical intolerance. Annals of the New York Academy of Sciences 933, 1–23. [DOI] [PubMed] [Google Scholar]
- Miller CS and Mitzel HC (1995) Chemical sensitivity attributed to pesticide exposure versus remodeling. Archives of Environmental Health 50, 119–129. [DOI] [PubMed] [Google Scholar]
- Miller CS, Palmer RF, Dempsey TT, Ashford NA and Afrin LB (2021) Mast cell activation may explain many cases of chemical intolerance. Environmental Sciences Europe 33, 1–5. [Google Scholar]
- Miller CS and Prihoda TJ (1999. a) The Environmental Exposure and Sensitivity Inventory (EESI): a standardized approach for measuring chemical intolerances for research and clinical applications. Toxicology & Industrial Health 15, 370–385. [DOI] [PubMed] [Google Scholar]
- Miller CS and Prihoda TJ (1999. b) A controlled comparison of symptoms and chemical intolerances reported by Gulf War veterans, implant recipients and persons with multiple chemical sensitivity. Toxicology & Industrial Health 15, 386–397. [DOI] [PubMed] [Google Scholar]
- Mølhave L, Bach B and Pedersen OF (1986) Human reactions to low concentrations of volatile organic compounds. Environment International 12, 167–75. [Google Scholar]
- Norbäck D and Wang J (2021) Household air pollution and adult respiratory health. European Respiratory Journal 57, 2003520. [DOI] [PubMed] [Google Scholar]
- Palmer RF, Jaén CR, Perales RB, Rincon R, Forster JN and Miller CS (2020) Three questions for identifying chemically intolerant individuals in clinical and epidemiological populations: the Brief Environmental Exposure and Sensitivity Inventory (BREESI). PLoS One 15, e0238296. [DOI] [PMC free article] [PubMed] [Google Scholar]
- Palmer RF, Rincon R, Perales RB, Walker TT, Jaén CR and Miller CS (2022) The Brief Environmental Exposure and Sensitivity Inventory (BREESI): an international validation study. Environmental Sciences Europe 34, 32. [Google Scholar]
- Palmer RF, Walker T, Kattari D, Rincon R, Perales RB, Jaén CR, Grimes C, Sundblad DR and Miller CS (2021) Validation of a brief screening instrument for chemical intolerance in a large U.S. national sample. International Journal of Environmental Research and Public Health 18, 8714. [DOI] [PMC free article] [PubMed] [Google Scholar]
- Palmer RF, Walker T, Perales RB, Rincon R, Jaén CR and Miller CS (2021) Disease comorbidities associated with chemical intolerance. Environmental Disease 6:134. [Google Scholar]
- Perales RB, Palmer RF, Rincon R, Viramontes JN, Walker T, Jaén CR and Miller CS (2022) Does improving indoor air quality lessen symptoms associated with chemical intolerance? Primary Health Care Research & Development 23, e3. [DOI] [PMC free article] [PubMed] [Google Scholar]
- Potera C (2011) Scented products emit a bouquet of VOCs. Environmental Health Perspectives 119, A16. [DOI] [PMC free article] [PubMed] [Google Scholar]
- PRISM Analytical (2020) Air quality experts. Solution-driven chemical analysis. Retrieved 6 January 2022 from https://www.pati-air.com (accessed 12/21/22)
- Randolph TG (1970) Domiciliary Chemical Air Pollution in the Etiology of Ecologic Mental Illness. International Journal of Social Psychiatry. 10.1177/002076407001600401 [DOI]
- Reischer E and Koo KS (2004) The body beautiful: symbolism and agency in the social world. Annual Review of Anthropology 33, 297–317. [Google Scholar]
- Scranton P (Ed.) (2001) Beauty and Business: Commerce, Gender, and Culture in Modern America. New York. Routledge: Psychology Press. [Google Scholar]
- Spengler JD and Sexton K. (1983. ) Indoor air pollution: a public health perspective. Science 221, 9–17. [DOI] [PubMed] [Google Scholar]
- Steinemann A (2016) Fragranced consumer products: exposures and effects from emissions. Air Quality, Atmosphere & Health 9, 861–866. [DOI] [PMC free article] [PubMed] [Google Scholar]
- Steinemann A (2018. a) National prevalence and effects of multiple chemical sensitivities. Journal of Occupational and Environmental Medicine 60, e152–e156. [DOI] [PMC free article] [PubMed] [Google Scholar]
- Steinemann A (2018. b) Fragranced consumer products: effects on autistic adults in the United States, Australia, and United Kingdom. Air Quality, Atmosphere & Health 11, 1137–1142. [DOI] [PMC free article] [PubMed] [Google Scholar]
- Steinemann A (2019. a) Chemical sensitivity, asthma, and effects from fragranced consumer products: national population study in Sweden. Air Quality, Atmosphere & Health 12, 129–36. [Google Scholar]
- Steinemann A (2019. b) International prevalence of chemical sensitivity, co-prevalences with asthma and autism, and effects from fragranced consumer products. Air Quality, Atmosphere & Health 12, 519–27. [Google Scholar]
- U.S. Department of Health and Human Services (2018) Six Domains of Health Care Quality. Content last reviewed November 2018. Agency for Healthcare Research and Quality, Rockville, MD. https://www.ahrq.gov/talkingquality/measures/six-domains.html (accessed 12/21/2022)
- U.S. Environmental Protection Agency (2014) Why does indoor air quality matter? Consumer Brochure. Aug 2014; consumer_brochure.pdf (epa.gov) Accessed November 2, 2021.
- US Consumer Product Safety Commission (2020) Indoor air pollution: introduction for health professionals. Retrieved 6 January 2022 from https://www.cpsc.gov/safety-education/safety-guides/home/indoor-air-pollution-introduction-health-professionals
- Vardoulakis S, Giagloglou E, Steinle S, Davis A, Sleeuwenhoek A, Galea KS, Dixon K and Crawford JO (2020) Indoor exposure to selected air pollutants in the home environment: a systematic review. International Journal of Environmental Research and Public Health 17, 8972. [DOI] [PMC free article] [PubMed] [Google Scholar]
- Wolkoff P and Nielsen GD (2017) Effects by inhalation of abundant fragrances in indoor air – An overview. Environment International 101, 96–107. [DOI] [PubMed] [Google Scholar]
Associated Data
This section collects any data citations, data availability statements, or supplementary materials included in this article.
Supplementary Materials
Rincón et al. supplementary material


