

Abstract
In this analysis, the association of baseline glycated hemoglobin (HbA1c) levels with all-cause mortality in cardiovascular disease (CVD) patients with diabetes was investigated using data from NHANES 1999–2014. Under examination were 845 CVD patients who had diabetes and were followed for a median follow-up of 7.3 years, and an all-cause mortality rate of 22.60% was observed. To examine the association between HbA1c and mortality, multivariable Cox proportional hazard models using spline models determined the non-linear association. HbA1c as a continuous variable was not associated with mortality. However, a significant association was observed when HbA1c was classified according to quartiles. Particularly, after adjustment for potential confounders, in comparison to participants with HbA1c levels below 6.2%, patients with HbA1c levels of 6.2–6.8% and 6.9–7.6% had lower risks of all-cause mortality (hazard ratio: 0.49, 95% CI: 0.30–0.80 and hazard ratio: 0.64, 95% CI: 0.39–1.03, respectively). Using restricted cubic splines, further testing confirmed the lack of a linear association and instead suggested a U-shaped relationship between HbA1c and mortality, with an optimal HbA1c target value of 6.9%. A 1-unit increase in HbA1c with HbA1c less than or equal to 6.9% was predictive of a 55% reduction in all-cause mortality compared to HbA1c levels above 6.9%, which exhibited an elevation in risk. All told, these data suggest that the relationship between HbA1c and all-cause mortality in CVD patients with diabetes is non-linear and U-shaped, and therefore may suggest that individualization of glycemic control may be beneficial for this patient population.
Supplementary Information
The online version contains supplementary material available at 10.1038/s41598-024-80116-8.
Subject terms: Biochemistry, Biomarkers, Cardiology, Diseases, Endocrinology, Risk factors
Diabetes mellitus (DM) is a burgeoning global health issue, with an adult prevalence of 8.8% in 2017, projected to rise to 9.9% by 2045 1. Individuals with diabetes face a significantly higher risk of cardiovascular disease (CVD) compared to those without diabetes2, and approximately 25% of patients with type 2 diabetes are also diagnosed with CVD3. Given the high mortality rate associated with cardiovascular disease, which remains one of the leading causes of death worldwide4–6, it is essential to understand the relationship between diabetes and CVD to inform prevention and management strategies.
Hemoglobin A1c (HbA1c) is the most widely used marker for monitoring blood glucose control in patients with diabetes. It reflects average blood glucose levels over the past 2–3 months and is a key biomarker in diabetes management. Beyond its role in managing diabetes, HbA1c is associated with various outcomes in diabetic patients, including cognitive decline7 and cancer8. Numerous studies have investigated the relationship between HbA1c and cardiovascular events9,10, highlighting its potential as a predictor for cardiovascular risk. The United Kingdom Prospective Diabetes Study (UKPDS) emphasized the importance of intensive glycemic control in reducing microvascular complications11, while recent research has shown that both very low and very high HbA1c levels are associated with increased all-cause mortality12. Although CVD is the most common comorbidity in diabetic patients13, the relationship between HbA1c levels and all-cause mortality in patients with both diabetes and CVD remains unclear. Some studies14,15 suggest a nonlinear association between HbA1c and mortality, with both extremes of HbA1c linked to higher risks.
We hypothesize that there is a nonlinear relationship between HbA1c levels and all-cause mortality in patients with both diabetes and CVD, with an optimal HbA1c target value that minimizes mortality risk. This retrospective cohort study aims to evaluate this relationship and contribute to the personalized management of glycemic control in this patient population.
Materials and methods
Participants
Participants for this study were selected from the 1999–2014 National Health and Nutrition Examination Survey (NHANES), a continuous, multistage probability sample, cross-sectional survey designed to assess the health and well-being of the civilian, non-institutionalized population in the United States16. Mortality data were obtained from the Centers for Disease Control and Prevention’s National Death Index (NDI) database, covering the period from enrollment through December 31, 2015. Participants were followed from the time of the NHANES physical examination until December 31, 2015 or at the time of death. The National Center for Health Statistics Research Ethics Review Board approved all the NHANES protocols. Informed consent was obtained from all the participants before they participated in the NHANES examination, and this research was conducted according to relevant guidelines/regulations. The detailed data collection information is published and available at https://www.cdc.gov/nchs/nhanes. Diabetes mellitus was defined as a self-reported diagnosis with fasting blood glucose (FBG) ≥ 126 mg/dL or HbA1c level ≥ 6.5%, with insulin or oral hypoglycemic medications, according to the American Diabetes Association (ADA) diagnostic criteria. The diagnosis of cardiovascular disease (CVD) was determined by a self-reported physician diagnosis obtained during a personal interview using a standardized medical status questionnaire. Participants were asked whether a medical professional had ever informed them that they had congestive heart failure (CHF), coronary heart disease, angina, myocardial infarction, or stroke. Those who responded affirmatively to any of these conditions were deemed to have CVD.
A total of 1,684 adults (aged 20 to 85 years) with cardiovascular disease (CVD) and diabetes mellitus were included in the investigation. After excluding participants with missing HbA1c data (n = 344) or missing all-cause mortality data (n = 495) at follow up, the study comprised 845 participants (Fig. 1).
Fig. 1.
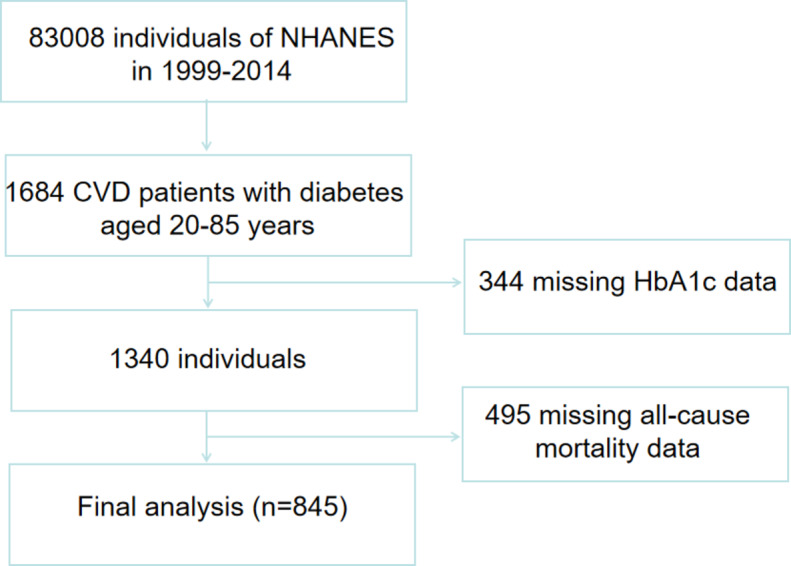
Flow chart of study participants.
Clinical and experimental data
The NHANES Household Interviews collected a variety of demographic and health-related factors, including, but not limited to, age, sex, race/ethnicity, education level, household income, smoking status, disease status, and substance use. Smoking status was categorized as never smoked (defined as less than 100 cigarettes in a lifetime) or smoked (defined as more than 100 cigarettes in a lifetime). Alcohol consumption was categorized as never drinking (fewer than 12 alcoholic beverages of any type in a year) or drinking (more than 12 alcoholic beverages of any type in a year). The household income to poverty ratio (PIR) was categorized as low (PIR < 1), medium (PIR ≥ 1 and < 3) and high (PIR ≥ 3). The calculation of Body Mass Index (BMI) utilized weight in kilograms divided by height in meters squared and was categorized as normal (BMI < 25 kg/m²) or overweight/obese (BMI ≥ 25 kg/m²). The estimated glomerular filtration rate (eGFR) was calculated using the CKD-EPI equation17. HbAlc was assayed on a Primus CLC330 GHb analyzer (Primus, Kansas City, MO), which employs a high-performance liquid chromatography (HPLC) method for rapid separation of glycosylated and non-glycosylated hemoglobins using a short borate affinity resin column. Complete blood count, biochemical indices, lipids, and more were measured at NHANES. Clinical information was derived from participants’ self-reported personal interview data and included a history of heart failure, coronary heart disease, angina pectoris, myocardial infarction, stroke, hypertension, emphysema, liver disease, cancer, and high cholesterol.
Statistical analysis
Statistical analysis involved the use of R software (version 4.0.2; https://www.r-project.org). Continuous variables were presented as either mean (standard deviation) or median (interquartile), while categorical variables were expressed as frequency (percentage). To assess the normality of the variables, the Kolmogorov-Smirnov test was used. For normally distributed variables, t-tests or F-tests were used to compare different groups. Non-normally distributed variables were compared by the Mann-Whitney U test or Kruskal-Wallis H test. Kruskal-Wallis H test was used for comparisons among groups in count data, while chi-square tests or Fisher’s exact tests were applied. Multiple estimation was performed for covariates with missing values. HbA1c was categorized into four quartiles (Q1, Q2, Q3, Q4), with the first quartile (Q1) designated as the reference quartile. To assess the association between HbA1c and all-cause mortality, we performed multivariate Cox proportional hazards regression modeling. To screen out confounding variables in the association between CVD patients with diabetes mellitus and HbA1c and to eliminate covariance between different variables, we used a least absolute shrinkage and selection operator (LASSO) regression model. We also applied a restricted cubic spline curve (RCS) regression of the nonlinear relationship between HbA1c and all-cause mortality, which was divided into 3 parts (10th, 50th, and 90th percentiles). If the relationship was nonlinear, we estimated the critical value by trying all possible values and selecting the most probable tipping point. Then we used two-piece Cox proportional risk models on either side of the inflection point to examine the relationship between HbA1c and the risk of all-cause mortality. P values less than 0.05 were considered significant for all analyses.
Results
Baseline characteristics of participants
The average age of the participants was 68.70 ± 10.63 years, and 57.2% were male. The median follow-up period was 7.3 years (range 1-201 months). As of December 31, 2015, 191 participants (22.60%) had passed away. When compared to the survivors, those who had passed away tended to be older, higher levels of total protein (TP), alkaline phosphatase (ALP), blood urea nitrogen (BUN), triglycerides (TG), total cholesterol (TC), and lactate dehydrogenase (LDH), and were less likely to have high levels of education, be married, have a higher family income to poverty ratio (PIR), body mass index (BMI), waist circumference, alanine aminotransferase (ALT), aspartate aminotransferase (AST), total bilirubin (TBIL), and be diagnosed with emphysema (Table 1). Table 2 summarizes the baseline features of the participants in each HbA1c subgroup. Compared to the participants in the lowest quartile HbA1c group, those in the highest quartile had a higher body mass index (BMI), waist circumference, white blood cell count (WBC), red blood cell count (RBC), total protein (TP), alkaline phosphatase (ALP), gamma-glutamyl transferase (GGT), fasting glucose (GLU), triglycerides (TG), total cholesterol (TC), and were less likely to be older, have a high level of education, have a higher creatinine (CREA), a liver disease diagnosis, or a cancer diagnosis.
Table 1.
Baseline characteristics of participants who were still alive vs. those who were deceased by December 31, 2015. Abbreviations: PIR, ratio of family income to poverty; WBC, white blood cell count; RBC, red blood cell count.
| Variable | Still alive, N = 654 | Deceased, N = 191 | P- value |
|---|---|---|---|
| Age (years) | 68.18 (10.81) | 70.50 (9.78) | 0.008 |
| Male [n (%)] | 373 (57.03%) | 111 (58.12%) | 0.790 |
| Race [n (%)] | 0.414 | ||
| Mexican American | 121 (18.50%) | 45 (23.56%) | |
| Other Hispanic | 22 (3.36%) | 8 (4.19%) | |
| Non-Hispanic White | 325 (49.69%) | 87 (45.55%) | |
| Non-Hispanic Black | 157 (24.01%) | 46 (24.08%) | |
| Other, Including Multi-Racial | 29 (4.43%) | 5 (2.62%) | |
| Smoker[n (%)] | 389 (59.48%) | 104 (54.45%) | 0.215 |
| Drinker[n (%)] | 372 (61.59%) | 98 (54.75%) | 0.101 |
| Education [n (%)] | 0.021 | ||
| Level 1 | 147 (22.48%) | 63 (32.98%) | |
| Level 2 | 154 (23.55%) | 50 (26.18%) | |
| Level 3 | 145 (22.17%) | 30 (15.71%) | |
| Level 4 | 133 (20.34%) | 34 (17.80%) | |
| Level 5 | 72 (11.01%) | 14 (7.33%) | |
| Missing | 3 (0.46%) | 0 (0.00%) | |
| Marital status [n (%)] | < 0.001 | ||
| Married | 356 (54.43%) | 87 (45.55%) | |
| Widowed | 140 (21.41%) | 54 (28.27%) | |
| Divorced | 78 (11.93%) | 22 (11.52%) | |
| Separated | 16 (2.45%) | 8 (4.19%) | |
| Never married | 38 (5.81%) | 5 (2.62%) | |
| Living with partner | 19 (2.91%) | 5 (2.62%) | |
| Missing | 7 (1.07%) | 10 (5.24%) | |
| PIR [n (%)] | < 0.001 | ||
| 0−0.99 | 143 (21.87%) | 46 (24.08%) | |
| 1.00−2.99 | 311 (47.55%) | 83 (43.46%) | |
| >= 3.00 | 159 (24.31%) | 30 (15.71%) | |
| Missing | 41 (6.27%) | 32 (16.75%) | |
| Body mass index (kg/m2) | 32.64 (7.86) | 30.23 (5.89) | < 0.001 |
| Waist circumference (cm) | 109.99 (15.47) | 106.02 (13.64) | 0.003 |
| WBC (×109/L) | 7.54 (2.04) | 7.84 (2.48) | 0.091 |
| RBC (×1012/L) | 4.55 (0.57) | 4.56 (0.57) | 0.811 |
| Hemoglobin concentration (mg/dL) | 13.78 (1.65) | 13.80 (1.63) | 0.880 |
| Platelet count (×109/L) | 243.33 (74.93) | 242.41 (67.78) | 0.879 |
| Total protein (g/L) | 72.09 (5.34) | 73.69 (5.72) | < 0.001 |
| Albumin (g/L) | 40.78 (3.53) | 41.17 (3.77) | 0.189 |
| Alanine aminotransferase (U/L) | 21.00 (16.00–28.00) | 19.50 (15.00–25.00) | 0.004 |
| Aspartate aminotransferase (U/L) | 23.00 (19.00–27.00) | 21.00 (18.00–25.00) | < 0.001 |
| Alkaline phosphatase (U/L) | 78.66 (30.67) | 90.21 (40.18) | < 0.001 |
| Gamma glutamyl transferase (U/L) | 25.00 (18.00–44.00) | 27.00 (19.00−42.25) | 0.359 |
| Total bilirubin (µmol/L) | 11.97 (10.26–15.39) | 10.26 (6.80−13.68) | < 0.001 |
| Blood urea nitrogen (mmol/L) | 6.07 (4.64–7.85) | 6.43 (5.36–8.90) | 0.006 |
| Creatinine (µmol/L) | 88.40 (70.72−111.38) | 88.40 (70.70−114.91) | 0.654 |
| Uric acid (µmol/L) | 362.92 (107.56) | 366.19 (98.38) | 0.711 |
| Fasting blood glucose (mmol/L) | 7.33 (5.94–9.27) | 7.16 (5.66–10.99) | 0.999 |
| Triglycerides (mmol/L) | 1.85 (1.20–2.66) | 1.93 (1.34–2.99) | 0.042 |
| Total cholesterol (mmol/L) | 4.83 (1.27) | 5.24 (1.31) | < 0.001 |
| Lactate dehydrogenase (U/L) | 143.67 (37.50) | 159.02 (37.04) | < 0.001 |
| eGFR (mL/min/1.73 m2) | 82.73 (24.72) | 79.93 (29.66) | 0.190 |
| Glycated hemoglobin (%) | 7.19 (1.52) | 7.34 (1.81) | 0.271 |
| Glycated hemoglobin group | 0.011 | ||
| Quartile 1 | 137 (20.95%) | 54 (28.27%) | |
| Quartile 2 | 187 (28.59%) | 39 (20.42%) | |
| Quartile 3 | 162 (24.77%) | 37 (19.37%) | |
| Quartile 4 | 168 (25.69%) | 61 (31.94%) | |
| Hypertension [n (%)] | 545 (83.33%) | 161 (84.29%) | 0.753 |
| Emphysema [n (%)] | 54 (8.26%) | 8 (4.19%) | 0.041 |
| Hepatopathy [n (%)] | 43 (6.57%) | 12 (6.28%) | 0.885 |
| Cancer [n (%)] | 130 (19.88%) | 29 (15.18%) | 0.144 |
| High cholesterol level [n (%)] | 391 (64.42%) | 100 (58.48%) | 0.155 |
Table 2.
Baseline characteristics of participants according to the HbA1c group. Abbreviations: PIR, ratio of family income to poverty; WBC, white blood cell count; RBC, red blood cell count.
| Variable | Q1 (n = 191) | Q2 (n = 226) | Q3 (199) | Q4 (n = 229) | P-value |
|---|---|---|---|---|---|
| HbA1c < 6.2% | 6.2% <= HbA1c < 6.9% | 6.9% <= HbA1c < 7.7% | HbA1C > = 7.7% | ||
| Age (years) | 69.08 (12.66) | 71.00 (9.54) | 69.86 (9.64) | 65.12 (9.73) | < 0.001 |
| Male [n (%)] | 105 (54.97%) | 137 (60.62%) | 105 (52.76%) | 137 (59.83%) | 0.295 |
| Race [n (%)] | < 0.001 | ||||
| Mexican American | 29 (15.18%) | 33 (14.60%) | 50 (25.13%) | 54 (23.58%) | |
| Other Hispanic | 5 (2.62%) | 7 (3.10%) | 7 (3.52%) | 11 (4.80%) | |
| Non-Hispanic White | 103 (53.93%) | 133 (58.85%) | 90 (45.23%) | 86 (37.55%) | |
| Non-Hispanic Black | 45 (23.56%) | 43 (19.03%) | 43 (21.61%) | 72 (31.44%) | |
| Other, Including Multi-Racial | 9 (4.71%) | 10 (4.42%) | 9 (4.52%) | 6 (2.62%) | |
| Smoker[n (%)] | (58.64%) | 137 (60.62%) | 114 (57.29%) | 130 (56.77%) | 0.846 |
| Drinker[n (%)] | 104 (54.45%) | 126 (55.75%) | 103 (51.76%) | 137 (59.83%) | 0.339 |
| Education [n (%)] | < 0.001 | ||||
| Level 1 | 42 (21.99%) | 52 (23.01%) | 50 (25.13%) | 66 (28.82%) | |
| Level 2 | 33 (17.28%) | 39 (17.26%) | 58 (29.15%) | 74 (32.31%) | |
| Level 3 | 41 (21.47%) | 68 (30.09%) | 29 (14.57%) | 37 (16.16%) | |
| Level 4 | 55 (28.80%) | 41 (18.14%) | 36 (18.09%) | 35 (15.28%) | |
| Level 5 | 20 (10.47%) | 26 (11.50%) | 23 (11.56%) | 17 (7.42%) | |
| Missing | 0 (0.00%) | 0 (0.00%) | 3 (1.51%) | 0 (0.00%) | |
| Marital status [n (%)] | < 0.001 | ||||
| Married | 96 (50.26%) | 132 (58.41%) | 91 (45.73%) | 124 (54.15%) | |
| Widowed | 50 (26.18%) | 55 (24.34%) | 61 (30.65%) | 28 (12.23%) | |
| Divorced | 24 (12.57%) | 17 (7.52%) | 25 (12.56%) | 34 (14.85%) | |
| Separated | 1 (0.52%) | 5 (2.21%) | 7 (3.52%) | 11 (4.80%) | |
| Never married | 7 (3.66%) | 11 (4.87%) | 11 (5.53%) | 14 (6.11%) | |
| Living with partner | 9 (4.71%) | 4 (1.77%) | 1 (0.50%) | 10 (4.37%) | |
| Missing | 4 (2.09%) | 2 (0.88%) | 3 (1.51%) | 8 (3.49%) | |
| PIR [n (%)] | 0.393 | ||||
| 0−0.99 | 34 (17.80%) | 50 (22.12%) | 41 (20.60%) | 64 (27.95%) | |
| 1.00−2.99 | 96 (50.26%) | 111 (49.12%) | 91 (45.73%) | 96 (41.92%) | |
| >= 3.00 | 43 (22.51%) | 50 (22.12%) | 49 (24.62%) | 47 (20.52%) | |
| Missing | 18 (9.42%) | 15 (6.64%) | 18 (9.05%) | 22 (9.61%) | |
| Body mass index (kg/m2) | 31.16 (8.30) | 31.33 (6.63) | 32.91 (7.35) | 32.88 (7.74) | 0.023 |
| Waist circumference (cm) | 106.01 (15.68) | 108.49 (13.77) | 110.43 (14.82) | 110.96 (15.90) | 0.007 |
| WBC (×109/L) | 7.25 (2.20) | 7.84 (2.35) | 7.69 (1.97) | 7.61 (2.02) | 0.043 |
| RBC (×1012/L) | 4.48 (0.59) | 4.54 (0.54) | 4.51 (0.55) | 4.65 (0.58) | 0.010 |
| Hemoglobin concentration (mg/dL) | 13.79 (1.76) | 13.85 (1.62) | 13.59 (1.56) | 13.87 (1.65) | 0.281 |
| Platelet count (×109/L) | 233.97 (64.60) | 239.12 (75.01) | 251.38 (77.69) | 247.48 (73.99) | 0.072 |
| Total protein (g/L) | 71.78 (5.94) | 72.30 (5.37) | 71.90 (5.04) | 73.63 (5.33) | 0.001 |
| Albumin (g/L) | 41.03 (3.60) | 41.29 (3.82) | 40.74 (3.53) | 40.42 (3.33) | 0.065 |
| Alanine aminotransferase (U/L) | 23.33 (13.10) | 23.41 (12.09) | 27.75 (58.76) | 24.81 (12.35) | 0.441 |
| Aspartate aminotransferase (U/L) | 26.04 (11.08) | 25.09 (9.94) | 27.25 (29.00) | 23.92 (10.05) | 0.220 |
| Alkaline phosphatase (U/L) | 79.48 (34.44) | 76.47 (29.96) | 76.52 (31.72) | 91.63 (34.99) | < 0.001 |
| Gamma glutamyl transferase (U/L) | 24.00 (15.00–44.00) | 24.00 (18.00–38.00) | 24.00 (17.00–40.00) | 32.00 (21.00–54.00) | < 0.001 |
| Total bilirubin (µmol/L) | 12.54 (4.89) | 12.76 (6.27) | 12.14 (4.91) | 11.86 (5.12) | 0.304 |
| Blood urea nitrogen (mmol/L) | 6.07 (4.64–8.20) | 6.43 (5.00−8.12) | 6.43 (4.64–8.21) | 6.10 (5.00−8.20) | 0.682 |
| Creatinine (µmol/L) | 88.40 (70.72–110.50) | 90.17 (78.01−114.92) | 88.40 (70.72−106.08) | 81.33 (64.53−114.92) | 0.031 |
| eGFR (mL/min/1.73 m2) | 81.49 (26.70) | 77.73 (24.40) | 82.53 (24.04) | 86.54 (27.67) | 0.004 |
| Uric acid (µmol/L) | 367.01 (106.04) | 373.94 (104.26) | 362.55 (96.90) | 351.47 (112.67) | 0.153 |
| Fasting blood glucose (mmol/L) | 24.00 (15.00–44.00) | 24.00 (18.00–38.00) | 24.00 (17.00–40.00) | 32.00 (21.00–54.00) | < 0.001 |
| Triglycerides (mmol/L) | 1.51 (1.00−2.10) | 1.48 (1.12–2.19) | 2.04 (1.36–2.45) | 1.94 (1.30–3.18) | 0.001 |
| Total cholesterol (mmol/L) | 4.73 (4.04–5.48) | 4.52 (3.96–5.59) | 4.42 (4.11–5.46) | 5.08 (4.32–5.95) | < 0.001 |
| Lactate dehydrogenase (U/L) | 147.10 (34.89) | 144.98 (34.92) | 149.51 (38.72) | 147.19 (42.41) | 0.693 |
| Hypertension [n (%)] | 166 (86.91%) | 184 (81.42%) | 161 (80.90%) | 195 (85.15%) | 0.289 |
| Emphysema [n (%)] | 12 (6.28%) | 24 (10.62%) | 14 (7.04%) | 12 (5.24%) | 0.145 |
| Hepatopathy [n (%)] | 18 (9.42%) | 14 (6.19%) | 5 (2.51%) | 18 (7.86%) | 0.035 |
| Cancer [n (%)] | 47 (24.61%) | 50 (22.12%) | 33 (16.58%) | 29 (12.66%) | 0.007 |
| High cholesterol level [n (%)] | 101 (61.96%) | 132 (60.55%) | 130 (68.78%) | 128 (61.54%) | 0.316 |
| Number of deaths [n (%)] | 54 (28.27%) | 39 (17.26%) | 37 (18.59%) | 61 (26.64%) | 0.011 |
| Follow-up time (months) | 85.00 (41.00−143.00) | 82.50 (44.75−139.75) | 94.00 (61.00−130.50) | 95.00 (61.00−147.00) | 0.853 |
Relationships of HbA1c concentration with mortality
In univariate analysis, all-cause mortality increased slightly with increasing HbA1c (continuous), with an HR (95% CI) of 1.02 (0.94, 1.11). However, after adequate adjustment for potential confounders, the results were reversed, with an HR (95% CI) of 0.93 (0.80, 1.07) (model 3). Yet ultimately when categorized, HbA1c did associate with all-cause mortality. Individuals with HbA1c (Q2) faced the least risk of all-cause mortality, compared to those with the lowest HbA1c quartile (Q1) (HR = 0.59, 95% CI: 0.39–0.89, p = 0.013). After adjusting for potential confounding variables, the HRs and 95% CIs for quartiles 2, 3, and 4 were 0.49 (0.30, 0.80), 0.64 (0.39, 1.03), and 0.72 (0.44, 1.18), respectively, compared with the lowest HbA1c quartile (Table 3).
Table 3.
HRs (95% CIs) for mortality according to glycated hemoglobin. Abbreviations: HR, hazard ratio; CI, confidence interval.
| Categories | Model1 | Model2 | Model3 | |||
|---|---|---|---|---|---|---|
| HR (95%CI) | P-value | HR (95%CI) | P-value | HR (95%CI) | P-value | |
| All-cause mortality | ||||||
| Glycated hemoglobin | 1.02 (0.94, 1.11) | 0.592 | 1.07 (0.98, 1.17) | 0.181 | 0.93 (0.80, 1.07) | 0.294 |
| Glycated hemoglobin group | ||||||
| < 6.2% (Q1) | Reference | Reference | Reference | |||
| 6.2%~ 6.8% (Q2) | 0.59 (0.39, 0.89) | 0.013 | 0.55 (0.36, 0.84) | 0.005 | 0.49 (0.30, 0.80) | 0.004 |
| 6.9%~7.6% (Q3) | 0.67 (0.44, 1.02) | 0.062 | 0.65 (0.43, 0.99) | 0.045 | 0.64 (0.39, 1.03) | 0.066 |
| ≥ 7.7% (Q4) | 0.86 (0.60, 1.24) | 0.420 | 0.98 (0.67, 1.44) | 0.912 | 0.72 (0.44, 1.18) | 0.189 |
| P for tend | 0.695 | 0.848 | 0.310 | |||
Model 1: Non-adjusted.
Model 2: Adjusted for age, gender, and race.
Model 3: Adjusted for age, gender, race, ratio of family income to poverty group, education, marital status, smoking status, alcohol consumption status, albumin, aspartate aminotransferase, alkaline phosphatase, total cholesterol, body mass index group, fasting glucose, lactate dehydrogenase, total bilirubin, total protein, triglycerides, uric acid, eGFR, white blood cell count, platelet count, emphysema, cancer, and high cholesterol level.
Analysis of the nonlinear relationship
Given that the relationship between HbA1c and all-cause mortality was found to be nonlinear, we employed restricted cubic spline analysis. A nonlinear relationship was found between HbA1c levels and all-cause mortality among patients with diabetes mellitus after adjustment for potential confounding variables (Poverall = 0.006, Pnon−linear = 0.006), with an optimal threshold value of 6.9% for HbA1c. For every 1 unit of HbA1c increase below 6.9%, all-cause mortality was decreased by 55% (P < 0.001). However, above a value of 6.9%, all-cause mortality slightly increased (HR: 1.05, P = 0.670) (Fig. 2; Table 4).
Fig. 2.

Association between HbA1c and all-cause mortality in CVD patients with diabetes. Adjusted for age, gender, race, ratio of family income to poverty group, education, marital status, smoking status, alcohol consumption status, albumin, aspartate aminotransferase, alkaline phosphatase, total cholesterol, body mass index group, fasting glucose, lactate dehydrogenase, total bilirubin, total protein, triglycerides, uric acid, eGFR, white blood cell count, platelet count, emphysema, cancer, and high cholesterol level. Abbreviation : CVD: cardiovascular disease.
Table 4.
Threshold effect analysis of HbA1c on all-cause mortality in CVD patients with diabetes.
| Adjusted HR (95%CI) | P value | |
|---|---|---|
| Fitting by two piecewise Cox proportional risk model | ||
| Inflection point | 6.9% | |
| Glycated hemoglobin < 6.9% | 0.45 (0.27, 0.75) | 0.002 |
| Glycated hemoglobin ≥ 6.9% | 1.05 (0.85, 1.29) | 0.670 |
| P for Log-likelihood ratio | < 0.001 |
Discussion
This research attempted to better comprehend glycated hemoglobin (HbA1c) and its association with all-cause mortality in cardiovascular disease (CVD) patients with diabetes mellitus by evaluating the National Health and Nutrition Examination Survey (NHANES) data from 1999 to 2014. The findings demonstrated a non-linear association between HbA1c and all-cause mortality in diabetic CVD patients with a median observation time of 7.3 years.
Both the American Diabetes Association (ADA) and the European Association for the Study of Diabetes (EASD) provide guidelines for glycemic control in adults with type 2 diabetes. The EASD generally recommends a target HbA1c level of < 7% for the average adult with diabetes, while the ADA suggests that target HbA1c levels may vary and emphasizes a more individualized approach based on patient-specific factors. While HbA1c < 7% has traditionally been a common target, the ADA acknowledges that less stringent targets might be appropriate for some individuals based on their health status and treatment goals18,19. The variability of this recommendation reflects the recognition that the optimal glycated hemoglobin concentration for glycemic control may vary among patients with different disease states. In chronic kidney disease (CKD) patients20 and in end-stage renal disease patients being treated with hemodialysis21, poor glycemic control results in increased mortality rates and all-cause mortality rises as HbA1c levels escalate. However, Baechle22 et al. have argued that HbA1c does not accurately portray all-cause mortality prognosis in type 2 diabetes.
In the current study, we analyzed a retrospective study using NHANES and NDI databases, which found no meaningful link between HbA1c and all-cause mortality as a continuous variable in CVD patients with diabetes mellitus. However, after classification by glycated hemoglobin quartiles, HRs were characterized by a decrease and then an increase with increasing quartiles. Further nonlinear relationship evaluation demonstrated that the relationship between HbA1c and all-cause mortality for CVD patients with diabetes mellitus followed a approximately “U” shaped association, with the lowest mortality observed at an HbA1c level of approximately 6.9%. Li23et al. reported similar findings in diabetic patients. Other studies have shown comparable findings in patients with high blood pressure24, critically ill non-diabetics25, cognitively impaired elderly individuals26, and diabetics in the community27. The potential mechanisms for the association of lower HbA1c and increased mortality are general poor health due to malnutrition, abnormalities in erythrocyte-associated factors, inflammatory responses, and decreased liver function28. Hypoglycemia has an impact on sympathetic nerve function, inflammation, and vascular endothelial function, which can increase the risk of chronic and cardiometabolic events29,30. Hypoglycemia can induce an increased amount of counter-regulatory hormones like epinephrine, which causes vasoconstriction and platelet aggregation, causing more cardiovascular and cerebrovascular events31. Low HbA1c does not necessarily represent good glycemic control, and there may be a discrepancy between HbA1c and actual blood glucose levels 32,33. Therefore, a personalized treatment plan is important for diabetic CVD patients.
The strengths of this study should be noted as follows: the use of the large-scale NHANES database, which enabled a high sample size to be obtained, the fact that the results were adjusted for several potential confounders, and the utilization of the restricted cubic spline analyses to explicate the non-linear relationship between HbA1c and all-cause mortality. However, the following limitations should be mentioned: Clinical information such as CVD was derived from participant self-reported interview data, which could potentially cause selection bias due to incorrect participant recall; an additional source of confounding variables is that residual confounding may be distorting the prognosis of the study despite efforts to control for confounding variables through the use of multivariate adjustments and subgroup analyses, since HbA1c is only measured at one-time point, which may not necessarily reflect the long-run glycemic control, and there are no interventional studies that can be used to make causal inferences. In the future, larger prospective cohort studies could provide more reliable evidence of the relationship between HbA1c and mortality in CVD patients with .diabetes mellitus.
Conclusion
The relationship between HbA1c in cardiovascular disease (CVD) patients with diabetes mellitus and all-cause mortality risk is non-linear and approximately “U” shaped, where the optimal target for HbA1c control in these patients is 6.9%, and suggest that individualization of glycemic control may be beneficial for this patient population.
Electronic supplementary material
Below is the link to the electronic supplementary material.
Author contributions
Jianhong Yu, Haodong Hua and Minggang Yin conceived the study and revised the paper. Jianhong Yu analyzed the data. Jianhong Yu conceived and designed the experiments and wrote the paper. All authors have read and agreed to the published version of the manuscript.
Funding
The author(s) reported there is no funding associated with the work featured in this article.
Data availability
Publicly available datasets were analyzed in this study. These data can be found at: https://www.cdc.gov/nchs/nhanes. For further needs contact corresponding author in the data availability statement.
Declarations
Competing interests
No potential conffict of interest was reported by the author(s).
Footnotes
Publisher’s note
Springer Nature remains neutral with regard to jurisdictional claims in published maps and institutional affiliations.
References
- 1.Standl, E., Khunti, K., Hansen, T. B. & Schnell, O. The global epidemics of diabetes in the 21st century: current situation and perspectives. Eur. J. Prev. Cardiol.26 (2_suppl), 7–14 (2019). [DOI] [PubMed] [Google Scholar]
- 2.Hu, T. et al. Plasma fingerprint of free fatty acids and their correlations with the traditional cardiac biomarkers in patients with type 2 diabetes complicated by coronary heart disease. Front. Cardiovasc. Med.9, 903412 (2022). [DOI] [PMC free article] [PubMed] [Google Scholar]
- 3.Iglay, K. et al. Comorbidities in type 2 diabetes patients with and without atherosclerotic cardiovascular disease: a retrospective database analysis. Curr. Med. Res. Opin.37 (5), 743–751 (2021). [DOI] [PubMed] [Google Scholar]
- 4.Virani, S. S. et al. Heart Disease and Stroke Statistics-2020 update: a Report from the American Heart Association. Circulation141 (9), e139–e596 (2020). [DOI] [PubMed] [Google Scholar]
- 5.GBD 2021 Diseases and Injuries Collaborators. Global incidence, prevalence, years lived with disability (YLDs), disability-adjusted life-years (DALYs), and healthy life expectancy (HALE) for 371 diseases and injuries in 204 countries and territories and 811 subnational locations, 1990–2021: a systematic analysis for the global burden of Disease Study 2021. Lancet403 (10440), 2133–2161 (2024). [DOI] [PMC free article] [PubMed] [Google Scholar]
- 6.GBD 2021 Causes of Death Collaborators. Global burden of 288 causes of death and life expectancy decomposition in 204 countries and territories and 811 subnational locations, 1990–2021: a systematic analysis for the global burden of Disease Study 2021. Lancet403 (10440), 2100–2132 (2024). [DOI] [PMC free article] [PubMed] [Google Scholar]
- 7.Maan, H. B., Meo, S. A., Rouq, F. A. & Meo, I. M. U. Impact of Glycated Hemoglobin (HbA1c) on cognitive functions in type 2 diabetic patients. Eur. Rev. Med. Pharmacol. Sci.25 (19), 5978–5985 (2021). [DOI] [PubMed] [Google Scholar]
- 8.Rotkopf, A., Giladi, E. & Elis, A. HbA1c% level patterns as a marker for malignancy in diabetic patients. Eur J Intern Med. Mar 6:S0953-6205(24)00089-X. doi: (2024). 10.1016/j.ejim.2024.02.033. Epub ahead of print. [DOI] [PubMed]
- 9.Jiao, X., Zhang, Q., Peng, P. & Shen, Y. HbA1c is a predictive factor of severe coronary stenosis and major adverse cardiovascular events in patients with both type 2 diabetes and coronary heart disease. Diabetol. Metab. Syndr.15 (1), 50 (2023). [DOI] [PMC free article] [PubMed] [Google Scholar]
- 10.Zhou, X. et al. Point-of-care detection of glycated hemoglobin using a novel dry chemistry-based electrochemiluminescence device. Anal. Chim. Acta. 1279, 341829–341829 (2023). [DOI] [PubMed] [Google Scholar]
- 11.Holman, R. R., Paul, S. K., Bethel, M. A., Matthews, D. R. & Neil, H. A. 10-year follow-up of intensive glucose control in type 2 diabetes. N Engl. J. Med.359 (15), 1577–1589 (2008). [DOI] [PubMed] [Google Scholar]
- 12.Tan, J. K. et al. Associations between Mean HbA1c, HbA1c variability, and both mortality and Macrovascular Complications in patients with diabetes Mellitus: A Registry-based Cohort Study. Clin. Epidemiol.15, 137–149 (2023). [DOI] [PMC free article] [PubMed] [Google Scholar]
- 13.Chiang, J. I. et al. Multimorbidity, mortality, and HbA1c in type 2 diabetes: a cohort study with UK and Taiwanese cohorts. PLoS Med.17 (5), e1003094 (2020). [DOI] [PMC free article] [PubMed] [Google Scholar]
- 14.Li, M. et al. Association between glycated haemoglobin and the risk of chronic obstructive pulmonary disease: a prospective cohort study in UK Biobank. Diabetes Obes. Metab.25 (12), 3599–3610 (2023). [DOI] [PubMed] [Google Scholar]
- 15.Sugimoto, T. et al. Impact of type 2 diabetes and glycated hemoglobin levels within the recommended target range on mortality in older adults with cognitive impairment receiving care at a memory clinic: NCGG-STORIES. Diabetes Care. 47 (5), 864–872 (2024). [DOI] [PubMed] [Google Scholar]
- 16.NHANES-National Health and Nutrition Examination Survey Homepage. Centers for disease control and prevention. https://www.cdc.gov/nchs/nhanes/index.htm (Accessed: September 15, 2023).
- 17.Levey, A. S. et al. A new equation to estimate glomerular filtration rate. Ann. Intern. Med.150 (9), 604–612 (2009). [DOI] [PMC free article] [PubMed] [Google Scholar]
- 18.American Diabetes Association. 6. Glycemic Targets: Standards of Medical Care in Diabetes-2021. Diabetes Care. 44(Suppl 1):S73-S84. (2021). [DOI] [PubMed]
- 19.Davies, M. J. et al. Management of hyperglycemia in type 2 diabetes, 2018. A Consensus Report by the American Diabetes Association (ADA) and the European Association for the Study of Diabetes (EASD). Diabetes Care. 41 (12), 2669–2701 (2018). [DOI] [PMC free article] [PubMed] [Google Scholar]
- 20.Chen, S. J. et al. Association of poorly controlled HbA1c with increased risk of progression to end-stage kidney disease and all-cause mortality in patients with diabetes and chronic kidney disease. PLoS One. 17 (9), e0274605 (2022). [DOI] [PMC free article] [PubMed] [Google Scholar]
- 21.Kim, D. K. et al. Glycated hemoglobin levels and risk of all-cause and cause-specific mortality in hemodialysis patients with diabetes. Diabetes Res. Clin. Pract.190, 110016 (2022). [DOI] [PubMed] [Google Scholar]
- 22.Baechle, C., Scherler, W., Lang, A., Filla, T. & Kuss, O. Is HbA1c a valid surrogate for mortality in type 2 diabetes? Evidence from a meta-analysis of randomized trials. Acta Diabetol.59 (10), 1257–1263 (2022). [DOI] [PMC free article] [PubMed] [Google Scholar]
- 23.Li, W. et al. HbA1c and all-cause mortality risk among patients with type 2 diabetes. Int. J. Cardiol.202, 490–496 (2016). [DOI] [PMC free article] [PubMed] [Google Scholar]
- 24.Zeng, R. et al. Relationship of Glycated Hemoglobin A1c with all-cause and Cardiovascular Mortality among patients with hypertension. J. Clin. Med.12 (7), 2615 (2023). [DOI] [PMC free article] [PubMed] [Google Scholar]
- 25.Liu, C. et al. The association between hemoglobin A1c and all-cause mortality in the ICU: a cross-section study based on MIMIC-IV 2.0. Front. Endocrinol. (Lausanne). 14, 1124342 (2023). [DOI] [PMC free article] [PubMed] [Google Scholar]
- 26.Taiki et al. Impact of type 2 diabetes and glycated hemoglobin levels within the recommended target range on mortality in older adults with cognitive impairment receiving care at a memory clinic: NCGG-STORIES. Diabetes Care. 47 (5), 864–872 (2024). [DOI] [PubMed] [Google Scholar]
- 27.He, Q. et al. Association between glycated hemoglobin and risk of all-cause mortality in community patients with type 2 diabetes: a prospective cohort study. J. Diabetes Investig. 1210.1111/jdi.14183 (2024 Mar). Epub ahead of print. [DOI] [PMC free article] [PubMed]
- 28.Inoue, K. et al. Low HbA1c levels and all-cause or cardiovascular mortality among people without diabetes: the US National Health and Nutrition Examination Survey 1999–2015. Int. J. Epidemiol.50 (4), 1373–1383 (2021). [DOI] [PMC free article] [PubMed] [Google Scholar]
- 29.Carson, A. P. et al. Low hemoglobin A1c and risk of all-cause mortality among US adults without diabetes. Circ. Cardiovasc. Qual. Outcomes. 3 (6), 661–667 (2010). [DOI] [PMC free article] [PubMed] [Google Scholar]
- 30.Christman, A. L., Lazo, M., Clark, J. M. & Selvin, E. Low glycated hemoglobin and liver disease in the U.S. population. Diabetes Care. 34 (12), 2548–2550 (2011). [DOI] [PMC free article] [PubMed] [Google Scholar]
- 31.Galassetti, P. & Davis, S. N. Effects of insulin per se on neuroendocrine and metabolic counter-regulatory responses to hypoglycaemia. Clin. Sci. (Lond). 99 (5), 351–362 (2000). [PubMed] [Google Scholar]
- 32.Pei, J., Wang, X., Pei, Z. & Hu, X. Glycemic control, HbA1c variability, and major cardiovascular adverse outcomes in type 2 diabetes patients with elevated cardiovascular risk: insights from the ACCORD study. Cardiovasc. Diabetol.22 (1), 287 (2023). [DOI] [PMC free article] [PubMed] [Google Scholar]
- 33.Vasudevan, A. R., Ghosh, S., Srivastava, R. & Premawardhana, L. D. Low HbA1c levels in a poorly controlled diabetic. Postgrad Med J.79(933):418, 421 (2003). [DOI] [PMC free article] [PubMed]
Associated Data
This section collects any data citations, data availability statements, or supplementary materials included in this article.
Supplementary Materials
Data Availability Statement
Publicly available datasets were analyzed in this study. These data can be found at: https://www.cdc.gov/nchs/nhanes. For further needs contact corresponding author in the data availability statement.