

Abstract
Quantifying the features of mitochondrial genome structural variation is crucial for understanding its contribution to complexity. Accurate quantification and interpretation of organizational diversity can help uncover biological evolutionary laws and patterns. The current qMGR approach accumulates the changes in two adjacent genes to calculate the rearrangement frequency RF of each single gene and the rearrangement score RS for specific taxa in the mitogenomes of a given taxonomic group. However, it may introduce bias, as it assigns scores to adjacent genes rather than to rearranged genes. To overcome this limitation, we propose a novel statistical method called qGO to quantify the diversity of gene organization. The qGO method, which is based on the homology of gene order, provides a more accurate representation of genome organizational diversity by partitioning gene strings and individually assigning weights to genes spanning different regions. Additionally, a comprehensive approach is employed for distance computation, generating an extensive matrix of rearrangement distances. Through experiments on more than 5500 vertebrate mitochondrial genomes, we demonstrated that the qGO method outperforms existing methods in terms of accuracy and interpretability. This method improves the comparability of genomes and allows a more accurate comparison of the diversity of mitochondrial genome organization across taxa. These findings have significant implications for unraveling genome evolution, exploring genome function, and investigating the process of molecular evolution.
Supplementary Information
The online version contains supplementary material available at 10.1186/s12864-024-11006-6.
Keywords: Mitochondrial genome, Gene rearrangement, Quantification, Gene order, Vertebrate, Molecular evolution
Background
The mitochondrial genome is a unique genetic entity in eukaryotic cells that originates from ancestral endosymbiotic events. It plays a crucial role in fundamental cellular processes such as respiration, oxidative phosphorylation, and translation [1]. Although the genetic function of the mitochondrial genome has remained unchanged, its structure, gene expression mechanisms, and evolutionary trends show remarkable diversity across eukaryotic lineages [2, 3]. Significant differences in the structure and genetics of mitochondria reflect evolutionary processes, including sequence variation, recombination, and gene rearrangement. Studying the diversity of mitochondrial genome organization is essential for understanding the evolution of gene content, genome organization, and interactions between the mitochondrial and nuclear genomes, which have implications for energy production and respiration and for revealing the evolutionary history of eukaryotes [4], including humans [5].
Despite our increasing understanding of the mitochondrial genome, accurately quantifying its architecture remains a challenge. This challenge stems from the inherent complexity and dynamism of the mitogenome and is compounded by the continuing discovery of its diversity in size, structure, content, and organizational patterns. The diversity of genomic changes, including rearrangements, segmental duplications, gene gains, and losses, can create a mosaic pattern of homology even among closely related organisms. This complexity overwhelms qualitative comparisons. A combination of qualitative and quantitative methods is essential for a comprehensive understanding of mitochondrial genome organization and evolution. Qualitative analyses provide fundamental insights into gene functions and evolutionary relationships, whereas quantitative approaches allow the measurement of genomic complexity and the elucidation of gene expression and regulation patterns. By integrating both methods across major taxonomic groups, we can reveal evolutionary patterns and species diversity, thereby enhancing our understanding of the dynamics of evolutionary processes and delving into molecular regulation specific to mitochondrial genome organization.
Although various models have been proposed to explain mitochondrial genome rearrangement mechanisms, such as gene loss, duplication, or inversion [6–8], these models can account for only a few phenomena because the underlying mechanisms behind many rearrangements remain unclear [9]. The algorithms for mitochondrial genome rearrangement CREx [9] and TreeRex [10] were employed primarily to investigate the evolutionary relationships between different rearrangement types. However, they are challenging to apply in cases where gene loss and duplication are involved in rearrangements. For algorithms, GRIMM [11] and MGR [12] have been designed to examine evolutionary associations between rearranged genomes (chromosomal genomes). In contrast to the rearrangement process, there is a lack of precise statistical methods for quantifying rearrangement characteristics (mitochondrial phenotype) on the basis of homology.
Oxusoff et al. [13] designed a genome comparison algorithm on the basis of the backtracking framework. It enumerates all the possible paths of length k from one genome to another, which have exactly the same genes, via a depth-first search (DFS) of a search tree. Owing to the characteristics of the DFS, the algorithm becomes less efficient as the number of genes increases. Additionally, it imposes too many constraints on the input genome. The algorithm can accept only two genomes with exactly the same gene as its input and recognize those genes designated explicitly by the algorithm. Generally, with fewer constraints on the input genomic data, the calculated recombination distances tend to be closest to the actual evolutionary distances [14]. Too many constraints on the input genome may make quantitative results less accurate and realistic.
qMGR [15] is currently the sole statistical approach specifically tailored for the quantitative analysis of mitochondrial gene rearrangement, demonstrating a unique and innovative approach in this field. This method employs an ingenious strategy whereby the scores of neighboring genes are leveraged to assign values to target genes. The distance in question is defined in relation to a reference arrangement through the process of summation over the entirety of the relevant set. The output includes the rearrangement frequency (RF) of each gene and the rearrangement score (RS) of each genome for a given taxonomic group, thereby providing valuable insights into mitochondrial genome dynamics. As a pioneering method, qMGR has established a foundation for future research in this area. Nevertheless, like any pioneering method, it faces specific challenges that are noteworthy for future development and refinement. This can be expressed as a sum of four cases. (1) Stationary Gene Scoring: The method assigns scores to stationary genes when their adjacent genes undergo rearrangement. However, this may not accurately reflect the stability of the genes in question, as they have not been rearranged. (2) The Handling of Additional Genes: The current scoring system is designed for a benchmark sequence and may, as a result, include scores from additional genes, which could lead to an inflation of the final scores. (3) Gene Cluster Dynamics: The method fails to capture rearrangement dynamics when gene clusters move as a unit, resulting in the assignment of low scores to all constituent genes. (4) Long-Distance Transposition: The method does not assign individual weights to genes that move long distances, resulting in scores that may underestimate the significance of major rearrangements compared to minor ones [16]. Furthermore, while qMGR's reliance on a single reference arrangement is a practical starting point, it limits the scope of analysis to single-reference comparisons. Future iterations of the method could benefit from the incorporation of pairwise distance calculations among gene orders.
With the advancement of technologies such as next-generation sequencing and single-cell sequencing, genome structures are highly diverse, and their empirical distributions are expanding. Genome structure can be accurately quantified through extensive feature extraction. Furthermore, the compact circle of the animal mitochondrial genome retains the smallest actionable set, including relatively conserved gene content and rearrangements. It also exhibits dynamic organizational variation influenced by duplicated genes and intergenic spacers, which display varying diversities among clades. This makes it the best model for determining the general principles of mitochondrial genome organization from qualitative and quantitative analyses.
In light of the aforementioned precedent, this work proposes a novel method, designated as qGO, for quantifying the diversity of genome organization in animal mitochondrial genomes. The method is based on gene order homology, which allows for a more accurate characterization of genome organization diversity by partitioning gene clusters and individually assigning weights to genes spanning different regions while calculating all pairwise distances to create a distance matrix summarizing their similarity or distance. The results of our comprehensive experiments on over 5,500 vertebrate mitochondrial genomes demonstrate that qGO is a superior method in terms of accuracy and interpretability compared to existing techniques. This approach enhances the comparability of genomes and facilitates a more precise evaluation of the diversity of mitochondrial genome organization across taxa. Additionally, this method imposes fewer constraints on the input genome, allowing for the detection and accurate scoring of all genes present in the genome data. Furthermore, the qGO not only reveals patterns of genome evolution but also provides researchers in related fields with practical tools and valuable data support, enabling new insights and advances in their studies.
Materials and methods
Data
The dataset used in this paper is from Shtolz et al. [17]. Since it has formatting errors, illegal characters, and gene sequence errors, we secondarily processed it via the following steps:
Formatting gene sequences by removing redundant symbols.
Reordering the gene sequences to follow the order ' nad1, I, Q, M '.
Extracting the taxonomic information from the chordate subset of the broader animal dataset and these sequences were categorized into five distinct taxa.
Eliminating duplicates and labeling genotypes accordingly due to the presence of many duplicate genotypes infive datasets.
Converting the cleaned sequence data into the FASTA file format.
qGO method
The qGO method calculates quantitative results on the basis of the homology of gene order. It partitions gene strings and individually assigns weights to genes spanning different regions. The following is an introduction to the relevant concepts.
Homology alignment
Homology, indicative of shared ancestry, is central to computational biology. However, the connection between similarity and homology is frequently misunderstood [18]. Homology denotes the evolutionary relationship between sequences that originate from a common ancestor. It is a binary concept that is assessed qualitatively as either present or absent and indicates whether sequences such as A and B are derived from a shared ancestor. Conversely, similarity refers to the percentage of identical elements between the detected and target sequences, which is calculated as a proportion of the entire sequence. For example, an 80% similarity between sequence A and sequence B indicates that 80% of their elements are either identical or exhibit similar properties.
While similarity measures the degree of resemblance between sequences, homology requires verification through evolutionary evidence. Many sequences may exhibit some degree of similarity, but they are considered homologous only if they can be traced back to a common ancestor through evolution. Consequently, sequence similarity enhances the likelihood of homology [19]. Moreover, accurate homology assessments, in turn, depend on robust alignment.
In this study, we opted for manual alignment to ensure the highest reliability in inferring homology, as no current alignment algorithm has been identified to suit our specific needs. In this way, we ensure that the subsequent quantitative analyses are based on a solid foundation of accurately determined homology, thereby preserving the integrity of our findings.
Weighting
Previous approaches regarding the issue of ordering mixed reorganization operations assumed equal probabilities for inversion and transposition operations. However, the chance of inversion occurring is much greater than that of transposition [20]. To address this, Erikse proposed an approximation scheme with an approximation degree of (1 + ε) by considering a weight ratio of inversion to transposition of 1:2 [21]. In light of these insights, the qGO algorithm contains two rearrangement operations: inversion and transposition. It assumes that the weights of inversion and transposition are wr and wt, respectively, and satisfies wr ≤ wt ≤ kwr, where k is a constant (k ≥ 1) [20]. Furthermore, the algorithm distinguishes between three partitioning scenarios in transposition by assigning three distinct weights. Consequently, upon the application of these assigned weights, the weighted average of transposition is computed to be 2, which aligns with the findings of the previous study.
Compact circle genomes as the model
The compact genome serves as an excellent model for gene rearrangement studies because of its manageable size, which encompasses substantial rearrangements. Compared with vastly larger and more intricate nuclear genomes, compact mitochondrial genomes are typically characterized by simpler, more streamlined organization. Particularly in Metazoa, the conserved gene content and scarcity of noncoding regions provide a 'cleaner' genetic landscape. This structural simplicity makes it easier to detect, analyze, and model gene rearrangements.
However, the proximity of genes in compact genomes can lead to pronounced interactions, where any rearrangement is likely to affect multiple genes [22]. Moreover, close packing may result in genes sharing regulatory elements, increasing the chances of coordinated expression changes following rearrangements [23]. There is also a ring property that must be acknowledged, where spatial relationships differ fundamentally from those in linear genomes. In the circular genome, genes that are far apart in a linear arrangement may become adjacent, necessitating a unique approach to measuring gene distances.
In summary, the compact and circular mitochondrial genome serves as an ideal model for studying gene rearrangements. Furthermore, it offers a robust platform for exploring fundamental biological processes, including gene regulation, evolutionary biology, and the dynamics of genome architecture.
Algorithm
A genome is a collection of chromosomes, each represented as a sequence of genes. The orientation of the gene in the chromosome is indicated by the addition of the symbol ± (the plus sign may be omitted) before the gene string. For example, {(F, -12S, W, A, -N)} denotes a single chromosome genome containing five genes. A genome can be linear or circular. In a circular genome, the last gene of the sequence is linked with the first one and arranged in a ring. On the other hand, genes are arranged linearly with a head and a tail. In this study, we considered only single-chromosome circular genomes. The chromosome S containing m (m ≥ 0) genes is denoted as {g0 g1… gm-1}.
Definition 1: Reversal is the operation of reversing the sign of a gene in a gene sequence. For example, for chromosome S = g0… gi… gm-1, the result of the reversal is a new chromosome S' = g0… -gi… gm-1, 0 ≤ i ≤ m-1.
Definition 2: Transposition is the operation of taking a gene from one gene sequence and inserting it in another position. Given chromosome S = g0… gi… gj… gm-1, the result of the transposition is a new chromosome S' = g0… gj… gi… gm-1, 0 ≤ i, j ≤ m-1.
Let the gene sequences be , and the number of sequences is n, where n ≥ 0. The flow chart of the homology-based qGO algorithm is shown in Fig. 1.
Fig. 1.
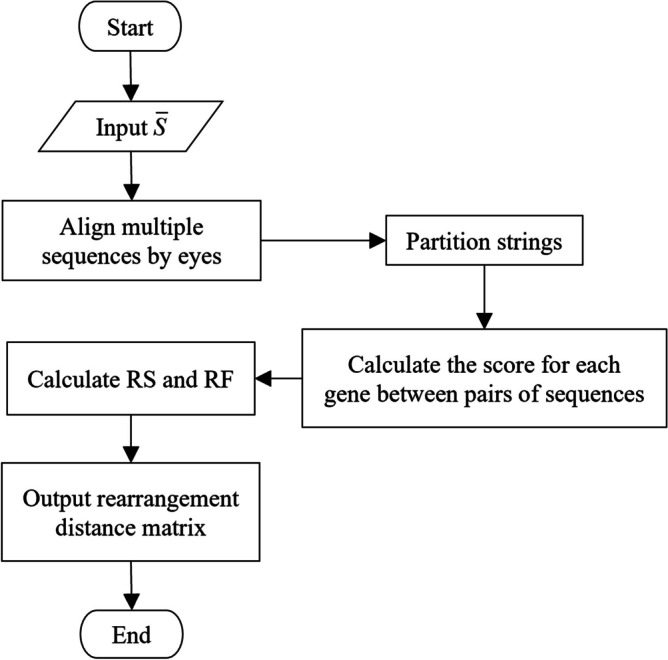
Flowchart of the qGO method
The description of the method is as follows:
Input gene sequences .
Aligning gene sequences by eye.
Partition from the control region to the replication start point.
Compute the score for each gene between pairs of sequences. The scoring process for pairs of any two gene sequences, Si and Sj, 0 ≤ i, j ≤ n-1, is shown in Fig. 2.
The scores of all genes in the species are summed to obtain the species score RS, and the scores of each gene are summed to obtain the gene frequency RF.
Generate and output the rearrangement distance matrix of , which is based on the obtained RS and RF.
Fig. 2.

Scoring process for any pair of genes
The scoring process for any pair of genes within sequences Si and Sj is as follows:
Compare the genes at the same position in Si and Sj. If they are the same, the gene score is 0. If they are different, the score is 1. Then, the following two judgments are made:
Determine whether the regions where the genes located in Si and Sj are the same (weight 1), adjacent (weight 2), or in other cases (weight 3), and multiply the score by the weight.
Determine if the gene has been reversed; if so, add 1 to the score; otherwise, leave it unchanged.
The pseudocode of the algorithm is as follows:

Algorithm 1. qGO algorithm
The getWeight function in the above pseudocode is used to individually assign weights according to the region: 1 for the same region, 2 for the adjacent regions, and 3 for the rest of the region; the geneReverseOrNot function is used to determine whether the gene is reversed, and if it is reversed, one more point is added. Owing to space limitations, these two functions are no longer detailed here.
Results and discussion
The experiments were conducted on a comprehensive dataset originally compiled by Shtolz et al. [17] and subsequently processed to align with the requirements of our analysis. The processed dataset comprises five subsets, each encompassing a distinct range of gene order types, from 15 in the amphibian dataset to 52 in the pisces dataset (See Additional File 1). This illustrates the extensive variability in gene composition and the notable diversity in gene order.
In terms of the composition of genes, the 122 types identified in the five datasets encompass a diverse range of gene rearrangements, involving deletions, duplications, and the inclusion of noncanonical genes. Specifically, 17 types were observed to deviate from the typical 37 mitochondrial gene configurations. The total number of genes was reduced to 36 for the six types in the four subsets because of the absence of certain genes. For example, trnP was missing from the mammal and pisces datasets, nad6 from the aves dataset, and atp8 from the amphibian dataset. Additionally, gene duplications are present, with the number of duplicated genes ranging from a single to four, thereby increasing the total number of genes to 38–41 in some types. Notably, despite the absence of certain genes, the total number of genes of some types remained at 37 due to concomitant gene duplications or the addition of noncanonical genes.
With respect to gene order, in addition to inversion and transposition, we had to consciously distinguish long-distance transposition, which was present in all five datasets. The weighting capability of qGO through partitioning made it possible to differentiate between genes that were long-range migrants versus those that only exchanged positions with neighboring genes. By testing and comparing multiple partitioning strategies, a consistent partitioning scheme was applied to all five datasets. This involves the partitioning of trnN and trnY. Genes distributed across regions in the dataset are assigned a weight to increase their RF scores. The proportion of genes with a weight of 2 in the five datasets was 23.83%, with the highest proportion observed in the pisces dataset (51.36%) and the lowest in the mammalian dataset (1.19%).
We initially conducted a quantitative analysis of the aforementioned datasets via the qGO approach. This requires a homologous comparison of the datasets. To assess the efficacy of the algorithm more accurately, each subset was manually aligned. The length of the alignment exhibited considerable variation, ranging from 38 sites in the mammalian dataset to 57 sites in the pisces dataset (See Additional File 1). This observation underscores the distinctive characteristics of each dataset and the anticipation of heterogeneity in the distribution of the resultant values. As illustrated in Fig. 3h, there is a notable degree of variability in the distributional characteristics of RS across the five datasets (See Additional File 3). In particular, the RS distributions of the datasets of monophyletic mammals and aves both exhibited a single peak under qGO measurements. In contrast, the distributions of both paraphyletic pisces and reptiles exhibit bimodal features, which is consistent with the heterogeneity or discontinuity that may be implied by their being concurrent groups. Notably, despite the monophyletic nature of amphibians, their gene rearrangements are highly diverse. Recent studies have demonstrated that they exhibit multiple ground patterns (Xiao et al., under review), which is consistent with the non-monomodal distribution of RS obtained under qGO quantification. Furthermore, qGO enables the comparison of RS between pairs of types (See Additional File 2 for the original data, visualized as Fig. 3a-e), which not only provides a more intuitive representation of the differences in rearrangement intensity between different types but also allows for better visualization of the bias patterns of gene rearrangements in different groups. In other words, qGO provides an accurate quantification of the various rearrangement types, thus serving as an effective proxy for the diversity of a taxon and characterizing its diversity.
Fig. 3.

Visualization and comparison of RS values
a-e Heatmaps visualizing the RS values (RS, rearrangement score, used to quantify the strength of gene rearrangement) of the mammalian, amphibian, aves, reptile and pisces datasets from the qGO analysis. The multiplication below each class name represents the size of the data matrix generated by homology comparison. The first number indicates the number of types, whereas the second number indicates the number of sites. The source data can be found in Additional File 2. g-h Distributions of the RS values for the five datasets calculated via the two different methods. The source data can be found in Additional File 3
The same dataset was subsequently subjected to the qMGR algorithm, and the RF percentage obtained from the web page was converted to RF after undergoing the requisite calculations, as detailed in the original Fig. 1. Then the value was compared with the score obtained from the qGO algorithm (See Additional File 4 for the original data, visualized as Fig. 4). While the two methods exhibited a comparable pattern in evaluating the overall trend of RF alterations, notable discrepancies were observed in the scores assigned to individual genes.
Fig. 4.

Comparison of RF values by qGO and qMGR. This figure presents a comparison of the gene rearrangement frequency (RF) obtained via two methods: qGO (blue line) and qMGR (red line). The horizontal axis represents the gene names, whereas the vertical axis displays the RF values. The left side of the vertical axis corresponds to the RF values obtained via qGO, and the right side corresponds to the RF values obtained via qMGR. By comparing the heights of the blue and red lines for each gene, differences or similarities in the RF values obtained via the two methods can be observed
In the mammalian dataset, the discrepancy was especially evident in the case of the atp6-cox3-trnG gene cluster. The RF values of the three form a small triangle (See Fig. 4a, highlighted with purple bars) under the qMGR algorithm. However, in the gene alignment, the gene cluster atp6-cox3-trnG is, in fact, situated within the string from trnD (Site 12) to nad6 (Site 28), which maintains sequential consistency across all 22 types. However, in one of these types, at site 17, nad1 is present instead of cox3. Logically, the duplicated nad1 should have been scored instead of the missing cox3 (it is notable that this anomaly is likely attributable to a data error). Moreover, another type involves the insertion of trnW at site 18, which gives rise to gaps in other types at this site. As anticipated, trnW was scored instead of cox3 or trnG on either side. Nevertheless, as mentioned in the introduction as Case 1, the qMGR algorithm is unable to assign scores directly to target genes (Such as nad1 or trnW in this case), and its score is based on the sum of neighboring genes. As a result, scores are assigned to the two neighboring genes (atp6 and trnG) that have not undergone any rearrangement. This results in an RF value for the three genes forming a small triangle. A comparable triangle is observed in the amphibian dataset for the trnK-atp8-atp6 gene and in the avian dataset for the nad4-trnH-trnS1 gene.
In amphibians, a clear distinction can be observed in the tRNA cluster WANCY. This cluster involves long-distance transposition of tRNAW, an inversion of both trnN and trnY, and no rearrangement of trnA and trnC. In other words, the rearrangements occur at specific intervals. In the qGO algorithm, all these genes were scored accordingly, resulting in the formation of a multipeak fold (See Fig. 4b, highlighted with a purple bar). The qMGR algorithm, however, was unable to assign scores accurately to the target genes, leading to a situation where each gene in the aforementioned clusters, which exhibited rearrangements at intervals, received approximately equivalent scores. A comparable scenario is observed with respect to the tRNA cluster WANCY in the pisces dataset (Fig. 4e). In the simplest scenario, where only one gene is subject to Case 1, genes that have not undergone rearrangements are scored on the basis of the flanking genes. An illustrative example can be observed in the multiple tRNAs in the reptilian dataset (Fig. 4c).
Case 2 (yellow bars) often occurs in conjunction with Case 1. For example, the cox3 gene in the mammalian dataset and the trnV gene in that of aves have not undergone any rearrangements but are overestimated owing to the presence of deletions or noncanonical genes in their flanking sites. The qMGR algorithm accumulates the scores of these deletions or extra genes to the corresponding genes in the reference genome, resulting in an overestimation of the corresponding gene.
In addition to the aforementioned overestimation issue, there are also genes that can be influenced by Case 3, resulting in an underestimation (Fig. 4c, highlighted with blue bars). This includes the nad6 in the average dataset. The qMGR algorithm is based on the principle of scoring neighboring genes. However, when genes form a cluster and move as a whole, qMGR is unable to score genes in the middle of the gene cluster effectively. This is because the neighboring genes on either side of the middle gene remain unchanged (it is worth mentioning that the overestimation resulting from Case 1 partially compensates for the underestimation produced by Case 3). Additionally, with respect to trnP and trnE situated at the extremities of the gene cluster, qMGR is only capable of scoring the outer neighboring genes, which results in an underestimation of the entire cluster.
Finally, the weighted scoring system excels in effectively managing complex rearrangements, particularly those involving long-distance transpositions. In the context of qGO evaluation, such genes attain relatively high scores. Conversely, qMGR regards these genes as equivalent to those undergoing only short-distance shifts or in situ reversals, assigning them identical scores. This clearly underestimates the relative difficulty for genes to undergo long-distance transpositions (Case 4, highlighted with green bars). For example, there is a possibility of underestimation for nad4L in the pisces dataset (Fig. 4e) and trnW in the amphibian dataset (Fig. 4b). Furthermore, the gene cluster WANCY in the pisces dataset is impacted by both Case 1 and Case 4, leading the qMGR to overestimate all genes within this cluster indiscriminately. In contrast, the scores generated by qGO present an irregular folded line, allowing for precise distinctions between trnACY, which involves long-distance transposition spanning 19 genes, and trnN, which primarily undergoes in situ rearrangements. In other words, qGO facilitates an objective consideration and differential evaluation of the varying difficulties associated with different rearrangements.
In conclusion, the prevalence of gene duplications, deletions, and nonstandard genes within these datasets exceeds the processing capacity of the current qMGR analysis method, thereby compromising the accuracy of the analysis results. qGO algorithms, as alternatives, perform better in terms of accuracy and interpretability. First, the robust comparison framework is based on homologous comparisons, which allows for more precise calibration. Second, the partitioning strategy markedly enhances the resolution of the quantitative analysis, facilitating the identification of subtle patterns and variations that may otherwise be overlooked in more detailed analyses. Moreover, the incorporation of a weighting strategy improves the precision and accuracy with which the data are represented. Consequently, qGO is capable of addressing intricate rearrangements at a more granular level, thereby facilitating a more comprehensive evaluation of their dynamics.
Conclusion
Understanding evolutionary relationships and dynamics in comparative genomics and evolutionary biology is crucial, with the calculation of genomic rearrangement distances playing a vital role in this process. However, the existing computational methods have several limitations. For example, the representative qMGR algorithm can only calculate pairwise comparisons with reference sequences, which limits the understanding of relationships between sequences beyond the benchmark sequences under consideration and biases the results due to its scoring strategy. Moreover, the scalability of the calculation becomes problematic as the number of sequences increases.
The qGO algorithm applies a holistic approach to distance computation to address these limitations, generating a complete matrix of rearrangement distances. This matrix contains distance information between all pairwise compared genomic sequences, providing a global view of the genomic relationships in the dataset. Moreover, the method is based on the homology of gene order, which can more accurately characterize the diversity of genome organization by partitioning gene clusters and individually assigning weights to genes spanning different regions. Numerous experiments have shown that the new method compensates for the errors and shortcomings of existing algorithms. It is also convenient to individually assign weights to gene clusters with different rearrangement strengths in the framework of the qGO method, which is beneficial for advancing comparative genomic research. In addition, the method is scalable, supporting its potential application for biology in general.
Considering that the dataset used in this paper contains annotation errors, it is necessary to verify it manually to ensure high-quality genome assembly and annotation. Additionally, the data sources are not sufficiently comprehensive. Next, we plan to improve our method in the following three aspects: (1) To construct specialized databases to analyze large amounts of data, establish new models, and further quantify other characteristics of genome structure. (2) To make the partitioning rules in this paper more reasonable and propose reliable or alternative partitioning schemes on the basis of more experiments and studies to increase the scalability of qGO. (3) Currently, homology matching is performed manually. There is an urgent need to study automated homology alignment algorithms.
Supplementary Information
Acknowledgements
We are profoundly indebted to Professor Senping Luo for the invaluable insights he generously shared during the conceptualization of this research. The authors thank Hang Lu, Yi Xiao, and all members of the lab for their assistance and Vesna Lavric for her help polishing the language. We thank the anonymous reviewers for their careful reading and many constructive comments.
Abbreviations
- RS
Rearrangement score
- RF
Rearrangement frequency
- DFS
Depth-first search
Authors’ contributions
HS supervised the entire work. SY wrote and revised the first draft of the manuscript and implemented the algorithm. MW organized the dataset. GN initiated and designed the study. All authors participated in the revision of the manuscript, read and approved the submitted version.
Funding
This work was supported by the National Natural Science Foundation of China (No. 62062039, 31970447 and 32370500).
Data availability
Data is provided within the manuscript or supplementary information files.
Declarations
Ethics approval and consent to participate
Not applicable.
Consent for publication
Not applicable.
Competing interests
The authors declare no competing interests.
Footnotes
Publisher’s Note
Springer Nature remains neutral with regard to jurisdictional claims in published maps and institutional affiliations.
Haihe Shi, Shuai Yang and Meicai Wei these authors contributed equally to this work.
References
- 1.Burger G, Gray MW, Franz Lang B. Mitochondrial genomes: anything goes. Trends Genet. 2003;19:709–16. 10.1016/j.tig.2003.10.012. [DOI] [PubMed] [Google Scholar]
- 2.Zardoya, R.: Recent advances in understanding mitochondrial genome diversity. F1000Res. 9, F1000 Faculty Rev-270 (2020). 10.12688/f1000research.21490.1. [DOI] [PMC free article] [PubMed]
- 3.Nosek J, Tomáška Ľ. Mitochondrial genome diversity: evolution of the molecular architecture and replication strategy. Curr Genet. 2003;44:73–84. 10.1007/s00294-003-0426-z. [DOI] [PubMed] [Google Scholar]
- 4.Formaggioni, A., Luchetti, A., Plazzi, F.: Mitochondrial genomic landscape: a portrait of the mitochondrial genome 40 years after the first complete sequence. Life (Basel). 11, 663 (2021). 10.3390/life11070663. [DOI] [PMC free article] [PubMed]
- 5.Ingman M, Kaessmann H, Pääbo S, Gyllensten U. Mitochondrial genome variation and the origin of modern humans. Nature. 2000;408:708–13. 10.1038/35047064. [DOI] [PubMed] [Google Scholar]
- 6.Dowton M, Cameron S, Dowavic JI, Austin A, Whiting M. Characterization of 67 mitochondrial tRNA gene rearrangements in the hymenoptera suggests that mitochondrial tRNA gene position is selectively neutral. Mol Biol Evol. 2009. 10.1093/molbev/msp072. [DOI] [PubMed] [Google Scholar]
- 7.San Mauro D, Gower DJ, Zardoya R, Wilkinson M. A hotspot of gene order rearrangement by tandem duplication and random loss in the vertebrate mitochondrial genome. Mol Biol Evol. 2006;23:227–34. 10.1093/molbev/msj025. [DOI] [PubMed] [Google Scholar]
- 8.Shi W, Gong L, Wang S, Miao X, Kong X. Tandem duplication and random loss for mitogenome rearrangement in symphurus (Teleost: Pleuronectiformes). BMC Genomics. 2015;16:355. 10.1186/s12864-015-1581-6. [DOI] [PMC free article] [PubMed] [Google Scholar]
- 9.Bernt M, Merkle D, Ramsch K, Fritzsch G, Perseke M, Bernhard D, Schlegel M, Stadler PF, Middendorf M. CREx: inferring genomic rearrangements based on common intervals. Bioinformatics. 2007;23:2957–8. 10.1093/bioinformatics/btm468. [DOI] [PubMed] [Google Scholar]
- 10.Bernt M, Merkle D, Middendorf M. An algorithm for inferring mitogenome rearrangements in a phylogenetic tree. In: Nelson CE, Vialette S, editors. Comparative Genomics. Berlin Heidelberg, Berlin, Heidelberg: Springer; 2008. p. 143–57. [Google Scholar]
- 11.Tesler, G.: GRIMM: genome rearrangements web server. 10.1093/bioinformatics/18.3.492. [DOI] [PubMed]
- 12.Bourque, G., Pevzner, P.A.: Genome-scale evolution: reconstructing gene orders in the ancestral species. https://pubmed.ncbi.nlm.nih.gov/11779828/. [PMC free article] [PubMed]
- 13.Oxusoff L, Préa P, Perez Y. A complete logical approach to resolve the evolution and dynamics of mitochondrial genome in bilaterians. PLoS ONE. 2018;13: e0194334. 10.1371/journal.pone.0194334. [DOI] [PMC free article] [PubMed] [Google Scholar]
- 14.Hao, F.: Algorithms for sorting signed genomes by multiple-operation rearrangements. PhD thesis, Shandong University (2011). https://kns.cnki.net/KCMS/detail/detail.aspx?dbcode=CDFD&dbname=CDFD0911&filename=1011170357.nh&v.
- 15.Zhang J, Kan X, Miao G, Hu S, Sun Q, Tian W. qMGR: A new approach for quantifying mitochondrial genome rearrangement. Mitochondrion. 2020;52:20–3. 10.1016/j.mito.2020.02.004. [DOI] [PubMed] [Google Scholar]
- 16.Campbell NJ, Barker SC. An unprecedented major rearrangement in an arthropod mitochondrial genome. Mol Biol Evol. 1998;15:1786–7. 10.1093/oxfordjournals.molbev.a025904. [DOI] [PubMed] [Google Scholar]
- 17.Shtolz N, Mishmar D. The metazoan landscape of mitochondrial DNA gene order and content is shaped by selection and affects mitochondrial transcription. Commun Biol. 2023;6:93. 10.1038/s42003-023-04471-4. [DOI] [PMC free article] [PubMed] [Google Scholar]
- 18.Pearson, W.R.: An introduction to sequence similarity (“homology”) searching. Curr Protoc Bioinformatics. Chapter 3, 3.1.1–3.1.8 (2013). 10.1002/0471250953.bi0301s42. [DOI] [PMC free article] [PubMed]
- 19.Long H. Multiple sequence alignment of biology based on evolutionary algorithms. Beijing: Tsinghua University Press; 2017. [Google Scholar]
- 20.Liu, G, Zhu, D, Jiang, H.: 1.5k-approximation algorithm for minimal weight of scorting signed genomes by reversals and transpositions. Journal of Chinese Computer Systems 31(7), 1452–1456 (2010). http://xwxt.sict.ac.cn/CN/Y2010/V31/I7/1452.
- 21.Eriksen N. (1+ε)-Approximation of sorting by reversals and transpositions. Theoret Comput Sci. 2002;289:517–29. 10.1016/S0304-3975(01)00338-3. [Google Scholar]
- 22.Phillips WS, Brown AMV, Howe DK, Peetz AB, Blok VC, Denver DR, Zasada IA. The mitochondrial genome of globodera ellingtonae is composed of two circles with segregated gene content and differential copy numbers. BMC Genomics. 2016;17:706. 10.1186/s12864-016-3047-x. [DOI] [PMC free article] [PubMed] [Google Scholar]
- 23.Hartmann T, Middendorf M, Bernt M. Genome rearrangement analysis: cut and join genome rearrangements and gene cluster preserving approaches. In: Setubal JC, Stoye J, Stadler PF, editors. Comparative Genomics. New York, New York, NY: Springer; 2018. p. 261–89. [DOI] [PubMed] [Google Scholar]
Associated Data
This section collects any data citations, data availability statements, or supplementary materials included in this article.
Supplementary Materials
Data Availability Statement
Data is provided within the manuscript or supplementary information files.