



Abstract
The evaluation of adult patients suspected of ST-segment elevation myocardial infarction (STEMI) includes a focused history and examination, 12-lead electrocardiogram (ECG), and cardiac serum marker analysis. The ECG plays a pivotal role in the early diagnosis and management of STEMI. A number of ECG entities in this patient population will present with ST-segment elevation and other electrocardiographic abnormalities which can mimic STEMI. In this article, we review the most frequent STEMI mimic patterns, highlight their ECG characteristics, and compare these individual ECG entities to the electrocardiographic abnormalities present with STEMI.
Keywords: Differential diagnosis, electrocardiogram, ST segment, T wave
Introduction
The approach to the adult patient with chest pain focuses on the recognition and treatment of life-threatening conditions, such as ST-segment elevation myocardial infarction (STEMI), other high-risk acute coronary syndrome (ACS) presentations, and a range of noncoronary ailments. Considering STEMI and other high-risk ACS presentations, the core emergency department (ED) evaluation includes a focused history and physical examination, serum markers, and the 12-lead electrocardiogram (ECG). The ECG plays a pivotal role in the early diagnosis and management of STEMI. In fact, the presence of anatomically oriented ST-segment elevation is required for the diagnosis of STEMI and also provides an indication for emergent reperfusion therapy, such as fibrinolysis or percutaneous coronary intervention (PCI).
The most recent definition of STEMI, published jointly by the American College of Cardiology (ACC), the American Heart Association (AHA), the European Society of Cardiology (ESC), and the World Heart Federation (WHF), has adjusted the prior ST-segment magnitude required for STEMI diagnosis with both age and gender considerations.[1] This revised electrocardiographic definition includes newly noted ST-segment elevation, at the J point, in two anatomically contiguous leads, meeting the following criteria:
In men, <40 years of age – ST-segment elevation ≥2.5 mm in leads V2 or V3 or ≥1 mm in any other lead
In men, ≥40 years of age – ST-segment elevation ≥2.0 mm in leads V2 or V3 or ≥1 mm in any other leads; and
In women, regardless of age – ST-segment elevation ≥1.5 mm in leads V2 or V3 or ≥1.0 mm in any other leads.
One important consideration is the statement “…lacking features of a noninfarction syndrome.” This statement addresses a significant challenge faced by emergency clinicians worldwide, namely the electrocardiographic identification of STEMI as well as the ECG recognition of this range of noninfarction syndromes, also referred to as the STEMI mimics. The STEMI mimics include a number of ECG presentations, including left ventricular hypertrophy (LVH) through voltage criteria with the strain pattern, left bundle branch block (LBBB), right ventricular paced rhythm (RVPR), benign early repolarization (BER), acute myocarditis/myopericarditis, and left ventricular aneurysm (LVA), among other entities [Figure 1].
Figure 1.

Electrocardiographic causes of ST segment elevation in adult chest pain patients in the prehospital and emergency department settings. EMS: Emergency medical service, ED: Emergency department, LVH: Left ventricular hypertrophy, LBBB: Left bundle branch block, STEMI: ST-segment elevation myocardial infarction, BER: Benign early repolarization, RBBB: Right bundle branch block, NSIVCD: Nonspecific intraventricular conduction delay[9]
When the emergency clinician considers the various etiologies of ST-segment elevation in the ED patient with chest pain, one must realize that approximately 60%–80% of these individuals ultimately are found to not be associated with STEMI [Figure 1] in other words, the electrocardiographic abnormalities are caused by a STEMI mimic pattern.[2,3] Importantly, these STEMI mimics frequently meet the electrocardiographic criteria for STEMI.[1] Herein lies one of the major clinical challenges of the emergency diagnosis of STEMI, the electrocardiographic distinction of STEMI from the various STEMI mimicking patterns.
ST-segment Elevation Myocardial Infarction
A brief review of the electrocardiographic abnormalities of STEMI [Figure 2] is indicated here. STEMI is defined electrocardiographically by at least two ECG leads demonstrating anatomically oriented ST-segment elevation of a certain amplitude. These two leads must be in the same anatomic segment, such as anterior (leads V1–V4), lateral (leads I, aVL, V5, and V6), or inferior (leads II, III, and aVF). The amplitude of the elevated ST-segment is dependent on age, gender, and specific ECG lead, as described by the revised definition of acute myocardial infarction (AMI) from the ACC/AHA/ESC/WHF.[1] The emergency clinician should be cautioned to consider ST-segment elevation of lower magnitudes (i.e., less than that described above) in patients with classic presentations for AMI, particularly early in the course of the infarction.
Figure 2.

Electrocardiogram (ECG) abnormalities in the ST-segment elevation myocardial infarction (STEMI) patient. (a) Convex ST-segment elevation morphology, very common in the acute myocardial infarction (AMI) patient, (b) Obliquely straight ST-segment elevation morphology, very common in the AMI patient, (c) Concave ST-segment elevation morphology, frequently seen early in the course of the acute infarction; this ST-segment elevation morphology, however, is much less common later in course of the AMI patient, (d) The hyperacute T wave of early STEMI, usually seen in the initial 5–30 min of STEMI; with the appropriate clinical presentation, the hyperacute T wave is considered a STEMI equivalent, (e) Reciprocal ST-segment depression, more commonly known as reciprocal change, is defined as ST-segment depression on the ECG of a patient with simultaneous ST-segment elevation. Its presence, in a patient with the appropriate clinical presentation, is strongly suggestive of STEMI. Note that the concept of reciprocal change cannot be used in the setting of left bundle branch block, right ventricular paced pattern, and the left ventricular hypertrophy via voltage pattern– the ST-segment depression seen in these patterns is not considered reciprocal change. STEMI: ST-segment elevation myocardial infarction
The elevated ST-segment in STEMI can assume three different morphologies, including convex, obliquely straight, and concave [Figure 2a-c]. Both convex and obliquely straight morphologies are very common in STEMI while the concave contour is encountered less frequently; of note, the concave pattern can be seen in STEMI patients, particularly very early in the course of the acute infarction.[2,4] Nonetheless, a concave pattern of ST-segment elevation can be used to exclude STEMI, when employed in conjunction with other features of the clinical presentation which do not suggest AMI. In fact, a nonconcave elevated ST-segment morphology (either convex or obliquely straight) is highly specific for STEMI while a concave contour is similarly specific for a STEMI mimic.[2] The emergency clinician should also consider the hyperacute T wave [Figure 2d] as an early indication of STEMI, again assuming that other features of the clinical presentation suggest AMI.
Finally, two other important electrocardiographic features can be potentially useful in situations involving difficult electrocardiographic distinction of STEMI from the STEMI mimics, including the presence of reciprocal ST-segment depression [Figure 2e] and serial ECGs demonstrating the dynamic nature of the ST segment/T-wave abnormalities, both of which are present in STEMI and can be useful in considering the ultimate ECG diagnosis. Reciprocal ST-segment depression, also known as reciprocal depression or reciprocal change, is defined as ST-segment depression occurring in one ECG lead on an ECG which also demonstrates ST-segment elevation; this concept cannot be used in patients with LBBB, RVPRs, and LVH with strain (via voltage criteria). The presence of reciprocal ST-segment depression in this instance provides a very high degree of certainty that the ST-segment elevation is produced by STEMI. The dynamic nature of the ECG in early STEMI can also be used as a diagnostic aid. Realizing that early the ECG in STEMI produces ST segment and T-wave abnormalities which are dynamic and can evolve over very short periods of time (i.e., minutes–hours), serial ECGs can be used to demonstrate this rapid change and thus “rule-in” STEMI; conversely, the absence of change over a short period of time (i.e., minutes–hours) can suggest a STEMI mimic.
Differential Diagnosis of Nonacute Coronary Syndrome Causes of ST Segment/T-Wave Abnormalities
The electrocardiographic differential diagnosis of ST-segment elevation in the adult chest pain patient suspected of ACS is quite broad; of note, it is important to realize that the entities in this differential diagnosis all meet the electrocardiographic criteria for STEMI… and yet, STEMI represents a minority of these presentations, ranging from 20% to 40% of these patients.[2,3] A list of the differential diagnosis [Figure 1] includes LVH with strain pattern, LBBB, RVPR, BER, acute myocarditis/myopericarditis, and LVA, among other entities.
Left Ventricular Hypertrophy Pattern
LVH by voltage criteria is a leading a cause of ST-segment elevation encountered in the ED and is associated with “negative” (i.e., no evidence of acute coronary occlusion) cardiac catheterization.[5,6,7] In fact, the LVH pattern is the most common cause of ST-segment elevation among ED patients with chest pain.[2,3] In the setting of chronic hypertension, the left ventricle undergoes anatomic remodeling with increased muscle mass, and resultant electrical remodeling with larger amplitude QRS complexes.[8]
The resultant increased muscle mass of the left ventricle, manifested by larger amplitude QRS complexes, causes in an increased negative amplitude of the S-wave in leads V1–V4 and an accompanying positively deflected ST segment in these same leads.[9] The lateral leads, leads V5 and V6, will have the opposite findings with a large, positively deflected R-wave and associated ST depression.[9] In other words, the ST segment will be discordant with (opposite the isoelectric line from) the dominate component of the QRS complex. The Sokolow–Lyon criteria can be used to diagnose electrocardiographic LVH pattern; these criteria include the following: S-wave in lead V1 + R wave in lead V5 or V6 >35 mm or R wave in lead V5 or V6 >26 mm.[10] Approximately 80% of patients with the LVH by voltage pattern will demonstrate the so-called “strain pattern;” the strain pattern is defined as ST segment and T-wave abnormalities related to the LVH pattern. The strain pattern produces ST-segment elevation in leads with negatively oriented QRS complexes and ST-segment depression with T-wave inversion in leads with positively oriented QRS complexes. The elevated ST-segment is noted to be concave in contour while the depressed ST segment is asymmetric, with a gradual downslope fusing with the inverted T wave and an abrupt return to the baseline [Figure 3].[11]
Figure 3.
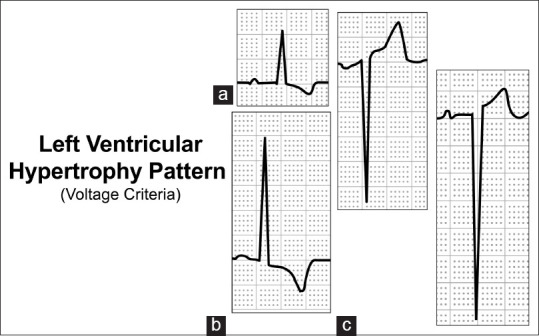
The ST-segment and T-wave abnormalities seen in left ventricular hypertrophy pattern (LVH) via voltage. Note that the ST-segment and T-wave abnormalities seen in LVH via voltage are seen in approximately 80% of patients with this pattern and are referred to as the strain pattern. (a) Asymmetric, down sloping ST-segment depression, fusing with an inverted T wave in lead I, (b) Asymmetric, down sloping ST-segment depression, fusing with an inverted T wave in lead V6, (c) Concave morphology ST-segment elevation in the LVH patient, commonly seen in leads V1–V4. Note ST-segment–T wave complex is directed opposite the primary direction of the QRS complex. Note that the ST-segment–T-wave complex is directed opposite the primary direction of the QRS complex. It is important to note that the modified Sgarbossa criteria is not applicable in the LVH with strain pattern. Yet, the anticipated relationship of the ST segment and T wave is directed opposite of the primary polarity of the QRS complex
Unlike the dome or “tombstone-“ shaped ST-segment elevation found in STEMI [Figure 4], the positively deflected ST segment in LVH will usually have a concave appearance as judged from the top of the page (i.e., a “smile” or “teacup-“ shaped appearance). The ST elevation is typically <3 mm in amplitude,[7,8,12] but can be as high as 5 mm.[9] An important distinction between STEMI and ST-segment elevation due to LVH is that the latter will not manifest dynamic changes. Of note, patients with the LVH pattern are at increased risk for cardiovascular disease and can present with a STEMI. A prior ECG can be immensely helpful in discerning whether ST-segment elevation in in the setting of LVH could coexist with those ST-segment elevation caused by STEMI.
Figure 4.

A comparison of the elevated ST segment in left ventricular hypertrophy (LVH) and ST-segment elevation myocardial infarction (STEMI). Note the concave morphology of the elevated ST segment in LVH as compared to STEMI with the convex and obliquely straight morphologies of ST-segment elevation. Furthermore, note the large amplitude of the negatively oriented QRS complex in the LVH patient. STEMI: ST-segment elevation myocardial infarction
Left Bundle Branch Block
LBBB is another common cause of ST-segment elevation among ED chest pain patients; in fact, it is the second most frequently encountered form of noninfarction ST-segment elevation. LBBB is rather common among the ED chest pain patient, which is unfortunate for several reasons: (1) LBBB is a marker of significant heart disease with extreme risk of acute cardiovascular complication and death in patients with ACS; and (2) LBBB markedly reduces the diagnostic power of the ECG in the evaluation of potential ACS.
The concept of appropriate discordance predicts the normal ST-segment–T-wave findings [Figure 5]; this “rule” notes that the ST segment and T wave are directed opposite of the primary portion of the QRS complex.[12] In leads with a negatively oriented QRS complex, ST-segment elevation with upright T-wave is noted while, in leads with positively directed QRS complexes, the ST segment is depressed with an inverted T-wave. This relationship translates into the following ST-segment and T-wave configurations:
Figure 5.
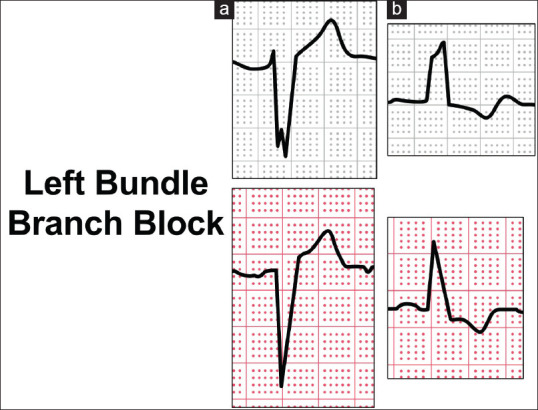
The anticipated electrocardiogram findings in the patient with uncomplicated left bundle branch block (LBBB). In general, the anticipated findings in LBBB are described as follows: The ST segment–T wave complex is directed opposite (i.e., discordant) to the primary direction of the QRS complex. (a) Discordant ST-segment elevation with upright T wave, (b) Discordant ST-segment depression with inverted T wave
In leads V1 and V2, a wide, primarily negative QS or rS complex is noted with ST segment elevation and prominent T waves; the ST-segment elevation ranges from minimal (1 to 2 mm) to very prominent (<5 mm) and is proportional to the size of the QRS complex [Figure 5]; and
In leads I, aVL, V5 and V6, a positive, monophasic R wave is encountered with the ST-segment depression and T-wave inversion, again with the magnitude of the depression proportional to the size of the QRS complex [Figure 5a and b].
It is important to recognize the anticipated ST-segment and T-wave configurations of uncomplicated LBBB [Figures 5 and 6] such that the clinician can identify inappropriate abnormalities, suggestive of ACS. Briefly, these unanticipated abnormalities of the ST segment/T wave include ST segment deviation located on the same side of the primary portion of the QRS complex (i.e., concordant ST-segment changes) and/or disproportionate ST-segment deviations, located opposite the major, terminal portion of the QRS complex (excessive discordant ST-segment changes). These abnormal findings are described by the modified Sgarbossa rule.[13]
Figure 6.

A comparison of the elevated ST segment in left bundle branch block (LBBB) and ST-segment elevation myocardial infarction (STEMI). Note the concave morphology of the elevated ST segment in LBBB as compared to STEMI with the convex and obliquely straight morphologies of ST-segment elevation. In addition, note the widened QRS complex, typical of bundle branch block. STEMI: ST-segment elevation myocardial infarction
Right Ventricular Paced Rhythm
The RVPR is another electrocardiographic entity which will produce ST-segment and T-wave changes which can lead the unwary clinician in the wrong diagnostic-therapeutic direction. Similar to the LVH and LBBB patterns, the RVPR reduces the ECG’s ability to detect AMI and is thus considered a confounding ECG pattern as well. In addition to its confounding effect, the right ventricular paced pattern also mimics the ECG findings of AMI and other more significant ACS presentations. Recognition of the anticipated electrocardiographic findings in RVPR is vital, allowing the clinician to identify the unanticipated findings of acute pathology, such as AMI. In the uncomplicated RVPR, the anticipated ECG findings are as follows [Figure 7]:
Figure 7.

The anticipated electrocardiogram findings in the patient with uncomplicated right ventricular paced pattern. In general, the anticipated findings in right ventricular paced pattern are described as follows: The ST-segment–T wave complex is directed opposite (i.e., discordant) to the primary direction of the QRS complex. (a) Discordant ST-segment depression with inverted T wave, (b) Discordant ST-segment elevation with upright T wave. In both “A” and “B,” note the widened QRS complex and pacer spike
-
A broad, mainly negative QRS complex with a QS configuration in leads V1–V6
- R waves are usually absent yet can appear in leads V5 and/or V6
A large monophasic R wave in leads I and aVL and occasionally in leads V5 and/or V6; and
Negatively oriented QRS complex in leads II, III, and aVF with QS configurations.
The concept of appropriate discordance describes the anticipated ST segment – T-wave configurations, relative to the QRS complex polarity. The anticipated ST segment – T-wave configurations are discordant, directed opposite from the terminal portion of the QRS complex, similar to the electrocardiographic principles applied in the setting of LBBBs. The anticipated ST-segment – T-wave configurations are as follows [Figures 7 and 8]:
Figure 8.
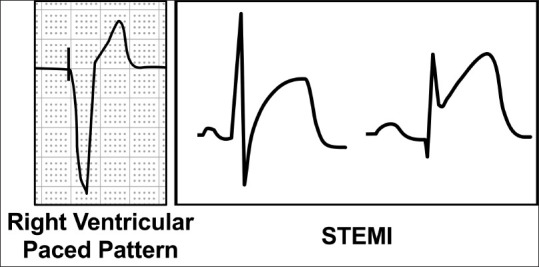
A comparison of the elevated ST segment in right ventricular paced pattern and ST-segment elevation myocardial infarction (STEMI). Note the concave morphology of the elevated ST segment in right ventricular paced pattern as compared to STEMI with the convex and obliquely straight morphologies of ST-segment elevation. In addition, note the widened QRS complex, typical of a right ventricular paced pattern as well as the pacing spike, immediately prior to the QRS complex. STEMI: ST-segment elevation myocardial infarction
-
Leads with primarily negative QRS complexes (i.e., QS complexes) will demonstrate ST-segment elevation with an upright T wave
- As noted in inferior leads (II, III, and aVF) and entire precordial leads (V1–V6); and
-
Leads with primarily positive QRS complexes (i.e., large R wave) demonstrate ST-segment depression with T-wave inversion
- As noted in leads I, aVL, and occasionally leads V5 and V6.
As with the LBBB electrocardiographic presentation, it is important to recognize the anticipated ST-segment and T-wave configurations of uncomplicated RVPR, such that the clinician can identify inappropriate abnormalities, suggestive of AMI or other forms of ACS [Figure 8]. The modified Sgarbossa criteria is also applicable in the ECG evaluation of the RVPR presentation. These unanticipated abnormalities of the ST-segment-T wave include ST-segment deviation located on the same side of the primary portion of the QRS complex (i.e., concordant ST-segment changes) and/or disproportionate ST-segment deviations, located opposite the major, terminal portion of the QRS complex (excessive discordant ST-segment changes). These abnormal findings are described by the modified Sgarbossa rule.[14]
Benign Early Repolarization
BER is responsible for approximately 10% of ST-segment elevation presentations in the adult ED patient with chest pain. The term, BER, describes a normal variant presentation in which the ST segment is elevated at the J point, most frequently in the precordial leads; some clinicians refer to this ECG entity as a “high take-off” pattern, meaning that the J point is elevated with initiation of the ST segment at this elevated position. In addition, this entity is benign; patients who demonstrate BER-related ST-segment changes have normal lifespans and no greater occurrence of cardiovascular disease than those individuals who do not have BER. Lastly, the term “early repolarization” is a misnomer; the repolarization cycle seen in these patients is similar to those individuals who do not demonstrate BER-related changes; the exact cause of the elevated ST segment is not known.
BER is a common finding in the general population with a prevalence noted to be 1%.[15] It is found very frequently in younger male patients, as noted in a review of 6014 male military recruits, noting that 91% had ST-segment elevation of up to 3 mm in at least one precordial lead.[16] The “most typical” patient with BER is a young adult male of African American descent; the least common patient is an older white female. BER is uncommon in patients over age 50 years of age.[7,9] BER is at times confused with STEMI; it is a common cause of false positive STEMI activation of the catheterization laboratory among patients with ultimately “negative” evaluations for AMI.[17]
BER demonstrates a characteristic ECG presentation. Essentially, the ST segment is elevated at the J point, most often in the precordial leads [Figure 9]; it appears as if the ST segment has been evenly lifted off the electrocardiographic baseline with preservation of the normal concavity of the ST segment–T-wave complex. The electrocardiographic criteria include the following [Figure 9]:
Figure 9.
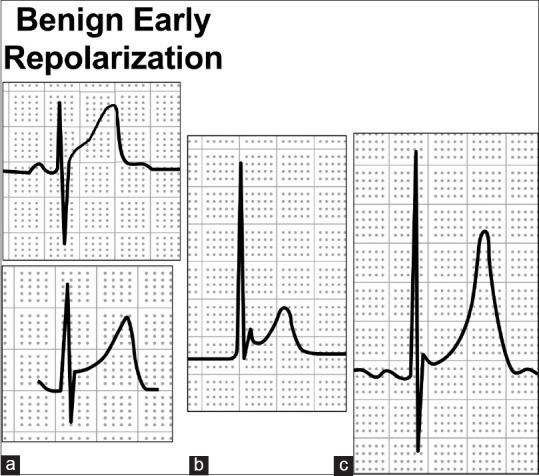
Electrocardiogram findings of benign early repolarization. (a) Concave morphology ST-segment elevation. In both examples, it appears that the ST segment has been lifted evenly off the baseline at the J point, with preservation of the concave ST segment, (b) Concave morphology ST segment. Also note irregularity of the J point, a finding which is strongly suggestive of benign early repolarization, (c) Prominent T wave and concave morphology ST segment; T waves can be very prominent, particularly in leads V2–V4. J point irregularity is also noted
Upward concavity of the initial portion of the elevated ST segment
Slurring or notching of the QRS complex at the J point
Prominent asymmetric T waves, concordant with the QRS complex (except in V1–V2 where there should be a prevailing S wave)
Widespread distribution of the ST-segment elevation, usually in the precordial leads and occasionally involving both the precordial leads and the limb leads (note that isolated BER in the limb leads is very uncommon); and
Relative temporal stability of the pattern (i.e., does not change over short periods of time).[9,18]
Additional electrocardiographic features, as described by Macfarlane et al., include the three criteria:
QRS complex slurring or notching (i.e., J wave) on the downslope of an R wave; occurring above the isoelectric line
Peak of the J wave >0.1 mV in two or more leads (except V1–V3); and
QRS complex duration <120 ms.[19]
The morphology of the ST-segment elevation in BER is concave, whereas the contour of elevated segment is convex or obliquely straight [Figure 10]; this distinction, however, has only a 77% sensitivity for STEMI yet the finding is very specific for acute infarction.[2,20]
Figure 10.

A comparison of the elevated ST segment in benign early repolarization (BER) and ST-segment elevation myocardial infarction (STEMI). Note the concave morphology of the elevated ST segment in BER as compared to STEMI with the convex and obliquely straight morphologies of ST-segment elevation. STEMI: ST-segment elevation myocardial infarction
The distribution of ST-segment elevation is as follows: (1) precordial leads– most frequent distribution pattern, seen in the majority of patients (60%) with BER, (2) precordial and limb leads – seen in approximately 30% of patients; and “isolated” in the limb leads – no precordial involvement, seen in only 5% of patients. The ST-segment elevation is usually <2.0–3.0 mm in magnitude with a range of 0.5–5.0 mm in the precordial leads.[9] If the limb leads are involved, the magnitude of the elevation is much lower, ranging from 0.5 to 1.0 mm; lead II usually has larger magnitude than lead III; in contrast, with inferior STEMI-related ST-segment elevation, lead III usually has greater elevation compared to lead II.[7,21] The T waves, particularly in leads V1–V4, are frequently quite prominent, with heights approaching 6.5 mm in precordial leads and 5.0 in the limb leads.[9]
A caveat must be noted regarding BER and its distinction from early repolarization syndrome or “J wave syndrome” which is associated with sudden cardiac death. In the J wave syndrome, the J waves appear as prominent deflections at the terminal portion of the QRS complex, similar to the Osborne waves of hypothermia; in addition, the ST-segment changes are usually isolated to the inferior leads.[22]
Myocarditis/Myopericarditis
Acute myocarditis/myopericarditis, yet another cause of noninfarction ST-segment elevations, thus representing yet another STEMI mimic; acute myocarditis/myopericarditis presents most often with chest pain accompanied by various electrocardiographic changes, including ST segment and T-wave abnormalities. Significant ST-segment elevation can be seen in up to 70% of patients, representing the STEMI mimicking presentation.[23] In fact, the challenge of diagnosing myocarditis can be demonstrated by the number of patients who receive cardiac catheterization for a presumed STEMI, only to find myocarditis as the ultimate diagnosis.[24]
The inflammatory process produces ST segment and related electrocardiographic changes, along with various symptoms such as chest pain along with cardiac dysfunction (acute heart failure, shock, dysrhythmias) in severe cases. Acute myocarditis/myopericarditis involves inflammation of the myocardium and/or the pericardium with associated symptoms related to cardiac dysfunction; the inflammatory process can affect all layers of myocardium to include the conduction system that will affect the ECG.
Acute myocarditis/myopericarditis is most often secondary to a viral, autoimmune, or idiopathic process.[25] Common viruses include influenza, coronavirus, and parvovirus B19. Common autoimmune-driven processes can involve lupus, vaccines, and drug reactions.[26] Recall that pericarditis (i.e., without myocardial involvement) does not present with ECG abnormalities in that the pericardium is electrically silent. Myocarditis/myopericarditis is a cause of noninfarction ST-segment elevation, among other ECG findings, thus representing yet another STEMI mimic.
The most common ECG presentation of acute myocarditis/pericarditis is sinus tachycardia with nonspecific ST-segment–T-wave abnormalities. Early-stage acute myocarditis/myopericarditis presents electrocardiographically with ST-segment elevation and PR segment depression [Figure 11].[27] The ST-segment elevation, the most prominent electrocardiographic feature, is usually <5 mm in magnitude, concave in morphology, and widespread in distribution. The magnitude of ST-segment elevation usually ranges from 2.0 to 4.0 mm in height; ST-segment elevation >5 mm is unusual. The morphology of the elevated ST segment is most frequently concave in shape, in contrast to the convex or obliquely straight morphologies of STEMI [Figure 12]. ST-segment elevation is usually widespread, noted in the following electrocardiographic leads: I, II, III, aVL, aVF, and V2–V6-essentially, all leads except leads aVR and V1; “reciprocal” ST-segment depression is seen in lead aVR and occasionally in lead V1. The ST-segment elevation is most often seen in many leads simultaneously though it may be limited to a specific anatomic segment if the process is focal; if focal inflammation is present, the inferior wall is often involved with leads II, II and aVF commonly affected.
Figure 11.

Electrocardiogram abnormalities encountered in some patients with acute myocarditis/myopericarditis. (a) ST-segment elevation with PR segment depression, (b) Pronounced ST-segment elevation with subtle PR segment depression, (c) Spodick’s sign, down sloping TP segment, seen in some patients with acute myopericarditis
Figure 12.

A comparison of the elevated ST-segment in acute myocarditis/myopericarditis and ST-segment elevation myocardial infarction (STEMI). Note the concave morphology of the elevated ST segment in myocarditis as compared to STEMI with the convex and obliquely straight morphologies of ST-segment elevation. In addition, note the PR segment depression in myopericarditis. STEMI: ST-segment elevation myocardial infarction
PR segment abnormality [Figure 11a and b], resulting from atrial inflammation, is a highly suggestive electrocardiographic feature of early-stage I acute myocarditis/myopericarditis. PR segment depression is described as “almost diagnostic” and is best observed in the lateral precordial (V5 and V6) and the inferior (II, III, and aVF) leads. “Reciprocal” PR segment elevation is seen in lead aVR; in many cases, this finding is in fact more obvious to the clinician compared to PR segment depression.
T-wave inversion, a later stage electrocardiographic manifestation, is usually transient. The T-wave inversions most often occur in the leads which had recently manifested early-stage ST-segment elevation. The magnitude and morphology of the inverted T wave are nonspecific. The inverted T waves are usually of normal amplitude with symmetric initial (down sloping) and final (up sloping) limbs– characteristics which can be confused with an ACS presentation. Additional electrocardiographic findings may be noted in patients with different presentations, such as myocarditis/myopericarditis with pericardial effusion (widespread diminished electrical forces with smaller QRS complexes and electrical alternans). With increasing involvement of the myocardium, a more pronounced version of myocarditis is encountered. Recall that myopericarditis must often only involves epicardial irritation; in this instance, a more extensive form of myocarditis is active, which can manifest with Q waves, bundle branch block, and dysrhythmias).
A range of other electrocardiographic abnormalities, including both malignant rhythms and abnormal QRS, ST segment, and T-wave issues have been noted.
When a patient presents with chest pain and ECG changes, particularly ST-segment elevation, it can be difficult to differentiate a STEMI from myocarditis/myopericarditis. Electrocardiographic clues can assist in this differentiation. Reciprocal ST depression is more commonly found with STEMI as compared to nonischemic causes. PR segment depression suggests myocarditis/myopericarditis.[28] The PR depression seen in pericarditis should be present in multiple leads. The presence of ST-segment depression and the absence of PR segment depression have been found to be more indicative of STEMI.[29] STEMI is more likely if there is (1) Reciprocal ST-segment depression (with the exception of lead V1 or lead aVR) or, (2) ST-segment elevation in lead III greater than in lead II.[30]
Although myocarditis and pericarditis can have changing electrocardiographic abnormalities including ST-segment morphologic alterations, the changes are usually over a longer period of time rather than minutes–hours as in an STEMI. Performing serial ECGs and noting dynamic changes can be suggestive of STEMI.[9]
Other ECG abnormalities can distinguish acute myocarditis/myopericarditis from STEMI. The degree of ST-segment elevation can assist with identification. With inferior ST-segment elevation, the elevation in acute myocarditis/myopericarditis rarely exceeds 5 mm.[7] The presence of any ST-segment depression in lead aVL is highly sensitive for acute coronary occlusion and thus STEMI.[31] Spodick’s sign [Figure 11c], down sloping of the TP segment between consecutive P-QRS-T cycles (best seen in leads II, V5, and V6), is strongly suggestive of acute myocarditis/myopericarditis.[32]
Left Ventricular Aneurysm
LVA is responsible approximately 5% of ST-segment elevation in adult ED patients being evaluated for acute chest pain. Persistent ST-segment elevation after an AMI is thought to be related to the formation of a LVA. LVA is a late complication has long been defined as an area of systolic dyskinesia with paradoxical bulging related to localized area of infarcted myocardium.[33] The pathophysiological basis of the aneurysm leading to persistent elevation has been questioned as of late, and it has been suggested that the persistent ST-segment elevation after anterior wall myocardial infarction is related to transmural necrosis with persistent microvascular damage rather than the aneurysmal dilation leading directly to electrical conduction changes of the myocardium.[34] The incidence of LVA has decreased in recent years, thought to be a result of the early identification and reperfusion treatment of coronary occlusion in STEMI.[34] Of the patients with a persistent ST-segment elevation after PCI, 30% of patients will have an LVA.[35]
The elevated ST-segment [Figure 13] resulting from a LVA varies considerably, ranging from minimal (<1.0 mm) to maximal elevation (up to 5.0 mm). The morphology can assume all three contour types, including concave, convex, and obliquely straight. Of course, the distribution of the ST-segment changes is dependent on the aneurysm’s anatomic location.
Figure 13.

ST-segment elevation seen in the patient with left ventricular aneurysm (LVA). The ST-segment elevation ranges from minimal to maximal regarding magnitude of the elevation, as seen in these examples with progressively larger magnitude ST-segment elevation in (a-c). Also note the presence of large Q waves and small amplitude T waves in all three examples. The “ratio” of the amplitudes of the T wave relative to the negative component of the QRS complex is usually very low in the LVA patient
The electrocardiographic diagnosis of ST-segment elevation from a LVA can be difficult. If a prior ECG is available for review and demonstrates persistent ST-segment elevation, this comparison can greatly aid the diagnosis of LVA. If previous ECGs are not available, several electrocardiographic features exist that can aid in the distinction of LVA from STEMI. The ST-segment elevation of a ventricular aneurysm is most always associated with mature, fully developed Q-waves in the same. The thinning of the myocardium in the left ventricle after an evolved infarctions leads to Q-waves in the same distribution as the ST elevation. The ST elevations found with an aneurysm are often found in the precordial leads and the ST depressions are not found in the contralateral leads.[36,37] Smith proposed and validated a decision rule which holds that when the ratio of the T wave to the negative component of the QRS complex amplitude is >0.36, STEMI is more likely.[38] The use of this ratio as the sole discriminator is not encouraged yet, based on this relationship, a smaller amplitude T wave, accompanied by a large negative QRS complex, is most often seen in LV aneurysm as compared to STEMI. Reciprocal ST-segment depression is not usually encountered; dynamic ECG changes usually do not occur over relatively short periods of time.[9] A comparison of ST-segment elevation between LVA and STEMI is noted in Figure 14.
Figure 14.

A comparison of the elevated ST segment in left ventricular aneurysm (LVA) and ST-segment elevation myocardial infarction (STEMI). The ST segment can be elevated minimally or maximally in the LVA pattern; in addition, a large Q wave is usually present in LVA, accompanied by a small amplitude T wave, which can be either upright or inverted. STEMI: ST-segment elevation myocardial infarction
While not diagnostic of an LVA-related ST-segment elevation, the presence of a LVA on point-of-care ultrasound is also helpful and suggestive of such an aneurysm being responsible for the ST-segment deviation.[39]
Right Bundle Branch Block
Right bundle branch block (RBBB) is responsible for 5% of noninfarction ST-segment elevation in ED chest pain patients.[2] Unlike LBBB, RBBB does not confound the electrocardiographic diagnosis of AMI. In RBBB, the QRS complex duration is prolonged, usually >0.12 s. The most obvious and distinctive electrocardiographic feature is a prominent R wave in lead V1. This R wave is broad and may assume any of several morphologies: monophasic R, biphasic RSR’, or qR formation. In lead V6, a wide RS wave is seen. In the inferior leads, QS complexes are observed. Significant ST-segment–T-wave changes are encountered in the patient with RBBB. In general, the correct and appropriate position of the ST-segment–T-wave complex is dictated by the major, terminal portion of the QRS complex. Using this concept, the ST-segment–T-wave complex is located on the opposite side of the isoelectric baseline from the major, terminal portion of the QRS complex. As such leads with a positive or predominantly positive QRS complex would display ST-segment depression and T-wave inversion that are discordant or opposite the isoelectric line. Conversely, a primarily negative or entirely negative QRS complex would be associated with ST-segment elevation and prominent, upright T wave–discordant ST-segment elevation. The ECG features of RBBB are noted in Figure 15a.
Figure 15.

Other cause of nonacute coronary syndrome ST-segment elevation. (a) Right bundle branch block, (b) Brugada syndrome, (c) Premature ventricular contractions (depolarizations), (d) Osborne J Waves of hypothermia, (e) Hypertrophic cardiomyopathy, (f) Sinoventricular rhythm of hyperkalemia
Brugada Syndrome
Brugada syndrome is a constellation of ECG findings coupled with an association for sudden cardiac death. It is an inherited entity, seen in patients of all ages, with a peak age of presentation between 38 and 48 years with an average of 41 years.[40] The Brugada syndrome is a genetic entity with an autosomal dominant pattern of inheritance with variable penetrance.[41] Patients can present to the ED in one of three scenarios: After resuscitation from sudden cardiac death with subsequent ECG demonstrating the Brugada pattern; after an episode of syncope or palpitations with the Brugada pattern noted on the ECG; and incidentally without symptoms of malignant dysrhythmia and the pattern noted on the ECG. The Brugada pattern is to be differentiated from Brugada syndrome. The Brugada pattern is the ECG presentation with the patient in sinus rhythm while Brugada syndrome involves the occurrence of malignant dysrhythmia.
The electrocardiographic presentation of the Brugada pattern can easily be misinterpreted as a STEMI with the presence of ST-segment elevations in right precordial leads; in fact, the ST-segment elevation has been described as a STEMI mimic.[42,43] The electrocardiographic features of the Brugada pattern stem from a different etiology then the ST-segment elevation seen in STEMI and caused by acute coronary occlusion. The most frequent ECG findings in the Brugada pattern include incomplete (or complete) RBBB and ST-segment elevation in leads V1 and V2. These ECG abnormalities are caused by myocardial sodium channel dysfunction. Brugada syndrome has a 70% predominance of males.[44]
There are three subtypes of Brugada pattern, based on the configuration of the elevated ST segment in leads V1 and V2 [Figure 15b]; all three subtypes include RBBB, either incomplete or complete. The type 1 morphology [Figure 15b, first example], the more ominous pattern, involves a coved or convex form of ST-segment elevation in leads V1 and/or V2. Type 1 is the only ECG abnormality that is potentially diagnostic of the syndrome; this form of ST-segment abnormality is referred to as the Brugada sign. Types 2 [Figure 15b second example] and 3 are described as the saddle-type morphology of the ST-segment elevation; these two subtypes are suggestive findings yet require additional investigation to confirm the diagnosis. All three subtypes involve ST-segment elevation in leads V1 and V2 and can be confused with STEMI.
Other Noninfarction Causes of ST-segment Abnormalities
Multiple other ECG presentations demonstrate ST-segment elevation and other significant electrocardiographic abnormalities, which can suggest STEMI to the unwary emergency clinician. Premature ventricular complexes will demonstrate ST-segment and T-wave abnormalities [Figure 15c]. Hypothermia presents with the classic triad of ECG abnormalities, including bradycardia, motion artifact (from shivering), and the Osborne (or J) wave [Figure 15d]. Hypertrophic cardiomyopathy presents electrocardiographically with large prominent R waves in leads V1 and V2, Q waves in lateral leads (I, aVL, V5, and V6), and ST-segment elevation in the right precordial leads [Figure 15e]. Hyperkalemia, particularly in situations involving a widened QRS complex, can present with ST-segment deviations [Figure 15f].
Conflicts of interest
None Declared.
Ethical Approval
Non applicable.
Funding
None.
References
- 1.Thygesen K, Alpert JS, Jaffe AS, Chaitman BR, Bax JJ, Morrow DA, et al. Fourth universal definition of myocardial infarction (2018) J Am Coll Cardiol. 2018;72:2231–64. doi: 10.1016/j.jacc.2018.08.1038. [DOI] [PubMed] [Google Scholar]
- 2.Brady WJ, Syverud SA, Beagle C, Perron AD, Ullman EA, Holstege C, et al. Electrocardiographic ST-segment elevation: The diagnosis of acute myocardial infarction by morphologic analysis of the ST segment. Acad Emerg Med. 2001;8:961–7. doi: 10.1111/j.1553-2712.2001.tb01094.x. [DOI] [PubMed] [Google Scholar]
- 3.Brady WJ, Perron AD, Martin ML, Beagle C, Aufderheide TP. Electrocardiographic ST segment elevation in emergency department chest pain center patients: Etiology responsible for the ST segment abnormality. Am J Emerg Med. 2001;19:25–8. doi: 10.1053/ajem.2001.18029. [DOI] [PubMed] [Google Scholar]
- 4.Smith SW. Upwardly concave ST segment morphology is common in acute left anterior descending coronary occlusion. J Emerg Med. 2006;31:69–77. doi: 10.1016/j.jemermed.2005.09.008. [DOI] [PubMed] [Google Scholar]
- 5.McCabe JM, Armstrong EJ, Kulkarni A, Hoffmayer KS, Bhave PD, Garg S, et al. Prevalence and factors associated with false-positive ST-segment elevation myocardial infarction diagnoses at primary percutaneous coronary intervention –Capable centers: A report from the activate-SF registry. Arch Intern Med. 2012;172:864–71. doi: 10.1001/archinternmed.2012.945. [DOI] [PubMed] [Google Scholar]
- 6.Khoury NE, Borzak S, Gokli A, Havstad SL, Smith ST, Jones M. Inadvertent thrombolytic administration in patients without myocardial infarction: Clinical features and outcome. Ann Emerg Med. 1996;28:289–93. doi: 10.1016/s0196-0644(96)70027-6. [DOI] [PubMed] [Google Scholar]
- 7.Wang K, Asinger RW, Marriott HJ. ST-segment elevation in conditions other than acute myocardial infarction. N Engl J Med. 2003;349:2128–35. doi: 10.1056/NEJMra022580. [DOI] [PubMed] [Google Scholar]
- 8.Schocken DD. Electrocardiographic left ventricular strain pattern: Everything old is new again. J Electrocardiol. 2014;47:595–8. doi: 10.1016/j.jelectrocard.2014.06.005. [DOI] [PubMed] [Google Scholar]
- 9.Pollak P, Brady W. Electrocardiographic patterns mimicking ST segment elevation myocardial infarction. Cardiol Clin. 2012;30:601–15. doi: 10.1016/j.ccl.2012.07.012. [DOI] [PubMed] [Google Scholar]
- 10.Sokolow M, Lyon TP. The ventricular complex in left ventricular hypertrophy as obtained by unipolar precordial and limb leads. Am Heart J. 1949;37:161–86. doi: 10.1016/0002-8703(49)90562-1. [DOI] [PubMed] [Google Scholar]
- 11.Brady WJ. Electrocardiographic left ventricular hypertrophy in chest pain patients: Differentiation from acute coronary ischemic events. Am J Emerg Med. 1998;16:692–6. doi: 10.1016/s0735-6757(98)90179-6. [DOI] [PubMed] [Google Scholar]
- 12.Coppola G, Carità P, Corrado E, Borrelli A, Rotolo A, Guglielmo M, et al. ST segment elevations: Always a marker of acute myocardial infarction? Indian Heart J. 2013;65:412–23. doi: 10.1016/j.ihj.2013.06.013. [DOI] [PMC free article] [PubMed] [Google Scholar]
- 13.Smith SW, Dodd KW, Henry TD, Dvorak DM, Pearce LA. Diagnosis of ST-elevation myocardial infarction in the presence of left bundle branch block with the ST-elevation to S-wave ratio in a modified Sgarbossa rule. Ann Emerg Med. 2012;60:766–76. doi: 10.1016/j.annemergmed.2012.07.119. [DOI] [PubMed] [Google Scholar]
- 14.Dodd KW, Zvosec DL, Hart MA, Glass G, 3rd, Bannister LE, Body RM, et al. Electrocardiographic diagnosis of acute coronary occlusion myocardial infarction in ventricular paced rhythm using the modified Sgarbossa criteria. Ann Emerg Med. 2021;78:517–29. doi: 10.1016/j.annemergmed.2021.03.036. [DOI] [PubMed] [Google Scholar]
- 15.Mehta MC, Jain AC. Early repolarization on scalar electrocardiogram. Am J Med Sci. 1995;309:305–11. doi: 10.1097/00000441-199506000-00001. [DOI] [PubMed] [Google Scholar]
- 16.Hiss RG, Lamb LE, Allen MF. Electrocardiographic findings in 67,375 asymptomatic subjects. X. Normal values. Am J Cardiol. 1960;6:200–31. doi: 10.1016/0002-9149(60)90047-3. [DOI] [PubMed] [Google Scholar]
- 17.Larson DM, Menssen KM, Sharkey SW, Duval S, Schwartz RS, Harris J, et al. False-positive cardiac catheterization laboratory activation among patients with suspected ST-segment elevation myocardial infarction. JAMA. 2007;298:2754–60. doi: 10.1001/jama.298.23.2754. [DOI] [PubMed] [Google Scholar]
- 18.Wasserburger RH, Alt WJ. The normal RS-T segment elevation variant. Am J Cardiol. 1961;8:184–92. doi: 10.1016/0002-9149(61)90204-1. [DOI] [PubMed] [Google Scholar]
- 19.Macfarlane PW, Antzelevitch C, Haissaguerre M, Huikuri HV, Potse M, Rosso R, et al. The early repolarization pattern: A consensus paper. J Am Coll Cardiol. 2015;66:470–7. doi: 10.1016/j.jacc.2015.05.033. [DOI] [PubMed] [Google Scholar]
- 20.Deshpande A, Birnbaum Y. ST-segment elevation: Distinguishing ST elevation myocardial infarction from ST elevation secondary to nonischemic etiologies. World J Cardiol. 2014;6:1067–79. doi: 10.4330/wjc.v6.i10.1067. [DOI] [PMC free article] [PubMed] [Google Scholar]
- 21.Brady WJ, Chan TC. Electrocardiographic manifestations: Benign early repolarization. J Emerg Med. 1999;17:473–8. doi: 10.1016/s0736-4679(99)00010-4. [DOI] [PubMed] [Google Scholar]
- 22.Antzelevitch C, Yan GX. J-wave syndromes: Brugada and early repolarization syndromes. Heart Rhythm. 2015;12:1852–66. doi: 10.1016/j.hrthm.2015.04.014. [DOI] [PMC free article] [PubMed] [Google Scholar]
- 23.Younis A, Matetzky S, Mulla W, Masalha E, Afel Y, Chernomordik F, et al. Epidemiology characteristics and outcome of patients with clinically diagnosed acute myocarditis. Am J Med. 2020;133:492–9. doi: 10.1016/j.amjmed.2019.10.015. [DOI] [PubMed] [Google Scholar]
- 24.Spodick DH, Greene TO, Saperia G. Images in cardiovascular medicine. Acute myocarditis masquerading as acute myocardial infarction. Circulation. 1995;91:1886–7. doi: 10.1161/01.cir.91.6.1886. [DOI] [PubMed] [Google Scholar]
- 25.Razzano D, Fallon JT. Myocarditis: Somethings old and something new. Cardiovasc Pathol. 2020;44:107155. doi: 10.1016/j.carpath.2019.107155. [DOI] [PubMed] [Google Scholar]
- 26.Ammirati E, Moslehi JJ. Diagnosis and treatment of acute myocarditis: A review. JAMA. 2023;329:1098–113. doi: 10.1001/jama.2023.3371. [DOI] [PubMed] [Google Scholar]
- 27.Buttà C, Zappia L, Laterra G, Roberto M. Diagnostic and prognostic role of electrocardiogram in acute myocarditis: A comprehensive review. Ann Noninvasive Electrocardiol. 2020;25:e12726. doi: 10.1111/anec.12726. [DOI] [PMC free article] [PubMed] [Google Scholar]
- 28.Lindow T, Pahlm O, Khoshnood A, Nyman I, Manna D, Engblom H, et al. Electrocardiographic changes in the differentiation of ischemic and non-ischemic ST elevation. Scand Cardiovasc J. 2020;54:100–7. doi: 10.1080/14017431.2019.1705383. [DOI] [PubMed] [Google Scholar]
- 29.Witting MD, Hu KM, Westreich AA, Tewelde S, Farzad A, Mattu A. Evaluation of Spodick's sign and other electrocardiographic findings as indicators of STEMI and pericarditis. J Emerg Med. 2020;58:562–9. doi: 10.1016/j.jemermed.2020.01.017. [DOI] [PubMed] [Google Scholar]
- 30.Mattu A. Amal Mattu's ECG Case of the Week. ECG Weekly Workout. 2015. [[Last accessed on 2024 Jul 29]]. Available from: https://ecgweekly.com/2015/07/ amal-mattus-ecg-case-of-the-week-july-20-2015/
- 31.Bischof JE, Worrall C, Thompson P, Marti D, Smith SW. ST depression in lead aVL differentiates inferior ST-elevation myocardial infarction from pericarditis. Am J Emerg Med. 2016;34:149–54. doi: 10.1016/j.ajem.2015.09.035. [DOI] [PubMed] [Google Scholar]
- 32.Chaubey VK, Chhabra L. Spodick's sign: A helpful electrocardiographic clue to the diagnosis of acute pericarditis. Perm J. 2014;18:e122. doi: 10.7812/TPP/14-001. [DOI] [PMC free article] [PubMed] [Google Scholar]
- 33.Davies RR, Coady MA. Mechanical complications of myocardial infarction. In: Yuh DD, Vricella LA, Baumgartner WA, editors. Johns Hopkins Textbook of Cardiothoracic Surgery. New York: McGraw Hill; 2007. pp. 448–558. [Google Scholar]
- 34.Napodano M, Tarantini G, Ramondo A, Cacciavillani L, Corbetti F, Marra MP, et al. Myocardial abnormalities underlying persistent ST-segment elevation after anterior myocardial infarction. J Cardiovasc Med (Hagerstown) 2009;10:44–50. doi: 10.2459/JCM.0b013e32831967b2. [DOI] [PubMed] [Google Scholar]
- 35.Galiuto L, Barchetta S, Paladini S, Lanza G, Rebuzzi AG, Marzilli M, et al. Functional and structural correlates of persistent ST elevation after acute myocardial infarction successfully treated by percutaneous coronary intervention. Heart. 2007;93:1376–80. doi: 10.1136/hrt.2006.105320. [DOI] [PMC free article] [PubMed] [Google Scholar]
- 36.Engel J, Brady WJ, Mattu A, Perron AD. Electrocardiographic ST segment elevation: Left ventricular aneurysm. Am J Emerg Med. 2002;20:238–42. doi: 10.1053/ajem.2002.32634. [DOI] [PubMed] [Google Scholar]
- 37.Cohn K, Dymnicka S, Forlini FJ. Use of the electrocardiogram as an aid in screening for left ventricular aneurysm. J Electrocardiol. 1976;9:53–8. doi: 10.1016/s0022-0736(76)80011-8. [DOI] [PubMed] [Google Scholar]
- 38.Smith SW. T/QRS ratio best distinguishes ventricular aneurysm from anterior myocardial infarction. Am J Emerg Med. 2005;23:279–87. doi: 10.1016/j.ajem.2005.01.003. [DOI] [PubMed] [Google Scholar]
- 39.Kapur P, Baimel M, Chenkin J. Left ventricular outflow tract pseudoaneurysm diagnosed with point-of-care ultrasound in the emergency department. CJEM. 2018;20:798–801. doi: 10.1017/cem.2018.20. [DOI] [PubMed] [Google Scholar]
- 40.Milman A, Andorin A, Gourraud JB, Sacher F, Mabo P, Kim SH, et al. Age of first arrhythmic event in Brugada syndrome: Data from the SABRUS (Survey on Arrhythmic Events in Brugada Syndrome) in 678 patients. Circ Arrhythm Electrophysiol. 2017;10:e005222. doi: 10.1161/CIRCEP.117.005222. [DOI] [PubMed] [Google Scholar]
- 41.Khan IA, Nair CK. Brugada and long QT-3 syndromes: Two phenotypes of the sodium channel disease. Ann Noninvasive Electrocardiol. 2004;9:280–9. doi: 10.1111/j.1542-474X.2004.93533.x. [DOI] [PMC free article] [PubMed] [Google Scholar]
- 42.Osher HL, Wolff L. Electrocardiographic pattern simulating acute myocardial injury. Am J Med Sci. 1953;226:541–5. [PubMed] [Google Scholar]
- 43.Brugada P, Brugada J. Right bundle branch block, persistent ST segment elevation and sudden cardiac death: A distinct clinical and electrocardiographic syndrome. A multicenter report. J Am Coll Cardiol. 1992;20:1391–6. doi: 10.1016/0735-1097(92)90253-j. [DOI] [PubMed] [Google Scholar]
- 44.Benito B, Sarkozy A, Mont L, Henkens S, Berruezo A, Tamborero D, et al. Gender differences in clinical manifestations of Brugada syndrome. J Am Coll Cardiol. 2008;52:1567–73. doi: 10.1016/j.jacc.2008.07.052. [DOI] [PubMed] [Google Scholar]