Abstract
Animals of the phylum Echinodermata are characterized by a pentaradially symmetric endoskeleton in adults. Echinoids also have endoskeletal spines ranging in length from several millimeters (sand dollars e.g. Mellita quinquiesperforata of the order Clypeasteroida) to 30 cm (the black sea urchin, Diadema antillarum of the order Euechinoidea). Here we integrate an analysis of genetic, structural and molecular properties of spines from the variegated sea urchin, Lytechinus variegatus. Through genetic crosses we learned that white is dominant over red and green colors, and that pigmentation follows classic Mendelian genetics. The abundance of mRNAs encoding flavin mono-oxygenase variancts and polyketide synthase was predictive of the color of the adult and antibodies identified their histological location in the spine cells. By RNA in situ hybridization, candidate genes important for spine biomineralization and pigmentation were mapped onto the spine epithelia, and MicroCT scans of spines from different color morphs concluded that color morphs are entirely due to pigmentation and not to structural variations of the endoskeleton. By confocal microscopy we localized gene expression along and within the spines and learned that genes involved in pigment biosynthesis showed selective distribution along the spine. Spine epidermis is mitotically active and red spherule immunocytes are highly migratory within the spine. Overall the results provide a key foundation for examining the mechanisms of molecular diversity and patterning in the name sake of the phylum Echinodermata.
Keywords: Echinoderm, Sea urchin spine, Biomineralization, Pigmentation, Polyketide synthase, Flavin containing monooxygenase
Subject terms: Ecology, Evolution, Molecular biology, Zoology
Introduction
Echinoderms are a keystone species of the marine benthos that have evolved successful protection against predation and infection1–3. Adult echinoderms, as their name defines, have numerous spiny projections emanating from the endoskeletal test surrounding the body. The spines of a sea urchin provide effective structural protection from predation, and the epidermis covering the spines contains antimicrobial pigments that serve as an important barrier harboring both a chemical and immune defense4. The immune system in this phylum is innate, but has great complexity and diversity in limiting pathogen invasion5,6. The chemical defense system appears to include the vast repertoire of pigment found in the spines and test of the organism. Various colors of pigmentation in the sea urchin appear to alter the microbes capable of colonizing the epidermal tissue7–9.
Mechanisms of forming color in the biological world are as diverse as the colors themselves. Plants use a variety of pigments to capture energy for growth. Animals use colors for camouflage, mate recognition, and protection from the sun, whereas many animals have lost color altogether1,10,11. Some pigments even serve as defense from being eaten or from microbial habitation. Even fungi have enormous color variation depending on the species, and they often use a variety of chemically unrelated pigments to yield species specific color traits12. Sea urchins use color for immune protection, camouflage, and perhaps to reduce UV damage4,13,14.
Chemically, the many colors exhibited by Echinoderms include melanins, carotenoids, porphyrins, some fluorescent pigments, and quinones (including ubiquinones, anthraquinones, and naphthoquinones4,14. Some pigments, such as carotenoids, accumulate from the diet since animals do not synthesize tetraterpenes13. Quinones have received the most attention, perhaps from their role in immune protection, beginning with Echinochrome A15,16. Echinochrome is a naphthoquinone present in the immune-type pigment cells and is thought to act as an antimicrobial factor upon its release4,14,17.
In addition to Echinochrome A of the immune red spherule cells, other pigments are embedded within the epidermis and endoskeleton of the adult spine and test. These pigments are modifications of a polyketide made by polyketide synthase (PKS)18. Inactivation of the PKS1 gene results in albino larvae and adults as demonstrated by both MASOs and Cas9 targeted gene inactivation;19–21). Limited evidence suggests that diverse FMOs genes may modify the core polyketide into a variety of pigment types21. These variants of the naphthoquinones in sea urchins are referred to as spinochromes A-E that are enriched in spines and the adult test.
Some species of sea urchins have very consistent spinochrome composition amongst their members e.g. Strongylocentrotus purpuratus (Sp), whereas individuals of other species have great diversity within their populations, e.g. Lytechinus variegatus22. Here we focused on using the sea urchin L. variegatus (Lv) as a model system for studying the molecular composition and organization of the spines. Lv, and its closely related species, Lytechinus pictus (Lp), are capable of a reproductive cycle (egg to egg) of less than 6 months and are emerging rapidly into systems for functional testing of genes by Cas9 KO approaches in embryonic, larval, and adult cells23,24. Further, across its range, Lv exhibits a large variety of colors, making analysis in this species for mechanisms of pigment formation and patterning particularly helpful. Here we resolve pigment as being genetically determined, define sets of genes responsible for this pigmentation, and use candidate genes and reporters to understand how the pigmented spines of this animal are organized at a cellular and molecular level.
Results
Colormorphs of Lytechinus variegatus are genetically determined and fit classic Mendelian ratios
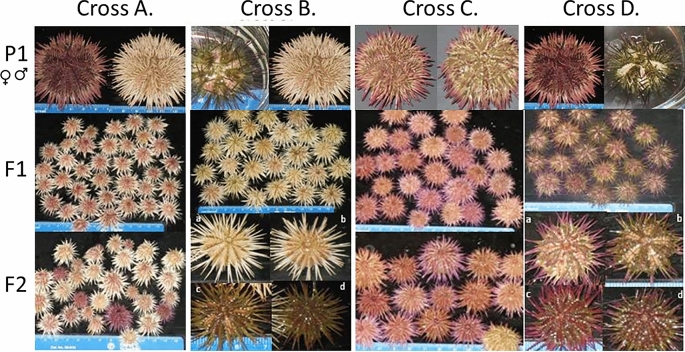
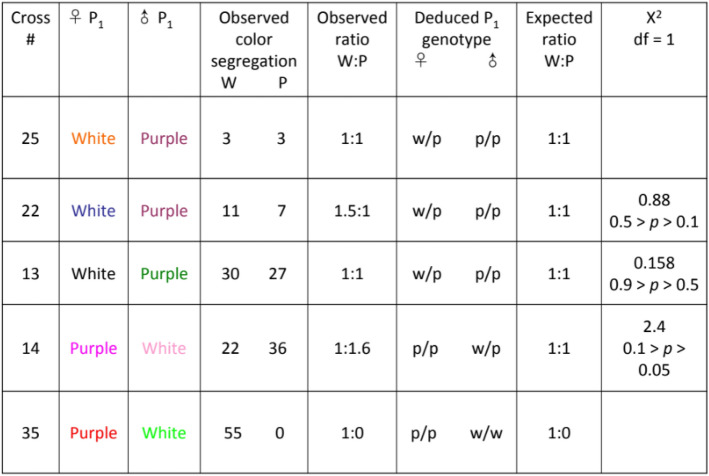
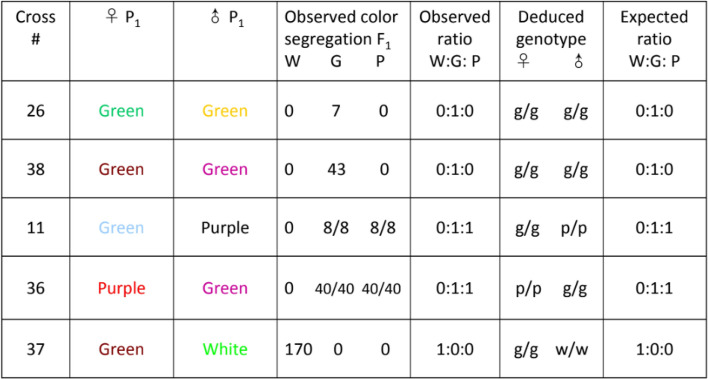
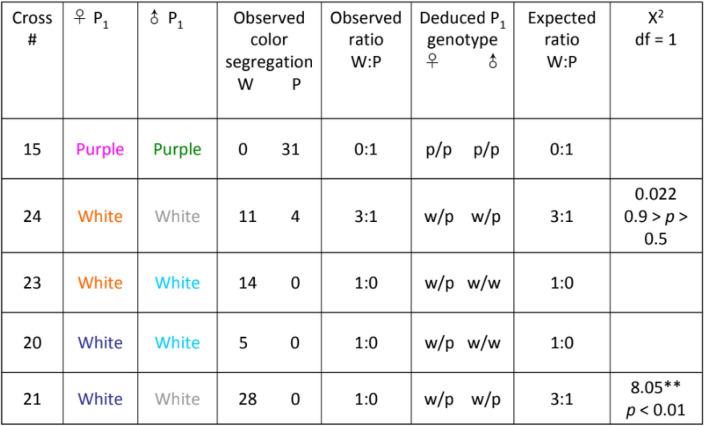
A total of 30 crosses within and between colormorphs of Lv produced 745 F1 offspring, which were scored for color phenotypes (Fig. 1). The crosses established that in Lv the color phenotype is genetically determined and that the white phenotype is a dominant autosomal trait. Patterns of segregation for crosses with white, purple/red and green urchins indicate a dominance/recessive pattern for the three colors: white is dominant to both purple and green and green and purple are co-expressed25. Tables 1, 2 and 3 show that offspring phenotypes conform to expected Mendelian ratios (3:1, 1:1) for matings involving dominant heterozygous whites and a recessive purple. Moreover, two crosses (#35 and 37) strongly support the homozygous dominant state of the white parent over the purple and green parent respectively. All F1 offspring of these crosses were white. In the subsequent F2 generation for cross #35, the purple phenotype returns with a 26:5 ratio of white to purple offspring. The ratio does not deviate significantly from the expected Mendelian ratio of 3:1 (χ2 = 1.58, df = 1, NS with Yates’ correction) supporting the dominance of white over purple. The F2 generation for cross #37 reveals 27:11 white/green offspring ratio again conforming to the expected 3:1 ratio (χ2 = 0.59, df = 1, NS with Yates’ correction), for white dominant to green. In the one full purple cross all offspring (#31) were the recessive purple color. An F2 generation also produced all purple offspring (#15) supporting the classification of purple as a recessive color. The heritability of color phenotypes demonstrates that genes, rather than the environment, determine the color morphs in this animal25.
Fig. 1.
Results of genetic crosses: Cross (A; Cross #35 in Table 1) A homozygous white spined urchin crossed with a purple spined urchin produced all white spined F1 offspring. In the F2 generation, purple urchins returned in a 3:1 ratio. Cross (B; Cross #37 in Table 2) A homozygous white urchin crossed with a patterned green urchin produced all-white patterned offspring (similar in appearance to urchin a in F2 generation). In the F2 generation both patterned and nonpatterned white and colored offspring: (a) white, patterned; (b) white, nonpatterned; (c) purple-green, patterned; (d) purple-green, nonpatterned. Cross (C; Cross #15 in Table 3) Entirely purple cross produced purple F1 and F2 offspring. Cross (D; Cross #36 in Table 2) Purple urchin crossed with a patterned green urchin produce bicolored patterned F1 offspring. In the F2 generation both patterned and nonpatterned offspring: (a) purple, patterned; (b) purple-green, patterned; green, patterned (not seen); (c) purple, nonpatterned; (d) purple-green, nonpatterned.
Table 1.
Observed phenotypic ratios for F1 offspring of white and purple urchins.
Urchins were used in more than one cross as indicated by the color scheme. White encompasses spines that are entirely white or light pink as well as spines that have pink, light purple or light pink tips. Purple refers to spines that are fully purple and various shades thereof, including red, dark pink, lavender and light purple. χ2 tests are not significantly different from expected Mendelian ratios.
Table 2.
Observed phenotypic ratios of spine color for F1 offspring of white, green and purple urchins.
Green crosses (26 and 38) produced only green offspring. Green-purple crosses (11 and 36) produced the dual colored phenotype purple-green indicating that neither allele is dominant over the other. The green-white cross (37) produced white urchins, confirming white as the dominant allele.
Table 3.
From these crosses we see that white urchins can produce both white and purple offspring, whereas, purple urchins only produced purple urchins.
This strongly suggests that white is the dominant phenotype and purple is recessive.
Pigment from juvenile spines is distinct from adult pigment but requires PKS1
No difference in pigmentation was evident in post-settlement juveniles (approximately 0.5–2 mm in horizontal diameter). All juvenile sea urchins at this stage display a skeletal test that is translucent white with red pigmented immune cells on the aboral surface and a light purple band midway on the nascent spines (Fig. 2). The shade of purple in the early juvenile is distinct from adult pigment, and regardless of the spine color of the parents of the juvenile, all juveniles express this color. It is then replaced by the adult pigment determined by the genetics. Differences in phenotype between individuals in all crosses become apparent as the juveniles grow, becoming distinctive starting at approximately 4 mm horizontal test diameter (7–10 days post-metamorphosis). For adults developing into the white phenotype the purple band around the spines slowly lightens and finally disappears. For adults developing into other color phenotypes the appearance of darker color intensifies slowly over time. At approximately 10–12 mm horizontal diameter the final phenotype becomes apparent. Beyond ≥ 12 mm horizontal diameter, no further pigmentation change is evident enabling consistent morphological measurements to be taken We conclude that the purple pigment in the nascent spines of the early juvenile is PKS1 dependent, based on its loss in PKS1 targeted Cas9-knockouts (Fig. 3), suggesting it is a naphthoquinone pigment. Perhaps because of a unique profile of the FMOs and PKS used by the juvenile, the spines exhibit a unique shade of purple.
Fig. 2.
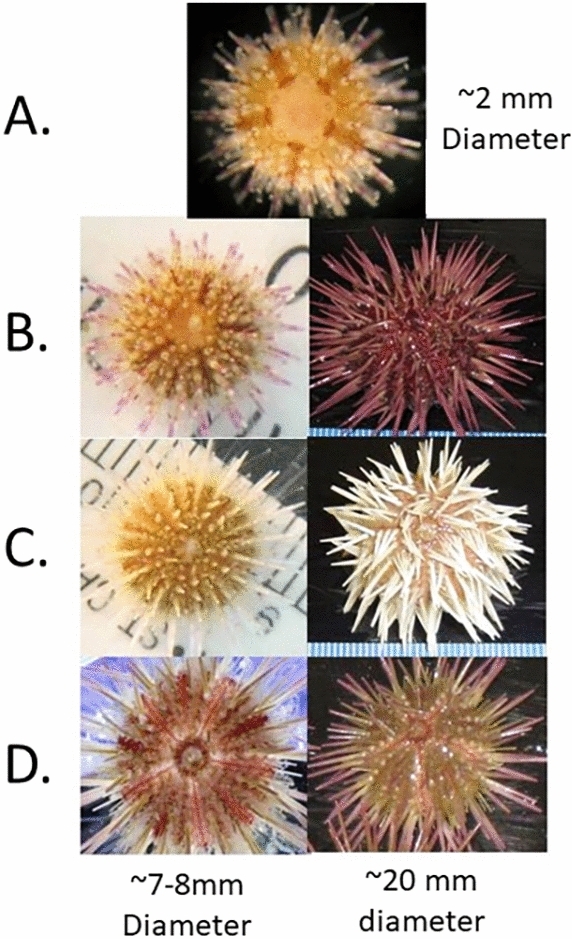
(A) Post-metamorphic juvenile approx. 2 mm in HD. The red granules are red pigment cells that accumulate in areas of rapid growth, usually around the sutures, the apical plate and genital pores. There is a higher concentration of these cells around the sutures of the ambulacral plates; all primary spines have a purple band roughly midway down the spine. All post-metamorphic juveniles look very similar irrespective of adult color phenotype. (B) Later stage juvenile that will become a purple urchin. The purple along the spines accumulates and will eventually cover the entire spine and the test will become progressively darker. (C) Later stage juvenile that will become a white urchin. The purple band along the spine becomes fainter until it disappears altogether. The test may become light as it in this individual or may become darker. (D) Later stage bicolored juvenile that displays both spine and test patterning. The spatial differentiation of green and purple on the spines is clearly visible as is the difference in color between the ambulacral and interambulacral sectors.
Fig. 3.
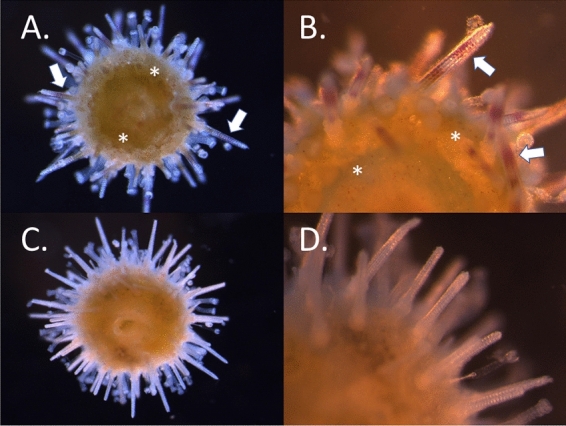
Juvenile Lytechinus variegatus of wild-type (A,B) and gene knock out of polyketide synthase (PKS1; C,D). Regardless of the final colormorph phenotype in the adult, juvenile spines all initially have 1–2 purple pigment bands along the nascent skeleton (white arrows). Wildtype animals also have pigmented immune cells (red spherule cells) densely packed throughout the body (asterisk). Animals whose PKS1 genes have been inactivated by Cas9/sgRNA do not have detectable pigment in either of these cells (C,D). The slight green regions in the bodies of A and C is algae in the digestive system. The juveniles at this stage are less than 2 millimeters in diameter.
The mineralized structure of the adult spine is consistent between colormorphs
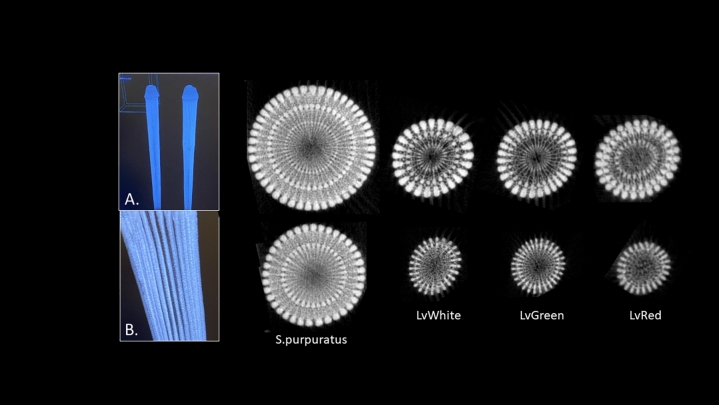
We tested the possibility that some color variation is due to structural-based color (as exists in butterfly wings, for example). For this analysis, MicroCT was used to identify the spine mineralization patterns at 5 µm resolution (Fig. 4). Spines were cleared with 5% bleach overnight, and co-imaging of multiple spines of white/red/green were analyzed The result shows that the spines of Lv are very similar to one another with only slight variations in septa number between the color variants but are very different from spines of S. purpuratus as a comparison to a distinct species. (Fig. 5). See Supplemental Fig. 1 for images of representative animals used for this analysis. The differences with Sp spines are grossly apparent, especially with additional circumferential layers, and many more septa in the thicker Sp spine (Fig. 5). Some variation of septa numbers were seen from aboral to oral longitudes in the adults, with the greatest variation in septa of spines between the equatorial region compared to the oral (ventral) most region. This pattern was consistent between different color morphs. Diversity in other morphological features of Lv have been noted25 such as test height/circumference ratio, and ratios of spine length/test diameter, but no other detectable differences were seen in the spines aside from their variation in color morphology.
Fig. 4.
High Resolution micro Computed Tomography (microCT). A and B are low magnification images of LvWhite spines. All other images are transverse tomography sections of spines from S. purpuratus, LvWhite, LvGreen, and LvRed, taken approximately 25% from the base of the spine (top row) and 25% from the tip of the spine (bottom row). Spines from Lv are approximately 1 millimeter in diameter whereas in Sp they are ~ 1.5 millimeters, all depending on where in the spine the cross section is taken. .
Fig. 5.
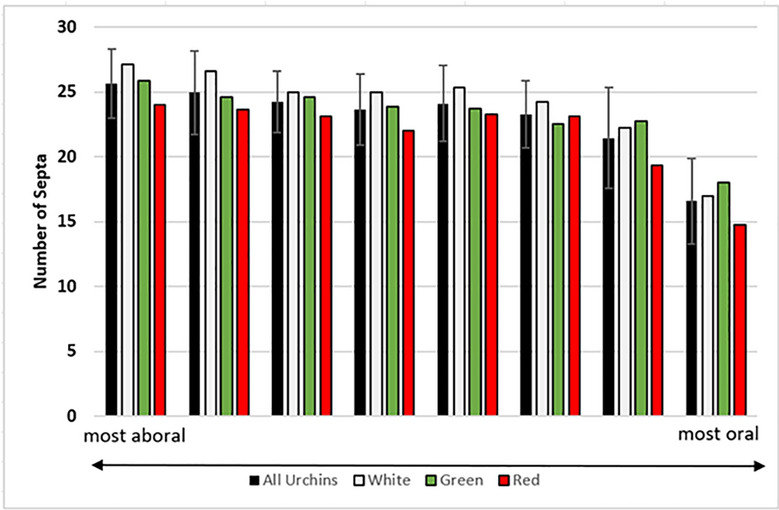
Number of septa as a function of color and position along the oral/aboral axis of adults.
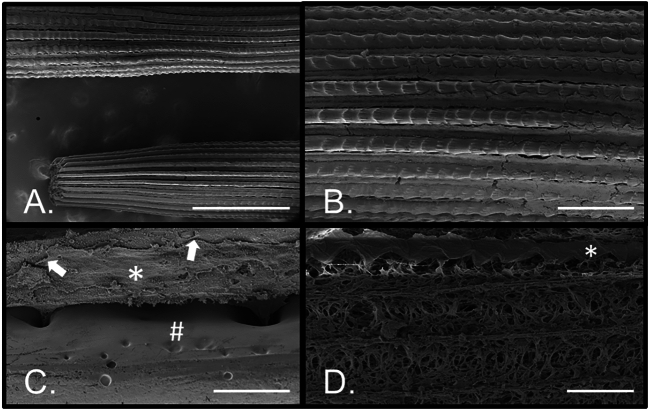
Scanning electron microscopy was used to provide context for the cellular and mineral portions of the spine (Fig. 6). Each spine is tapered at the distal end (Fig. 6A), and is a rod containing parallel rows of ridges called septa separated by interseptal depressions. The entire spine is covered with epithelial cells (Fig. 6B), and each epithelial cell contains a filopodial projection that passes through a small hole in the endoskeleton (Fig. 6C,D). An extracellular matrix lies between the epithelium and the endoskeleton (Fig. 6D).
Fig. 6.
Cells of the spine revealed by scanning electron microscopy (SEM). (A) Low magnification view of two intact spines along their length showing the septa (mineralized ridges) and interseptal spaces (between the septa). (B) Higher magnification of a spine where left–right orientation is proximal-distal for the spine, respectively. Each of the septa have proximal-distal oriented ridges and are covered by the external epithelium. (C) The epithelium (*) covers the mineralized skeleton (#) with tightly adherent junctions (arrows) as well as projections through pores internally. (D) With most of the epithelium removed from the skeleton, except for the row identified by the asterisk (*), the cellular projections and extracellular matrix are apparent. Bar: A = 500 microns. B = 100 microns. C = 20 microns. D = 50 microns.
Identification of distinct molecular domains within the spine
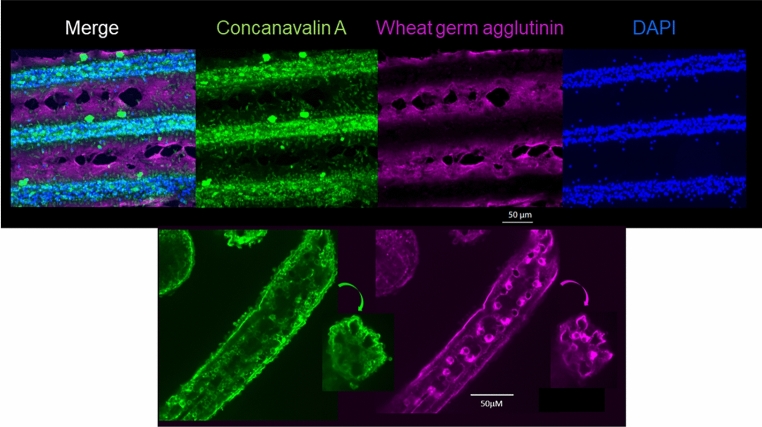
We profiled the cellular domains of the spine starting with general molecular markers. The lectins wheat germ agglutinin (WGA) and Concanavalin A (ConA) were employed, as they recognize different carbohydrate constituents; WGA: acetylated glucosamine and sialic acid; ConA: terminal mannose and glucose residues;26. They demonstrated distinct boundaries of molecular localization within the spine (Fig. 7). ConA identified cell bodies, overlapping DAPI significantly, in the interseptal region, whereas WGA-binding was enriched in the thin cellular leaflet covering the septa between rows of cells. This shows that the epidermis along the spine presents different molecular characteristics to suggest distinct domains of functionality within the spine.
Fig. 7.
Top row, live adult spines labeled with the lectins Concanavalin A (Green) and Wheat germ agglutinin (Red). Note distinct boundaries in the epithelium expressing a rich source of terminal α-D-mannosyl and α-D-glucosyl groups, or to N-acetyl-D-glucosamine and sialic acid, respectively. Bottom row are spines from a 2-week old juvenile, similarly labeled and showing that the distinct domains seen in adults are already formed in a young juvenile. The WGA labeling appears predominantly pericellular at this stage.
Genes involved in the pigment biosynthetic pathway are expressed broadly in the spine epidermis
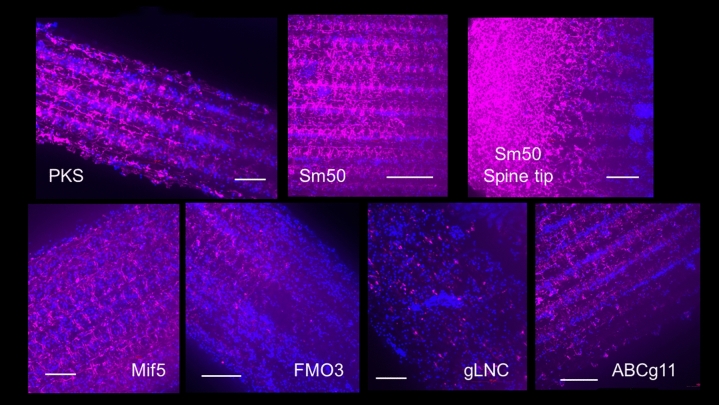
Recent results from single cell RNA-seq analysis provided a subset of genes uniquely expressed in the pigmented immune cells of larvae19,27,6. These include PKS1, multiple FMOs, ABCg11, Sult1-C and others. We asked if these pigment-related genes also are expressed in spines of adult Lv by in situ hybridization (Fig. 8), and whether their expression somehow is predictive for the color morph phenotypes by qPCR. The results show that profiles of gene expression in spines within an individual are similar to other individuals of the same color morph. PKS1 and the FMO3 are expressed throughout the epithelium of the spine, largely enriched within the intersepta of the termini of the spines (Fig. 8). Spicule matrix protein of 50kDa (SM50) is not in pigmented cells of the larva but is an important control for hybridization and profiling within a biomineralized tissue in this organism The SM50 gene is uniquely transcribed in skeletal elements in the larvae and in adult biomineralized tissues28,29. Additional immunolabeling results of the spines are shown in Supplemental Fig. 1.
Fig. 8.
Genes whose expression is enriched in the immune pigmented cells of the larvae (red spherule cells) are expressed in the epithelium of the spine as seen by fluorescence in situ RNA hybridization. PKS = polyketide synthase; Sm50 = spicule matrix protein of 50 kDa (is not in pigmented cells of the larva but is an important control for hybridization and profiling); note that Sm50 mRNA is enriched at the tip of the spine; Mif5 = macrophage migration inhibitory factor #5, which is involved in a variety of immune functions in mammals; FMO3 = Flavin-containing monooxygenase #3; gLNC = Long non-coding RNA enriched in green spines; ABCg11 = ATP-binding cassette protein - #11 in the g family of ABC proteins. Each of the genes are expressed broadly in the spine epithelial cells with enrichment transitions seen in FMO3 and SM50. The most distinct labeling profile is in gLNC, which appears perinuclearly in select epithelial cells. Bars in each image = 50 micrometers
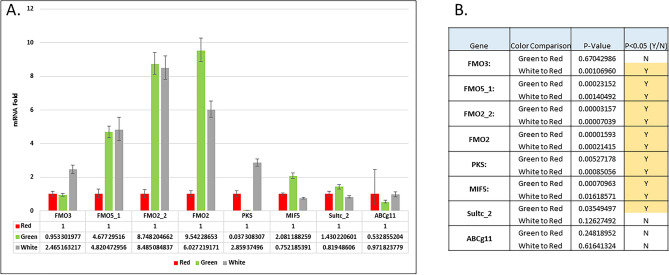
In situ hybridizations and immunolocalizations are not quantitative, so we used qPCR to identify the relative levels of mRNA for key gene products expressed in the spine to address this question (Fig. 9). Each color morph displayed a distinct gene expression profile. For example, the relative levels of each of the FMOs, PKS1, and Sult1-C appear correlative with the main color of the adult spines. We find a strong correlation of combinatorial FMO type prevalence with color morphology. We also tested the premise that FMOs are involved in diversity of color by using spines from animals that show variation along the spine, from proximal to distal sites. In such cases, the genotype of the spine is the same, yet the color is distinct. In these cases, the FMO profiles again predict the color morphology (Fig. 9).
Fig. 9.
Quantitation of larval pigment gene expression in adult spines of red/white/green colormorphs of Lytechinus variegatus using qPCR (A). Values were normalized to ubiquitin and then to the values of the red colormorph. Significance measurements are shown in the graph (B).
Localization of proteins in the pigment biosynthesis pathway
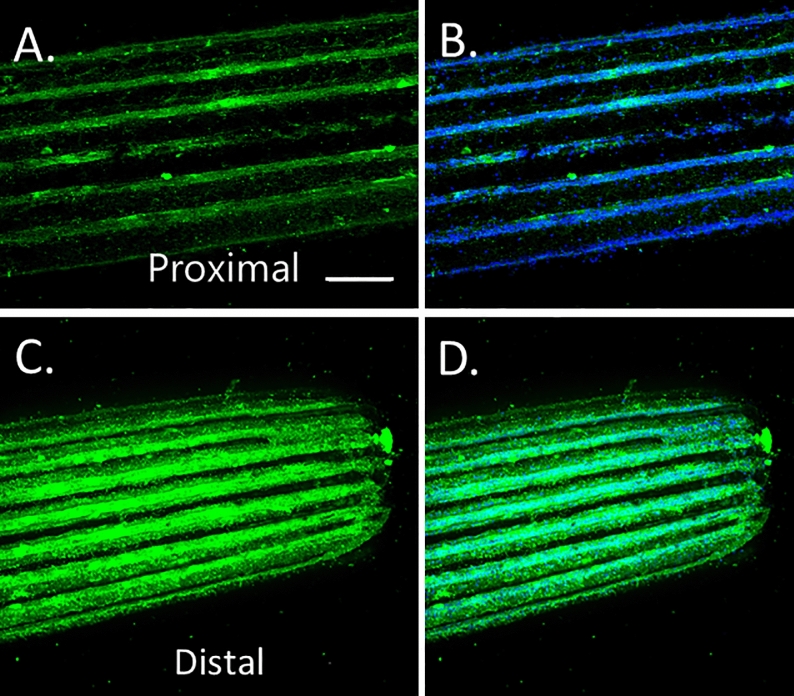
We made antibodies to PKS1 and to one member of the FMO family, FMO3. Immunolabeling spines in situ showed that PKS1 and FMO3 are present within the domains of the cell bodies (DAPI-positive regions) in clusters of the interseptal space in a variety of shapes and sizes (Figs. 10, 11). The enzymes do not appear to extend into the thin epithelial covering overlying the septa, and the variety of clusters and aggregates within the cell bodies appear prevalent throughout the epidermal cells. Perhaps these enzymes are present within, or surrounding, a compartment of the epidermal cells, and that the resulting pigment is dispersed throughout the cellular processes that blanket and permeate the spine.
Fig. 10.
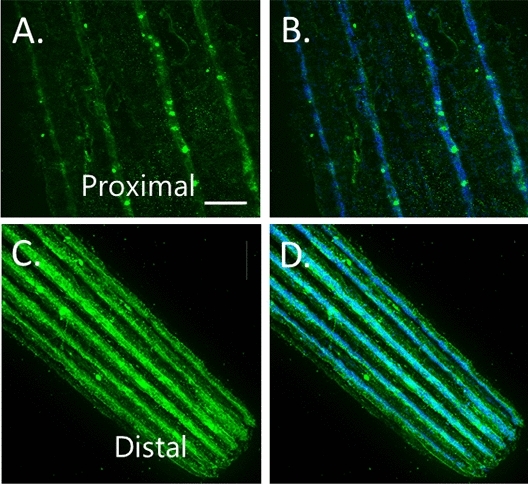
(A,B) FMO3 immunolabeling at base of spine and (C,D) at spine tip (distal). Notice the dramatic enrichment in the tip. Scale bar = 10 microns.
Fig. 11.
(A,B) PKS immunolabeling at base of spine and (C,D) at spine tip (distal). Note how the tip is highly enriched for the PKS protein, relative to the base. Bar = 100 microns.
Different levels of protein are detected along the spine for FMO3 and PKS1. The base of the spine contains PKS1/FMO in a subset of cells, while the distal aspects of the spine have significantly greater levels of detectable protein, and in each cell (Figs. 10, 11). Histogram analysis (Adobe Photoshop version 25.11.0 20240716.r.706 b326a7d x64, Histogram tool) of multiple spines shows that the proximal regions of a spine have less than 14% and 8% of the distal regions of detectable PKS1 and FMO3 respectively. This suggests that the tips are more active in pigment production, or that there is a higher turnover of pigment in the distal regions.
Cells in the spine are mitotically active
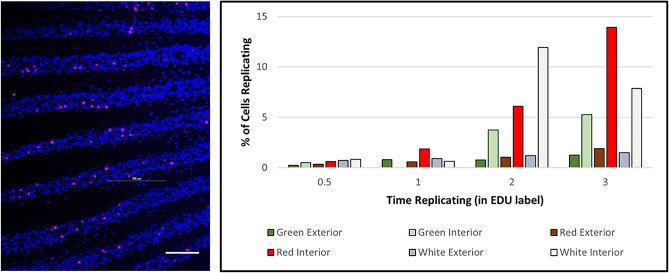
We used EdU incorporation to test for replicating cells in the spines (Fig. 12). Pulsing explanted spines for 1–3 h cultured in vitro resulted in significant EdU labeling averaging 1–4% of the cells per hour. Replication in the epithelium appears consistent along the spine so how these divisions occur must include dynamic restructuring of the mitotic cells to retain an epithelium barrier.
Fig. 12.
Spine cells are replicative. (EdU incorporated nuclei). Pulsing spines for 0.5–3 h cultured in vitro resulted in significant EdU labeling. The epithelium looks remarkably tightly bound so how these divisions occur must include dynamic restructuring of the mitotic cells. Scale bar = 8 microns
Spines host migratory pigmented immune cells
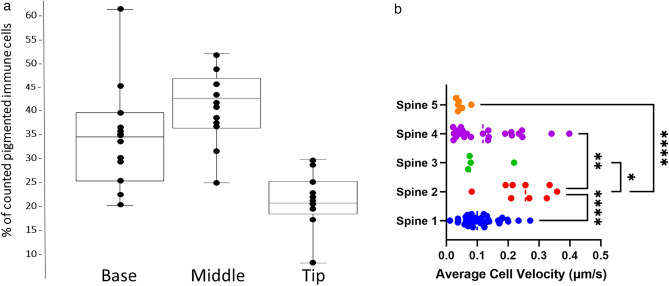
Pigmented immune cells are present throughout the proximal—distal length of the spine. They are found within the endoskeleton canals, throughout the extracellular matrix, and at the basal side of the epithelia (Fig. 13). The local density of pigmented immune cells varied between individuals, but the tip of the spines generally had fewer pigmented immune cells than the middle or the base. The pigmented immune cells were migratory along all aspects of the spine showing diverse speeds and directions in their migration. The dynamic nature of this immune cell migration throughout the spine suggests a continual surveillance of the spine condition, perhaps in wound repair30, and can be used as a test system for signals that attract the red spherule cells since it is easy to create a visual 2 or 3-dimensional chemosensory system.
Fig. 13.
(A) Immune cells were counted in fifty-micron swaths of demineralized spines at the base, in the middle, and at the tip, and the percent of these counted cells in each region was calculated. (B) Velocity of individual presumptive red-spherule cells in intact spines from 5 spines of different Lytechinus variegatus individuals. Each dot on the graph represents an individual cell’s average velocity over the course of the time-lapse video. Significant p values between spines by One-way ANOVA are indicated with stars (*= 0.0282, **= 0.0023, ****= < 0.0001).
Discussion
We conclude from these results that the pigment of the adult spines is determined by genetic composition and not by temperature, environmental conditions, or the diet, as may occur in other echinoderms, such as sea stars that use carotenoids in their dermal pigmentation that originates from their diet4,14. While we cannot completely rule out external influences on the intensities of pigmentation of the animal, or effects of overall health on pigmentation, our data from both the genetic crosses as well as the genetic KD/KO experiments support the hypothesis that genetics explains the color phenotype in Lv adult animals. Many of the same genes active in pigmented immune cells of the larva, and of the coelomocytes are also used, albeit in diverse combinations, for pigment in the adult spines. We surmise that other color morphologies in tests of adult echinoids also utilize these same gene families18,21. We hypothesize that the distinct distribution of FMO enzymes in the several colormorphs contribute to the variations in pigmentation of the adult spine.
The body of data here does not identify the individual functions of FMOs in pigmentation but two lines of evidence support that hypothesis. First, inactivation of FMO3 either by MASO or by Cas9 gene targeting, results in dramatic changes in the pigment produced21. Second, different, and consistent profiles of FMO expression is seen in the several colormorphs. To identify the individual contribution of FMO family members, it will be important to systematically inactivate additional FMOs by themselves and in combinations (FMO 2, FMO 2_2, FMO 2_3, FMO 3, FMO 5-1) to address their function in pigmentation. The addition of tandem mass spectroscopy (MS/MS) to the analysis of the resulting pigments produced provides the opportunity of learning how the FMOs may differentially modify the naphthoquinones to result in distinct pigment expression18,21.
We recently reported that these same spines harbored distinct microbial loads8,9. If pigment has selective anti-microbial activity, then changes in profile of pigment molecules may also influence distinct microbial loads. The variation in pigment has correlative variation in microbial population, suggesting pigment interacts in some way with colonizing microbes. Perhaps different microbes are harbored on spines bearing distinct pigments, and as a result, a unique microbial population interacts with the spines. Perhaps then the naphthoquinone pathway is far more involved and complicated than originally anticipated, and the many genes found to differ in these spines reflects such complexity. Although only a few genes of the pigment pathway have been inactivated to test the naphthoquinone pathway, recent work has demonstrated that PKS1 is necessary and sufficient for the sea urchin pigment18. We now feel compelled to test this gene family of pigment genes, even the non-coding genes, that likely do not contribute to pathway function directly but for which may respond to differing levels of FMO or PKS1 activities.
Pigment patterns may use a distinct profile of the pigment enzymes used herein
Lv is the variegated sea urchin, with alternating colors on the test and spines. Some of the patterns on each of these sites are complex, with one color morphing into a different, and even a third color. This pigmentation is quite distinct from say, S. purpuratus, in which each adult has one main color throughout its spines and test4. Instead, Lv may create such complex pallets by the diversity of FMOs in the biomineralized tissues and the variations may be explained by distinct composites of FMOs, Sult1-c, PKS1 and other enzymes involved in this complex pigment pathway. How these genes are selectively transcribed along multiple centimeters of biomineralized tissues will be important to decipher in order to understand the overall colormorph mechanisms. Here we examine genes that contribute to pigmentation, based on their unique expression in the pigment cells of the larva and changes in that pigmentation when these genes are perturbed19,27. Since those pigments appear in precise locations on the test and along the spines, there must be a distinct set of genes dedicated to pattern. Currently, these are unknown but one of their functions must establish territories in which a color morph is activated or repressed.
Spines of the Lv species have a consistent morphology between the several color morphs
The epithelium of the spine is a critical barrier to pathogen invasion. The total surface area of the epithelium covering all spines vastly increases the total surface area of the animal and thus is a biologically expensive investment. The tradeoff is the protection provided by the spines. That epithelium is a highly ordered single layer of cells, it forms a complete barrier to the internal structures of the spines, and it dynamically expands through cell replication in the plane of the epithelium31. Immunological defense is richly provided by this structure by way of antimicrobial pigments, and immune cells, including pigmented red spherule cells present throughout the spine (and also enriched in the coelom)6,32. These cells are easily visible especially in the white versions of Lv. The spine therefore provides the first line of defense against organismal and microbial predators through the biomineral spine design and the defense mechanisms provided by pigment and immune cells that populate that structure. In addition to repelling some microbes, the pigment in spines influences greatly the microbiome that associates with the spines. The several natural color morphs in Lv and induced colormorphs by targeted gene inactivation8,9, show a causative mechanism of microbial association.
The complexity of the sea urchin spine provides utility as a model for identifying many properties of an adult structure. These include skeletal growth patterns, pattern distribution of color, how color production pathways are anatomically positioned, how immune cells operate in the epithelium, how microbial populations are established or repelled, how wound healing responses work, pattern of mitosis relative to spine growth and many others. Importantly, like vertebrates that have dendritic cells in the epithelium as a first line of immune defense33, this deuterostome also has a complex set of immune responders in its extensive epithelium raising the question: what ancient immune response mechanisms are conserved in all deuterostomes?
Methods
Crosses
We used adult sea urchins (> 30 mm horizontal diameter) from Beaufort NC (Bft) and Tavernier Key (Tav) in the Florida Keys for all crosses. Gametes from male and female urchins were obtained by injection of 1–2 mL of 0.55 M KCl into the coelomic cavity through the peristomial membrane. We grew the embryos in small glass finger bowls to the prism stage (approximately 18 h post fertilization), after which they were transferred to 4 L jars filled ¾ full with filtered seawater and fed with the algae Dunaliella tertiolecta. When the juvenile urchins reached 2–3 mm in size, they were transferred to 40 L glass aquaria (76 cm × 31 cm × 30 cm). At approx. 5 mm in diameter they were fed on the macro algae (Codium spp., Ulva lactuca, Gracilaria sp., and Dictyota sp.) and sea grasses (Zostera marina and Halodule wrightii, collected in accordance and with permission from the North Carolina Bureau of Fisheries) until they reached a size where their color phenotypes could be assessed.
Spine treatments
Spines were cut from the test with a scissors, and any tube feet or spine capsules (connective tissue with a muscular collar proximal to the milled ring) were removed. In cases where the spine was demineralized, they were cut from the test, and immersed in buffer (0.1M MOPs and 0.5M EDTA; pH 7.6) overnight or until the amount of demineralization required was reached.
Fixation and processing of spines for imaging
For immunolabeling, spines (intact, partially, or fully demineralized) were isolated and immersed in 0.1M MOPs buffer (pH7.8) containing 0.4M NaCl (MOPs/NaCl, containing 4% paraformaldehyde for 2–4 h, and then washed with MOPs/NaCl containing 0.5% Tween-20 for minimally 2 h. The fixed spines were then used immediately for immunolabeling, or stored at 4 °C until need. Antibodies were diluted appropriately (see Supplemental Table 1) in MOPs/NaCl/Tw20 and added to the fixed/washed spines for 2–4 h, washed 5 times and then exposed to a secondary fluorescently labeled antibody for 2–4 h, and washed 5 times (MOPs/NaCl/Tw20) before imaging on a Nikon CSW spinning disk confocal microscope. For in situ hybridization spines were prepared and hybridized as described34,35. The spines were hybridized only overnight since the hybridization buffer would begin to demineralize the samples. For counts of pigmented immune cells along the proximal-distal axis, spines were fixed in MOPs/NaCl, containing 4% paraformaldehyde for 2–4 h, and then washed with MOPs/NaCl, and demineralized as described above in EDTA to expose the pigmented immune cells. The immune cells were counted in fifty-micron swaths of the demineralized spine at the base, in the middle, and at the tip, and the percent of these counted cells in each region was calculated.
CRISPR/Cas9 test of gene function
For CRISPR Cas9, synthetic gRNAs were designed using CRISPRscan software (https://www.crisprscan.org/). The standard protocol was followed using the IDT Cas9 protein36. Two gRNAs were injected: LvPKS_286 (GAAGGTTCTGAAGGAAGGCA) and LvPKS_618 (CAGGGTGTACGCATCGGTGG).
RT-qPCR analysis
RNA was isolated with the RNeasy Micro kit (Qiagen). First-strand cDNA synthesis was performed using Maxima reverse transcriptase (Life Technologies). qPCR was performed using the Quant Studio 3 instrument with Maxima SYBR master mix and 25 μL reaction volumes (Life Technologies). All primers and gBlock templates (IDT) are listed in Supplemental Table 1. Experiments were run in triplicate, normalized to ubiquitin, and controls were set to 1.
For imaging by Scanning Electron Microscopy (SEM) isolated spines were placed in fixative (2.5% Glutaraldehyde/4% paraformaldehyde) in CFSW for 4 h. The fixed samples (intact, partially, or fully demineralized) were gradually (5% steps) washed into EtOH to 100%, critical point dried and then sputter coated. Imaging was accomplished on a Thermo Apreo VS SEM.
Preparation of spines for microComputed tomography (microCT) analysis
Full spines were dislodged from adults and placed in 5% bleach overnight with 4 changes, then washed briefly with deionized water, and 70% ethanol. The samples were then air dried, placed on a Bruker Skyscann 1276 microCT instrument, and imaged at 40 kV, 200milliAmps with an 0.5 Al filter. All imaging and analysis of these samples was accomplished on Bruker 3d Suite Skyscann software.
Septa counts
Spines were collected from L. variegatus, Florida (Pelagic Corp.) first noting the animal’s dominant color, i.e., red, green, or white. Three urchins of each color morph were selected. Samples were then selected starting with the most aboral spine in a column (along the aboral-oral axis) and then every 4–5th spine down the column, depending on the animal’s size (the 4th spine taken was just above the midline and the 5th spine just below the midline). The final spine selected was the most oral within that same column. This was then repeated twice in different body segments, giving a total of 3 sets of 8 spines per animal. Spines were then cut with a razor blade near the base but above the milled ring to create a small disc. Spines were sampled and cut multiple times from base to tip to ensure consistency of septa along the spine axis. Discs were then imaged on a stereo scope and the septa number was recorded.
Time-lapse acquisition of red spherule cells in an intact spine
Spines from L. variegatus were extracted from live animals, ensuring that the muscle-fiber base and milled ring of the spine remained intact. Spines were then placed in artificial sea water in a 35 mm glass bottom fluorodish and placed on the imaging stage of the Nikon Ti2e Spinning Disk Confocal Microscope using a 20× objective. Images were taken every 3 min for 1 h (spine 1), every 10 s for 10 min (spines 2, 3, and 5), or every 30 s for 10 min (spine 4), with a 30–50 μm Z stack and every 1–2 μm Z interval. The velocity of individual red-spherule cells from 5 spines of different L. variegatus individuals. Each dot on the graph (Fig. 13) represents an individual cell’s average velocity over the course of the time-lapse video. Significant p values between spines by One-way ANOVA are indicated with stars.
Data processing and analysis
NIS elements software was used to create a minimum intensity projection image of the Z stack images. Then, the minimum intensity projections of the time lapse projects were opened in FIJI37. The LIM tracker plugin38 was used to detect and link ROIs of cells in each frame of the time lapse. Exported data from the LIM tracker plugin included velocity in pixels per frame, and this was converted to μm per second using the conversion of 3.09 pixels per μm, and either 90 s, 30 s, 10 s per frame according to the dataset. One-Way ANOVA of average individual cell velocity grouped by spine was calculated and graphed in GraphPad Prism version 10.0.0 for Windows, GraphPad Software, Boston, Massachusetts USA, www.graphpad.com”.
Supplementary Information
Acknowledgements
The authors thank the National Institutes of Health (1R35GM140897, GMW; 1P20GM119943, NO; RO1 HD14483, DRM; T32GM136566, GR) and the National Science Foundation (IOS-1923445, GMW). The Thermo Apreo VS SEM was purchased with a high-end instrumentation grant from the Office of the Director at the National Institutes of Health (S10OD023461). Thanks to the Keck XROMM Core Facility at Brown University for use of the microCT scanner and to Erika Tavares for providing creative and expert scanning assistance.
Author contributions
Contributed experimental results: M.W., M.S., G.R., R.D., T.O., C.P., A.F., E.H., N.O., G.W. Writing of first draft: M.W., G.W. Assisted in editing the final drafts: M.W., M.S., G.R., R.D., T.O., C.P., A.F., E.H., N.O., D.R., G.W. Guided the overall research: M.W., D.R., D.M., G.W.
Data availability
All data generated or analysed during this study are included in this published article [and its supplementary information files].
Declarations
Competing interests
The authors declare no competing interests.
Footnotes
The original online version of this Article was revised: In the original version of this Article, the legends of Figure 9 and Figure 11 were switched. Full information regarding the correction made can be found in the correction for this Article.
Publisher’s note
Springer Nature remains neutral with regard to jurisdictional claims in published maps and institutional affiliations.
Change history
2/5/2025
A Correction to this paper has been published: 10.1038/s41598-025-87360-6
Supplementary Information
The online version contains supplementary material available at 10.1038/s41598-024-79312-3.
References
- 1.Barnes, R. D. Invertebrate Zoology (Saunders College, Rochester, 1980). [Google Scholar]
- 2.Hyman, H. The Invertebrates: Echinodermata (McGraw-Hill Education, New York, 1955). [Google Scholar]
- 3.Sea Urchin Genome Sequencing Consortium et al. The genome of the sea urchin Strongylocentrotus purpuratus. Science314, 941–952 (2006). [DOI] [PMC free article] [PubMed] [Google Scholar]
- 4.Fox, D. L. & Hopkins, T. S. The comparative biochemistry of pigments. In Physiology of Echinodermata (ed. Boolootian, R. A.) 277–300 (Interscience Publishers, Geneva, 1966). [Google Scholar]
- 5.Hibino, T. et al. The immune gene repertoire encoded in the purple sea urchin genome. Dev. Biol.300, 349–365 (2006). [DOI] [PubMed] [Google Scholar]
- 6.Smith, L. C. et al. Echinoderm immunity. Adv. Exp. Med. Biol.708, 260–301 (2010). [DOI] [PubMed] [Google Scholar]
- 7.Service, M. & Wardlaw, A. C. Echinochrome-A as a bactericidal substance in the coelomic fluid of Echinus esculentus (L.). Comp. Biochem. Physiol. Part B Comp. Biochem.79, 161–165 (1984). [Google Scholar]
- 8.Wessel, G. M., Kiyomoto, M., Reitzel, A. M. & Carrier, T. J. Pigmentation biosynthesis influences the microbiome in sea urchins. Proc. Biol. Sci.289, 20221088 (2022). [DOI] [PMC free article] [PubMed] [Google Scholar]
- 9.Wessel, G. M., Xing, L. & Oulhen, N. More than a colour; how pigment influences colourblind microbes. Philos. Trans. R. Soc. Lond. B Biol. Sci.379, 20230077 (2024). [DOI] [PMC free article] [PubMed] [Google Scholar]
- 10.Brusca, R. C., Giribet, G. & Moore, W. Invertebrates (Sinauer, Sunderland, 2022). [Google Scholar]
- 11.Miller, K. R. & Levine, J. S. Biology (Pearson Prentice Hall, Upper Saddle River, 2022). [Google Scholar]
- 12.Meruvu, H. & Dos Santos, J. C. Colors of life: A review on fungal pigments. Crit. Rev. Biotechnol.41, 1153–1177 (2021). [DOI] [PubMed] [Google Scholar]
- 13.Boolootian, R. A. Physiology of Echinodermata (Wiley, Hoboken, 1966). [Google Scholar]
- 14.Vevers, G. Pigmentation. In Physiology of Echinodermata (ed. RA, B.) 267–275 (Wiley, Hoboken, 1966). [Google Scholar]
- 15.MacMunn, C. On the chromatology of the blood of some invertebrates. Q. J. Microsc. Sci.25, 469–490 (1885). [Google Scholar]
- 16.MacMunn, C. A. Studies in animal chromatology. Proc. Bgham Philos. Soc.3, 351–407 (1883). [Google Scholar]
- 17.Ho, E. C. et al. Perturbation of gut bacteria induces a coordinated cellular immune response in the purple sea urchin larva. Immunol. Cell Biol.95, 647 (2017). [DOI] [PMC free article] [PubMed] [Google Scholar]
- 18.Li, F. et al. Sea urchin polyketide synthase SpPks1 produces the naphthalene precursor to echinoderm pigments. J. Am. Chem. Soc.144, 9363–9371 (2022). [DOI] [PMC free article] [PubMed] [Google Scholar]
- 19.Calestani, C., Rast, J. P. & Davidson, E. H. Isolation of pigment cell specific genes in the sea urchin embryo by differential macroarray screening. Development130, 4587–4596 (2003). [DOI] [PubMed] [Google Scholar]
- 20.Oulhen, N. & Wessel, G. M. Albinism as a visual, in vivo guide for CRISPR/Cas9 functionality in the sea urchin embryo. Mol. Reprod. Dev.83, 1046–1047 (2016). [DOI] [PMC free article] [PubMed] [Google Scholar]
- 21.Wessel, G. M., Kiyomoto, M., Shen, T. L. & Yajima, M. Genetic manipulation of the pigment pathway in a sea urchin reveals distinct lineage commitment prior to metamorphosis in the bilateral to radial body plan transition. Sci. Rep.10, 1973 (2020). [DOI] [PMC free article] [PubMed] [Google Scholar]
- 22.McClay, D. R. Evolutionary crossroads in developmental biology: Sea urchins. Development138, 2639–2648 (2011). [DOI] [PMC free article] [PubMed] [Google Scholar]
- 23.Davidson, P. L. et al. Chromosomal-level genome assembly of the sea urchin Lytechinus variegatus substantially improves functional genomic analyses. Genome Biol. Evol.12, 1080–1086 (2020). [DOI] [PMC free article] [PubMed] [Google Scholar]
- 24.Warner, J. F. et al. Chromosomal-level genome assembly of the painted sea urchin Lytechinus pictus: A genetically enabled model system for cell biology and embryonic development. Genome Biol. Evol.13, evab061 (2021). [DOI] [PMC free article] [PubMed] [Google Scholar]
- 25.Wise, M. L. Phenotypic and genetic diversity in the sea urchin Lytechinus variegatus (Order No. 3453400) [Doctoral dissertation, Duke University]. Available from ProQuest Dissertations & Theses Global. (867272757). (Order No. 3453400) [Doctoral dissertation, Duke University]. Available from ProQuest Dissertations & Theses Global. (867272757) (2011).
- 26.Gabius, H.-J., & Gabius, S. (Springer, 1993).
- 27.Perillo, M. et al. Regulation of dynamic pigment cell states at single-cell resolution. Elife9, e60388 (2020). [DOI] [PMC free article] [PubMed] [Google Scholar]
- 28.Benson, S. C., Benson, N. C. & Wilt, F. The organic matrix of the skeletal spicule of sea urchin embryos. J. Cell Biol.102, 1878–1886 (1986). [DOI] [PMC free article] [PubMed] [Google Scholar]
- 29.Richardson, W., Kitajima, T., Wilt, F. & Benson, S. Expression of an embryonic spicule matrix gene in calcified tissues of adult sea urchins. Dev. Biol.132, 266–269 (1989). [DOI] [PubMed] [Google Scholar]
- 30.Allen, R. L. et al. Wound repair in sea urchin larvae involves pigment cells and blastocoelar cells. Dev. Biol.491, 56–65 (2022). [DOI] [PMC free article] [PubMed] [Google Scholar]
- 31.Reinardy, H. C., Emerson, C. E., Manley, J. M. & Bodnar, A. G. Tissue regeneration and biomineralization in sea urchins: Role of Notch signaling and presence of stem cell markers. PLoS ONE10, e0133860 (2015). [DOI] [PMC free article] [PubMed] [Google Scholar]
- 32.Smith, L. C. et al. Echinodermata: The complex immune system in echinoderms. In Advances in Comparative Immunology (ed. Cooper, E. L.) 409–501 (Springer, 2018). [Google Scholar]
- 33.Parham, P. The Immune System Garland (2017).
- 34.Perillo, M., Paganos, P., Spurrell, M., Arnone, M. I. & Wessel, G. M. Methodology for whole mount and fluorescent RNA in situ hybridization in Echinoderms: Single, double, and beyond. Methods Mol. Biol.2219, 195–216 (2021). [DOI] [PMC free article] [PubMed] [Google Scholar]
- 35.Perillo, M., Swartz, S. Z., Pieplow, C. & Wessel, G. M. Molecular mechanisms of tubulogenesis revealed in the sea star hydro-vascular organ. Nat. Commun.14, 2402 (2023). [DOI] [PMC free article] [PubMed] [Google Scholar]
- 36.Oulhen, N., Pieplow, C., Perillo, M., Gregory, P. & Wessel, G. M. Optimizing CRISPR/Cas9-based gene manipulation in echinoderms. Dev. Biol.490, 117–124 (2022). [DOI] [PubMed] [Google Scholar]
- 37.Schindelin, J. et al. Fiji: An open-source platform for biological-image analysis. Nat. Methods9, 676–682 (2012). [DOI] [PMC free article] [PubMed] [Google Scholar]
- 38.Aragaki, H., Ogoh, K., Kondo, Y. & Aoki, K. LIM Tracker: A software package for cell tracking and analysis with advanced interactivity. Sci. Rep.12, 2702 (2022). [DOI] [PMC free article] [PubMed] [Google Scholar]
Associated Data
This section collects any data citations, data availability statements, or supplementary materials included in this article.
Supplementary Materials
Data Availability Statement
All data generated or analysed during this study are included in this published article [and its supplementary information files].


