

Abstract
Motivation: By accounting for variants within measured transcripts, it is possible to evaluate the status of somatic variants using single-cell RNA-sequencing (scRNA-seq) and to characterize their clonality. However, the sparsity (very few reads per transcript) or bias in protocols (favoring 3’ ends of the transcripts) makes the chance of capturing somatic variants very unlikely. This can be overcome by targeted sequencing or the use of mitochondrial variants as natural barcodes for clone identification. Currently, available computational tools focus on genotyping, but do not provide functionality for combined analysis of somatic and mitochondrial variants and functional analysis such as characterization of gene expression changes in detected clones. Results: Here, we propose SIGURD (SIngle cell level Genotyping Using scRna Data) (SIGURD), which is an R-based pipeline for the clonal analysis of scRNA-seq data. This allows the quantification of clones by leveraging both somatic and mitochondrial variants. SIGURD also allows for functional analysis after clonal detection: association of clones with cell populations, detection of differentially expressed genes across clones, and association of somatic and mitochondrial variants. Here, we demonstrate the power of SIGURD by analyzing single-cell data of colony-forming cells derived from patients with myeloproliferative neoplasms.
Keywords: single-cell genotyping, single-cell RNA-seq, clonality, myeloproliferative neoplasms, leukemia
Introduction
The development of single-cell RNA-sequencing (scRNA-seq) methods allows the characterization of transcriptional changes in yet poorly characterized cell types [1, 2]. This has been crucial to uncover cellular mechanisms related to diseases [3–6]. Clonal selection, i.e. the expansion of particular cell populations with malignant mutations, is a crucial mechanism in tumor cell development [7]. For example, in myeloproliferative neoplasms (MPNs), mutations in JAK2, CALR, or MPL [7–10] lead to the expansion of leukocytes, erythroid cells, and/or megakaryocytes in the bone marrow. The measurement of the genotype of cells within an scRNA-seq experiment allowed the investigation of transcriptional changes in mutated versus non-mutated cells and provided important insights into the molecular mechanisms of cancer.
Theoretically, the mutation status can be measured using standard scRNA-seq protocols by detecting mutated reads covering the mutation locus. However, the sparsity and bias of standard scRNA-seq renders the chance of detecting mutations in coding regions extremely low, particularly with current protocols focusing on capturing the 3’ end and recovery of a fraction of transcripts per cell. To overcome this problem, modified scRNA-seq assays combined with advanced computational methods have been developed [11–14]. This allowed the categorization of cells by both transcriptional and mutational status. In turn, this enabled the detection of expanded cell type populations and the differential gene expression analysis between mutated and wild-type (WT) cells within a patient. For example, the amplification of the CALR locus in MPN samples increased the detection of mutated cells from 1.4 to 88.7% and indicated the association of CALR mutated cells with unfolded protein response and NF-kB signaling when compared to WT [11]. Later, a similar approach was used to characterize JAK2V617F mutated cells [13] detected an enrichment in erythroid progenitors. Both studies focused on experimental protocols, and relied on the use of custom/simple bioinformatics scripts for genotyping.
Recently, two computational genotyping methods (cellSNP-lite [15] and VarTrix [16]) have been developed. These use read pile-ups obtained with short-read aligners to determine the number of mutated reads per position and cell. cellSNP-lite focuses on a time-efficient implementation for the detection of mutants in arbitrary regions. cellSNP-lite can only genotype single nucleotide polymorphisms (SNPs), and it only considers the first sequence of a unique molecular identifier (UMI) for genotyping to increase speed. VarTrix is a more general tool that also allows the detection of short indels. For genotyping, VarTrix performs a consensus variant call by considering all reads with the same UMI, which makes it more precise than cellSNP-lite. Due to the high computing time VarTrix can, in practice, be used only to genotype pre-selected genomic variants. Despite the power of these methods in the detection of variants in single cells, they do not provide any support for quality checks or additional down-stream analysis of transcriptional data, such as the identification of clones and differential expression analysis of mutated versus WT cells.
An alternative approach for single-cell genotyping is to explore mitochondrial (mt) variants (mtVars), serving as natural cellular barcodes for clones [12]. The fact that mtRNA transcripts are highly expressed makes the detection of mtVars easier than somatic variants (sVar). Moreover, amplification of mtRNAs in conjunction with standard 3’ scRNA-seq protocols and computational analysis improved the detection rate of clones by up to 50-fold [14]. However, the analysis of mtVars is not trivial, because they are non-functional. This can be solved by joint analysis of sVar and gene expression. For example, Caleb and colleagues demonstrated that characterized clones were both biased toward myeloid lineages and related to TET2 variants in an individual with clonal hematopoiesis [14]. The Mitochondrial Alteration Enrichment and Genome Analysis Toolkit (MAEGATK) [14] is a computational tool for genotyping mtVars from scRNA-seq. This tool uses aligned reads to detect all possible mtVars and uses a feature selection approach to filter mtVars that are specific to only a particular set of cells. As with previous genotyping tools, MAEGATK has its own output standards, and does not provide any integration with single-cell expression frameworks, such as Seurat [17].
Altogether, computational analysis of genotyping data focuses on specific protocols (mitochondrial [14] or somatic [13] variants). Currently, we lack a framework for integrating mtVar and sVar with gene expression data.
Our approach
Motivated by this, we developed SIGURD (SIngle cell level Genotyping Using scRna Data), an R package designed to combine the genotyping information from both sVar and mtVar analysis from distinct genotyping tools and integrative analysis across distinct samples. SIGURD provides a pipeline with all necessary steps for the analysis of genotyping data, including: (i) candidate variant acquisition, (ii) pre-processing and quality analysis of scRNA-seq with or without amplicon-based enriched sequencing, (iii) cell-level genotyping via integration of several tools, and (iv) representation of genotyping data in conjunction with the RNA expression data (Fig. 1). The last step allows a seamless integration with Seurat for further downstream analyses. These include contrasting single-cell genotyping and transcriptional status, e.g. enrichment of mutations in cell types and cell type-specific differential expression analysis (WT versus mutated cells). The genotyping information is saved as an R SummarizedExperiment [18] object and can be added to a Seurat [19] object as additional metadata. SIGURD can also consider candidate variants retrieved from databases such as the Catalogue Of Somatic Mutations In Cancer (COSMIC) [20]. This allowed us to focus on somatic candidate variants related to a particular disease entity, such as MPNs, which enhances both statistical power and lower computational requirements.
Figure 1.

Overview of SIGURD. SIGURD receives as input fastq files with reads generated in an amplicon or single-cell sequencing experiment, as well as a Seurat container with pre-processed scRNA-seq data. Additional inputs are VCF files with variants. Then, SIGURD performs a pre-alignment and QC to detect valid molecules. Subsequently, it allows the use of distinct single-cell genotyping tools (VarTrix, cellSNP-lite, and MAEGATK) and supports the detection of clonal cells. Results are integrated in a SIGURD data container and they can be analyzed (together with the scRNA-seq container) for tasks such as differential expression or enrichment analysis between clones.
To demonstrate the power of SIGURD, we present here a case study on the analysis of scRNA-seq in clonogenic cells from six MPN patients with polycythemia vera (PV), post-PV-myelofibrosis, and essential thrombocythemia (ET) [21], and three healthy controls (HC) [22]. We also amplified the JAK2V617F locus, as previously described [13, 23], the driver mutation in all analyzed MPN samples. We used this comprehensive data, which includes novel ET samples not analyzed previously [22], to show how SIGURD can combine mtVar and sVar analyses to characterize clonally associated transcriptional changes. Moreover, we also re-analyze and provide tutorials of scRNA-seq based genotyping data provided in [14]. This allows us to evaluate computational requirement and code characteristics of SIGURD.
Methods
The SIGURD pipeline receives as input a set of BAM files related to the single-cell and amplicon sequencing. Optionally, the user can provide a set of candidate regions for genotyping. Next, a pre-alignment and quality check analysis was performed to consider the coverage of reads in the variants and to support the selection of parameters associated with valid transcripts. Subsequently, it allows the use of a combination of genotyping tools (VarTrix, cellSNP-lite, and MAEGATK). Finally, it combines the results of genotyping tools by producing a Seurat-compatible container with both genotyping and single-cell data for further integrative analysis of the genotyping and transcriptome data.
Input
The genotyping data analysis requires several input files. This includes BAM files from scRNA-seq and amplicon sequencing (for either or both sVar/mtVar) and an scRNA-seq container processed with the scRNA-seq pipeline using Seurat [24].
Regarding sVars, cellSNP-lite or VarTrix can align and perform variant detection in the entire genome. Such genome-wide genotyping requires a long computing time and/or will find non-functional genotypes. To address this, SIGURD supports the selection of a list of candidate variants, obtained from the COSMIC database [20]. The COSMIC database contains information on millions of cancer-related variants.
This generates a variant call format (VCF) file, which can be used as an input for SIGURD.
Initial alignment and quality check
Before genotyping, SIGURD performs a pre-alignment and a quality control (QC). The combination of a cell barcode and UMI can be referred to as a molecule, i.e. a unique transcript measured in a specific cell. To avoid sequencing artifacts, genotyping tools should only consider molecules with sufficient reads that support a particular variant. This should be done in a sample- and protocol-specific manner, with the help of QC plots, as described below. In addition, only cells detected in the matching scRNA-seq (count matrix) were considered and reads with a mapping quality <30 were ignored.
SIGURD performs a pre-alignment with STAR [25]. It then generates QC plots to select parameters for the detection of valid molecules for somatic and mitochondrial variantmtVars. To define the cut-off number of reads per molecule, SIGURD provides plots (Fig. 2A and Fig. S2). A visual inspection of these plots indicates knees (drops in distributions) suggesting optimal threshold values. Importantly, this cut-off has an impact on the number of detected genotyped cells (Fig. 2B).
Figure 2.

Quality check plots. (A) Plot for number of reads per molecule (UMI) (y-axis) versus the rank of the molecule (x-axis) for JAK2V617F amplicon sequencing of selected MPN and HC samples. A knee in this plot can indicate a threshold for considering valid molecules in a particular library, as indicated with the dashed line. (B) The number of cells for various threshold of reads per molecule for selected libraries. The dashed line indicates the threshold. (C) The number of cells for various thresholds of VAF. The dashed line indicates a VAF threshold (21%) below which positive cells are not detected in HC samples.
An alternative approach to increase cell recovery is to select a more lenient threshold of reads per molecule, but filter cells by the variant allele frequency (VAF) in the case that disease and HC samples are available. One can choose a VAF with no positive cells (false positives) in HC (Fig. 2C). Another important plot is the visualization of the read coverage at a particular locus (Fig. S3). This illustrates if and how efficiently the amplification protocol worked. An increase in the number of molecules used will result in an increase in the number of genotyped cells, but possibly at a cost of having false positives. To account for this, one can adjust the parameters, which make the scRNA-seq VAF closer to the VAF estimated in DNA sequencing panels of the same samples.
The pre-processing will result in a filtered BAM file that only contains high-quality reads confidently mapped to annotated cells.
Genotyping
The genotyping module receives the pre-selected variants and filtered aligned reads as inputs. The genotyping can be performed using any combination of the following tools: VarTrix, cellSNP-lite, and MAEGATK. For genotyping specific sVars, the aforementioned VCF file with candidate variants is required.
VarTrix [16] evaluates aligned reads from a BAM file for each variant provided as input. For this, a VCF file containing the genomic information of the variants is required as input. The reads are locally re-aligned using the Smith–Waterman algorithm [16]. There are two output modes: consensus and alternative fraction. In the consensus mode, for each cell and variant, the output is either 0 when no reads cover the variant (NoCall), 1 when only reads supporting the reference sequence cover the variant (Ref), 2 when only reads supporting the alternative sequence cover the variant (Alt), or 3 when a mixture of alternative and reference reads covers the variant (Both). In alternative fraction mode, VarTrix produces a matrix that indicates the percentage of alternative reads per cell and variant. In combination with the previous options, VarTrix can be run in UMI mode (–umi). In UMI mode, VarTrix takes advantage of the sequencing depth of amplicon assays by taking the consensus of all reads per molecule, i.e. it only considers molecules with more than 90% of the reads supporting a sequence. We strongly recommend the use of the UMI mode.
cellSNP-lite [15] was designed to genotype cells at a high speed and low memory usage. This allows genotyping of full genomes, but only SNPs can be detected. A simple genotyping strategy, e.g. only the sequence of the first read is used, making cellSNP-lite very efficient, but potentially error-prone. The output from cellSNP-lite is a VCF file. In addition to standard VCF fields, the files contain a column for each cell with its genotype, read depth, and the number reads supporting each possible nucleotide. When analyzing a public data set [26], cellSNP-lite was six times faster than VarTrix, while using only 10% of the memory [15], i.e. cellSNP-lite required only 45 min and less than 1 GB memory in the analysis of standard scRNA-seq data [15]. However, by not considering the consensus sequences in reads with the same UMI, cellSNP-lite ignores the great depth of amplicon sequencing. In such cases, VarTrix is preferable.
MAEGATK [14] was designed to analyze clones by exploring the mtVars. MAEGATK is an extension of the Mitochondrial Genome Analysis Toolkit (MGATK) [27], designed for the analysis of scATAC-seq data. MAEGATK requires, as input, a BAM file and a list of cell barcodes. Reads are then grouped into molecules by UMI, cell barcodes, and the aligned positions. The reads are then collapsed, i.e. a consensus sequence for each group of reads is formed by identifying the most likely nucleotide at each position by majority vote. By default, SIGURD only considers molecules with at least three reads [14].
Clonality-related mitochondrial variants of interest (mtVOIs) must be detected de-novo and in an individual-specific manner [14, 28]. To facilitate this, SIGURD implements two mtVOI selection approaches [14].
In the unsupervised approach, SIGURD considers variants with a minimum VAF of  (default 90%) in the top quantile (default 90%) and a maximum VAF of
  (default 10%) in the bottom quantile (default 10%). This procedure guarantees that the candidate variant is present in at least a significant percentage but not in all cells in the sample, as exemplified in Fig. 3. In the supervised approach, variants are selected by considering cell information, e.g. time-point, treatment conditions, or scRNA-seq derived cell types when measured over a given donor/patient. For this, SIGURD first finds initial variants by using the unsupervised procedure in only one of the conditions. Next, it selects variants with an average VAF
  times higher (default=5) in the condition of interest versus the other cells. After mtVOIs are selected, SIGURD allows their visualization as a heat-map. Moreover, SIGURD allows the definition of clones by considering all combinations of mtVOIs. By considering the fraction of cells in a clone, clonal expansion can be detected. For further down stream analysis, SIGURD performs a filter by considering frequent clones (Fig. 6C).
Figure 3.
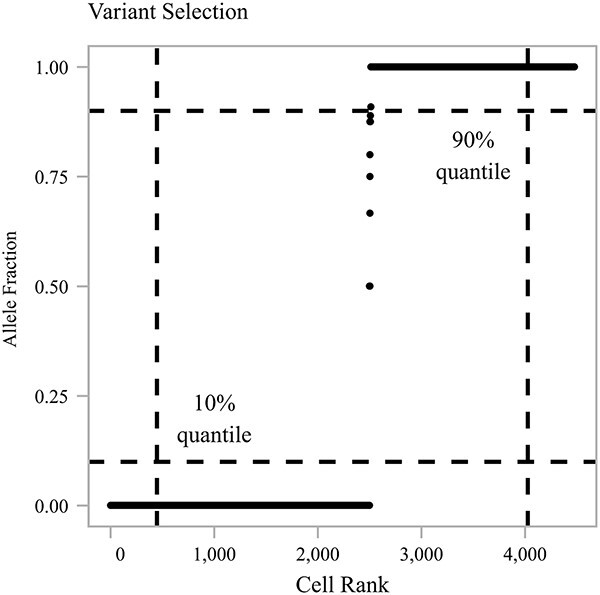
MT Variant Analysis. Plot displaying the VAF of cells for a given mtVar (y-axis) sorted by increasing VAF (x-axis). Dashed lines indicate the quantile thresholds used.
Figure 6.

Mitochondrial genotyping. (A-B) Heat maps with selected mtVOIs for samples HC2 and MPN1. The color gradient indicates the VAF. Moreover, combination of variants can be used to define clones, as indicated in the color bar below the heat map. “Negative” indicates cells with no detected mtVOI. (C) An important step in downstream analysis is to only consider clones covering at least a proportion of cells (5%, indicated by the dashed line). Each clone is a unique combination of mtVars, while the negative clone is comprised of cells without any detected mtVar. These clones were not investigated for differentially expressed genes, but used for the diversity analysis. (D) The effective number of species per condition. Comparison was performed using the Wilcoxon–Mann–Whitney test.
Integrative analysis of expression and genotypes
A typical experimental design will have scRNA-seq and amplicon data for several individuals/patients over distinct conditions: treatment or non-treatment, or time series design. Therefore, variant information needs to be combined per individual. To facilitate this, SIGURD requires an experimental design matrix, in which users define individuals and conditions as their respective input files (see Table S1 for an example).
For every individual, SIGURD reads the genotyping results and stores them in a SummarizedExperiment R object. This object holds the information if a variant was detected (Alt.), non-detected (Ref.), or if no call was possible (No Call). For every entry, it also records the information of molecules supporting the calls, the fraction of the mutated molecules, and read coverage. For the MAEGATK results, the object also contains the positional sequencing quality and the strand concordance. Additional metadata, such as cell types derived from scRNA-seq analysis, can be added.
Next, SIGURD allows the use of filters to improve genotyping calls. The first filter includes a minimum VAF value, because a low VAF is possibly related to artifacts/false positives. Cells that do not pass this threshold, which is set by default as 0, are defined as NoCall (Fig. 2C). Finally, SIGURD adds the final genotype information to a Seurat object to relate the clones with gene expression and cell type (from the scRNA-seq object) to SIGURD object.
With the combined information, the user can perform several analyses of the data. For sVars, a functionality of SIGURD is the estimation of the VAF per sample, which can be compared with the mutant VAF determined via DNA-sequencing. The same information can be compared for each cell type to verify whether the VAF is cell type-specific. The genotyping information can be used as a cell annotation variable, which can be utilized for visualization on a Uniform Manifold Approximation and Projection (UMAP). Another functionality is the use enrichment tests (based on Fisher’s exact test) to check if an sVar is associated with a cell type or a condition (treatment versus non-treatment) (Fig. 4).
Figure 4.

JAK2V617Fgenotyping. (A) UMAP with cell types detected in single-cell experiments. (B) Scatter plot of the JAK2V617F allele burden measured by amplicon data (x-axis) and DNA-sequencing (y-axis). We correlated the values using Pearson Correlation Coefficient. (C) UMAP displaying JAK2V617F positive, negative, and no-called cells. (D) Cell type enrichment for the JAK2V617F positive (versus negative) cells by cell types (adjusted P-values; Fisher’s exact test).
Finally, differential expression analysis (DE) is performed, e.g. comparing WT (Ref.) and mutated (Alt.) cells for a given cluster using standard DE analysis and Gene Set Enrichment Analysis (GSEA) methods Fig. 5). DE analysis used the Wilcoxon Rank Sum Test [29] and P-values were adjusted using the Bonferroni method. GSEA was based on a univariate linear model using decoupler [30] and P-values were adjusted using the Benjamini–Hochberg correction [31].
Figure 5.

Differential gene expression analysis. (A) Volcano plot showing the DEGs for the comparison JAK2V617F versus WT for the Orthochromatic Erythroblasts (OrthoE) cells. (B) Univariate Linear Model (ULM) results for GO terms (top 5 up and down) for OrthoE DE analysis. (C) ULM for hallmark gene sets for OrthoE and reticulocytes. Only pathways with at least one enrichment (adjusted P-value < 0.05) are displayed.
Finally, SIGURD uses the combination of mtVOIs to define clones. We can then explore ecological measures to measure clone diversity, as low diversity is indicative of clonality. SIGURD allows the use of classical measures such as Shannon Entropy [32], i.e.
 |
(1) |
where  is the probability of a cell being part of clone
  .
.  is the total number of species. We can also define the effective species [33] values as:
 |
(2) |
A higher number of clones indicates a higher diversity. This statistic also takes the relative abundance of the clone in the population into account. This means a sample with four clones, but where a single clone dominates has a lower diversity than a sample with four clones covering the same number of cells each. This is preferable to the use of the raw number of clones, which would be equivalent to the species richness. The richness does not take the expansion of a clone into account. By using the effective number of species, we are taking both the number of detected clones and their relative abundance into account.
Material and methods
Cell cultivation and treatment
Treatment and analysis of the cells were performed as described previously in Kalmer et al. [22]. Briefly, peripheral blood mononuclear cells were isolated and seeded in a colony-forming unit assay. Cells were harvested using pre-warmed PBS and applied to scRNA-seq following Chromium Next GEM Single Cell 3’ Reagent Kits v3.1 User Guide Rev D. Sequencing was done on a NextSeq500 using NextSeq500/550 Mid Output Kit v2.5 (150 cycles) or a NextSeq500/550 High Output Kit v2.5 (150 cycles). Locus specific amplification of JAK2V617F was performed as following Liu et al. [23], labeled using Sample Index Kit T Set A and sequenced on a NextSeq500/550 Mid Output Kit v2.5 (150 cycles) with 50% PhiX. MPN1, MPN2, MPN3, WT1, WT2, and WT3 are the untreated samples as described our previous paper [22]. The samples MPN4, MPN5, and MPN6 are new samples that have been processed together with the original data set. MPN1, MPN2, and MPN3 are PV samples, MPN4 was diagnosed with post-PV-myelofibrosis and MPN5 and MPN6 suffer from ET. None of the patients received cytoreductive treatment at the time of sampling. We have scRNA-seq data for all samples and JAK2V617F amplicon sequencing for all samples but for MPN6.
scRNAseq processing
We pre-processed the scRNA-seq data for each library with a cellranger pipeline (version 3.1.0) using the default parameters (genome version GRCh38). Data integration and clustering were performed using Seurat (version 4.2.3). We removed cells with 400 or fewer expressed genes, more than 40 000 reads in total, and genes expressed in less than 5 cells. These parameters correspond to more strict thresholds than the ones implemented in Seurat. QC plots before and after filtering are provided in Fig. S1.
Doublet detection and removal were performed with DoubletFinder [34]. Following data integration and principal component (PC) analysis, we constructed a shared nearest neighbor graph using the first 30 PCs and a clustering resolution of 0.5. Cell cycle scoring was performed using the CellCycleScoring function from Seurat.
Next, we ran SIGURD for the scRNA-seq and amplicon data. The cells were genotyped for sVars using VarTrix in UMI mode with a minimum mapping quality of 30. To increase cell recovery, we used a lenient threshold of 1 read per molecule. We only considered cells with a VAF >20%. MAEGATK was used for mtVars, with a minimum of 3 barcode reads and a minimum alignment quality of 30. We retrieved differentially expressed genes using Seurat’s FindMarkers function with the Wilcoxon Rank Sum Test. Only genes expressed in at least 10% of the cells in one of the groups were tested. P-values were adjusted using the Bonferroni correction.
Computational resources
We ran the experiments in cluster nodes with 2 x AMD EPYC 7452 (32 cores; 2.6 GHz) with a total of 1 TB memory. For the MAESTER replication data (as shown in Fig. S10), this required 14.2 min and a maximum of 37 GB on a single core. For the MPN data, 1.77 hours and a maximum of 57.89 GB were necessary, also on a single core.
Results
Here, we describe the application of SIGURD in single-cell data of clonogenic cells derived from MPN patients and healthy donors. First, we describe the genotyping results of amplicon sequencing, amplifying the JAK2V617F mutation in these samples. Next, we show results of clonal analysis by exploring mtVars. Finally, we present the combination of these distinct genotyping strategies. To ensure patient privacy, we have removed the variant information and instead assigned a number to each variant.
Genotyping of JAK2V617F positive cells
Single-cell experiments of three HC and six MPN samples captured 57 905 high-quality cells (average of 1297 genes per cell) [19]. We next used the available single-cell data of blood cells [1, 35, 36] to annotate the cells. This resulted in a large cluster, which contained erythroid and megakaryocytic cells (megakaryocyte progenitors (MK Prog), megakaryocyte-erythroid progenitors (MEP), pro-erythroblasts (ProE), basophilic (BasoE), polychromatic (PolyE), orthochromatic (OrthoE) erythroblasts, and reticulo-cytes; Fig. 4A). In addition, smaller lymphoid (T and B cells) and myeloid (granulocytes, macrophages, mast cell progenitors, and monocytes) cell populations were also recovered. See Fig. S4 for marker gene expression in our data set.
Next, we performed JAK2V617F amplicon based genotyping for five of six MPN samples and all three HC. We used VarTrix (as opposed to cellSNP-lite) because it considers all reads of a molecule for genotyping, and only JAK2V617F needed genotyping. As a first step, we performed QC analysis of the amplicon sequencing to check the amplification of JAK2 transcripts and cut-offs to delineate JAK2V617F positive cells. As shown in Fig. S3, amplicon sequencing increased read recovery 8-fold in most libraries.
Our initial quality check analysis indicated that 52 067 cells (out of 57 905) had at least one molecule covering the JAK2V617F locus (Fig. 2B), but the number of cells dropped quickly when more reads per molecule were required. Therefore, we used a lenient threshold of one read per molecule. Next, we checked the number of detected positive cells in all libraries for distinct VAF thresholds (Fig. 2C). We selected the minimum threshold of 21%, as this threshold did not detect any false positives (JAK2V617F positives) in the HC samples. As an additional check, we correlated the VAF detected using the scRNA data and NGS-sequencing (Fig. 4B). This indicated a high correlation (0.97; n=8), which supports the high agreement with the scRNA-seq based genotyping with DNA-sequencing. Altogether, SIGURD detected 603 JAK2V617F positive and 2616 negative cells.
By combining expression and genotyping data, SIGURD allows to detect cellular and gene expression changes related to mutations. UMAP indicated that JAK2V617F positive cells were particularly abundant among erythroid cells (Fig. 4C). A more principled way to analyze this is by using an enrichment test (Fisher’s exact test), which was performed and further indicated that JAK2V617F cells were particularly enriched in mature erythroid fractions (OrthoE and reticulocytes; Fig. 4D). To determine the impact of the JAK2V617F mutation on the gene expression of cells, we contrasted the expression profiles of positive and negative cells. To retain statistical power, we focused on cell types with a minimum number of cells (>50) per condition (Supp. Table S2). Of particular interest were OrthoE and reticulocytes, as these were enriched with JAK2V617F positive cells.
DE analysis detected 8 up- and 64 down-regulated genes in OrthoE (Fig. 5A), whereas no DE genes were found in reticulocytes (Fig. S5). Down-regulated genes (in OrthoE) included genes related to MHC protein complex and interferon response genes, while up-regulated genes included hemoglobin-related genes such as HBA2. The absence of DE genes in reticulocytes can be explained by the lower cell recovery (74 genotyped cells versus 345 for OrthoE). An alternative analysis to address this is GSEA, which considers fold changes of all measured genes. This revealed common pathways between OrthoE and reticulocytes, such as an increase in heme metabolism and G2M checkpoints as well as a down-regulation of interferon response genes.
Imputation of genotyping
We next evaluated if imputation algorithms (Bis [37], DCA [38], and MAGIC [39]) could further improve genotyping. For this, we considered all cells with a Jak2 transcript from MPN samples. Then, we removed the JAK2 gene expression, but included two new columns in the scRNA-seq count matrix: one for JAK2 WT reads and one for JAK2V617F reads. We masked both JAK2WT and JAK2V617F entries for 50% of cells and performed imputation. This procedure was repeated 10 times and we evaluated the correlation of imputed reads and VAF estimates of masked cells.
We observed that MAGIC and DCA obtained higher correlation in imputing JAK2 reads (R between 0.39–0.53) than Bis (R between 0.29–0.36) (S11). We noted however that MAGIC and Bis underestimated expression values of JAK2 reads. As an alternative, we evaluated the VAF values calculated from imputed read values, as the VAF is invariant to the imputed values. Here, we found a correlation of 0.71 for MAGIC, 0.65 for DCA, and 0.36 for Bis, which supports some degree of recovery of JAK2V617F VAF. However, we noticed that MAGIC and DCA imputed positive values for JAK2V617F reads in more than 99 of cells (Table S3). This indicates that a naive use of imputed reads might lead to the detection of false positive cells.
Genotyping with mitochondrial variants
Next, we explored mtVars to identify clones in these cells using scRNA-seq data. The QC analysis indicated good cell recovery (16 777 HC and 40 559 MPN cells) when 3 reads per cell were used (Fig. S6). We next detected mtVOIs using an unsupervised approach and standard parameters (as shown in Fig. 3). This approach resulted in the selection of 3–14 mtVOIs per sample (Figs 6 and S7). SIGURD adopts the definition that a combination of variants defines a clone, in contrast to previous reports [14], which used mtVOIs only. Next, we only considered clones covering at least a fraction of cells (>5%). With this, we detected 2–9 expanded clones in MPN, and 0–1 expanded clones in HC (Fig. S7). Cells with no positive mtVOIs (white columns in Fig. 6A-B) were annotated “negatives” and were disregarded in the downstream analyses. In these cells, mtVar detection failed, possibly due to low read coverage. The higher clonal expansion in MPN samples compared to HC is illustrated in Fig. 6A-C and Fig. S7. Ecology measures [32, 33, 40] provide a more formal way to evaluate the diversity of species (clones) in a population. Indeed, we observed a clear drop in diversity in the MPN samples compared to control (Fig. 6D). This confirmed the clonal expansion of disease lineages, as expected in clonal hematopoiesis, a feature of MPNs.
The functional characterization of clones derived from mtVars is not trivial, as we lack information on somatic mutations driving functional changes in these clones. In this case, we did not find any statistical association between the clones and JAK2V617F cells. However, the changes in cellular composition and gene expression can shed some light on this. We present in Fig. S8 cell type enrichment and GSEA for the three largest clones (Clone 1 – Clone 3) per MPN sample. For example, Clone 1 cells in MPN1 were enriched in early erythrocyte cells (ProE, BasoE), while clones Clone 2 and Clone 3 were enriched in late erythroid cells (OrthoE, reticulocytes). When considering gene expression changes in these clones (GSEA), we observed higher expression of heme metabolism genes in Clone 2 and Clone 3, but higher expression of MYC target genes in Clone 1. Similar molecular profiles were found in MPN2, where Clone 1 and Clone 2 were mostly related to late erythroid cells and Clone 3 to early erythroid cells.
To ensure that these differences were not only driven by cell composition, analysis of a clone should be performed by comparing cells per cell type. For MPN1 and Clone 1, both PolyE and ProE showed significantly lower heme metabolism (Fig. 7). Clone 1 PolyE also showed a reduction in interferon response genes, while ProE had an increased expression for G2M checkpoint, MYC targets, and oxidative phosphorylation pathways. In Clone 2, OrthoE showed an increase in heme metabolism, interferon response, and IL2 STAT5 signaling, while reticulocytes showed an increase in heme metabolism and a reduction in cell cycle pathways. In Clone 3, we observed an increase in heme metabolism for PolyE and OrthoE. This diversity in differentially regulated pathways indicates that these molecular changes were driven by clonality.
Figure 7.
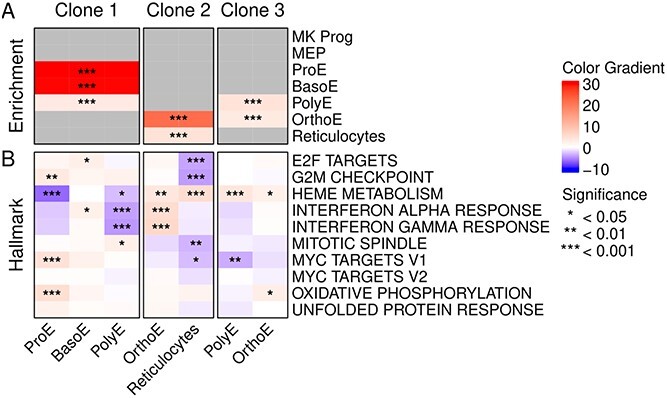
Mitochondrial genotyping and expression changes. (A) Heat map with cell type enrichment per clone ( P-value) for the MPN1 sample. (B) GSEA (Hallmark pathways) values on MPN1 clones of significantly enriched cell types from A). The same color scale was used for both results.
The procedure used for mtVar selection focused on variants identified in a large proportion of cells (>10%), as default by MAEGATK [14]. We reasoned that by using a more lenient threshold (>20 cells), we could identify mtVars related to JAK2V617F. Indeed, this procedure led to the identification of three mtVars in sample MPN2. Assuming that cells positive for these variants were JAK2V617F positive, this increased our cellular capture from 194 to 802 cells. GSEA analysis indicated similar molecular signatures in these cells, which supports similar molecular changes as in JAK2V617F cells (Fig. S9). These results further support the power of mtVars to improve genotyping of cells.
Comparison with alternative tools
While no other tool/framework provides all computational analysis provided by SIGURD, the manuscript describing MAEGATK provides scripts for both mtVar and somatic variant detection [14]. We compared the analysis scripts provided in [14], with the same scripts implemented with SIGURD. We found that our implementation reduced both time (84.36%) and memory requirements (64.61%) (Fig. S10). More importantly, SIGURD based code was much simpler (5 versus 46 lines) due to the use of parameterized functions and data containers (see Supp. Section “Code Evaluation” for examples). These results support altogether the value of SIGURD as a simple-to–use and reproducible framework.
Discussion
Here, we present SIGURD, a framework for analyzing single-cell genotyping data. SIGURD takes advantage of several genotyping methods for either somatic variants or mtVars, and allows the combined analysis of clonal/genotyping information with transcriptional information in the respective scRNA-seq data. This allowed us to gain insight into different types of variants, whereas previous approaches have focused on specific types of mutations, e.g. somatic variants [11] or mtVars [14, 27]. Our framework builds upon these previous and own publications [22] to provide an end-to-end analysis of single-cell genotyping and gene expression. This includes the processes of initial data acquisition, filtering and QC, detection of variants and integrative analysis.
We demonstrate the use of SIGURD in scRNA-seq and amplicon sequencing data of a driver mutation (JAK2V617F) in clonogenic cells from MPN patients. Using locus-specific amplicon sequencing, we could genotype hundreds of cells. Quality check plots (Fig. 2) provided by SIGURD are of extreme importance in maximizing the number of cells in the delineation of parameters, i.e. number of reads per molecule or VAF thresholds. Combined analysis of JAK2V617F genotyping and gene expression indicated an enrichment of mutated cells in late erythroid cells and the up-regulation of heme metabolism genes. These findings validate each other, as more mature erythroid cell types show a higher expression of heme metabolism [41].
Regarding mtVars, the comparative analysis indicated an expansion of clonal lineages within MPN patients compared to control. Interestingly, all MPN samples exhibited a mixture of clones enriched for later or early erythroid cells highlighting the heterogeneity of clones and the importance of their analysis. GSEA indicated that MYC target pathways were enriched in early erythroid cells, supporting expansion of these populations. Late erythroid cells have a similar signature as JAK2V617F positive cells, such as increase in heme metabolism. We did not observe any association of JAK2V617F positive cells and mitochondrially detected clones. An explanation for this discrepancy could be low cell recovery of mtVars in our data (52%). Note that previous work also used amplicon sequencing to enrich for mitochondrial reads [14, 27]. However, when we used modified criteria to detect mtVars, we were able to identify variants associated to JAK2V617F cells in one sample. This supports the need for further studies on selection of mtVOIs.
The potential sparsity of single cell genotyping data is a challenging aspect of its analysis. While SIGURD provides analysis steps to improve genotyping, the number of clones might still be low. For example, for JAK2V617F, we can only recover 1234 out of 38 991 erythroid cells in MPN samples. This has implications in differential gene expression analysis, as compared groups can be based in a few number of cells, i.e. 49 mutated cells versus 25 WT cells in 3954 reticulocytes. We do not recommend the analysis of low cell counts. Note also that GSEA based analysis, as shown in Fig. 7A, considers the list of all genes and provides more reliable results in such low cell count scenarios.
Imputation approaches [37–39] are a potential strategy to improve cell coverage. However, our analysis on JAK2 showed some predictive value of VAF of cells. Nonetheless, our results also indicate that imputation tools potentially overestimate the number of mutated cells. This is potentially due to the fact these gene expression imputation approaches are tailored for continuous values, while the genotyping problem is a categorical problem. There is clearly a need for further research on this interesting topic. For mitochondrial clone analysis, while we could obtain a high coverage, the use of mitochondrial amplicon experiments as performed by Miller et al. [14] would allow the use of more stringent thresholds, while also limiting the influence of possible confounding factors. Altogether, our analysis has shown how SIGURD is a comprehensive and simple to use framework combining genotyping and scRNA-seq data, and providing an in-depth analysis of multi-modal genotyping and transcriptomic data.
In the future, we will expand the described methods to include spatial data, such as spotted arrays [42]. This would allow the characterization of spatial organization of malignant clones. The sparsity of spatial data, which is greater than that scRNA-seq, requires the improvement of genotyping algorithms. Moreover, the fact that spotted arrays do not achieve cellular resolution requires novel methods for the selection of mtVOIs, which consider a mixture of cell populations.
Key Points
SIGURD is an R framework for end-to-end genotyping of scRNA-seq.
It is the only framework integrating mitochondrial barcoding, amplicon based genotyping, and transcriptomics at the single cell level.
We highlight its power in a case study of colony forming unit cells from patients with MPNs including amplicon sequencing of the JAK2V617F mutation.
Supplementary Material
Acknowledgements
This work was supported by the Genomics Facility of the Interdisciplinary Center for Clinical Research (IZKF) Aachen within the Faculty of Medicine at RWTH Aachen University. Biomaterial samples were provided by the RWTH centralized Biomaterial Bank Aachen (RWTH cBMB, Aachen, Germany) in accordance with the regulations of the Biomaterial Bank and the approval of the ethics committee of the medical faculty, RWTH Aachen. Part of this work was generated within the doctoral thesis works of M.K. and M.G.
Contributor Information
Martin Grasshoff, Institute for Computational Genomics, RWTH Aachen University, Pauwelsstr. 30, 52074 Aachen, NRW, Germany.
Milena Kalmer, Department of Hematology, Oncology, Hemostaseology and Stem Cell Transplantation, RWTH Aachen University, Pauwelstr 30, 52074 Aachen, NRW, Germany; Center for Integrated Oncology Aachen Bonn Cologne Düsseldorf (CIO ABCD), Düsseldorf, Germany.
Nicolas Chatain, Department of Hematology, Oncology, Hemostaseology and Stem Cell Transplantation, RWTH Aachen University, Pauwelstr 30, 52074 Aachen, NRW, Germany; Center for Integrated Oncology Aachen Bonn Cologne Düsseldorf (CIO ABCD), Düsseldorf, Germany.
Kim Kricheldorf, Department of Hematology, Oncology, Hemostaseology and Stem Cell Transplantation, RWTH Aachen University, Pauwelstr 30, 52074 Aachen, NRW, Germany; Center for Integrated Oncology Aachen Bonn Cologne Düsseldorf (CIO ABCD), Düsseldorf, Germany.
Angela Maurer, Department of Hematology, Oncology, Hemostaseology and Stem Cell Transplantation, RWTH Aachen University, Pauwelstr 30, 52074 Aachen, NRW, Germany; Center for Integrated Oncology Aachen Bonn Cologne Düsseldorf (CIO ABCD), Düsseldorf, Germany.
Ralf Weiskirchen, Institute of Molecular Pathobiochemistry, Experimental Gene Therapy and Clinical Chemistry (IFMPEGKC), RWTH Aachen University, Pauwelstr 30, 52074 Aachen, NRW, Germany.
Steffen Koschmieder, Department of Hematology, Oncology, Hemostaseology and Stem Cell Transplantation, RWTH Aachen University, Pauwelstr 30, 52074 Aachen, NRW, Germany; Center for Integrated Oncology Aachen Bonn Cologne Düsseldorf (CIO ABCD), Düsseldorf, Germany.
Ivan G Costa, Institute for Computational Genomics, RWTH Aachen University, Pauwelsstr. 30, 52074 Aachen, NRW, Germany.
Funding
This study was in part funded from German Research Foundation as part of the Clinical Research Unit CRU 344 to S.K., T.B., and I.C. (KO2155/7-1 and 7-2, BR 1782/5-2, and GE2811/4-1 and 4-2), by a grant to S.K. from the German Research Foundation (Deutsche Forschungsgemeinschaft, DFG) (KO 2155/6-1) and to I.C. by the E:MED Consortia Fibromap funded by the German Ministry of Education and Science (BMBF).
Conflict of interest
S.K. received research grant/funding from Geron, Janssen, AOP Pharma, and Novartis; received consulting fees from Pfizer, Incyte, Ariad, Novartis, AOP Pharma, Bristol Myers Squibb, Celgene, Geron, Janssen, CTI BioPharma, Roche, Bayer, GSK, Protagonist, mPN Hub, Bedrock, and PharmaEssentia; received payment or honoraria from Novartis, BMS/Celgene, Pfizer, Incyte, AOP Orphan, GSK, AbbVie, MPN Hub, Bedrock, iOMEDICO; received travel/accommodation support from Alexion, Novartis, Bristol Myers Squibb, Incyte, AOP Pharma, CTI BioPharma, Pfizer, Celgene, Janssen, Geron, Roche, AbbVie, GSK, Sierra Oncology, Kartos, Imago Biosciences, MSD, and iOMEDICO; had a patent issued for a BET inhibitor at RWTH Aachen University; participated on advisory boards for Pfizer, Incyte, Ariad, Novartis, AOP Pharma, BMS, Celgene, Geron, Janssen, CTI BioPharma, Roche, Bayer, GSK, Sierra Oncology, AbbVie, Protagonist, and PharmaEssentia.
Data availability
We deposited the pre-processed Seurat and SIGURD objects in Zenodo (https://zenodo.org/records/14065891). Code of SIGURD and tutorials are available at GitHub https://github.com/CostaLab/sigurd.
Author contributions
MG, MK, SK, and IC have designed the study, analyzed data, and revised the manuscript. MG performed all programming tasks and wrote the first version of the manuscript. MK has performed all wet-lab work and sequencing experiments. All authors have revised and approved the final version of the manuscript.
References
- 1. Hay S, Ferchen K, Chetal K. et al.. The human cell atlas bone marrow single-cell interactive web portal. Exp Hematol 2018;68:51–61. 10.1016/j.exphem.2018.09.004. [DOI] [PMC free article] [PubMed] [Google Scholar]
- 2. Han X, Zhou Z, Fei L. et al.. Construction of a human cell landscape at single-cell level. Nature 2020;581:303–9. 10.1038/s41586-020-2157-4. [DOI] [PubMed] [Google Scholar]
- 3. Jia Q, Chu H, Jin Z. et al.. High-throughput single-cell sequencing in cancer research. Signal Transduct Target Ther 2022;7:145. 10.1038/s41392-022-00990-4. [DOI] [PMC free article] [PubMed] [Google Scholar]
- 4. Dunbar AJ, Kim D, Lu M. et al.. CXCL8/CXCR2 signaling mediates bone marrow fibrosis and is a therapeutic target in myelofibrosis. Blood 2023;141:2508–19. 10.1182/blood.2022015418. [DOI] [PMC free article] [PubMed] [Google Scholar]
- 5. Hsu C, Chen Y, Huang C. et al.. Molecular heterogeneity unravelled by single-cell transcriptomics in patients with essential thrombocythaemia. Br J Haematol 2020;188:707–22. 10.1111/bjh.16225. [DOI] [PubMed] [Google Scholar]
- 6. Ji L, Fu G, Huang M. et al.. ScRNA-seq of colorectal cancer shows regional immune atlas with the function of CD20+ B cells. Cancer Lett 2024;584:216664. 10.1016/j.canlet.2024.216664. [DOI] [PubMed] [Google Scholar]
- 7. Mead AJ, Mullally A. Myeloproliferative neoplasm stem cells. Blood 2017;129:1607–16. 10.1182/blood-2016-10-696005. [DOI] [PMC free article] [PubMed] [Google Scholar]
- 8. Baxter EJ, Scott LM, Campbell PJ. et al.. Acquired mutation of the tyrosine kinase JAK2 in human myeloproliferative disorders. Lancet 2005;365:1054–61. 10.1016/S0140-6736(05)71142-9. [DOI] [PubMed] [Google Scholar]
- 9. Nangalia J, Massie CE, Baxter EJ. et al.. Somatic CALR mutations in myeloproliferative neoplasms with nonmutated JAK2. N Engl J Med 2013;369:2391–405. 10.1056/NEJMoa1312542. [DOI] [PMC free article] [PubMed] [Google Scholar]
- 10. Grinfeld J, Nangalia J, Baxter EJ. et al.. Classification and personalized prognosis in myeloproliferative neoplasms. N Engl J Med 2018;379:1416–30. 10.1056/NEJMoa1716614. [DOI] [PMC free article] [PubMed] [Google Scholar]
- 11. Nam AS, Kim K, Chaligne R. et al.. Somatic mutations and cell identity linked by genotyping of transcriptomes. Nature 2019;571:355–60. 10.1038/s41586-019-1367-0. [DOI] [PMC free article] [PubMed] [Google Scholar]
- 12. Nam AS, Kim K, Chaligne R. et al.. Lineage tracing in humans enabled by mitochondrial mutations and single-cell genomics. Cell 2019;176:1325–1339.e22. 10.1016/j.cell.2019.01.022. [DOI] [PMC free article] [PubMed] [Google Scholar]
- 13. Van Egeren D, Escabi J, Nguyen M. et al.. Reconstructing the lineage histories and differentiation trajectories of individual cancer cells in myeloproliferative neoplasms. Cell Stem Cell 2021;28:514–523.e9. 10.1016/j.stem.2021.02.001. [DOI] [PMC free article] [PubMed] [Google Scholar]
- 14. Miller TE, Lareau CA, Verga JA. et al.. Mitochondrial variant enrichment from high-throughput single-cell RNA sequencing resolves clonal populations. Nat Biotechnol 2022;40:1030–4. 10.1038/s41587-022-01210-8. [DOI] [PMC free article] [PubMed] [Google Scholar]
- 15. Huang X, Huang Y. Cellsnp-lite: an efficient tool for genotyping single cells. Bioinformatics 2021;37:4569–71. 10.1093/bioinformatics/btab358. [DOI] [PubMed] [Google Scholar]
- 16. Fiddes I, Marks P, Jackman S. et al.. VarTrix: 2021. Release v1.1.22, https://github.com/10XGenomics/vartrix.
- 17. Hao Y, Stuart T, Kowalski MH. et al.. Dictionary learning for integrative, multimodal and scalable single-cell analysis. Nat Biotechnol 2024;42:293–304. 10.1038/s41587-023-01767-y. [DOI] [PMC free article] [PubMed] [Google Scholar]
- 18. Morgan M, Obenchain V, Hester J. et al.. SummarizedExperiment: SummarizedExperiment Container 2022. R package version 1.28.0, https://bioconductor.org/packages/SummarizedExperiment.
- 19. Hao Y, Hao S, Andersen-Nissen E. et al.. Integrated analysis of multimodal single-cell data. Cell 2021;184:3573–3587.e29. 10.1016/j.cell.2021.04.048. [DOI] [PMC free article] [PubMed] [Google Scholar]
- 20. Tate JG, Bamford S, Jubb HC. et al.. Cosmic: the catalogue of somatic mutations in cancer. Nucleic Acids Res 2018;47:D941–7. [DOI] [PMC free article] [PubMed] [Google Scholar]
- 21. Arber DA, Orazi A, Hasserjian R. et al.. The 2016 revision to the world health organization classification of myeloid neoplasms and acute leukemia. Blood 2016;127:2391–405. 10.1182/blood-2016-03-643544. [DOI] [PubMed] [Google Scholar]
- 22. Kalmer M, Grasshoff M, Maié T. et al.. Deciphering the complex clonal heterogeneity of polycythemia vera and the response to interferon alpha. PREPRINT Version 1 available at Research Square. 2023. 10.21203/rs.3.rs-3490651/v1. [DOI]
- 23. Liu S, Nguyen M, Hormoz S. Integrating readout of somatic mutations in individual cells with single-cell transcriptional profiling. STAR Protocols 2021;2:100673. 10.1016/j.xpro.2021.100673. [DOI] [PMC free article] [PubMed] [Google Scholar]
- 24. Cheng M, Maié T, Nagai J. et al.. Scrna seurat analysis pipeline. 2020. Available at https://github.com/CostaLab/scrna_seurat_pipeline (15 November 2004, date last accessed).
- 25. Dobin A, Davis CA, Schlesinger F. et al.. STAR: Ultrafast universal RNA-seq aligner. Bioinformatics 2013;29:15–21. 10.1093/bioinformatics/bts635. [DOI] [PMC free article] [PubMed] [Google Scholar]
- 26. Heaton H, Talman AM, Knights A. et al.. Souporcell: Robust clustering of single-cell RNA-seq data by genotype without reference genotypes. Nat Methods 2020;17:615–20. 10.1038/s41592-020-0820-1. [DOI] [PMC free article] [PubMed] [Google Scholar]
- 27. Lareau CA, Ludwig LS, Muus C. et al.. Massively parallel single-cell mitochondrial DNA genotyping and chromatin profiling. Nat Biotechnol 2021;39:451–61. 10.1038/s41587-020-0645-6. [DOI] [PMC free article] [PubMed] [Google Scholar]
- 28. Beneyto-Calabuig S, Merbach AK, Kniffka JA. et al.. Clonally resolved single-cell multi-omics identifies routes of cellular differentiation in acute myeloid leukemia. Cell Stem Cell 2023;30:706–721.e8. 10.1016/j.stem.2023.04.001. [DOI] [PubMed] [Google Scholar]
- 29. Wilcoxon F. Individual comparisons by ranking methods. Biometrics 1945;1:80–3. 10.2307/3001968. [DOI] [Google Scholar]
- 30. Badia-I Mompel P, Santiago JV, Braunger J. et al.. Decoupler: ensemble of computational methods to infer biological activities from omics data. Bioinform Adv 2022;2:vbac016. [DOI] [PMC free article] [PubMed] [Google Scholar]
- 31. Benjamini Y, Hochberg Y. Controlling the false discovery rate: a practical and powerful approach to multiple testing. J R Stat Soc B Methodol 1995;57:289–300. 10.1111/j.2517-6161.1995.tb02031.x. [DOI] [Google Scholar]
- 32. Shannon CD. A mathematical theory of communication. Bell Syst Tech J 1948;27:379–423. 10.1002/j.1538-7305.1948.tb01338.x. [DOI] [Google Scholar]
- 33. Jost L. Entropy and diversity. Oikos 2006;113:363–75. 10.1111/j.2006.0030-1299.14714.x. [DOI] [Google Scholar]
- 34. McGinnis CS, Murrow LM, Gartner ZJ. Doubletfinder: doublet detection in single-cell RNA sequencing data using artificial nearest neighbors. Cell Systems 2019;8:329–337.e4. 10.1016/j.cels.2019.03.003. [DOI] [PMC free article] [PubMed] [Google Scholar]
- 35. Xie X, Liu M, Zhang Y. et al.. Single-cell transcriptomic landscape of human blood cells. Natl Sci Rev 2021;8:nwaa180. 10.1093/nsr/nwaa180. [DOI] [PMC free article] [PubMed] [Google Scholar]
- 36. Kingsley PD, Greenfest-Allen E, Frame JM. et al.. Ontogeny of erythroid gene expression. Blood 2013;121:e5–e13. 10.1182/blood-2012-04-422394. [DOI] [PMC free article] [PubMed] [Google Scholar]
- 37. Su Y, Yu Z, Yang Y. et al.. Distribution-agnostic deep learning enables accurate single-cell data recovery and transcriptional regulation interpretation. Adv Sci (Weinh) 2024;11:e2307280. 10.1002/advs.202307280. [DOI] [PMC free article] [PubMed] [Google Scholar]
- 38. Eraslan G, Simon LM, Mircea M. et al.. Single-cell RNA-seq denoising using a deep count autoencoder. Nat Commun 2019;10:390. 10.1038/s41467-018-07931-2. [DOI] [PMC free article] [PubMed] [Google Scholar]
- 39. Van Dijk, Sharma R, Nainys J. et al.. Recovering gene interactions from single-cell data using data diffusion. Cell 2018;174:716–729.e27. 10.1016/j.cell.2018.05.061. [DOI] [PMC free article] [PubMed] [Google Scholar]
- 40. Hill MO. Diversity and evenness: a unifying notation and its consequences. Ecology 1973;54:427–32. 10.2307/1934352. [DOI] [Google Scholar]
- 41. Chiabrando D, Mercurio S, Tolosano E. et al.. Heme and erythropoieis: more than a structural role. Haematologica 2014;99:973–83. 10.3324/haematol.2013.091991. [DOI] [PMC free article] [PubMed] [Google Scholar]
- 42. Chen L, Chang D, Tandukar B. et al.. STmut: a framework for visualizing somatic alterations in spatial transcriptomics data of cancer. Genome Biol 2023;24:273. 10.1186/s13059-023-03121-6. [DOI] [PMC free article] [PubMed] [Google Scholar]
Associated Data
This section collects any data citations, data availability statements, or supplementary materials included in this article.
Supplementary Materials
Data Availability Statement
We deposited the pre-processed Seurat and SIGURD objects in Zenodo (https://zenodo.org/records/14065891). Code of SIGURD and tutorials are available at GitHub https://github.com/CostaLab/sigurd.