

Abstract
Post‐natal growth influences short‐ and long‐term preterm infant outcomes. Different growth charts, such as the Fenton Growth Chart (FGC) and INTERGROWTH‐21st Preterm Post‐natal Growth Standards (IG‐PPGS), describe different growth curves and targets. This study compares FGC‐ and IG‐PPGS‐derived weight‐for‐postmenstrual age z‐score (WZ) up to 50 weeks postmenstrual age (PMA50) for predicting 1‐year anthropometry in 321 South African preterm infants. The change in WZ from birth to PMA50 (ΔWZ, calculated using FGC and IG‐PPGS) was correlated to age‐corrected 1‐year anthropometric z‐scores for weight‐for‐age (WAZ), length‐for‐age (LAZ), weight‐for‐length (WLZ) and BMI‐for‐age (BMIZ), and categorically compared with rates of underweight (WAZ < −2), stunting (LAZ < −2), wasting (WLZ < −2) and overweight (BMIZ > + 2). Multivariable analyses explored the effects of other early‐life exposures on malnutrition risk. At PMA50, mean WZ was significantly higher on IG‐PPGS (−0.56 ± 1.52) than FGC (−0.90 ± 1.52; p < 0.001), but ΔWZ was similar (IG‐PPGS −0.26 ± 1.23, FGC −0.11 ± 1.14; p = 0.153). Statistically significant ΔWZ differences emerged among small‐for‐gestational age infants (FGC −0.38 ± 1.22 vs. IG‐PPGS −0.01 ± 1.30; p < 0.001) and appropriate‐for‐gestational age infants (FGC + 0.02 ± 1.08, IG‐PPGS −0.39 ± 1.18; p < 0.001). Correlation coefficients of ΔWZ with WAZ, LAZ, WLZ and BMIZ were low (r < 0.45), though higher for FGC than IG‐PPGS. Compared with IG‐PPGS, ΔWZ < −1 on FGC predicted larger percentages of underweight (42% vs. 36%) and wasting (43% vs. 39%) and equal percentages of stunting (33%), while ΔWZ > + 1 predicted larger percentages overweight (57% vs. 38%). Both charts performed similarly in multivariable analysis. Differences between FGC and IG‐PPGS are less apparent when considering ΔWZ, highlighting the importance of assessing growth as change over time, irrespective of growth chart.
Keywords: birthweight, growth, growth charts, malnutrition, (MeSH terms) Infant, premature, weight gain
Key messages
Differences between the Fenton 2013 Growth Chart (FGC) and INTERGROWTH‐21st (IG‐PPGS) growth charts complicate growth assessment.
The choice of growth chart should rest on its ability to predict adverse outcomes such as malnutrition.
Though a given body weight produces different z‐scores (WZ) on FGC and IG‐PPGS, there is moderate‐to‐substantial agreement between the charts when considering the change in WZ from birth to 50 weeks postmenstrual age, and neither chart is clearly superior at predicting 1‐year malnutrition.
Assessing WZ as change over time mitigates the differences between FCG and IG‐PPGS.
Despite significant differences in absolute z‐scores, the Fenton and INTERGROWTH‐21st growth charts similarly predicted malnutrition at 1 year based on the change in weight z‐score from birth to 10 weeks corrected age. The Fenton chart performed slightly better in small‐for‐gestational age (SGA) infants and the INTERGROWTH‐21st chart in appropriate‐for‐gestational age (AGA) infants.

1. INTRODUCTION
Small, vulnerable newborns—born preterm and/or small‐for‐gestational age (SGA)—are at risk of adverse outcomes, including neonatal morbidity and mortality, childhood growth restriction, poor neurodevelopmental outcomes and later cardiometabolic disease (Ashorn et al., 2023; De Bie et al., 2010). Post‐natal growth may modulate these outcomes. Inadequate weight gain is associated with poorer neurodevelopmental outcomes (Ong et al., 2016; Stein et al., 2013) and persistent growth deficits (Christian et al., 2013; Kirk et al., 2017; Stein et al., 2013), while excessive early weight gain may be associated with later metabolic and cardiovascular disorders (Ong et al., 2016), though this is less evident resource‐limited populations (Stein et al., 2013). Determining appropriate growth targets for preterm infants is necessary for achieving optimal short‐ and long‐term outcomes.
Infant growth is assessed as a change in anthropometric measurements (commonly weight, length and head circumference) over time (Lampl et al., 2015). Calculation of age‐ and sex‐specific anthropometric z‐scores enables meaningful comparisons between groups and over time (Cordova & Belfort, 2020; World Health Organization Expert Committee on Physical Status, 1995). However, preterm infants present unique growth monitoring challenges, due to the missed period of intrauterine growth and its effect on post‐natal growth patterns. Traditionally, post‐natal growth that mimics intrauterine growth has been considered desirable, leading to the widespread use of growth charts based on cross‐sectional birth data (Cordova & Belfort, 2020). This includes the Fenton 2013 Growth Chart (FGC) (Fenton & Kim, 2013) which is widely used in South Africa. More recently, some researchers challenged this assumption on the basis that intrauterine and extrauterine growth are distinct physiologic processes occurring in very different environments. They proposed the actual growth of healthy preterm infants under ideal conditions as a more appropriate yardstick (Villar et al., 2018). This approach was used to compile the INTERGROWTH‐21st Post‐natal Growth Standards for Preterm Infants (IG‐PPGS) (Villar et al., 2015). These differences in the underlying premises (and, consequently, different study designs) resulted in FGC and IG‐PPGS following different trajectories.
Numerous studies have shown that FGC and IG‐PPGS differently identify early post‐natal growth faltering (up to term‐equivalent age) in preterm infants: FGC generally classifies more infants in a given group as exhibiting post‐natal growth restriction than the IG‐PPGS, whether infant size is assessed a single time point or as a change in z‐score from birth to discharge or term‐equivalent age (Barreto et al., 2021; Ceratto et al., 2020; Cordova et al., 2020; El Rafei et al., 2020; González‐García et al., 2021; Kim et al., 2021; Lebrão et al., 2020; Reddy et al., 2019; Yitayew et al., 2021). Each growth chart has strengths and weaknesses: the IG‐PPGS can claim greater global representativeness and strict individual‐level control, but is handicapped by very small sample sizes at lower gestational ages (GAs); whereas the FGC boasts a very large sample but with less ethnic diversity and no control over the individual characteristics of included infants (Cormack et al., 2016). While the relative importance of these characteristics remains open to debate, the pragmatic clinician will choose the growth chart that best identifies infants at risk of adverse outcomes, a question that remains under‐researched, especially for longer term growth outcomes. This research aimed to compare the FGC and INTERGROWTH‐21st Growth Standards (including the INTERGROWTH‐21st Newborn Size Standards [IG‐NBSS] and IG‐PPGS) for assessing weight‐for‐GA z‐scores in a historical cohort of South African preterm infants at birth and up to 50 weeks postmenstrual age (PMA) and to investigate their ability to predict 1‐year anthropometric outcomes (weight‐for‐age, weight‐for‐length, length‐for‐age and body mass index [BMI]‐for‐age), with additional emphasis on differences between SGA and appropriate‐for‐GA (AGA) infants.
2. METHODS
2.1. Sample selection
This study analysed existing clinic records from the postdischarge follow‐up clinic at the kangaroo mother care (KMC) unit of a tertiary academic hospital in Tshwane District, Gauteng Province, South Africa. Records of preterm infants (GA < 37 weeks) born before 1 January 2019 were eligible for inclusion if they had a recorded birthweight, GA and follow‐up data up to at least 1 year of age. Exclusion criteria included major anatomic abnormalities or medical treatments that hamper measurement (e.g., hydrocephalus, plaster casts) and conditions requiring specialised growth monitoring (e.g., trisomies). Sampling was purposefully planned to include a proportion of SGA (BW <10th percentile) infants above population prevalence to ensure sufficient numbers for meaningful subgroup analysis. Very few LGA infants were available in the sampling population, and they were thus excluded a posteriori.
Sample size calculations indicated that 130 each of SGA and AGA infants were needed to detect an effect size of 0.3 (difference between SGA and AGA infants) with α = 0.05 and power of 80% (G*Power v3.1.9.2; Heinrich‐Heine‐Universität, Düsseldorf). Records from 2018 to 2016 provided enough AGA infants, while records dating back to the clinic inception in 2012 were used to meet sample size requirements for the SGA infants. No major changes in infant feeding policies or clinical management protocols were implemented in this time period.
2.2. Data collection
2.2.1. Creation of clinic records
Birth information was copied from the maternity ward file to the KMC clinic record by the treating physicians in the KMC ward. Birthweight was measured with electronic scales. If pregnancy dating was uncertain, GA was confirmed by the paediatric doctors at birth using the Ballard score.
All follow‐up anthropometric measurements were taken by a single experienced hospital dietitian, limiting inter‐rater variation. Following KMC clinic protocols, infants were weighed naked using electronic infant weighing scales, and weight was recorded to the nearest 0.01 kg. Length was measured according to standard procedures using a portable measuring mat (with fixed, rigid headpiece and moveable footpiece) placed on a hard tabletop, and recorded to 0.1 cm. Paediatric doctors conducted and recorded medical examinations, and the dietitian collected and recorded infant feeding information.
2.2.2. Data extraction
Data were extracted from hand‐written clinic records twice, to two separate Excel spreadsheets, and checked for discrepancies using EpiInfo v3.5.1 (2008, CDC). Extracted data included birthweight, GA and relevant maternal and infant medical information, as well as infant anthropometry and feeding practices at each follow‐up visit. All infant ages were calculated in days: chronologic age was calculated electronically using the birth date and dates of visits, PMA (i.e., days since conception) was calculated as the sum of GA at birth and chronological age, and corrected age was calculated by subtracting the number of days of prematurity (280 minus GA) from the infant's age.
2.2.3. Data management
All anthropometric measurements were converted to age‐ and sex‐specific z‐scores using electronic calculators available online (IG‐NBSS: https://intergrowth21.tghn.org/newborn-size-birth/ [version 1.0.6257.25111, downloaded February 2021], IG‐PPGS: https://intergrowth21.tghn.org/postnatal-growth-preterm-infants/ [version 1.0.6257.25165, downloaded July 2021], FGC: https://ucalgary.ca/resource/preterm-growth-chart/calculators [downloaded July 2019] and WHO Anthro: http://www.who.int/childgrowth/software/en/ [version 3.2.2, downloaded May 2017]). The timeline of the study, including the three key time points at which data were collected and the growth charts used at each time point, is illustrated in Figure 1.
Figure 1.
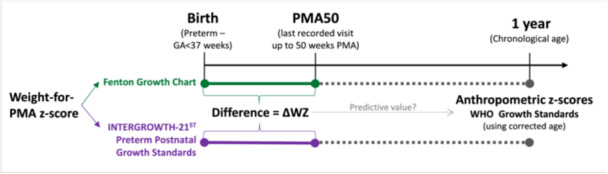
Timeline of study data collection, including growth charts used for analysis of anthropometric data at each time point.
Birthweight‐for‐GA z‐scores and percentiles were calculated using the FGC and IG‐NBSS and infants classified as SGA or AGA (BW between 10th and 90th percentiles, inclusive) using each growth chart.
Early post‐natal growth (ΔWZ) was quantified as the difference between weight‐for‐PMA z‐scores (WZ) at birth and at the last post‐natal visit that fell within the range of FGC (i.e., ≤50 weeks PMA, abbreviated as PMA50), using both FGC and IG‐PPGS.
Measurements between 50 and 64 weeks PMA were disregarded despite falling within the range of the IG‐PPGS, to ensure comparison of the same measurements on both growth charts. Group mean ΔWZ was calculated from individual ΔWZ values. Three patterns of early WZ growth were described: ΔWZ < −1 (growth deceleration), −1 ≤ ΔWZ ≤ + 1 (growth maintenance) and ΔWZ > + 1 (growth acceleration). This was further dichotomised to ΔWZ < −1 (growth deceleration) versus ΔWZ ≥ −1 (no growth deceleration) when investigating outcomes related to undernutrition, and to ΔWZ > + 1 (growth acceleration) versus ΔWZ ≤ +1 (no growth acceleration) when investigating overweight as an outcome.
One year anthropometric z‐scores were calculated for weight‐for‐age (WAZ), length‐for‐age (LAZ), weight‐for‐length (WLZ), and BMI‐for‐age (BMIZ) using WHO Anthro software with corrected age. Proportions of underweight (WAZ < −2), stunted (LAZ < −2), wasted (WLZ < −2), and overweight (BMIZ > + 2) infants were calculated (World Health Organization, 2008).
2.3. Data analysis
Data were analysed using R Statistical Software (version 4.1.2, 2021; R Foundation for Statistical Computing). All analyses were done for the whole sample and for SGA and AGA infants separately. Statistical significance was set at p < 0.05 for all analyses.
Continuous data were assessed for normality with the Shapiro–Wilk test. To compare results derived from FGC and IG‐PPGS, only those infants that were classified identically as SGA/AGA by both charts were included, to ensure that the comparator groups were consistently the same. Continuous variables (including WZ and ΔWZ on FGC vs. IG‐PPGS) were compared using the paired t test (normally distributed data) or Wilcoxon rank sign test (nonnormally distributed data), as the samples cannot be considered independent. Categorical agreement between the two charts was assessed using the Cohen's Kappa (Κ), calculated unweighted for nonordinal variables (SGA vs. AGA classification) and weighted for ordered variables (ΔWZ categories), and interpreted according to Altman's guidelines (Altman, 1990).
Pearson (normally distributed data)/Spearman (nonnormally distributed data) correlation coefficients (r) were used to investigate relationships between ΔWZ (using FGC and IG‐PPGS) and 1‐year anthropometric z‐scores (WAZ, LAZ, WLZ and BMIZ). Additionally, ΔWZ was dichotomised and compared with the presence or absence of malnutrition: ΔWZ categories of growth deceleration (ΔWZ < −1) versus no growth deceleration (ΔWZ ≥ −1) were compared with the presence or absence of underweight, stunting and wasting, while ΔWZ categories of growth acceleration (ΔWZ > + 1) versus no growth acceleration (ΔWZ ≤ +1) was compared with the presence or absence of overweight.
Finally, multiple regression analysis investigated associations between early life factors and anthropometric indicators of malnutrition at 1 year. First, univariate analyses related each exposure variable (i.e., maternal age, parity, gravidity, human immunodeficiency virus (HIV) status, antiretroviral drug use in pregnancy, maternal conditions, infant sex, GA at birth, birthweight‐for‐GA z‐score and SGA status [by FGC and IG‐NBS], multiple pregnancy, congenital heart conditions, breastfeeding status during KMC stay and ΔWZ [calculated using FGC and IG‐PPGS]) to each outcome indicator of malnutrition (i.e., underweight, stunting, wasting and overweight, as defined above). Variables with significant associations (i.e., p < 0.05) were included in multivariable models to determine the relative strength of their relationships to the outcomes of interest, expressed as odds ratios (ORs) with 95% confidence intervals (95% CIs), and McFadden's R 2 was calculated as a measure of the model's predictive ability. Since initial multivariable analyses indicated strong collinearity between anthropometric indices using the FGC and the INTERGROWTH‐21st Growth Standards, separate models were developed for each, and the two models were compared by investigating the ORs of comparable variables (with mutually exclusive 95% CIs indicating a true difference).
2.4. Ethical and legal considerations
Approval to conduct the study was obtained from the University of Pretoria Faculty of Health Sciences Research Ethics Committee (Protocol 227‐2021) and the hospital (KPTH 23/2021). All data were processed anonymously.
3. RESULTS
3.1. Sample description
The sample included 321 infants born to 301 mothers, as described in Table 1. The sample included 18 (6.4%) mothers aged ≤19 years and 74 (26.1%) aged ≥35 years. Sixty‐six mothers (23.3%) were primigravidae, gravidity exceeded parity in and 85 (30.0%), implying previous pregnancy loss or termination. Ethnicity was not recorded, but can reasonably be presumed to be majority Black African. Despite a 21.3% maternal HIV infection rate, none of the infants contracted HIV. Of note among the infants was the high rate of maternal breast milk feeding in the KMC unit, and the substantial number of infants with congenital heart conditions (100 [31.2%] infants, some with multiple abnormalities, including 65 [17.4%] patent ductus arteriosus, 47 [14.6%] patent foramen ovale, and eight [2.5%] ventricular/atrial septum defects. Only one infant required cardiac surgery.)
Table 1.
Characteristics of sample (301 mothers a ; 321 preterm infants) at birth and 1 year.
| Characteristic | N | Value |
|---|---|---|
| Maternal age [Median (IQR)] | 283 | 29 (25; 35) |
| Maternal parity [Median (IQR)] | 283 | 2 (1; 3) |
| Maternal gravidity [Median (IQR)] | 283 | 2 (2; 3) |
| Mother is a self‐reported foreign national [n (%)] | 301 | 76 (25.2) |
| Maternal HIV infection [n (%)] | 301 | 64 (21.3) |
| Timing of antiretroviral therapy (ART) initiation | 64 | |
| ART initiated before or during pregnancy | 44 (68.8) | |
| ART initiated after delivery | 10 (15.6) | |
| Timing of ART initiation not recorded | 10 (15.6) | |
| Maternal conditions b [n (%)] | 301 | |
| Conditions of the placenta, cord and membranes | 13 (4.3) | |
| Conditions of pregnancy | 60 (19.9) | |
| Conditions of labour and delivery | 64 (21.3) | |
| Maternal medical and surgical conditions | 115 (38.2) | |
| Infant sex (male) | 321 | 159 (49.5) |
| Gestational age (weeks) [Mean ± SD] | 321 | 32.8 ± 2.4 |
| Birthweight (kg) [Mean ± SD] | 321 | 1.64 ± 0.48 |
| Infant feeding in KMC unit [n (%)] | 321 | |
| Maternal breast milk | 314 (97.8) | |
| Infant morbidities [n (%)] | 321 | |
| Neonatal jaundice | 191 (59.5) | |
| Respiratory distress syndrome | 180 (56.1) | |
| Congenital heart conditionsc | 100 (31.2) | |
| Twins [n (%)] | 321 | 53 (16.5) |
| 1 year: Anthropometric z‐scores d [mean ± SD] | ||
| Weight‐for‐age (WAZ) | 321 | −0.59 ± 1.36 |
| Length‐for‐age (LAZ) | 320 | −0.91 ± 1.16 |
| Weight‐for‐length (WLZ) | 320 | −0.16 ± 1.31 |
| BMI‐for‐age (BMIZ) | 320 | −0.09 ± 1.30 |
| Indicators of malnutrition d [n(%)] | ||
| Underweight: WAZ < −2 | 321 | 50 (15.6) |
| Stunting: LAZ < −2 | 320 | 57 (17.8) |
| Wasting: WLZ < −2 | 320 | 23 (7.2) |
| Overweight: BMIZ > + 2 | 320 | 21 (6.6) |
| Infant feeding: any breastfeeding at 1 year [n(%)] | 181 (56.4) |
Abbreviations: ART, antiretroviral therapy; BMIZ, BMI‐for‐age z‐score; HIV, human immunodeficiency virus; IQR, interquartile range; KMC, kangaroo mother care; LAZ, length‐for‐age z‐score; SD, standard deviation; WAZ, weight‐for‐age z‐score; WLZ, weight‐for‐length z‐score.
Twenty duplicates records of mothers of twins were removed (thus mothers N = 301).
Maternal conditions are classified according to WHO ICD10‐PM categories (Word Health Organization, 2016). Conditions of labour and delivery only include conditions other than preterm delivery.
Includes patent ductus arteriosus (n = 65), patent foramen ovale (n = 47) and ventricular/atrial septum defects (n = 8); some infants had multiple abnormalities.
All age‐specific z‐scores were calculated using the WHO Growth Standards with corrected age. Length was only available for N = 320 infants.
3.2. Birthweight
Table 2 shows birth anthropometry. Birthweight z‐score according to FGC and IG‐NBSS did not differ significantly (p = 0.237). Both charts classified 305 infants (95.0%) the same way (99 SGA and 206 AGA); of the remaining 16 infants, four (1.3%) were classified as SGA by FGC but AGA by IG‐NBSS, and 12 (3.7%) were classified as AGA by FGC but SGA by IG‐NBSS. There was almost perfect agreement between the charts (Κ = 0.887).
Table 2.
Birthweight characteristics and early growth (up to 50 weeks postmenstrual age) of the sample according to the Fenton Growth Chart and INTERGROWTH‐21st Growth Standards.
| Birthweight characteristic | Fenton | IG‐NBSS | Test statistic |
|---|---|---|---|
| Classification [n(%)] (Entire sample, N = 321) | |||
| SGA | 103 (32.1) | 111 (34.6) | Κ = 0.887a |
| AGA | 218 (67.9) | 210 (65.4) | |
| Birthweight‐for‐GA z‐score in infants with identical SGA/AGA class on Fenton and IG‐NBSS (N = 303) | −0.78 ± 0.93 | −0.84 ± 1.06 | p = 0.237b |
| Weight characteristics at PMA50c in infants with identical SGA/AGA class on Fenton and IG‐NBSS |
Fenton Mean ± SD |
IG‐PPGS Mean ± SD |
Test statistic | ||
|---|---|---|---|---|---|
| Weight‐for‐PMA z‐score at PMA50 | |||||
| All (N = 303) | −0.90 ± 1.52 | −0.56 ± 1.52 | p < 0.001b | ||
| AGA (N = 204) | −0.25 ± 1.11 | 0.09 ± 1.09 | p < 0.001d | ||
| SGA (N = 99) | −2.22 ± 1.40 | −1.90 ± 1.42 | p < 0.001d | ||
| ΔWZ: Change in weight z‐score from birth to PMA50 | |||||
| All (N = 303) | −0.11 ± 1.14 | −0.26 ± 1.23 | p = 0.153b | ||
| AGA (N = 204) | +0.02 ± 1.08 | −0.39 ± 1.18 | p < 0.001d | ||
| SGA (N = 99) | −0.38 ± 1.22 | −0.01 ± 1.30 | p < 0.001d | ||
| ΔWZ growth class |
Fenton n (%) |
IG‐PPGS n (%) |
Test statistic | |
|---|---|---|---|---|
| All (N = 303) | ||||
| Acceleration: ΔWZ > + 1 | 43 (14.2) | 41 (13.5) | Κ = 0.647e | |
| Maintenance: −1 ≤ ΔWZ ≤ +1 | 195 (64.4) | 192 (63.4) | ||
| Deceleration: ΔWZ < − 1 | 65 (21.5) | 70 (23.1) | ||
| AGA (N = 204) | ||||
| Acceleration: ΔWZ > + 1 | 35 (17.2) | 22 (10.8) | Κ = 0.693e | |
| Maintenance: −1 ≤ ΔWZ ≤ +1 | 131 (64.2) | 130 (63.7) | ||
| Deceleration: ΔWZ < − 1 | 38 (18.6) | 52 (25.5) | ||
| SGA (N = 99) | ||||
| Acceleration: ΔWZ > + 1 | 8 (8.1) | 19 (19.2) | Κ = 0.556e | |
| Maintenance: −1 ≤ ΔWZ ≤ +1 | 64 (64.6) | 62 (62.6) | ||
| Deceleration: ΔWZ < − 1 | 27 (27.3) | 18 (18.2) | ||
Abbreviations: AGA, appropriate‐for‐gestational age (birthweight ≥10th and ≤90th percentile); GA, gestational age; IG‐NBSS, INTERGROWTH‐21ST Newborn Size Standards; IG‐PPGS, INTERGROWTH‐21st Post‐natal Growth Standards for Preterm Infants; PMA, postmenstrual age; SGA, small‐for‐gestational age (birthweight <10th percentile).
Cohen's Kappa, unweighted.
Wilcoxon Signed Rank test.
PMA50: the latest recorded visit up to 50 weeks postmenstrual age.
Paired t test.
Cohen's Kappa, weighted.
3.3. Early post‐natal growth
Table 2 and Figure 2 show infant anthropometry at PMA50 (mean PMA 45.6 ± 2.3 weeks, range 35.0–49.9 weeks). Mean WZ at PMA50 was significantly higher on IG‐PPGS than FGC, but ΔWZ did not differ significantly, with wide interindividual variation in ΔWZ on both charts. Some significant differences between FGC and IG‐PPGS emerged when ΔWZ of SGA and AGA infants were analysed separately. For AGA infants, weight z‐score remained nearly constant on FGC while decreasing substantially on IG‐PPGS. The reverse was true for SGA infants, with ΔWZ decreasing substantially on FGC but remaining stable on IG‐PPGS. Similar patterns were seen when ΔWZ was considered categorically: more AGA infants displayed growth deceleration (ΔWZ < −1) on IG‐PPGS than FGC (Κ = 0.693, substantial agreement), while more SGA infants exhibited growth deceleration on FGC than IG‐PPGS (Κ = 0.556, moderate agreement).
Figure 2.
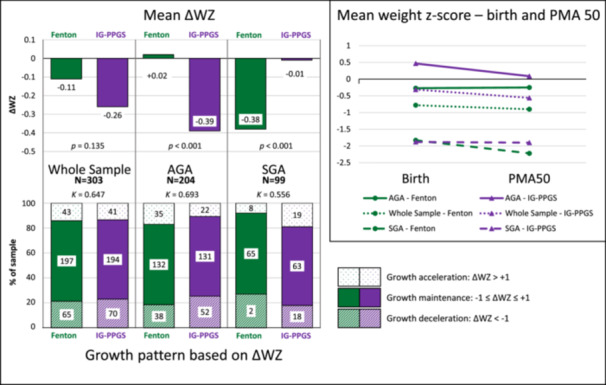
Early growth (up to 50 weeks postmenstrual age) of South African preterm infants (N = 303) according to the Fenton Growth Chart and INTERGROWTH‐21st Growth Standards. ΔWZ = the change in weight‐for‐age z‐score from birth to the last recorded visit up to 50 weeks postmenstrual age.
3.4. One‐year anthropometry
Table 1 shows infant characteristics at the 1‐year visit (mean chronological age 382 ± 19 days [12.6 ± 0.6 months], mean corrected age 332 ± 23 days [10.9 ± 0.8 months]). The SGA infants had consistently lower anthropometric z‐scores and higher rates of underweight, stunting and wasting than AGA infants (data not shown).
Figure 3 shows correlations between ΔWZ (using FGC and IG‐PPGS) and 1‐year anthropometric z‐scores (WAZ, LAZ, WLZ and BMIZ). One‐year z‐scores were more strongly correlated to ΔWZ on FGC than IG‐PPGS, although correlation coefficients were low (r < 0.45). The same was true for AGA and SGA infants analysed separately (Supporting Information S1: Table 1). Figure 3 also shows that, in most cases, <50% of malnutrition was correctly predicted by ΔWZ category. Few of these relationships remained statistically significant in AGA or SGA infants separately (Supporting Information S1: Table 2). In AGA infants, IG‐PPGS identified a larger proportion of infants with underweight (IG‐PPGS 64.2% vs. FGC 43.8%) and stunting (IG‐PPGS 47.3% vs. FGC 29.2%), while the reverse was true for overweight (FGC 66.7% vs. IG‐PPGS 41.2%). For SGA infants, FGC performed better in predicting underweight (FGC 41.1% vs. IG‐PPGS 25.0%), stunting (FGC 36.4% vs. IG‐PPGS 26.3%) and wasting (FGC 53.8% vs. IG‐PPGS 21.4%). Numbers of overweight SGA infants and wasted AGA infants were insufficient for robust statistical analysis.
Figure 3.
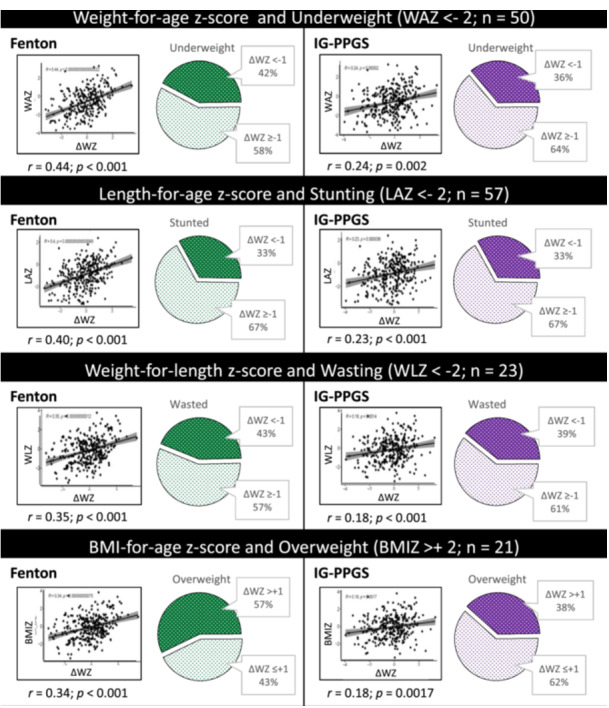
Relationships between 1‐year anthropometry and change in weight‐for‐age z‐score (ΔWZ) according to the Fenton Growth Chart and INTERGROWTH‐21st Growth Standards, in terms of correlations and dichotomous categories.
Univariate analyses found significant associations (p < 0.05) between indicators of malnutrition and birthweight z‐score (underweight, stunting and wasting), being SGA (underweight, stunting and wasting), ΔWZ (all outcomes), infant congenital heart conditions (underweight, wasting and overweight) and maternal conditions of pregnancy and labour/delivery (underweight only), shown in Table 3. The 95% CI of the ORs for FGC‐ and IG‐PPGS‐derived indicators overlapped, suggesting that they did not differ significantly.
Table 3.
Multiple regression analysis: odds ratios (with 95% confidence intervals) for selected exposure variables significantly associated with underweight, stunting, wasting and overweight at 1 year of age in preterm‐born infants.
| Outcomea | ||||
|---|---|---|---|---|
| Exposure | Underweight OR (95% CI) | Stunting OR (95% CI) | Wasting OR (95% CI) | Overweight OR (95% CI) |
| Univariate analysis b | ||||
| Maternal conditions of pregnancyc | 2.43 (1.21, 4.73) | — | — | — |
| Maternal conditions of labour & deliveryd | 0.31 (0.09, 0.79) | — | — | — |
| Infant congenital heart conditions | 2.15 (1.15, 3.97) | — | 4.68 (1.96, 12.0) | 0.22 (0.03, 0.76) |
| Birthweight z‐score on IG‐NBSS | 0.40 (0.28, 0.55) | 0.48 (0.35, 0.64) | 0.47 (0.32, 0.69) | — |
| Birthweight z‐score on Fenton | 0.30 (0.19, 0.43) | 0.42 (0.29, 0.59) | 0.40 (0.25, 0.62) | — |
| SGAe on IG‐NBSS | 6.72 (3.50, 13.55) | 5.31 (2.91, 9.98) | 3.25 (1.38, 8.07) | — |
| SGAe on Fenton | 6.22 (3.28, 12.24) | 3.87 (2.15, 7.06) | 3.04 (1.29, 7.37) | — |
| ΔWZ on IG‐PPGS | 0.77 (0.60, 0.98) | 0.71 (0.56, 0.89) | 0.79 (0.56, 1.11) | 1.79 (1.21, 2.75) |
| ΔWZ on Fenton | 0.51 (0.38, 0.67) | 0.54 (0.41, 0.70) | 0.52 (0.35, 0.75) | 2.62 (1.66, 4.37) |
| Multivariable analysis—Model 1—Fenton | ||||
| Maternal conditions of pregnancyc | 0.39 (0.17, 0.89)* | — | — | — |
| Birthweight z‐score—Fenton | 0.30 (0.15, 0.57)*** | 0.43 (0.24, 0.73)** | 0.31 (0.14, 0.64)** | — |
| ΔWZ on Fenton | 0.49 (0.34, 0.69)*** | 0.55 (0.40, 0.72)*** | 0.55 (0.35, 0.86)** | 2.43 (1.52, 4.10)*** |
| Model R 2 f | 0.261 | 0.155 | 0.192 | 0.133 |
| Multivariable analysis—Model 2—IG‐PPGS | ||||
| Maternal conditions of pregnancyc | 0.33 (0.15, 0.75)** | — | — | — |
| Infant congenital heart conditions | — | — | 0.37 (0.14, 0.99)* | — |
| Birthweight z‐score—IG‐NBSS | 0.45 (0.25, 0.78)** | 0.61 (0.37, 0.99)* | 0.42 (0.21, 0.81)** | — |
| SGAe on IG‐NBSS | — | 2.99 (1.07, 8.65)* | — | — |
| ΔWZ on IG‐PPGS | 0.60 (0.44, 0.80)*** | 0.58 (0.44, 0.75)*** | — | 1.73 (1.15, 2.70)* |
| Model R 2 f | 0.223 | 0.166 | 0.150 | 0.037 |
Note: —, no significant association.
Abbreviations: ΔWZ, Change in weight z‐score between birth and 50 weeks; Fenton, Fenton 2013 growth chart; IG‐NBSS, INTERGROWTH‐21st Newborn Size Standards; IG‐PPGS, INTERGROWTH‐21st Postnatal Growth Standards for Preterm Infants.
Underweight: weight‐for‐age z‐score <−2; stunting: length‐for‐age z‐score <−2; wasting: weight‐for‐length z‐score <−2; overweight: BMI‐for‐age z‐score >+2 (Z‐scores calculated using the WHO Growth Standards, with age corrected for preterm birth).
On univariate analysis: no significant relationships for maternal age, parity, gravidity, HIV, timing of ART initiation, maternal conditions of the placenta, cord or membranes, maternal medical and surgical conditions, infant sex, breastfeeding at last visit.
Maternal conditions of pregnancy include incompetent cervix, preterm rupture of membranes, oligohydramnios/polyhydramnios, ectopic pregnancy, multiple pregnancy, malpresentation and other complications of pregnancy (excluding pregnancy‐related medical conditions like hypertensive disorders, pre‐eclampsia and gestational diabetes mellitus) (World Health Organization, 2016).
Maternal conditions of labour and delivery include breech delivery, malposition and disproportion during labour and delivery, forceps delivery/vacuum extraction, Caesarean delivery, spontaneous preterm labour, and other complications of labour and delivery (World Health Organization, 2016).
SGA, small for gestational age (birthweight‐for‐GA <10th percentile).
McFadden's R 2. Values > 0.4 indicate good predictive ability.
p < 0.05;
p < 0.01;
p < 0.001.
Multivariable predictive models all had low R 2 values (<0.3), indicating poor predictive abilities. Models using FGC had higher R 2 values for predicting underweight, wasting and overweight, whereas the INTERGROWTH‐21st model performed better for stunting. Underweight increased with maternal conditions of pregnancy and decreased with higher birthweight z‐score and larger ΔWZ. Stunting increased with being SGA on IG‐NBSS (but not FGC) and decreased with higher birthweight z‐score and larger ΔWZ. Wasting increased with congenital heart conditions (INTERGROWTH‐21st model only) and decreased with higher birthweight z‐score and larger ΔWZ (FGC only). Overweight increased with greater ΔWZ. The overlap between the 95% CI of the ORs for FGC‐ and IG‐PPGS‐derived indicators precludes definitive statements about the superiority of one chart over the other.
4. DISCUSSION
This study highlighted key similarities and differences between the FGC and the IG‐PPGS for monitoring early growth in a South African cohort of preterm‐born infants, with particular reference to relationships between early growth and anthropometric outcomes at 1 year of age. Apart from the high proportion of SGA infants (due to deliberate over‐sampling), the study sample is comparable to preterm infant study populations described in other South African KMC units (Pike et al., 2017; Ramdin et al., 2021).
The FGC and IG‐NBSS evaluated birthweight similarly, suggesting that the choice of growth chart at birth has little effect on clinical decision‐making. Similar results were found in studies from Spain (González‐García et al., 2021), the United States of America (Yitayew et al., 2021), and Brazil (Lebrão et al., 2020). Other studies have found statistically significant (though quantitatively small) differences in SGA classification, particularly in term infants (Barreto et al., 2021) or when considering length (Kim et al., 2021) or head circumference (Reddy et al., 2019).
More substantial differences between FGC and IG‐PPGS were seen with post‐natal growth assessment. The higher mean WZ at PMA50 on IG‐PPGS than FGC echoes previous studies (Cordova et al., 2020; El Rafei et al., 2020; González‐García et al., 2021; Kim et al., 2021). This is consistent with the charts’ trajectories: at most ages, FCG reference curves have a higher absolute weight than the IG‐PPGS (though there are some exceptions at low z‐scores); thus, a given weight at the same GA will generally have a lower z‐score on FCG than IG‐PPGS (Villar et al., 2018).
When considering WZ change over time (i.e., ΔWZ), the difference between FGC and IG‐PPGS was small and not statistically significant, except when SGA and AGA infants were considered separately, with the direction of the difference depending on the chart used. On average, FGC showed normal growth in AGA infants and growth faltering in SGA infants, while IG‐PPGS showed normal growth in SGA infants and growth faltering in AGA infants. This pattern persisted when ΔWZ was categorised as growth acceleration, growth maintenance or growth deceleration. SGA infants followed the pattern described in previous studies, with FGC identifying higher rates of growth deceleration than IG‐PPGS when applied in the same sample (Ceratto et al., 2020; El Rafei et al., 2020; González‐García et al., 2021; Kim et al., 2021; Reddy et al., 2019; Yitayew et al., 2021). However, in this study, the opposite was true for AGA infants with IG‐PPGS identifying higher rates of growth deceleration than FGC. Only one Australian study of very preterm infants (GA < 33 weeks) had a similar finding, with IG‐PPGS identifying more growth faltering up to 40 weeks PMA than FGC (Cordova et al., 2020). The differences between this study and previous research may be due to the timing of the final growth assessment: while we used the last measurement up to PMA50, other studies assessed growth at 36–40 weeks PMA or hospital discharge. It is conceivable that the home environment and post‐term physiologic maturation may differently affect the growth of SGA and AGA infants.
In clinical practice, early growth monitoring is useful if it can timeously identify infants who are at risk of adverse outcomes, such as later malnutrition. In this study, ΔWZ on FGC was more strongly correlated to 1‐year anthropometry than IG‐PPGS, although correlation coefficients were poor throughout. When ΔWZ was dichotomised, FGC predicted a greater proportion of later underweight, stunting, wasting and overweight than IG‐PPGS, in the whole group and in SGA infants, while in AGA infants, IG‐PPGS better predicted underweight and stunting. Numerous studies have reported associations between poor early growth and low childhood weight and length (reviewed by Martínez‐Jiménez et al., 2020), but no published studies were found that compared the performance of two early growth charts in this way.
In multivariable analyses, ΔWZ was inversely associated with 1‐year underweight (both charts), stunting (both charts), wasting (only FGC) and positively associated with overweight (both charts). These effects have been described in the literature (Martínez‐Jiménez et al., 2020). This study adds new information about the relative ability of FGC and IG‐PPGS to predict anthropometric outcomes. All models were poor predictors of the outcomes in question, and while models using FGC had higher R 2 values than those using IG‐NBS and IG‐PPGS, the considerable overlap between 95% CIs of the ORs for individual exposure variables suggests that they do not differ significantly. Thus, while birthweight z‐score and ΔWZ do predict anthropometry at 1 year, the choice of growth chart appears to be a relatively minor matter.
Regardless of the growth chart used, birthweight z‐score and ΔWZ were imperfect predictors of 1‐year anthropometry. This is not unexpected: while early growth (including fetal growth) plays an important role in setting the growth trajectory, growth in infancy and childhood is affected by a myriad of factors, including dietary intake, illness, caregiving practices and socioeconomics. The multivariable analysis included some maternal factors and exposures that were present at birth and during pregnancy, but few of these contributed significantly to the outcomes. However, the limitations of using routinely collected clinical data must be acknowledged here, particularly the potential incompleteness of data on maternal factors and conditions during pregnancy. Infant feeding data, including breastfeeding information, was limited to simple yes/no answers, with no information on the frequency or adequacy of feeds. The only infant feeding characteristic included was breastfeeding at PMA50 (i.e., whether the infant was still receiving any breast milk at the same visit that was used to calculate ΔWZ), and no significant associations were found. Other feeding practices, particularly during the complementary feeding phase, should be investigated in more detail in future studies.
Although the follow‐up anthropometric data can be considered complete and reliable, due to the careful and consistent measurement procedures employed by the clinic dietitian, the analyses are limited by the lack of reliable birth length measurements. Birth length is an important predictor of stunting (Krebs et al., 2022; Namirembe et al., 2022), and stunting is the most prevalent form of child malnutrition in South Africa (National Department of Health, Statistics South Africa, & South African Medical Research Council, 2017). Thus, it is strongly recommended that future studies include accurate, reliable measurements of birth length, and investigate changes in the birth length z‐score over time as a predictor of length‐for‐age and stunting at later ages. This would also allow for the inclusion of weight‐length ratio (Villar et al., 2017) and BMI at birth (Olsen et al., 2015) as predictive variables, factors that may be of interest when investigating overweight as an outcome. Additionally, though the WHO Growth Standards are the best available tool for infant and young child growth assessment, the reference sample included only infants born at term. However, we compensated for this by correcting infant age for prematurity, a method supported by the fact that the age‐corrected weight, height and length of infants in the INTERGROWTH‐21st sample naturally reached the same levels and distribution as the WHO Growth Standards by 64 weeks PMA (Villar et al., 2015).
Finally, future research could also investigate the differences between FGC and IG‐PPGS in predicting other outcomes of interest, including infant mortality and neurodevelopmental outcomes. The little available research relating to neurodevelopmental outcomes has all come from high‐income countries, and results have been conflicting (Cordova et al., 2020; Yitayew et al., 2021).
5. CONCLUSION
In this sample, FGC and IG‐PPGS differed in their assessment of weight‐for‐PMA z‐score up to 50 weeks of PMA, but the differences between the charts were less apparent when the change in weight‐for‐PMA z‐score over time was considered. On average, SGA infants followed the growth trajectory described by IG‐PPGS more closely (seen as a minimal change in the z‐score over time), while AGA infants followed the FGC more closely. Neither chart was consistently superior at predicting malnutrition at 1 year, though FGC performed slightly better in SGA infants and the group as a whole (possibly due to the high proportion of SGA infants included in the sample), while IG‐PPGS performed slightly better in AGA infants. Regardless of the chart used, evaluating infant growth as trends over time, rather than as an absolute z‐score at one timepoint, may go some way towards harmonising the differences between different preterm infant growth charts.
AUTHOR CONTRIBUTIONS
Sanja Nel, Friedeburg Anna Maria Wenhold, Ute Dagmar Feucht, and Tanita Botha planned the study. Sanja Nel collected the data. Friedeburg Anna Maria Wenhold and Ute Dagmar Feucht provided supervision. Tanita Botha performed all statistical analyses. Sanja Nel wrote the first draft and all authors contributed substantially to subsequent drafts.
CONFLICT OF INTEREST STATEMENT
The authors declare no conflict of interest.
Supporting information
Supplementary information.
ACKNOWLEDGEMENTS
The authors gratefully acknowledge the hard work of Dr Elise van Rooyen, Dr Marieke Boersema and Ms Marlene Gilfillan RD(SA) and their team at the Kalafong Hospital KMC Follow‐up Clinic.
Nel, S. , Feucht, U. D. , Botha, T. , & Wenhold, F. A. M. (2024). Infant growth by INTERGROWTH‐21st and Fenton Growth Charts: Predicting 1‐year anthropometry in South African preterm infants. Maternal & Child Nutrition, 20, e13663. 10.1111/mcn.13663
DATA AVAILABILITY STATEMENT
The data that support the findings of this study are available from the corresponding author upon reasonable request.
REFERENCES
- Altman, D. (1990). Practical statistics for medical research. Chapman and Hall/CRC. [Google Scholar]
- Ashorn, P. , Ashorn, U. , Muthiani, Y. , Aboubaker, S. , Askari, S. , Bahl, R. , Black, R. E. , Dalmiya, N. , Duggan, C. P. , Hofmeyr, G. J. , Kennedy, S. H. , Klein, N. , Lawn, J. E. , Shiffman, J. , Simon, J. , Temmerman, M. , Okwaraji, Y. , Krasevec, J. , Bradley, E. , … Hayashi, C. (2023). Small vulnerable newborns—Big potential for impact. The Lancet, 401(10389), 1692–1706. 10.1016/S0140-6736(23)00354-9 [DOI] [PubMed] [Google Scholar]
- Barreto, C. M. , Pereira, M. A. L. , Rolim, A. C. B. , Abbas, S. A. , Langhi Junior, D. M. , & Santos, A. M. N. (2021). Incidence of small for gestational age neonates, according to the Fenton and INTERGROWTH‐21st curves in a level II maternity. Revista Paulista de Pediatria, 39, 39. 10.1590/1984-0462/2021/39/2019245 [DOI] [PMC free article] [PubMed] [Google Scholar]
- De Bie, H. M. A. , Oostrom, K. J. , & Delemarre‐van de Waal, H. A. (2010). Brain development, intelligence and cognitive outcome in children born small for gestational age. Hormone Research in Paediatrics, 73(1), 6–14. 10.1159/000271911 [DOI] [PubMed] [Google Scholar]
- Ceratto, S. , Savino, F. , Vannelli, S. , De Sanctis, L. , & Giuliani, F. (2020). Growth assessment in preterm children from birth to preschool age. Nutrients, 12, 1941. 10.3390/nu12071941 [DOI] [PMC free article] [PubMed] [Google Scholar]
- Christian, P. , Lee, S. E. , Donahue Angel, M. , Adair, L. S. , Arifeen, S. E. , Ashorn, P. , Barros, F. C. , Fall, C. H. , Fawzi, W. W. , Hao, W. , Hu, G. , Humphrey, J. H. , Huybregts, L. , Joglekar, C. V. , Kariuki, S. K. , Kolsteren, P. , Krishnaveni, G. V. , Liu, E. , Martorell, R. , … Black, R. E. (2013). Risk of childhood undernutrition related to small‐for‐gestational age and preterm birth in low‐ and middle‐income countries. International Journal of Epidemiology, 42(5), 1340–1355. 10.1093/ije/dyt109 [DOI] [PMC free article] [PubMed] [Google Scholar]
- Cordova, E. G. , & Belfort, M. B. (2020). Updates on assessment and monitoring of the postnatal growth of preterm infants. NeoReviews, 21(2), e98–e108. 10.1542/neo.21-2-e98 [DOI] [PubMed] [Google Scholar]
- Cordova, E. G. , Cherkerzian, S. , Bell, K. , Joung, K. E. , Collins, C. T. , Makrides, M. , Gould, J. , Anderson, P. J. , & Belfort, M. B. (2020). Association of poor postnatal growth with neurodevelopmental impairment in infancy and childhood: comparing the fetus and the healthy preterm infant references. The Journal of Pediatrics, 225):37‐43.e35. 10.1016/j.jpeds.2020.05.063 [DOI] [PubMed] [Google Scholar]
- Cormack, B. E. , Embleton, N. D. , van Goudoever, J. B. , Hay, W. W. , & Bloomfield, F. H. (2016). Comparing apples with apples: it is time for standardized reporting of neonatal nutrition and growth studies. Pediatric Research, 79(6), 810–820. 10.1038/pr.2016.26 [DOI] [PubMed] [Google Scholar]
- Fenton, T. R. , & Kim, J. H. (2013). A systematic review and meta‐analysis to revise the Fenton growth chart for preterm infants. BMC Pediatrics, 13, 59. 10.1186/1471-2431-13-59 [DOI] [PMC free article] [PubMed] [Google Scholar]
- González‐García, L. , García‐López, E. , Fernández‐Colomer, B. , Mantecón‐Fernández, L. , Lareu‐Vidal, S. , Suárez‐Rodríguez, M. , Arias‐Llorente, R. P. , & Solís‐Sánchez, G. (2021). Extrauterine growth restriction in very low birth weight infants: concordance between Fenton 2013 and INTERGROWTH‐21st growth charts. Frontiers in Pediatrics, 9, 690788. 10.3389/fped.2021.690788 [DOI] [PMC free article] [PubMed] [Google Scholar]
- Kim, Y. , Shin, S. H. , Cho, H. , Shin, S. H. , Kim, S. H. , Song, I. G. , Kim, E. K. , & Kim, H. S. (2021). Extrauterine growth restriction in extremely preterm infants based on the Intergrowth‐21st project preterm postnatal follow‐up study growth charts and the fenton growth charts. European Journal of Pediatrics, 180(3), 817–824. 10.1007/s00431-020-03796-0 [DOI] [PMC free article] [PubMed] [Google Scholar]
- Kirk, C. M. , Uwamungu, J. C. , Wilson, K. , Hedt‐Gauthier, B. L. , Tapela, N. , Niyigena, P. , Rusangwa, C. , Nyishime, M. , Nahimana, E. , Nkikabahizi, F. , Mutaganzwa, C. , Ngabireyimana, E. , Mutabazi, F. , & Magge, H. (2017). Health, nutrition, and development of children born preterm and low birth weight in rural Rwanda: a cross‐sectional study. BMC Pediatrics, 17(1), 191. 10.1186/s12887-017-0946-1 [DOI] [PMC free article] [PubMed] [Google Scholar]
- Krebs, N. F. , Hambidge, K. M. , Westcott, J. L. , Garcés, A. L. , Figueroa, L. , Tshefu, A. K. , Goudar, S. S. , Dhaded, S. M. , Saleem, S. , Ali, S. A. , Bauserman, M. S. , Derman, R. J. , Goldenberg, R. L. , Das, A. , Chowdhury, D. , & Women First Preconception Maternal Nutrition Study Group . (2022). Birth length is the strongest predictor of linear growth status and stunting in the first 2 years of life after a preconception maternal nutrition intervention: the children of the women first trial. The American Journal of Clinical Nutrition, 116(1), 86–96. 10.1093/ajcn/nqac051 [DOI] [PMC free article] [PubMed] [Google Scholar]
- Lampl, M. , Mummert, A. , & Schoen, M. (2015). Auxological perspectives on ‘growth’ in DOHaD. Journal of Developmental Origins of Health and Disease, 6(5), 390–398. 10.1017/S2040174415001403 [DOI] [PubMed] [Google Scholar]
- Lebrão, C. W. , Suano‐Souza, F. I. , & Sarni, R. O. S. (2020). Is the intrauterine INTERGROWTH‐21 growth curve better than Fenton's for the classification at birth and prediction of postnatal growth in preterm infants? Maternal and Child Health Journal, 24(12), 1446–1453. 10.1007/s10995-020-02988-2 [DOI] [PubMed] [Google Scholar]
- Martínez‐Jiménez, M. , Gómez‐García, F. , Gil‐Campos, M. , & Pérez‐Navero, J. (2020). Comorbidities in childhood associated with extrauterine growth restriction in preterm infants: a scoping review. European Journal of Pediatrics, 179(8), 1255–1265. 10.1007/s00431-020-03613-8 [DOI] [PubMed] [Google Scholar]
- Namirembe, G. , Ghosh, S. , Ausman, L. M. , Shrestha, R. , Zaharia, S. , Bashaasha, B. , Kabunga, N. , Agaba, E. , Mezzano, J. , & Webb, P. (2022). Child stunting starts in utero: growth trajectories and determinants in Ugandan infants. Maternal & child nutrition, 18(3), 13359. 10.1111/mcn.13359 [DOI] [PMC free article] [PubMed] [Google Scholar]
- National Department of Health, Statistics South Africa, & South African Medical Research Council . (2017). South Africa Demographic and Health Survey 2016: Key indicators. Pretoria, South Africa and Rockville, Maryland, USA. Retrieved August 8, 2023, from http://www.satssa.gov.za/?page_id=1854&PPN=Report%2003-00-09&SCH=7015
- Olsen, I. E. , Lawson, M. L. , Ferguson, A. N. , Cantrell, R. , Grabich, S. C. , Zemel, B. S. , & Clark, R. H. (2015). BMI curves for preterm infants. Pediatrics, 135(3), e572–e581. 10.1542/peds.2014-2777 [DOI] [PubMed] [Google Scholar]
- Ong, K. K. , Kennedy, K. , Castañeda‐Gutiérrez, E. , Forsyth, S. , Godfrey, K. M. , Koletzko, B. , Latulippe, M. E. , Ozanne, S. E. , Rueda, R. , Schoemaker, M. H. , van der Beek, E. M. , van Buuren, S. , & Fewtrell, M. (2015). Postnatal growth in preterm infants and later health outcomes: A systematic review. Acta Paediatrica, 104, 974–986. 10.1111/apa.13128 [DOI] [PMC free article] [PubMed] [Google Scholar]
- Pike, M. , Kritzinger, A. , & Krüger, E. (2017). Breastfeeding characteristics of late‐preterm infants in a kangaroo mother care unit. Breastfeeding Medicine, 12(10), 637–644. 10.1089/bfm.2017.0055 [DOI] [PubMed] [Google Scholar]
- El Rafei, R. , Jarreau, P.‐H. , Norman, M. , Maier, R. F. , Barros, H. , Reempts, P. V. , Pedersen, P. , Cuttini, M. , & Zeitlin, J. (2020). Variation in very preterm extrauterine growth in a European multicountry cohort. Archives of Disease in Childhood ‐ Fetal and Neonatal Edition, 106, 316–323. 10.1136/archdischild-2020-319946 [DOI] [PubMed] [Google Scholar]
- Ramdin, T. , Radomsky, M. , Raxendis, C. , Devchand, T. , Morris, C. , Sekgota, C. , Stols, L. , & Mokhachane, M. (2021). A review of very‐low‐birth‐weight infants admitted to the kangaroo mother care unit in johannesburg, South Africa. Cureus, 13(12), 20428. 10.7759/cureus.20428 [DOI] [PMC free article] [PubMed] [Google Scholar]
- Reddy, K. V. , Sharma, D. , Vardhelli, V. , Bashir, T. , Deshbotla, S. K. , & Murki, S. (2021). Comparison of Fenton 2013 growth curves and Intergrowth‐21 growth standards to assess the incidence of intrauterine growth restriction and extrauterine growth restriction in preterm neonates ≤32 weeks. The Journal of Maternal‐fetal & Neonatal Medicine: The Official Journal of The European Association of Perinatal Medicine, the Federation of Asia and Oceania Perinatal Societies, the International Society of Perinatal Obstetricians, 34, 2634–2641. 10.1080/14767058.2019.1670795 [DOI] [PubMed] [Google Scholar]
- Stein, A. D. , Barros, F. C. , Bhargava, S. K. , Hao, W. , Horta, B. L. , Lee, N. , Kuzawa, C. W. , Martorell, R. , Ramji, S. , Stein, A. , & Richter, L. (2013). Birth status, child growth, and adult outcomes in low‐ and middle‐income countries. The Journal of Pediatrics, 163(6), 1740–1746.e1744. 10.1016/j.jpeds.2013.08.012 [DOI] [PMC free article] [PubMed] [Google Scholar]
- Villar, J. , Giuliani, F. , Barros, F. , Roggero, P. , Coronado Zarco, I. A. , Rego, M. A. S. , Ochieng, R. , Gianni, M. L. , Rao, S. , Lambert, A. , Ryumina, I. , Britto, C. , Chawla, D. , Cheikh Ismail, L. , Ali, S. R. , Hirst, J. , Teji, J. S. , Abawi, K. , Asibey, J. , … Kennedy, S. (2018). Monitoring the postnatal growth of preterm infants: A paradigm change. Pediatrics, 141(2), e20172467. 10.1542/peds.2017-2467 [DOI] [PubMed] [Google Scholar]
- Villar, J. , Giuliani, F. , Bhutta, Z. A. , Bertino, E. , Ohuma, E. O. , Ismail, L. C. , Altman, D. G. , Victora, C. , Noble, J. A. , Gravett, M. G. , Purwar, M. , Pang, R. , Lambert, A. , Papageorghiou, A. T. , Ochieng, R. , Jaffer, Y. A. , Kennedy, S. H. , & Newborn Growth Consortium for the Century . (2015). Postnatal growth standards for preterm infants: The preterm postnatal follow‐up study of the INTERGROWTH‐21(st) project. The Lancet Global health, 3(11), e681–e691. 10.1016/S2214-109X(15)00163-1 [DOI] [PubMed] [Google Scholar]
- Villar, J. , Puglia, F. A. , Fenton, T. R. , Cheikh Ismail, L. , Staines‐Urias, E. , Giuliani, F. , Ohuma, E. O. , Victora, C. G. , Sullivan, P. , Barros, F. C. , Lambert, A. , Papageorghiou, A. T. , Ochieng, R. , Jaffer, Y. A. , Altman, D. G. , Noble, A. J. , Gravett, M. G. , Purwar, M. , Pang, R. , … Bhutta, Z. A. (2017). Body composition at birth and its relationship with neonatal anthropometric ratios: The newborn body composition study of the INTERGROWTH‐21st project. Pediatric Research, 82(2), 305–316. 10.1038/pr.2017.52 [DOI] [PMC free article] [PubMed] [Google Scholar]
- World Health Organization . (2008). Training course on child growth assessment. [Google Scholar]
- World Health Organization . (2016). The WHO application of ICD‐10 to deaths during the perinatal period: ICD‐PM. Retrieved November 12, 2021, from https://www.who.int/publications/i/item/9789241549752 [Google Scholar]
- World Health Organization Expert Committee on Physical Status . (1995). Physical status: The use and interpretation of anthropometry: report of a WHO expert committee. Geneva: World Health Organization. Retrieved March 8, 7017, from https://www.who.int/publications/i/item/9241208546 [PubMed]
- Yitayew, M. , Chahin, N. , Rustom, S. , Thacker, L. R. , & Hendricks‐Muñoz, K. D. (2021). Fenton vs. Intergrowth‐21st: Postnatal growth assessment and prediction of neurodevelopment in preterm infants. Nutrients, 13(8), 2841. 10.3390/nu13082841 [DOI] [PMC free article] [PubMed] [Google Scholar]
Associated Data
This section collects any data citations, data availability statements, or supplementary materials included in this article.
Supplementary Materials
Supplementary information.
Data Availability Statement
The data that support the findings of this study are available from the corresponding author upon reasonable request.