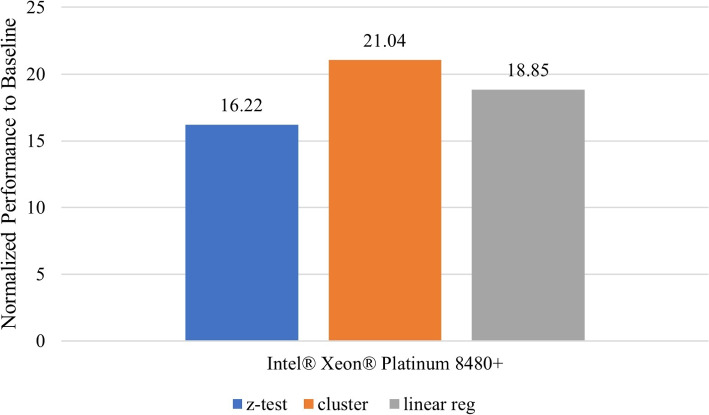
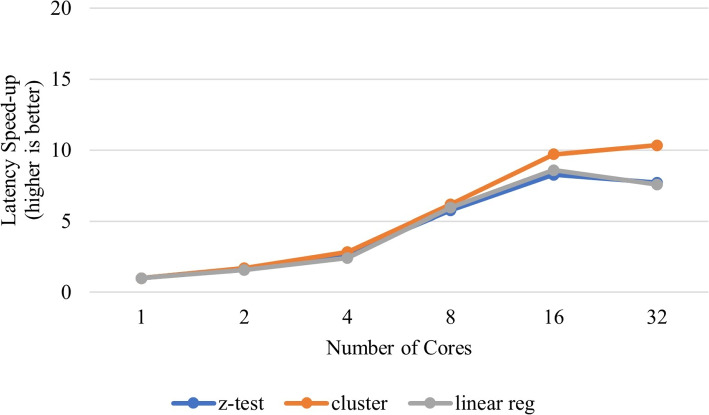
Abstract
Background
Forensic analysis heavily relies on DNA analysis techniques, notably autosomal Single Nucleotide Polymorphisms (SNPs), to expedite the identification of unknown suspects through genomic database searches. However, the uniqueness of an individual’s genome sequence designates it as Personal Identifiable Information (PII), subjecting it to stringent privacy regulations that can impede data access and analysis, as well as restrict the parties allowed to handle the data. Homomorphic Encryption (HE) emerges as a promising solution, enabling the execution of complex functions on encrypted data without the need for decryption. HE not only permits the processing of PII as soon as it is collected and encrypted, such as at a crime scene, but also expands the potential for data processing by multiple entities and artificial intelligence services.
Methods
This study introduces HE-based privacy-preserving methods for SNP DNA analysis, offering a means to compute kinship scores for a set of genome queries while meticulously preserving data privacy. We present three distinct approaches, including one unsupervised and two supervised methods, all of which demonstrated exceptional performance in the iDASH 2023 Track 1 competition.
Results
Our HE-based methods can rapidly predict 400 kinship scores from an encrypted database containing 2000 entries within seconds, capitalizing on advanced technologies like Intel AVX vector extensions, Intel HEXL, and Microsoft SEAL HE libraries. Crucially, all three methods achieve remarkable accuracy levels (ranging from 96% to 100%), as evaluated by the auROC score metric, while maintaining robust 128-bit security. These findings underscore the transformative potential of HE in both safeguarding genomic data privacy and streamlining precise DNA analysis.
Conclusions
Results demonstrate that HE-based solutions can be computationally practical to protect genomic privacy during screening of candidate matches for further genealogy analysis in Forensic Genetic Genealogy (FGG).
Keywords: Secure query, Data privacy, Genomic database, Homomorphic encryption
Background
The identification of unknown individuals using their DNA sample can be done either directly through DNA matching with target candidates or indirectly via familial tracing [1]. Typically, in the absence of direct evidence for DNA matching, the latter method is used to approach the identification of the DNA sample. DNA matching is particularly relevant for finding unknown perpetrators of crime who are unidentifiable with standard DNA profiling. The method is known as Forensic Genetic Genealogy (FGG) [2]. A typical application is forensic search on DNA collected from a crime scene, where the DNA helps law enforcement find close relatives of an unknown suspect in a genetic database. Even if the unknown suspect individual never had his/her DNA collected, law enforcement will be able to close in on his/her family circle and from there orient an investigation in the right direction.
FGG shall not be confused with Familial DNA Searching (FDS). In FDS, collected DNA evidence is compared against the FBI’s CODIS database, which contains DNA profiles of known convicted offenders. This process aims to find partial matches that closely resemble the target DNA profile, primarily focusing on immediate relatives like parents and children [2]. Conversely, FGG is employed when FDS is unsuccessful, utilizing non-criminal genetic genealogy databases. FDS and FGG also differ in their data types: FDS relies on Short Tandem Repeat (STR) DNA typing, while FGG uses Single Nucleotide Polymorphism (SNP) high-density markers. Consequently, their DNA matching algorithms use different analysis approaches: SNP array DNA matching algorithms commonly rely on probabilistic and heuristic methods, while STR DNA profiling algorithms compare the number of shared alleles at specific loci to determine genetic matches. In summary, FGG leverages genealogy and SNP analysis, whereas FDS focuses on CODIS and STR markers. As of 2018, several non-criminal genealogy databases could be used by law enforcement to resolve violent crimes and missing person cases, namely, [3–5]. This process has law enforcement upload the raw DNA evidence to different genetic genealogy databases and several matches of distant relatives are found and used to build family trees to back trace to the identity of the DNA sample source.
There could be many more genetic genealogy databases to search for matches of relatives. For this reason, it can be time consuming and unduly computationally expensive if no matches are found after comparing a query DNA sample with all entries in a database. A method that could perform a swift screening across all different databases shall alleviate this computational issue. This is the matter of this work. In addition, because the unknown DNA sample leave custody of law enforcement, it could arguably violate the principles of privacy on handling and processing genetic data, for which there could be unpredictable negative consequences to both investigation integrity and unwanted discoveries for the related matches.
The benefit of enforcing genetic privacy could bring some positive gains such as breaking geographical barriers concerning access to genetic databases spread worldwide, which are protected by international privacy laws and regulations. Its value goes beyond prudent accessibility of genetic databases but also, more generally, to the proactive prevention of ethical and privacy issues involving the general public, which can be sidelined or overlooked [6] and cause wrongful convictions [7].
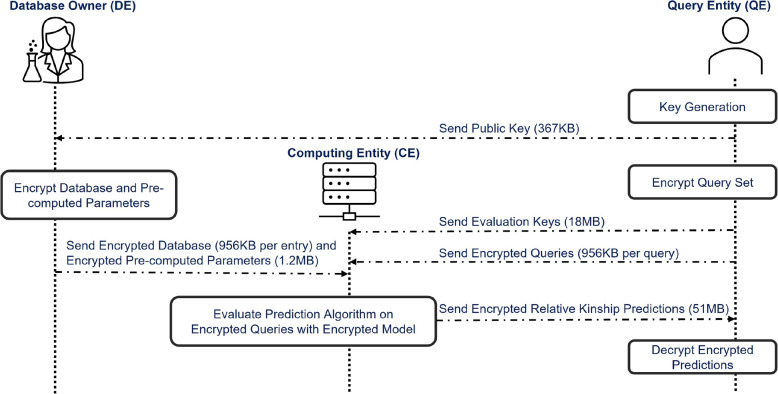
The yearly iDASH competition proposes the challenge of protecting genetic privacy using Homomorphic Encryption. The goal of the 2023 edition of iDASH is determining whether a DNA sample (query) shares any genetic information with genomes comprising a target genetic genealogy database. Aiming at addressing the iDASH 2023 Track 1 challenge, i.e., “Secure Relative Detection in (Forensic) Databases”, we devised three methods that utilize HE-based approaches to confirm the presence of a person’s relatives’ genetic data within a genomic database. During this procedure, the query site initiates the request, and the database site provides the response. Both sites would like to keep data confidential. The output of the method is a score that indicates for each query the likelihood rate about the presence of its relatives in the genomic database. Our methods enable a secure search for the target individual without compromising the privacy of the query individual or the genomic database. It also makes consent management more modular, as individuals can consent to secure searches but not searches in clear text. This is particularly relevant in the forensic domain, where using genetic genealogy databases (e.g., GEDMatch) to rapidly identify suspects and their relatives raises complex ethical issues, such as using genomic data without consent for forensic purposes. In the use case we consider, there are 3 entities (see also Fig. 1):
A law enforcement querying entity (QE) that holds the genome of a target suspect individual collected on a crime scene.
A Database owner (DE), who manages a genetic genealogy database.
A Non-colluding trusted computing entity (CE) that performs genome detection using the encrypted data from QE and DE.
Fig. 1.
Classic secure outsourcing computing protocol used in the iDASH 2023 Homomorphic Encryption challenge. 400 queries and 2000 database samples make up the bulk of the data movement, each requires 956KB of storage space. The size of encrypted predictions displayed in the picture corresponds to 400 encrypted predictions, i.e. 51MB
QE wants to find out if the genome of the target individual (or family relatives) is in the database. Neither QE nor DE is allowed to reveal the genomic information to the other party. The main challenge is to perform this search in a secure manner using a HE-based query system such that information exchanged between the entities remains encrypted at all time. The use case involves two steps:
One-to-Many DNA comparisons: a way to compare a genetic profile to all other database members. In this case, a unique real-value score is computed to determine how likely a query individual has a familial relationship with any other individual in the database. This can be accomplished also by directly comparing a query to every member in the database and then selecting the maximum a real-valued number out of all comparisons, which directly pinpoints which member is most likely to be related to the queried genome.
One-to-One autosomal DNA comparison allowing to confirm how much DNA an individual share with someone before contacting them.
Contributions
The solution to step 1, the focus of this work, can serve as a filtering system for forensics analysis of DNA samples collected on crime scenes. In this case, the problem does not require that the relative in the database be identified exactly, but instead it requires to determine if there exists at least one relative to the query individual in the database with certain probability. There could be many databases to search from. Since comparing a suspect with each individual in every database is computationally expensive, it pays off to reduce the number of databases to search from and to reduce the number of suspect candidates for each target database. In this regard, the first step would be to determine if a suspect has any relative in the target database.
The key contributions of this work are three-fold:
Firstly, we propose an HE-friendly mathematical simplification of the equation proposed in [8] to detect contributing trace amounts of DNA to highly complex mixtures using homomorphically encrypted high-density SNP genotypes.
Secondly, we introduce two novel algorithms to predict evaluation scores rating whether a DNA sample query shares genetic data with any other DNA sample in a genomic database, where one of these two is heuristically inspired by the z-test hypothesis testing, and assumes no prior knowledge of the reference populations, and the other algorithm uses a Machine Learning approach with linear regression model trained on a known reference population mixture inherited from the genealogy database.
Finally, we demonstrate through several experiments that our methods perform high accuracy predictions in less than 37.5 milliseconds per query using encrypted genetic data in a privacy-preserving approach with provable 128-bit security.
As follows, in “Forensic Genetic Genealogy (FGG)” section, we define the problem scope in the context of FGG and present a discussion on relevant related work in “Related work” section. In “Methods” section, we present the methods in details, including some data analysis and design considerations to address the problem statement effectively in aspects such as security, computing and resource optimizations. We present performance results of the methods in detail in “Results” section, including a description of the characteristics of the challenge, data, evaluation criteria, and computing resource constraints in “Secure detection of relatives in forensic genomics” section. Finally, we finalize our discussion in “Discussion” and “Conclusions” sections.
Forensic Genetic Genealogy (FGG)
Forensic Genetic Genealogy (FGG) is an investigative tool that combines traditional genealogy research with advanced SNP DNA analysis to solve crimes and identify unknown individuals. It consists of the following steps:
DNA sample collection: DNA sample is collected from a crime scene or an unidentified individual.
SNP testing: this is the process in which DNA is analyzed to identify the SNP variations and then compiled into an array format (the input data of this paper).
Profile upload: the genetic profile acquired from step 2, the SNP array (or genome), is then uploaded to a public genetic genealogy database, such as GEDmatch or FamilyTreeDNA.
Database matching: matching algorithms are used to compare the uploaded profile with other genetic profiles in the database to identify potential relatives by measuring the amount of shared DNA segments. The scope of our work and the iDASH 2023 competition intersects with this since it concerns identifying whether there are any potential relatives in the database [9].
Relationship estimation: an algorithm takes two genomes and estimates the degree of relatedness between them, which can range from close relatives (e.g., parents, siblings) to distant cousins. The methods proposed here can be used to perform relationship estimation but this is out of scope of this work.
Genealogical research: genealogists use the matches found in step 5 to reconstruct family trees, tracking common ancestors and descendants to reduce the number of potential suspects.
Identifying the suspect: once a potential match is identified, law enforcement collects a DNA sample from the suspect to confirm the match through traditional forensic methods.
Kinship estimation
The kinship score determines the degree of relatedness between two individuals based on their genetic data (see [10–12]). The database matching step, described in step 4 above, relies on predicting the kinship between the uploaded genetic profile and the genetic profiles in the database. It is a measure of the probability that a randomly chosen allele from one individual is identical by descent (IBD) to a randomly chosen allele from another individual. It can be mathematically described (see [13]) as
| 1 |
where L is the number of loci (genetic markers or SNP variants), and are the SNP variants of individuals i and j at locus l, and is the allele frequency at locus l.
Scope of this work in the FGG context
Step 4 is the subject matter of this work and of the iDASH competition task. It concerns kinship prediction. The input data of this work comes from step 2, a genome sequence formed of SNP variants represented with elements in the set . This genome encoding is a sequence of bi-allelic SNP data. In the GDS (Genomic Data Structure) data format, which is derived from a VCF (Variant Call Format) data file, the genotype encodings 2, 1, and 0 refer, respectively, to Homozygous for the reference allele (both alleles match the reference allele), Heterozygous (one of the alleles matches the reference allele and the other matches the alternate allele), and Homozygous alternate genotype (both alleles match the alternate allele). It basically counts how many alleles match with the reference allele in a specific position (gene locus) of the reference genome (see similar explanation in [9]).
For simplification, the database matching task in step 4 is a search problem cast as a decision problem. The matching task is reduced to finding out whether or not the uploaded profile matches with any of the profiles in the database, while not requiring that any potential matches be exactly identified or retrieved. This means that the uploaded profile may not need be compared with all, or any, of the database profiles to deliver the answer. In this case, step 4 of the FGG task can be split into two parts. The first part regards screening each database to find out whether there exists any potential matches. All that is needed is to identify the nature of the relationship between the uploaded profile and the genetic database, i.e. answering the question “Is there any relative of the query individual in the probed genetic database?”. Once the databases that contain relatives are identified, then the second part starts, which consists of searching for the actual candidate matches in each of the databases where the uploaded profile was screened and found to share DNA segments with other database profiles. We concentrate our efforts on part 1 of step 4 as just described since it was the required task in iDASH competition. Steps 1, 2, 3, 5, 6, and 7 fall outside the scope of this work.
We simplify the problem to obtain the kinship score between the individual query and the genomic database. We use homomorphic encryption to devise privacy-preserving methods to perform the relatedness matching while securing the computation with genetic data. The output of our methods can also be used as kinship predictions between pairs of genetic profiles and then used to estimate relationship types (step 5), but it is not the subject of study here. We use the predicted kinship scores to estimate the relationship of the uploaded profile directly with the genetic genealogy database. Other privacy-preserving genetic relatedness testing methods have been proposed and are discussed in [14–17].
Related work
Current security and privacy protection practices in genomic data sharing
Genomic data sharing [18, 19] is particularly useful for precise medicine [20]. There are a myriad of unified genomic database knowledge projects (see [21] for a list) that provide researchers with genetic data sharing and analysis [22] capabilities for this purpose. Along with that, concerns regarding genomic data security and privacy are raised [21]. They implement different strategies to offer security and privacy protection guarantees. For instance, control access through administrative processes, laws and regulations, data anonymization, and encryption.
Administrative processes
To obtain access to controlled data from the NCI (National Cancer Institute) Genomic Data Commons (GDC) [20, 23] knowledge database, it is required to file a dbGaP (Database of Genotypes and Phenotypes) authorization request that will be reviewed, approved or disapproved by the NIH (National Institutes of Health) Data Access Committee (DAC) on the basis of whether or not the usage will conform to the specification determined by the NIH Genomic Data Sharing Policy (see more details at [24]). Once access is granted, the recipient is entrusted with and accountable for the security, confidentiality, integrity and availability of the data, including when utilizing Cloud computing services.
Another example is the European Genome-phenome Archive (EGA)’s data access [25], which operates in a similar manner, i.e. through Data Access Agreement (DAA) and Data Processing Agreement (DPA) documents, but enhancing data access security and confidentiality via authenticated encryption of data files using Crypt4GH [26]. Many other public genomic datasets exist and implement similar security and privacy protection practices, as reviewed by [21].
Employing administrative processes only is not suitable for privacy-preserving FGG. This implementation of access control to sensitive data depends on the integrity and goodwill of the authorized individual to self-report any agreement violations and data breaches. Once data access is granted, there is a lack of oversight to enforce policies related to genomic privacy, re-identification, and data misuse.
Data anonymization
Data anonymization involves obscuring personal identifiers in genetic data to protect individual’s privacy. It can also come in the form of aggregated data that shows trends and patterns without revealing specific identities. Data masking is also a technique employed to alter sensitive parts of the data to prevent identification [27].
Employing data anonymization only is not suitable for privacy-preserving FGG. Genetic data is unique and inherently identifiable. Even when anonymized, it can often be re-identified through genealogical research and cross-referencing with other data sources. Anonymization of data also bring serious limitations due to the uniqueness of every individual’s genome, which can be easily subject to proven re-identification attacks (see [28]).
Laws and regulations
Laws and regulations play a crucial role in protecting the privacy of genetic data and medical information. They legally protect individual’s medical record and other PII data, including genetic data, by setting standards for the use and disclosure of such information by covered entities. Their security rules depends on appropriate administrative and technical safeguards to ensure confidentiality, integrity and security of protected health information. They set the foundation of genetic privacy but carry limitations that pose increased risk to individuals’ privacy.
Employing laws and regulations only is not suitable for privacy-preserving FGG. There is a lack of standardized regulations and ethical guidelines governing the use of genetic data in forensic investigations. Legal acts such as HIPAA and GINA seem inadequate and leave gaps in protection since they focus on who holds the data rather than the data itself because it only applies to covered entities. For example, they do not regulate consumer-generated medical and health information or recreational genetic sequencing generated by commercial entities such as 23andMe and Ancestry.com. Therefore, we can argue that these commonly practiced solutions fall short in securing genomic data privacy.
In all the aforementioned genomic data sharing database cases, privacy protection is traded by confidentiality agreements, which do not offer the same layer of protection to sensitive data since their compliance is subject to the actions of fallible human beings. The adequate solution shall enforce privacy protection policies on the data regardless of the creator or who has access to it. Cryptographic techniques appear to be the most suitable to address it in this manner (e.g. [29]), where the most advanced of them allows making inferences and analytics while the data is encrypted, while never revealing the contents to the user.
Encryption in genomic data sharing
Privacy risks associated to accessing and storing genetic data can be mitigated by enabling confidentiality through cryptography. If either at rest or in transit, genetic data can be guarded from unwarranted access using state-of-the-art encryption schemes (e.g. [26, 30, 31]). This way, only authorized personnel holding the decryption key can reveal the contents of the encrypted genetic data. Crypt4GH [26] is an industry standard for genomic data file format to keep genomic data secure while at rest, in transit, and through random access; thus, allowing secure genomic data sharing between separate parties. A solution so-called SECRAM [32] data format has been proposed for secure storage and retrieval of encrypted and compressed aligned genomic data. To perform data analytics with machine learning algorithms in such case, the data is required to be decrypted and it becomes vulnerable to cybersecurity attacks. This is the major protection limitation of conventional cryptographic encryption schemes, i.e. requiring decryption before computing.
On the other hand, encrypting genomic data with Homomorphic Encryption (HE) schemes allows computation over encrypted data without ever decrypting it; thus, not revealing any sensitive content since the data remains encrypted, ensuring true private computation. This additional layer of security can potentially help reduce the time and cost spent on reviewing and approving data accesses. When computationally demanding data analysis is desired, more often than not, processing needs to occur in (public) untrusted cloud service providers due to limited local computing resources and/or access to a restricted number of analytic model IPs. In this context, modern cryptography introduces homomorphic encryption methods (e.g., BGV [33], and CKKS [34]), which bring the capability of protecting data privacy during computation in a semi-honest security model.
Genetic privacy protection with homomorphic encryption
Fully Homomorphic Encryption (FHE) allows computation of arbitrary functions on encrypted data without decryption [35]. This means the data is also protected during computation (processing) since it remains encrypted. Its security guarantee stems from the hardness of Ring Learning with Errors (RLWE) assumptions [36]. There are two aspects to this assumption, namely, decisional and computational. The decisional RLWE assumption states that it is infeasible to distinguish pairs (a, b) picked at random from a distribution over a ring and pairs constructed as with a sampled from , where e and s are randomly sampled from a noise distribution over the ring . The computational assumption states that it is hard to discover the secret key s from many different samples . This homomorphic encryption construct is built on a polynomial ring , where denotes the ring of integers modulo Q that populate the polynomial coefficients, is the cyclotomic polynomial , and . The choice of N, where N is typically a power-of-2 integer, is determined by the value of the coefficient modulus Q and the security parameter , such that is a function of and Q.
Various homomorphic encryption schemes built on RLWE constructs that work naturally with integers emerged in the literature (e.g. [33, 37]). Although the genetic data in this work takes values in the set , the expected output and model parameters to perform the data analysis and predictions operate on numbers in floating-point representation. This is especially true when training machine learning models to make predictions from genotypes. For this reason, it is natural to opt for a homomorphic encryption scheme intrinsically designed to accommodate floating-point arithmetic. Cheon et al. [34] put forward the first homomorphic encryption for arithmetic of approximate numbers, also commonly known as the CKKS (short for Cheon-Kim-Kim-Song) scheme, that is most suitable to operate on real numbers. The CKKS scheme [34] is a levelled homomorphic encryption (LHE) public key encryption scheme based on the RLWE problem [36]. It allows to perform computations on encrypted complex numbers; thus, real numbers too. The ability of the CKKS method to handle floating-point numbers, approximated with fixed-point representation, makes it particularly attractive for confidential machine learning (ML) and data analysis. In the following, we briefly describe the CKKS scheme that we will use throughout this paper.
The same noise e added during the encryption to strengthen the security also contributes to limiting the number of consecutive multiplications as the noise grows as consequence of that, possibly causing decryption error. CKKS controls this error-causing noise growth with the concept of levels and rescaling. Initially, a fresh CKKS ciphertext ct is assumed to encrypt numbers with certain initial precision masked by the added noise of smaller precision. The initial noise budget of a CKKS ciphertext (see Fig. 2) is determined by the parameter L (multiplicative depth). The integer L corresponds to the largest ciphertext modulus level permitted by the security parameter . Let the ring dimension N be a power-of-2, a modulus , and for , and some integer scaling factor , where p is the number of bits for the desired (initial) precision.
Fig. 2.
CKKS ciphertext structure depicting the noise budget in a freshly encrypted ciphertext
Before encryption, the message needs to be encoded in a plaintext space. Genetic data vector is seen as a single CKKS message , assuming , mapped to a plaintext object . This plaintext space supports element-wise vector-vector addition, subtraction, and Hadamard multiplication. For encoding and decoding procedures, CKKS relies on a field isomorphism called canonical embedding, i.e. . Hence, we have
| 2 |
| 3 |
Equipped with the aforementioned concepts, we now define the following CKKS operators:
- Sample and set the secret key as .
- Sample (where U denotes the Uniform distribution) and .
- Set the public key as where
- Given a plaintext message , sample and .
- Output the ciphertext .
- Given a ciphertext , where ct as encryption of satisfies for some small e, then the decryption output results in , where is slightly different from the original encoded message ; indeed, an approximated value when holds true.
- Given two ciphertexts , output the ciphertext encrypting a plaintext vector .
- Given two ciphertexts , output a level-downed ciphertext encrypting a plaintext vector
- When two ciphertexts and are multiplied, the results if a larger ciphertext , where , , and are the components of the resulting ciphertext. To reduce the ciphertext back to the original size, a relinearization key evk is used to transform the ciphertext from three-component form back to a two-component form, such that , where the results of applying is defined by the expression .
- This operator is also called automorphism. For a ciphertext ct encrypting a plaintext vector , output a ciphertext encrypting a plaintext vector , which is the (left) rotated plaintext vector of ct by r positions.
- Rescale(ct)
- When two ciphertexts and are multiplied, the resulting ciphertext has a scale that is the product of the scales of and , i.e. . Rescaling brings the scale back to a manageable level. It involves dividing the ciphertext by a factor , i.e. .
- Modulus switching in CKKS is used to reduce the modulus of the ciphertext to help manage the noise (and plaintext) growth and to match levels of ciphertexts operating together. To switch to a smaller modulus , the ciphertext components and are scaled down and rounded according to .
The distribution and denote the discrete Gaussian distributions for some fixed standard deviation . The distribution outputs a polynomial of coefficients. We denote the rounding function and modulo q operation . The encoding technique allows parallel computation over encryption in a Single-Instruction-Multiple-Data (SIMD) way making it efficient once the computation is amortized on the vector size.
DNA matching methods
There are two lines of work relevant to our topic: first, database queries on cleartext data that could be adapted to Homomorphic Encryption and second, encrypted genomic database queries. Not all popular methods in the unencrypted domain are good candidates to run in the encrypted domain. Depending upon the Homomorphic Encryption scheme, mathematical functions like max, min, greater than, less than, is equal to and algorithm like loops and sorts are not easily implementable on encrypted data. We are looking for methods that enable swift kinship searches for relatives up to the third degree, while observing the aforementioned constraints imposed by the difficulties to transform it into a homomorphic encryption arithmetic circuit.
Cleartext protocols for DNA matching
Genetic relatedness or kinship between two individuals can be described as the likelihood that, at a randomly chosen genomic location, the alleles in their genomes are inherited from a common ancestor. This phenomenon is known as Identical-by-Descent (IBD). This concept of relatedness should not be confused with Kinship coefficient and metrics closely connected to other genetic measures, including the inbreeding coefficient and probabilities associated with sharing IBD segments.
To identify biological relationships beyond immediate family, the segment approach and extended IBD segments are effective but require high density markers, typically not available in forensic samples. Forensic samples typically rely on STR (Short Term Repeat) DNA typing, the preferred data format of forensic searches in criminal databases (i.e., Familial DNA Searching) to obtain partial matches with immediate relatives. Finding matches beyond immediate relatives is more suitable using single nucleotide polymorphism (SNP) data format. The main challenge in DNA kinship matching is choosing the right method for the computations. Most methods rely on observed allele sharing, Identity-By-State (IBS), to estimate probabilities of shared ancestry (IBD) or kinship coefficients and many of these are too complex to run on encrypted data. Methods available for DNA kinship matching up to the third degree (e.g., siblings, half-siblings, or first cousins) differ in complexity, accuracy and latency.
[12] distinguish four categories of kinship methods. The first category entails moment estimators such as KING [10], REAP [11], plink [38], GCTA [39], GRAF [9] and PC-Relate [40] that use Identical-by-State (IBS) markers and genotype distances to estimate expected kinship statistics. The second category is represented by the maximum-likelihood methods RelateAdmix [41] and ERSA [42], which use expectation- maximization (EM) to jointly estimate the kinship statistics. The third and fourth families of methods use IBD-matching on phased genotypes (e.g. [43, 44]), and kinship estimation from low-coverage next-generation sequencing data [45, 13, 46]. All these methods use one or more of three types of analysis, namely:
Identity by Descent (IBD) Analysis by considering shared alleles across the entire genome, provides insights into relatedness at different temporal scales and levels of relatedness. Dou et al. [47] use mutual information between the relatives’ degree of relatedness and a tuple of their kinship coefficient to build a Bayes classifier to predict first through sixth-degree relationships. Smith et al. [48] developed IBIS, an IBD detector that locates long regions of allele sharing between unphased individuals.
Morimoto et al. [49] use Identity by State (IBS) Analysis to identify regions of the genome where two individuals share the same alleles. The proportion of the genome that is IBS will indicate the level of relatedness.
Ramstetter et al. [50] use Haplotype Sharing Analysis to look at shared haplotypes within particular genomic regions to uncover recent common ancestry.
Nonetheless, these methods can be too complex to yield the low latency required for demanding elaborate polynomial approximations of non-linear functions to transform them into a homomorphic encryption arithmetic circuit. Moreover, while the competition challenge is well-suited for search methods that calculate kinship scores between each query and every entry in the database, it can also be re-framed as a decision problem to become more amenable to resolution through decision algorithms. Specifically, the challenge involves the task of establishing kinship scores that quantify the degree of genetic relatedness between a given query and any sample within a genomic database. Homer et al. [8] suggest an algorithm working on clear text using clustering of admixed population. They demonstrate experimentally the identification of the presence of genomic DNA of specific individuals within a series of highly complex genomic mixtures. This is significant for two reasons: first, it brings back to the forefront SNPs for identifying individual trace contributors within a forensics mixture, when STRs were the preferred method. Second, we will show (see “Clustering-based supervised method” section) that this method is low latency, accurate and amenable to Homomorphic Encryption.
The choice of method depends on the quality and quantity of genetic data available, as well as the specific relationships being investigated and the population structure. The fastest methods to compute kinship are IBD methods. These methods, however, are not Homomorphic Encryption friendly and may require large computing resources and long latency running in the encrypted domain. Table 1 shows the fastest available methods to compute kinship on unencrypted data [51].
Table 1.
The fastest kinship methods on unencrypted data are IBD based. These performance numbers were reported in Table 1 of paper by [51]. These methods were evaluated on the SAMAFS dataset and their performance was measured on a sample that included 32154 pairs of annotated related individuals and 3051598 pairs of annotated unrelated individuals
| Method | Type | Pre-processing | Runtime | Output |
|---|---|---|---|---|
| PLINK | Allele frequency IBD estimate | N/A | 18.1s | IBD proportions |
| KING | Allele frequency IBD estimate | N/A | 4.6m | IBD proportions |
| REAP | Allele frequency IBD estimate | 2.8h | 3.8h | IBD proportions |
Private queries on encrypted data
Over the last 10 years there has been a number of papers demonstrating private queries on encrypted data. Ramstetter et al. [52] suggest a secure biometric authentication method that employs fully homomorphic encryption TFHE scheme. They match biometric data from a local device, to an encrypted biometric template on a remote-server encrypted database. Pradel and Mitchell [53] introduce Private Collection Matching (PCM) problems, in which a client aims to determine whether a collection of sets owned by a database server matches their interests.
EdalatNejad et al. [54] propose a string matching protocol for querying the presence of particular mutations in a genome database. They combine Homomorphic Encrytion scheme BGV [55] and private set intersection [56] to search for similar string segments. Chen et al. [57] compute private queries on encrypted data in a multi-user setting. Bao et al. [58] compute conjunctive queries on encrypted data. Saha and Koshiba [59] execute comparison queries while [60] compute range queries on encrypted data. Boneh and Waters [61] compute relatedness scores within the protective confined Trusted Execution Environment of SGX, a hardware approach. Chen et al. [62] proposed “sketching”, [63] worked on “fingerprinting”, while [64] implemented a differential privacy scheme. Wang et al. [12] proposed a method to compute relatedness in the encrypted domain using Homomorphic Encryption taking into account admixed populations. This projection-based approach utilizes existing reference genotype datasets for estimating admixture rates for each individual and use these to estimate kinship in admixed populations. Dervishi et al. [65] implements a k-means algorithm on encrypted data using CKKS. This algorithm shows the feasibility of our clustering scheme should we require to implement it fully encrypted as proposed by [66].
Methods
The relatedness measurement of a genetic sample query to a population of individuals comprising a genetic genealogy database can be framed as a decision algorithm: its purpose is to ascertain whether a given forensic genomic sample has a relative (match) in the database, extending up to the 3rd degree of kinship. For each individual query, a score is calculated, and this score is designed to be high when a relative is found and low when there is no relative in the database. Data discovery and analysis reveal the necessity of having a reference frame for mapping the query. Interestingly, any genome can act as this reference frame, particularly because the competition genomic database is derived from the same statistical data as the genomes in the challenge database, resulting in identical second-order statistics. Consequently, for practicality, we have opted to utilize the mean genome (allele average across all genome samples) from the challenge database, which is calculated offline and encrypted at runtime, as our reference.
To assess genetic relatedness, we design a metric built on one-sample paired z-test hypothesis testing. This turns into our unsupervised method discussed in “Unsupervised method” section. In this approach, we assign weights to each coordinate when mapping the query onto the aforementioned reference frame. In order to improve accuracy and latency performances, we propose two supervised approaches. In “Clustering-based supervised method” section, we present the one that uses the k-means algorithm on the challenge database to discover k data points to represent the underlying population mixture. This method uses the distance between a query and these k data points to gauge whether it relates to any of the k reference populations comprising the probed genetic database. The second method, discussed in “Linear regression method” section, transforms the query by correlating it with the database mean. This transformation is an attempt to unveil an underlying pattern that could discern a query whose relative genetic data is present in the database from a query whose genetic data is absent. The output of these transformations are then used as features to learn a linear regression model trained to predict 1 if a query has a relative in the database and 0 if otherwise. On what concerns data privacy protection of the methods, a summarized description of the security parameters used for encryption is shown in Table 2, while a more detailed discussion is carried out in their respective security subsections.
Table 2.
Summary of the security parameters for the algorithms to run under -bit security level. Security implementation is based on the Microsoft SEAL library. N is the polynomial ring size, is the coefficient modulus size, is the scaling factor, and L is the multiplicative depth of the HE algorithm
| Method | N | L3 | ||
|---|---|---|---|---|
| “Unsupervised method” section | 218 / 188 | 30 | 4 / 3 | |
| “Clustering-based supervised method” section | 109 | 29 | 1 | |
| “Linear regression method” section | 109 | 29 | 1 |
3L refers to the multiplicative depth of the algorithm and determines the size of . The symbol / indicates another parameterization where L and are different
Unsupervised method
Unsupervised algorithms present a natural choice for addressing the relatedness problem. They require minimal assumptions about the dataset and contribute to more robust generalization. We proceed with the assumption that the genomic database primarily comprises genomes from individuals who are unrelated to the query individual. This assumption is grounded in the fact that on average fertility rate in the world population is 2.27 [67]; an individual is on average likely to have less than 97 relatives up to the third degree (see Table 3). In addition, it is unlikely that all relative genomes have found their way to the database; however, if we use the historical highest average fertility rate of 6.8 [67], the number of third degree relatives could reach 2339 (see Table 4), which is still much lower than a typical genomic database size but greater than our challenge dataset, in which case, our method could not be used. That is, if we rely on the assumption that our database characteristics follow the fertility rate is 6.8, implying 2339 relatives up to 3rd degree, then our assumption that the individuals in the database are mostly unrelated, on which our method relies, would not be suitable since the challenge database has only 2000 samples. In the real-world scenario, where the databases have tens to hundreds of thousands of samples, then our assumption that the samples in the database are mostly unrelated might still hold, for which our method could still be functionally suitable.
Table 3.
Estimation of Average Direct Relatives depending upon average 2022 world fertility rate (2.27)
| First degree | Second degree | Third degree | |
|---|---|---|---|
| parents | 2 | ||
| child | 2.27a | ||
| siblings | 1.27 | ||
| grand-parents | 4 | ||
| grandchild | 10.31 | ||
| aunt-uncle | 2.82 | ||
| niece-nephew | 6.41 | ||
| gt-granparents | 8 | ||
| gt-grandchildren | 46.79 | ||
| gt-uncles/aunts | 5.08 | ||
| first cousins | 8.04 | ||
| Total Relatives | 5.54 | 23.54 | 67.90 |
aHistorical world high fertility rate [67]
Table 4.
Estimation of Average Direct Relatives depending upon historical average high fertility rate (6.80)
| First degree | Second degree | Third degree | |
|---|---|---|---|
| parents | 2 | ||
| child | 6.8a | ||
| siblings | 5.8 | ||
| grand-parents | 4 | ||
| grandchild | 92.48 | ||
| aunt-uncle | 109.43 | ||
| niece-nephew | 744.13 | ||
| gt-granparents | 8 | ||
| gt-grandchildren | 1257.73 | ||
| gt-uncles/aunts | 23.2 | ||
| first cousins | 85.68 | ||
| Total Relatives | 14.6 | 950.04 | 1374.61 |
aHistorical world high fertility rate [67]
We precomputed offline the correlations (dot products) between known queries that are confirmed to have a relative within the challenge database and every entry in the database. Our analysis reveals that 367 entries in the challenge database are related to at least one of the 200 positive query individuals (see Fig. 3). Note that, by carefully observing Fig. 3, we may infer that correlation values around 13250 could indicate relatives of 1st degree, around 12000 will probably determine relatives of 2nd degree, around 11500 sits relatives of 3rd degree, and below and beyond lies distant relatives or unrelated individuals, i.e. individuals from different populations, with respect to query i (marked along the x-axis). This implies that, on average, each positive query is associated with just 1.83 relatives within the challenge database, out of a potential total of 97 existing relatives. It is worth noting again that only a small minority of these potential relatives have their genome data present in the challenge database. These findings validate the robustness of our unsupervised approach.
Fig. 3.
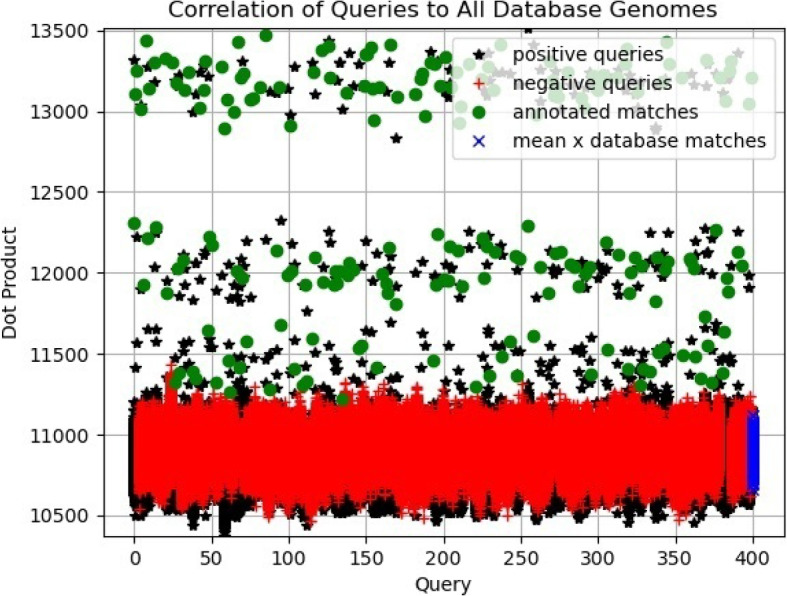
This plot shows the correlation value of each query with every sample in the genomic database
Within this framework, Eq. 4 serves the purpose of quantifying the distance between a query q and the mean of the database considering all genotype variants, from to . Clearly, the database mean aligns closely with the centroid of the unrelated genomes, given their substantial presence compared to the related ones. In fact, the database mean is the average of genotype values across all genomes from the database. In this manner, the database mean essentially characterizes “unrelatedness to any individual in the database”. This can be confirmed by observing that the correlation of any entry in database with the database mean (see blue x plots on lower right corner of Fig. 3) has lower correlation values than a correlation between a query and its relative in the database (see green solid circles plotted in Fig. 3).
Another way to support this interpretation is by observing the scatter plot of the correlations between queries and the database mean in Fig. 4. They appear entangled and hardly defined to judge if positive or negative queries correlate more or less to the database mean. Superficially, it appears there is more correlation of the mean with the negative queries. This observation is used to consider that more correlation to the mean signifies more likelihood to be unrelated to any specific individual in the database since the mean approximates the average of the populations. We extend this observation to interpret and explain the clustering-based formulation proposed in “Clustering-based supervised method” section.
| 4 |
Fig. 4.
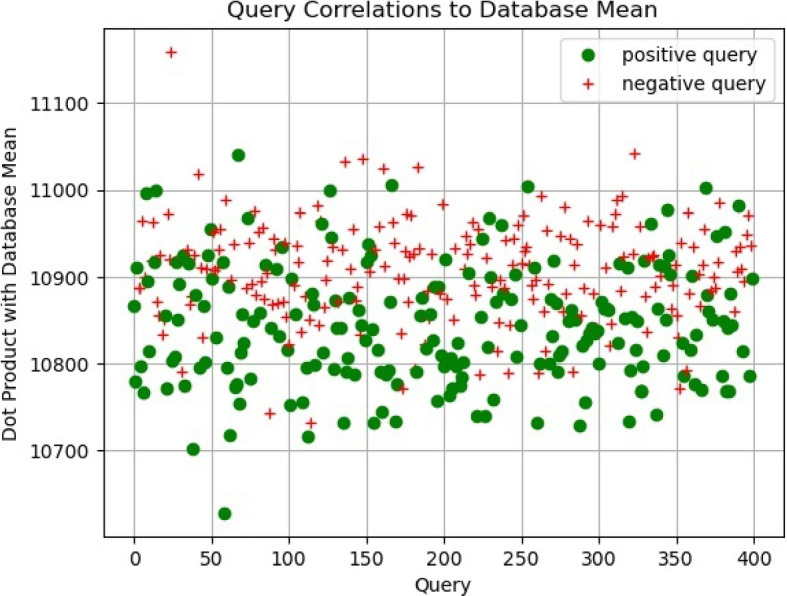
Scatter plot showing the correlation of positive and negative queries with respect to the database mean
In Eq. 4, is an encrypted genome sample (query) , D is the encrypted genomic database, is the encrypted value of genotype variant at gene locus i in query , is the average value of genotype variants at gene locus i across all individuals in admixture population making up D (2000 database samples). Similarly, is the variance of genotype variants at gene locus i.
Inspired by the one-sample paired z-test, we first assume that the means are continuous and simple random sample from the population of interest. Second, we assume that the data in the population is approximately normally distributed and, third, that we can compute the population standard deviation from the genomic database. From that, we proceed with hypothesis testing, making the Eq. 4 an approximation of the distance from the query to the group of unrelated individuals. When this distance is small, the query yields an “unfound” result, whereas a larger distance results in a “found” outcome. Notably, observations of genotype variants from related queries exhibit more significant deviations from the mean compared to those in unrelated queries.
Experimentally, we verify that the distance values (scores) derived from related queries using Eq. 4 tend to be higher in comparison to the reference population, as opposed to scores from unrelated queries (see Fig. 5). These scores allow for the projection of related and unrelated queries into a linearly separable space using a predefined threshold. Indeed, the choice of a threshold renders a linear decision boundary to realize the final classification/detection about whether the query has a relative in the database or not. Additionally, examining the classification performance (False Positive Rate, Precision and Recall) at varying thresholds allows us to plot the receiver operating characteristics (ROC) curve and select an optimal threshold value for final predictions of unseen queries (see Fig. 6).
Fig. 5.
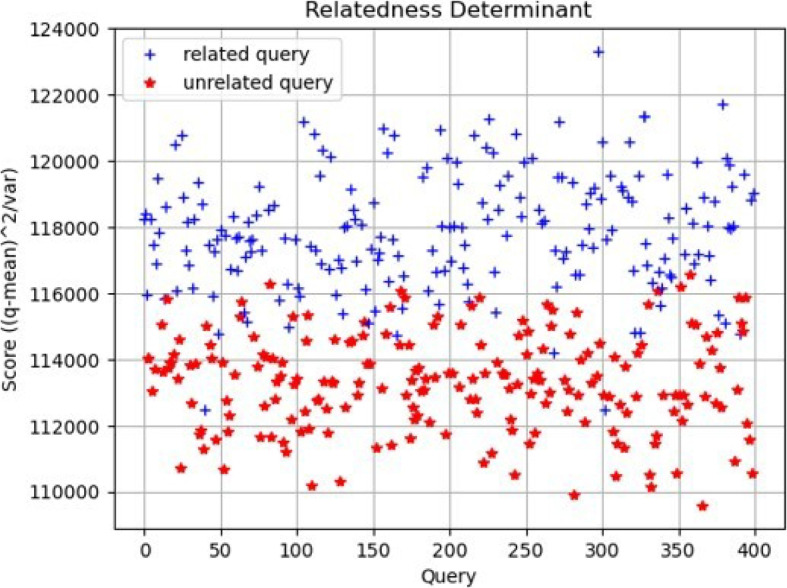
Scatter plot of relatedness determinants per query calculated using Eq. 4. Weighing the distance by the variance allows for better linear decision boundary
Fig. 6.
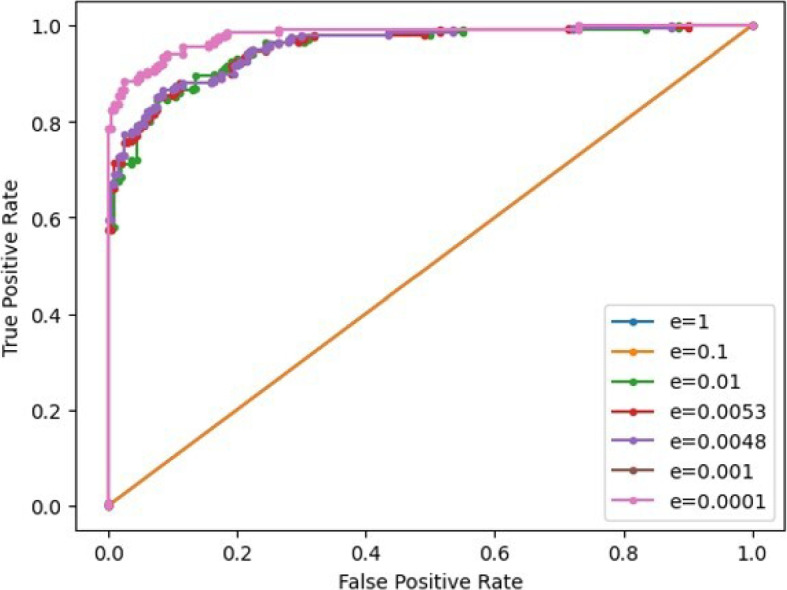
ROC curve plot of the unsupervised solution for different threshold values and different choices of e. Each ROC curve is plotted by varying the threshold with fixed e value
Optimization for performance
As follows, we make adjustments to Eq. 4 to ensure its compatibility with Homomorphic Encryption. In Eq. 5, we add a small constant e to the denominator to avoid division by zero. In Eq. 6, we replace the variance by the mean to avoid computations that would not change the ranking – this was verified experimentally.
| 5 |
| 6 |
In Eq. 7, we approximate the division by with a linear equation.
| 7 |
Initially, we considered utilizing the Goldschmidt’s algorithm [68] for variance division calculation. However, this approach calls for a staggering 26 multiplicative levels (in our implementation, without the need for bootstrapping), rendering it unsuitable for achieving low latency. In lieu of Goldschmidt’s, we opted for a linear approximation of division by the mean , even though it introduces a degree of inaccuracy. The trade-off, however, is the substantial reduction in latency. Equation 7 requires multiplicative depth (i.e. 4 multiplication levels) with the CKKS scheme. We achieve this by choosing with scaling factor , for which the choice of smallest polynomial degree to reach 128-bit security is [69]. Note that Q here denotes the coefficient modulus value and is the number of bits required to represent it in binary base. The scaling factor , even though small, proved to offer sufficient noise budget to refrain from arithmetic precision loss, such that the results obtained homomorphically are equal to the outputs in clear text. Table 5 shows how we heuristically find the optimal threshold for post-prediction decision making and the small constant e used in Eq. 7. Figure 6 shows how the varies with the value e, where each ROC curve is plotted by varying the prediction decision threshold value. The optimal threshold value in each ROC curve is located at the point in the curve that satisfies , where FPR is the false positive rate at the x-axis and TPR is the true positive rate at the y-axis.
Table 5.
List of threshold choices. By varying the threshold e we find the maximum ROCAUC
| e | auROC | TPR | FPR | Threshold |
|---|---|---|---|---|
| 1 | 0.5 | 0.0 | 0.0 | 1.0 |
| 0.1 | 0.5 | 0.0 | 0.0 | 1.0 |
| 0.01 | 0.9521 | 0.87 | 0.13 | 114478.50 |
| 0.001a | 0.9794 | 0.92 | 0.08 | 115447.70 |
| 0.0001 | 0.9794 | 0.92 | 0.08 | 115447.70 |
aOptimum threshold for this dataset
Additionally, we employed OpenMP to parallelize the addition operations involved in the homomorphic computation of the mean . Note that the homomorphic computation of the mean is only necessary when dealing with fully unsupervised case, where the order statistics of the population is unknown; otherwise, the mean can be precomputed ahead of time and available for inference in encrypted form to further reduce inference latency. Furthermore, we reorder the sequence of operations to delay the homomorphic rotations such that they are always applied to a reduced number of ciphertexts; thus, effectively reducing the number of rotations since they are only performed in extremely necessary cases. We called this “lazy” rotation, typically happening for outer sums of ciphertexts. We also perform multiple query predictions in parallel using OpenMP.
This algorithm runs in two steps: it first evaluates the database mean, and secondly it evaluates Eq. 7 to obtain the prediction score. Step one can be done offline with the challenge database or online using the competition database during inference. If computed offline, the mean database will be encrypted and be part of the input to the homomorphic evaluation of Eq. 7. Precomputing the mean allows us to reduce the required multiplicative depth of the homomorphic circuit, in which case the encryption parameters are set to and , which in turn also helps reduce latency.
Security level and parameters selection
A security level of 128 bits is enforced by using a polynomial modulus degree of and coefficient modulus size . We follow the BKZ.sieve model discussed in [69] to determine the values for those parameters, namely and N, to achieve 128-bit security level. We set the sequence of co-primes to have bit lengths {49, 30, 30, 30, 30, 49} whose product approximates Q, whereas for the case with , the sequence has one less inner co-prime and it becomes {49, 30, 30, 30, 49}.
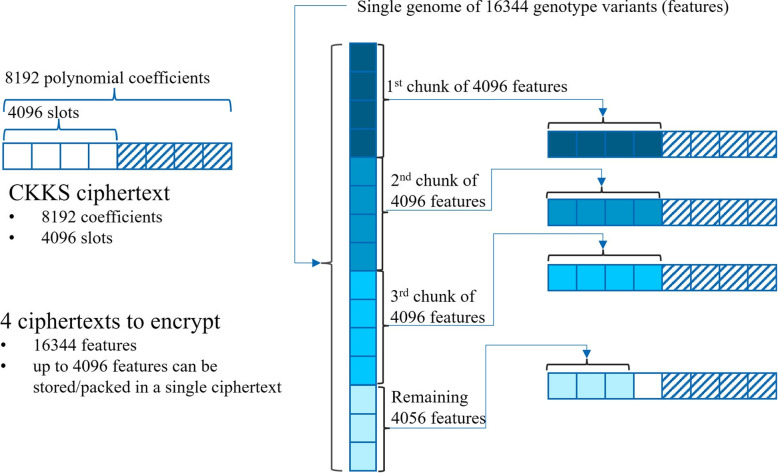
Packing
In order to reduce computational cost, we streamline the data packing into as few CKKS ciphertext as possible. Figure 7 illustrates how by selecting a polynomial ring degree of , there are 4096 slots within a single ciphertext where we can effectively store up to 4096 genotype variants out of the 16344. Consequently, merely 4 ciphertexts are needed for encrypting a genome feature vector encompassing 16344 genotypes variants. This means that if the polynomials of ciphertexts have degree N, Microsoft SEAL’s implementation of CKKS offers enough slots to store N/2 fixed-point numbers. Henceforth this same data packing strategy is used across all solutions presented in this work.
Fig. 7.
This figure shows the ciphertext packing that allows SIMD computation
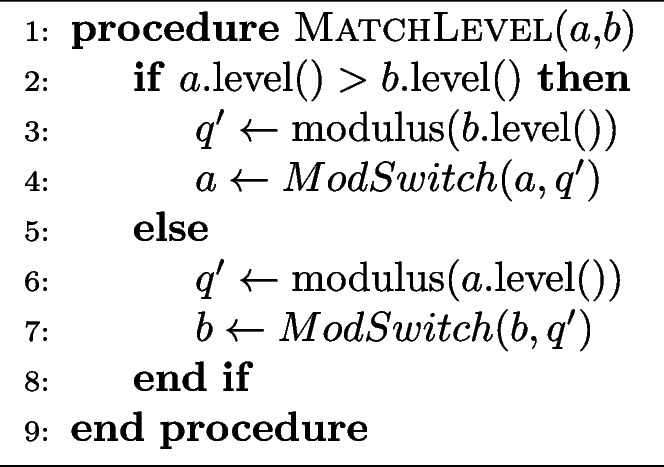
Algorithm 1 Drop the moduli of the ciphertext with more levels to match the ciphertext with less number of levels
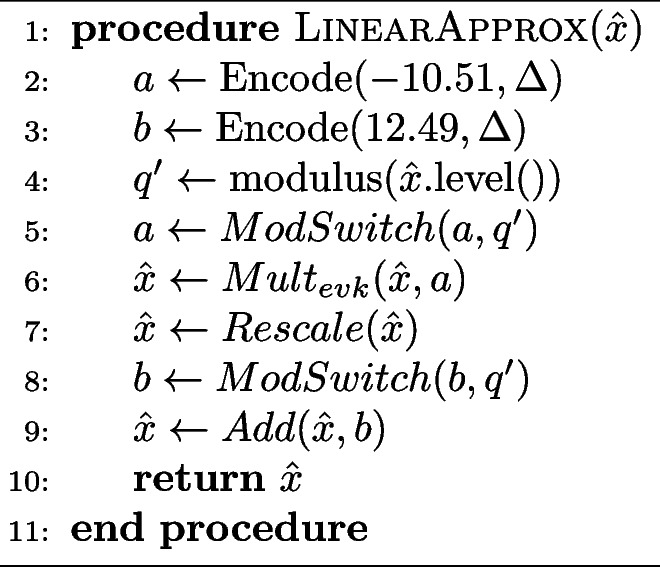
Algorithm 2 Computation of the linearly approximated constant fraction
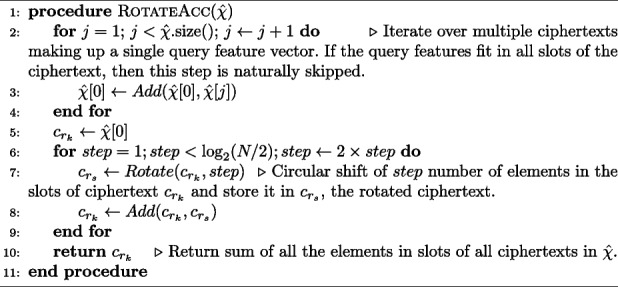
Algorithm 3 Computation of the inner sum of the elements in the slots of a vector of ciphertexts, which is described by the last two equations in Eq. 16. N is the polynomial ring size, such that N/2 corresponds to the number of slots. Here we assume empty slots are filled with zeros
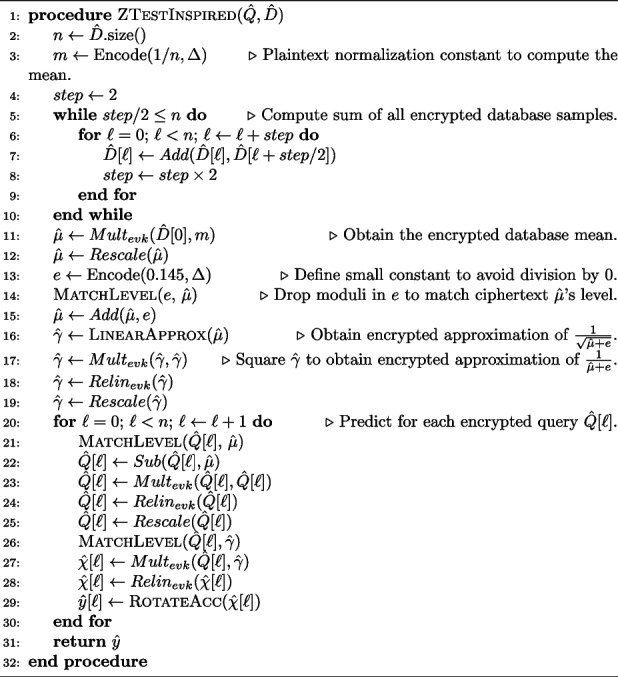
Algorithm 4 Fully Unsupervised Algorithm: Z-Test Inspired Method (Eq. 7)
Encrypted algorithm
The encrypted algorithm is described in Algorithm 4. Lines 5 through 12 compute the database mean in the encrypted domain. Lines 13 thru 14 add the small constant that avoid division by zero in the cleartext domain, where line 14 (see Algorithm 1) ensures that the plaintext e has the same scale and level of . Line 15 sums the encrypted mean with a small constant e. From line 16 (Algorithm 2) to line 19, we compute the encrypted approximation for , i.e. . Lines 20 through 25 compute . Lines 26 through 28 multiply the two terms and . Finally, the final score for query is computed as the sum of all the elements in the slot of ciphertext , i.e. performing the sum (see Algorithm 3 for details on the rotation-sum operation).
Clustering-based supervised method
The clustering-based approach was derived from the framework put forward in [8] and it is similar in spirit to the approach by [12], which takes into account sub-populations. The database D is represented by a set of cluster centroids and the database mean . The first term of Eq. 8 measures the absolute distance between a query and the database population mean . The smaller this distance, the more uncertainty to determine whether a query has a relative in the underlying population mixture. The second term measures the absolute distance between a query and a centroid , in which j denotes the centroid. The smaller this second distance, the greater the likelihood for a query to have a relative in the mixture. The maximum difference between these two terms across all k centroids results in the final predicted kinship score. The numerator represents a measurement of the relationship of a query q (point) with respect to the cluster representing the underlying mixture. The denominator is a normalization factor for the computed value in the numerator and is constant for each individual query prediction; therefore, it can be disregarded in the actual computation to save on latency.
Initially, within the unveiled procedure, the genomic database undergoes cleartext domain clustering (on the database owner’s premise). This clustering is solved using Lloyd’s k-means algorithm to determine a centroid j for each underlying sub-population (see [70]). The average complexity is given by , where is the number of samples and T is the number of iterations. Subsequently, Eq. 10 finds its application in the encrypted domain, leveraging the k encrypted centroids established during the k-means algorithm’s operation. The selection of parameter k is determined by the k-means algorithm’s assessment of the reference database. To minimize latency, a prudent choice is made to employ a smaller value of k. More specifically, we set as it does not compromise accuracy.
This cluster-point relationship solution is mathematically described in Eqs. 8, 9 and 10. Let a centroid represent a sub-population j in the genomic database. When the difference between the query and the mean is larger than the difference of query with centroid , then the value is positive indicating that it has a relative in the database. Conversely, if the difference between the query and the mean is smaller than the difference of query with centroids, then the value is negative indicating that it does not have a relative in the database. These calculated scores pave the way for projecting both related and unrelated queries onto a linearly separable space (see Fig. 8a).
| 8 |
Fig. 8.
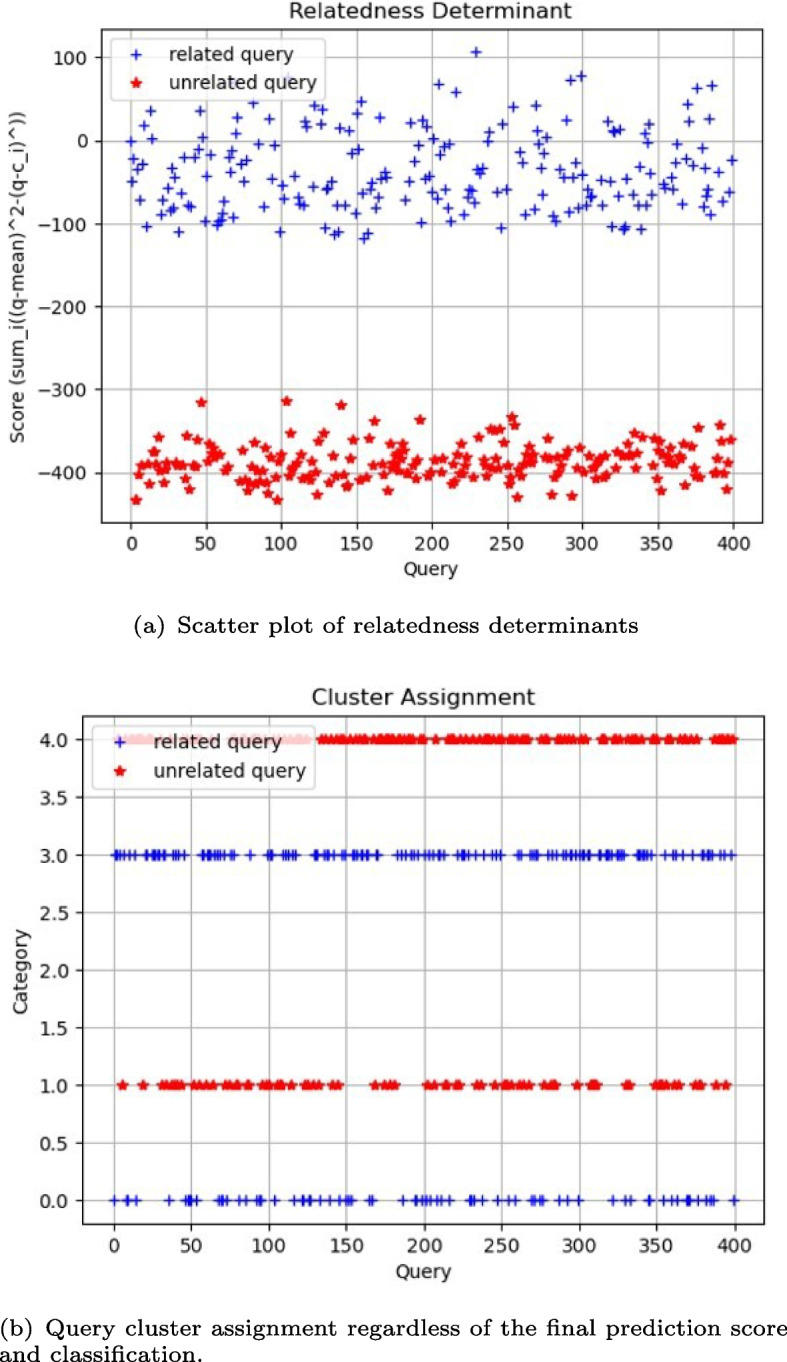
Summary plots of the clustering-based solution
Optimization for performance
Since is constant for all queries , the denominator is normalization factor and can go outside the max function. Thus, we shall concentrate on the numerator of Eq. 8 to rank the predictions; thus, we establish in Eq. 9. By eliminating this normalization step, the algorithm becomes more efficient in detriment of possibly not preserving the original ranking among the queries. This relaxation to the original equation is valuable to improve the computational efficiency in the encrypted domain, and it was empirically verified not to affect the accuracy.
| 9 |
This effectively reduces the amount of required computation. Then, we further simplify the prediction function by replacing the operator with , the sum over all computations across k centroids. The final score is now the aggregated voting of the k differences between the distance of query to the mean and the distance of query to centroid. Empirically, we verify that this does not alter the final predictions, such that the final objective becomes
| 10 |
where is the genotype variant of the cluster centroid and n is total number of genotype variants, i.e. . In this framework, Eq. 10 takes on the role of quantifying the separation between the query and the database mean, while also subtracting the query’s separation from each sub-population. In the competition, this method requires evaluations of Eq. 10 since the challenges consists of testing 400 queries. For a choice of , 2,000 evaluations are required, which is three orders of magnitude less operations than the naïve solution that requires 800,000 cross-correlations evaluations, as depicted in Fig. 3. Since, in Eq. 10, the mean and the cluster centroids are precomputed offline and used during inference, we consider it as a supervised approach. This assumes that the characteristics about the underlying population mixture from the challenge dataset are sufficient to generalize predictions to unknown query data. For this reason, the algorithm to compute inference as Eq. 10 requires only multiplicative depth , greatly optimizing the multiplicative depth complexity and latency associated to it.
This algorithm runs in two steps: first, it evaluates the database mean and computes the k cluster centroids in the clear text domain; secondly, it evaluates Eq. 10 to output the kinship prediction scores. Step one is done offline with the genomic database still in the database owner’s premise; then, the database mean and cluster centroids are encrypted and sent to the computing entity as part of the input to the encrypted evaluation of Eq. 10.
Security level and parameters selection
This time, the coefficient modulus size does not have to be comprised of many bits since the multiplicative depth equal 1. Even though a smaller Q is possible, accordingly the parameters and N, the scaling factor size must be carefully chosen. In this case, the scaling factor will dictate how much arithmetic precision to compute the target workload without corrupting the decryption. Given those considerations, we select a scaling factor that allows us minimize as much as possible the polynomial degree N. We found that the scaling factor is sufficient to keep the arithmetic precision afloat during computation of Eq. 10. To ensure 128-bit security level, we use polynomial ring size of degree of and a coefficient modulus of size . The coefficient modulus chain comprises co-primes with bit lengths {40, 29, 40}. This choice of parameters provide a compact and fast implementation.
Packing
In order to reduce computational cost, it is crucial to streamline the organization of the CKKS ciphertexts. We perform data packing and encryption similarly to what Fig. 7 illustrates. With polynomial ring degree of , there are 2048 slots available to pack data within a single ciphertext, effectively accommodating all 16,344 genotype variants in 8 ciphertexts.
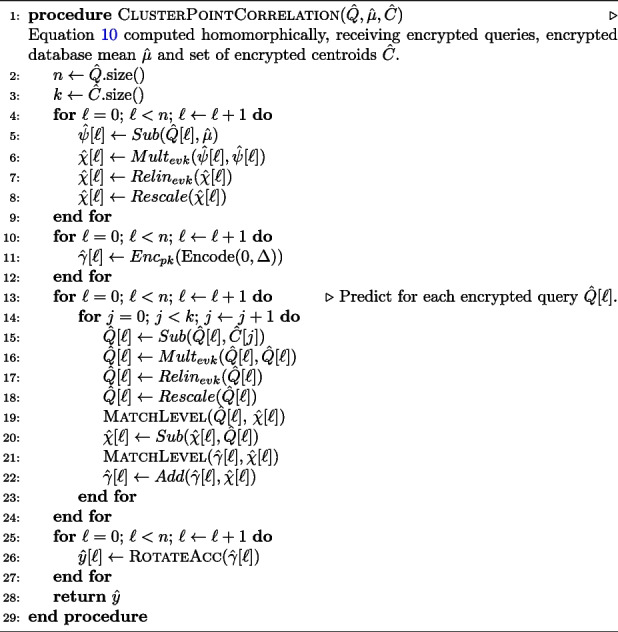
Algorithm 5 Cluster-Point Correlation Method (Eq. 10)
Encrypted algorithm
The full instructions of the encrypted algorithm is described in Algorithm 5. Lines 5 through 8 compute . Lines 15 through 18 compute . Lines 19 through 20 compute . Lines 21 through 22 store and aggregate the relationship scores of query with respect to the mean and each centroid in separate ciphertext . Line 26 concludes by performing the sum of all the scores for query , as in .
Linear regression method
Our clustering-based supervised approach lifts accuracy to highest possible, , i.e. it achieves perfectly accurate predictions. Nonetheless, its limitation lies in knowing how to optimally choose k when no knowledge about the reference population is available and in hurting latency performance as the number of reference populations k increases. The choice of k is important because it will directly impact accuracy. This technique could also be regarded as less flexible, compared to the unsupervised approach, since if the reference population expands or shrinks drastically, it could require re-mining the cluster centroids; therefore, less adaptable to changes than the unsupervised approach that can handle it naturally.
To mitigate those foreseen potential issues, we envision another supervised solution based on linear regression, which does not require tuning of hyperparameter such as k, even when the characteristics of the reference population mixture is unknown, and does not increase the amount of computation as k increases. It relies on extracting features from queries by apply a masking procedure with the database mean, and then optimizing the coefficients of a linear regression model to learn the underlying patterns, captured by these features, to discern between having or not having a relative in the database. As for adaptability, this approach could arguably be more robust to small changes in the reference mixture, given that its prediction power only depends on the pattern that has been learned in order to differentiate whether a query has a relative in a genomic database given its mean, which can be easily recomputed to apply new feature transformations to the queries.
Linear regression has been widely used for tackling secure genome problems (e.g. [71–76]). The reason for this popularity is linked to its arithmetic simplicity and robustness, and track record (e.g. s[77]), in finding hyperplanes separating distinct patterns in high-dimensional spaces [78]. We embrace these virtues to devise a more robust and efficient approach to the problem, nonetheless, under strong assumption that sufficient information is available in the data characterizing the reference population mixture, even if not specifically annotated. This emphasizes the supervised approaches’ major limitation: robustness and adaptability to changes in the reference populations are constrained to small variations, unlike the proposed unsupervised approach described in “Unsupervised method” section.
Model training
The ground-truth is a collection of 200 annotated pairwise relationships between 200 query samples and 200 database samples. Eighty percent out of those pairs are used for training and the remainder 20% are saved for testing. Hence, 160 queries known to have at least one relative in the database (i.e. positive queries) are separated for feature selection and model training. From the challenge query set Q, containing 400 queries, the remaining 200 that do not appear in the ground-truth annotation are genomes known not to have their genetic data shared with any of the 2000 samples from the database; thus, we consider 160 of them (80%) to represent negative queries, i.e. examples of queries that do not have a relative in the database, for training and 40 others (20%) for testing. These samples are unique and provided as part of the challenge dataset.
First, these 160 positive queries plus 160 negative queries are used for selecting the most relevant features (genotype variants) out of 16344. Then, we create more positive and negative queries out of those 320 queries to increase the sample-feature ratio, i.e. synthesize as many samples as possible to reach the ratio of about 10 samples per relevant feature. Training of the linear regression model follows suit, fed with the augmented sample set.
Feature selection
To help the linear regression optimizer find a more robust hyperplane, and be less predisposed to overfitting, we perform dimensionality reduction using the Variable Threshold technique. In this case, dimensions located at genotype variants whose variance are less than a certain threshold are disregarded to represent the genome sequence of a query. For feature selection, we use all 320 samples reserved for training. Depending on the value of the variance threshold, more or less features are deemed as relevant. The goal is to have as less features are possible. We found that a threshold of 0.11, by varying from 0.2 to 0.1 considering two digits after the decimal point, yields robust performance with 3893 features out of the 16344 genotype variants.
Data augmentation
In addition, we increase the number of samples per features to improve generalization of the model. It consists of random resampling of the 320 data points with replacement. Resampling is applied to increase the positive and negative samples by a factor of 120, such that we end up with about 10 samples per feature. We use the resample function from the Python’s sklearn package to accomplish it – we perform oversampling, consisting of repeating some of the samples in the original collection.
Feature transformation
The original features of a query q are their genome genotype variants, a sequence of values in the set . We apply a transformation to the genotype variants to create features that are derived from computing its relationship with respect to the average of genotype variants found in the target genomic database. That is, the transformation uses the genome mean of the database. This transformation is algebraically described in Eq. 11,
| 11 |
where corresponds to element-wise multiplication between q and components (in clear text, i.e. non-encrypted data). The training queries transformed to features populate the matrix X in Eq. 13, where each row of X is either a positive or negative sample, for training of a logistic regression model that separates queries that correlates with the mean from those queries that do not.
Training
The transformed queries are samples indexed as rows of a sparse matrix X that is used to solve for the linear regression coefficients w. These samples become further sparse after the feature selection procedure, such that certain dimensions i are zeroed out. We use the Conjugate Gradient Method [79] to optimize the cost function, via ridge regression [80], shown in Eq. 12, which finds coefficients that minimizes the squared error of predictions against the ground-truth y. This objective function includes a regularization term weighted by that helps minimize the risk of overfitting in addition to the dimensionality reduction by the feature selection procedure. The ground-truth vector y holds values for positive queries and for negative queries.
| 12 |
where
| 13 |
We measure the training performance using different metrics. To assess precision of the predicted values, we rely on both the R2-score and root-mean-square error (RMSE). On the training set, the R2-score is reported to reach 1.0, which means perfect accuracy, and the RMSE=0.0000014. As for classification accuracy, we rely on the auROC, which summarizes the reliability on Recall and False Positive Rates with a single score. On the training set, it reported 100% successful rate with auROC=1.0.
Inference
The prediction phase occurs in the encrypted domain and it consists of two steps. The first step consists of applying the transformation shown in Eq. 11 to each of the 400 encrypted queries , where . The result is a collection of transformed input ciphertexts computed from the component-wise multiplication between and (see Eq. 14), where is the encrypted mean of the searchable genomic database D.
| 14 |
where corresponds to the encrypted feature vector of a query computed using the feature extraction procedure described in Eq. 11. This implies that the inference would consume one additional multiplicative depth to account for this preprocessing step; thus, requiring an encryption configuration that allows for multiplicative depth instead of as explained in “Security level and parameters selection” section. In practice, we bypass this preprocessing step for efficiency, i.e. to avoid an additional level, by directly using the encrypted queries with their original values (see Eq. 15) for inference. We empirically verified that this yields comparable results, not affecting the accuracy. Hence, we keep the multiplicative depth of the encrypted circuit of this linear regression-based approach down to .
| 15 |
Note that the training step uses as features to learn the classification hyperplane. The linear regression inference function for a single query in clear text is defined as . In the encrypted domain, this same inference function takes a different form and it is defined as follows
| 16 |
where [j] denotes indexing at the ciphertext of a collection of M ciphertexts encrypting query and the weights w. and denote the encrypted linear regression coefficients and bias, respectively. corresponds to the encrypted real-valued prediction that measures the likelihood of query q to share genetic data with any of the database samples. M equals , i.e. the number of ciphertexts used to encrypt all the features of a single query q. Rotation is executed times to iteratively accumulate the sum of all the elements in the slots of the output ciphertext , where resulted from the homomorphic pointwise multiplication of the encrypted query and the encrypted weights (see Fig. 9 for a toy illustration). At each iteration, rotation applies circular-shifting to the ciphertext , resulted from previously rotation and accumulation with ciphertext . In the end, the sum of all elements in the slots is stored in all slots of the ciphertext (see Fig. 10 for a toy illustration). At last, the encrypted linear regression bias term, denoted as , is added to so as to complete the linear regression dot product as the encrypted prediction – the prediction score for the single query q appears in all the slots of ciphertext .
Fig. 9.
Toy illustration of SIMD dot product with CKKS ciphertexts
Fig. 10.
Toy illustration of how the Rotation operation helps sum all the elements in the slots of a CKKS ciphertext
Optimization for performance
While Eq. 14 is an easy-to-compute element-wise vector-vector multiplication, Eq. 16 is a matrix-vector multiplication that entails matrix-row-number of dot products. Even though two consecutive multiplications are involved in this sequence of operations, only 1 level is consumed since the modulus switch operation is postponed until after the second multiplication is complete. We also optimize the number of rotations needed to accumulate the results of the element-wise multiplications involved in a dot product by first adding all the ciphertexts involved in a single query prediction (see Eq. 16). That is, an encrypted query containing 16344 features is split into ciphertexts; therefore, after multiplying them by the encrypted database mean, instead of applying rotations on each of the individual ciphertexts to sum their internal components first, we first sum the ciphertexts to obtain a single ciphertext and only then rotations are executed to perform the sum of the dot product.
Security level and parameters selection
Analogous to the clustering-based approach, we manage to maintain multiplicative depth for the linear regression-based supervised method. By both providing precomputed database mean and postponing the modulus switch operation until after the second multiplication helps achieve that. Additionally, as briefly explained in “Inference” section, for the inference step we do not apply the feature transformation to the query but instead directly use the original data values since that would demand to set . This way, the same parameter values are used, i.e. coefficient modulus size , polynomial ring size , scaling factor , and modulus chain comprising a sequence of co-primes with bit lengths {40, 29, 40}.
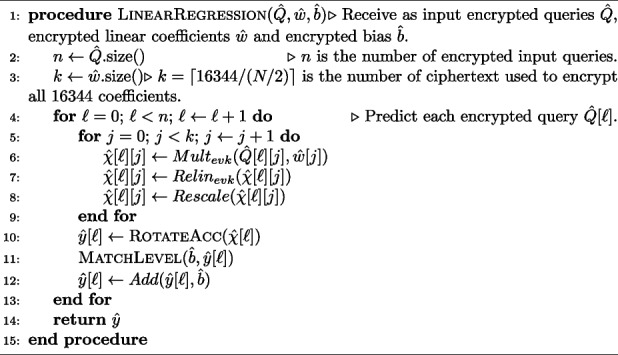
Algorithm 6 Linear Regression Method (Eq. 16)
Encrypted algorithm
The full set of instructions describing the encrypted linear regression algorithm is shown in Algorithm 6. Lines 5 to 9 perform component-wise multiplication of the linear coefficients and the query data (see top row of Fig. 9). Line 10 performs the sum of all of elements in the slots resulted from the product of linear coefficients and input data (see bottom row of Fig. 9 and top row of Fig. 10 for a toy illustration of the sequence of operations). Line 12 performs the addition of the linear regression dot product with the bias term (see bottom row of Fig. 10). The prediction results are stored in and returned.
Results
Secure detection of relatives in forensic genomics
In this section, we provide the context, within the scope of the challenge, under which the secure protocol performance results were obtained. We present the problem space, data and the computing and software resources used. We also describe the use case model in which this application is useful in practice and the performance evaluation metric. Other design considerations that affect performance are also discussed before introducing the performance results of the methods.
Problem and data description
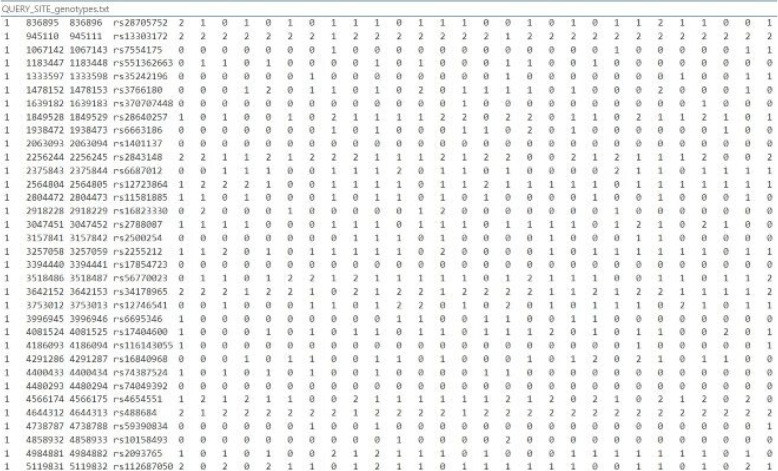
We tackle the problem of creating a secure outsourcing protocol for kinship prediction, ensuring the protection of both genotypes and model parameters, using datasets assigned in the iDASH 2023 Track1 competition, which we briefly describe in the following. The problem involves having a query, a forensic genome comprising 16344 genotype variants, to be matched against a database containing 2000 archived genomes, each of which have the same sequence of 16344 genotype variants. The response to a single query will provide the probability (or likelihood rate) that there exists in the database a relative of the individual from whom the query genotypes were extracted. An illustration of the genome sequence data files for queries and database is shown in Fig. 11.
Fig. 11.
Illustration of genome sequence data. Genome sequences are organized as columns and their genotypes organized as rows
In addition to the database with 2000 entries, participants are given 400 test queries, half of which have a relative in the database whereas in the other half this relationship is nonexistent. The primary challenge arises from the need to optimize the encrypted query search algorithm, with focus on improving accuracy, minimizing latency, while enhancing its capability to generalize to new data – more details on “Evaluation criteria” and “Methods” sections.
The challenge database includes a matrix , where is the set of genotype kinds, and D has 2000 columns denoting genomic samples of different individuals and 16344 rows denoting the genotype variants. The query set comprises 400 queries as column vectors, each representing the genome of 16344 genotypes variants for an unidentified suspect, for which annotation is provided about whether the query sample has a relative in the database or not. This annotation is provided as a separate file containing a ground truth binary vector of size 400 where 0 indicates no family member in the database while 1 indicates that there exists at least one family member in the database for the query genome. The inference (or query kinship prediction) is a response vector (where is the set of real numbers) computed from the query set Q, and when compared to ground truth vector yields the prediction accuracy rates. The goal is to compute the function as accurately as possible in the encrypted domain, for all , where matrix D contains all 2000 genomes of known subjects and their pedigrees, denotes the query genome i, i.e. Q indexed at column i, and the is the predicted relatedness score for query .
Problem setting and secure protocol
There are three parties: Query Client (QE, short for query entity), Data and Model Owner (DE, short for database entity), and Evaluator (CE, short for computing entity). The QE wants to use her sensitive genotype data to perform kinship prediction by using either the DE’s models or database entries directly. The DE builds the kinship prediction models that take genotypes as input. Models contain sensitive information (e.g. IP that could be monetized) and cannot be shared in plain form. Therefore, the modeler, i.e. DE, releases her models only in encrypted form. The CE performs model evaluation using encrypted genomes and encrypted model parameters. The challenge involves generating cryptographic keys (Client), building the models (Data and Model Owner) and the secure evaluation of the models and functions on encrypted genotype data (Evaluator). As described above, the models and genomic data are sensitive and must be encrypted before they are sent to the Evaluator. See a detailed depiction of this secure protocol in Fig. 1.
Design considerations
The challenge involves the computation of 400 kinship scores using encrypted data and an encrypted search model. There are three primary design considerations in this task. Firstly, performing computations on encrypted data is notably slow, potentially taking hours or even days instead of just minutes to complete. Secondly, conducting computations on encrypted floating-point data may introduce errors due to limitations in precision and noise budgets. Finally, it is crucial to configure the permissible number of consecutive multiplications, also known as multiplicative depth (L), in a way that prevents data corruption during the decryption of the output. Techniques like bootstrapping to increase the multiplicative depth cannot be used for this competition because low latency is the focus. These limitations might restrict the use of advanced algorithms, such as deep neural networks, which, from the perspective of homomorphic encryption and this competition, demand excessive latency. Therefore only low complexity homomorphic encryption friendly algorithms are viable solutions to address these constraints.
This is due to heavy computations with polynomials, the basic construct of the homomorphic encryption schemes. In addition, if the prediction algorithm involves non-linear functions, the polynomial approximation of these functions operating in encrypted domain could become the main bottleneck or even require several calls to the most expensive homomorphic operation, the bootstrapping. We tailor the algorithm steps and optimization strategies to avoid both. To avoid the use of high-degree polynomial approximations, we constraint to specific data ranges that are sufficiently general – this may depend heavily on the dataset characteristics and the datapath of the algorithm. Additionally, we also avoid certain non-linear functions by replacing them with linear and polynomial approximations and others HE-friendly reformulations. Those alternatives were empirically verified to retain the functionality and behave equivalently to the original formulation. Bootstrapping operations can be avoided by carefully selecting the scaling factor to achieve sufficient multiplicative depth so as to compute the algorithm without running out of noise budget while keeping the precision afloat.
Optimizing computing and resources
We opted to use the CKKS [34] Homomorphic Encryption scheme implemented in the Microsoft SEAL library [81], including Intel® HEXL (Homomorphic Encryption Accelerated) library by [82]. Our choice is motivated by the following reasons: it can work with real numbers through fixed-point arithmetic, it has an efficient packing method that allows computations in an SIMD fashion, and its implementation in the Microsoft SEAL library is fast, especially when accelerated with Intel® HEXL 1.2.3 library, in which case the code takes full advantage of the hardware features such as Intel® AVX512, available in several Intel servers, including in the iDASH competition.
The choice of data packing strategy is important because it dictates how data will be organized in the ciphertexts. This impacts on reduction in the number of operations and simplification of the algorithm steps with homomorphic operations. Additionally, it can also affect reordering of the sequence of operations in order to decrease the multiplicative depth required. The data packing step happens before encoding and encryption. It is technically independent of the type of encoding and encryption employed but it determines the number of ciphertexts required to encrypt all data. As a result, not only does it influence on computing latency savings and optimizations in the steps of the algorithms but also on the required memory footprint, storage capacity in DRAM and disk, and memory bandwidth. When choosing the data packing strategy, all of these computing resource aspects should be taken into account together to conceive a good design for the target application. We decided to pack the genotypes of the one same genome sequence in the available slots of the same ciphertext in its original order – if a single ciphertext is not sufficient, then a single genome will be encrypted by multiple ciphertexts. We found this strategy to be sufficiently good and optimal for the target algorithms out of a few evaluated strategies, for which detailed analysis is out of scope of this manuscript. Figure 7 depicts the data packing strategy used in this work.
Computation environments
To provide a performance characterization of our solutions in the context of the iDASH 2023 competition, we evaluated our solutions on a dual-socket server that hosts two Intel® Xeon® Gold 6140 CPUs, carrying 18 physical cores each. The system also hosts 32GB DDR SDRAM and 745GB of storage. As per the competition rule, by default the execution is constrained to run on exactly 4 physical CPU cores, unless specified, on a single NUMA node. Although obsolete and discontinued, this hardware configuration approximates the one employed in the competition and we perform experiments with it for the sake of completeness of this study. We implement the source code in C++, using Microsoft SEAL 4.0 APIs enabled with the acceleration kernels provided by the Intel® HEXL 1.2.3 library. Finally, the code compilation uses GCC 10 on CentOS 7. These results are discussed across subsections of “Methods” section as we introduce implementation details of the different algorithms and they are expanded in Table 7 and Fig. 12.
Table 7.
Extended performance results obtained on equivalent hardware configuration used in the iDASH competition, more specifically Intel® Xeon® Gold 6140 (see “Computation environments” section for more details). The results illustrate how latency and throughput scales when more than 4 CPU cores are utilized for parallel processing of the workload
| Latencya(s) | Throughput2(q/s) | |||||||
|---|---|---|---|---|---|---|---|---|
| # Cores | # Cores | |||||||
| Method | 4 | 8 | 16 | 32 | 4 | 8 | 16 | 32 |
| “Unsupervised method” section | 6.24 | 3.43 | 2.44 | 2.17 | 64 | 117 | 164 | 184 |
| “Clustering-based supervised method” section | 7.53 | 4.26 | 2.83 | 2.38 | 53 | 94 | 141 | 168 |
| “Linear regression method” section | 5.92 | 3.06 | 2.26 | 1.85 | 68 | 131 | 177 | 216 |
Disclaimer: Performance varies by use, configuration and other factors. Learn more at www.Intel.com/PerformanceIndex.
Latency of the different approaches described in “Methods” section running on multiple cores.
Throughput of the different approaches described in “Methods” section running on multiple cores
Fig. 12.
Graph showing how all three methods scale latency with increasing availability of CPU cores for inference of 400 queries
A comparative performance analysis for all the three different proposed algorithms, using the same secure protocol described in Fig. 1, outside the context of the iDASH competition is performed on more contemporary system configuration. Its hardware configuration consists of a dual-socket server that hosts two Intel® Xeon® Platinum 8480+ CPUs, carrying 56 physical cores each. This is a more modern processor and likely to be readily available in mainstream cloud service providers. The system also hosts 256GB DDR5 SDRAM and 447GB of disk storage. All experiments are run on a single NUMA node varying the number of cores to a maximum of 32 cores. To scale the execution across multiple cores, we use OpenMP 4.5. We implement the source code in C++ and program the HE support using the Microsoft SEAL 4.0 APIs. We also analyze the performance impact of enabling the acceleration kernels optimized with AVX512 offered in the Intel® HEXL 1.2.3 library. The Intel® AVX512 extension is a set of instructions that can boost performance for vector processing–intensive workloads. With wide 512-bit vector-operations capabilities, the CPU largest register supports 32 double-precision and 64 single-precision floating-point numbers or, alternatively, 8 64-bit and 16 32-bit integers. Intel® AVX512 also provides up to two 512-bit fused-multiply add (FMA) units. Doubling the width of the vector processing doubles the number of registers compared to its predecessor, Intel® AVX2. Intel® HEXL 1.2.3 library offerings are currently integrated into the Microsoft SEAL 4.0 library and can be enabled at compilation time. The compiler used is GCC 11.4 and the OS is Ubuntu 22.4. The results are discussed in detail in “Comparative performance analysis” section.
Evaluation criteria
All tests were performed on a hold-out dataset of 400 genomes in an isolated environment in terms of performance. Accuracy and time/memory requirements were used for the benchmark and ranking of the solutions. The formula used to rank the fitness of the solutions was
| 17 |
where auROC is the area under (au) the receiver operating characteristic (ROC) curve, metric used to assess the accuracy of predictions, and t is the execution time in minutes. Observe that the ranking is highly impacted by the exponential weight factor of the demanded computational time, regardless of the prediction accuracy.
Performance on iDASH competition
Firstly, we discuss the performance results where the algorithm performance was tuned for the iDASH competition, from “Fully unsupervised method” to “Linear regression model” sections. Then, in “Comparative performance analysis” section, we discuss a broader comparative performance analysis that goes beyond the constraints of the competition.
Fully unsupervised method
The fully unsupervised solution is inspired by the z-test hypothesis test. It is targeted to the cases where the database owner has to encrypted the whole database and send the encrypted samples to the computing entity because it is unable to perform any pre-computation to reduce the computational burden on the server. Thus, the encrypted computation is fully unsupervised in the sense that there is no pre-computation needed for the prediction step on the server. Since no training is done for this approach, lower accuracy is expected.
We obtain 0.90 in accuracy, recall and precision, which naturally yields F1-score=0.90. The optimal auROC is 0.9794 out of all of the ones plotted in Fig. 6; however, in the encrypted domain the auROC value lowers to 0.9685 due to replacement of the variance by the mean as discussed above. Its computing efficiency is marked by latency of seconds to execute the full secure protocol including database encryption, while running on 4 CPU cores. The database encryption alone takes 8.22 seconds (see Table 6). Note that the database encryption requirement imposed by the rules of the iDASH 2023 competition implies that the problem should be solved in an unsupervised manner, although not necessary since the mean could be precomputed ahead of time and encrypted before leaving custody of the database owner. In fact, if this is the case, the latency of the full protocol reduces from 14.44 to 6.22 seconds (see Table 7), an improvement by a factor of 2.32x.
Table 6.
Performance Results of 400 Kinship Predictions. The first two rows approximates and summarizes the results obtained in the iDASH 2023 Competition. The third row includes the linear regression solution, which was not submitted to the competition. The fourth row presents an estimate of the naïve solution
| Approach | Database encryption | Latency | Throughput | Inferences | auROC | Score |
|---|---|---|---|---|---|---|
| “Unsupervised method” section | 8.22 s | 14.44 s | 27.7 q/s | 400 | 0.96 | 0.923 |
| “Clustering-based supervised method” section | 5.73 s | 13.36 s | 29.9 q/s | 2000 | 1.0 | 0.956 |
| “Linear regression method” section | 5.73 s | 11.63 s | 34 q/s | 400 | 1.0 | 0.962 |
| Naïve | > 5 min | > 10 min | <1 q/m | >800400 | 1.0 | < 0.135 |
Disclaimer: Performance varies by use, configuration and other factors. Learn more at www.Intel.com/PerformanceIndex
The ranking score of this solution, including the data encryption overhead, has value , which shows that the accuracy is heavily penalized by compute resources and total time of the protocol. This yields a throughput of about 27.7 queries per seconds (q/s). The unsupervised algorithm required minimal assumptions about the dataset and offered more robust generalization at the cost of sub-optimal accuracy and recall. As previously stated, this approach does not assume any knowledge of the database, and it is completely unsupervised, requiring computing the database mean using the encrypted database samples in the third-party computing entity. In practice, if future predictions are known to be drawn from a similar data distribution with same first-order and second-order statistics of the underlying mixture, then we can further optimize the required computation during the inference process by providing encrypted precomputed mean (and possibly inverse of variance if higher accuracy is desired). As discussed earlier, we are able to reduce the number of levels to to speed up computation even more. All the results discussed in “Comparative performance analysis” section were obtained using this version since it is outside the iDASH competition context and we assume that it is acceptable to have the mean precomputed.
Clustering-based supervised
Clustering is an unsupervised technique to mine and organize data points of similar characteristics into distinct groups. We consider this approach supervised for the sole fact of re-utilizing the representative entities of these groups, the cluster centroids, as anchors of knowledge for the inference on incoming queries. Essentially, the assumption is that these distinct representative groups summarize all information about the target underlying populations. For the iDASH 2023 competition, the centroids are fixed but, in practice, they could evolve as the underlying mixture changes, such that clustering could be performed offline as often as necessary, before the time for querying an unknown suspect.
The accuracy obtained for the iDASH 2023 competition hits 100% success rate (Recall=1.0, Precision=1.0, False Positive Rate=0.0) for all 400 queries and is summarized by F1-score=1.0 and auROC=1.0 (see Figs. 8a and 13). This was achieved both on the 400 queries from the challenge dataset and on the 400 unknown queries of the competition. In Fig. 8b, we observe forced assignment of the negative queries to clusters 1 and 4. This type of behavior is expected since in this case we only rely on the existing clusters (patterns of population characteristics) for the final decision. This issue is resolved by subtracting the distance between the query and the assigned cluster centroid (right term of Eq. 10) from the distance of the query and the database mean (left term of Eq. 10). This mechanism allows us to reject the wrong assignments by producing reliable prediction values (shown along y-axis of Fig. 8a) that facilitate to decide whether it is a positive or negative query with the choice of a threshold value; thus, achieving perfect results (see Fig. 13). Figure 8b also shows that setting probably led to overfitting of the centroids, having two or more centroids representing one same true underlying cluster. This probably means there are less populations than anticipated (i.e. ), and we can visually inspect and suggest that number of populations might be . We make an educated guess about k by analyzing the performance with the validation set with k varying from 2 to 25.
Fig. 13.
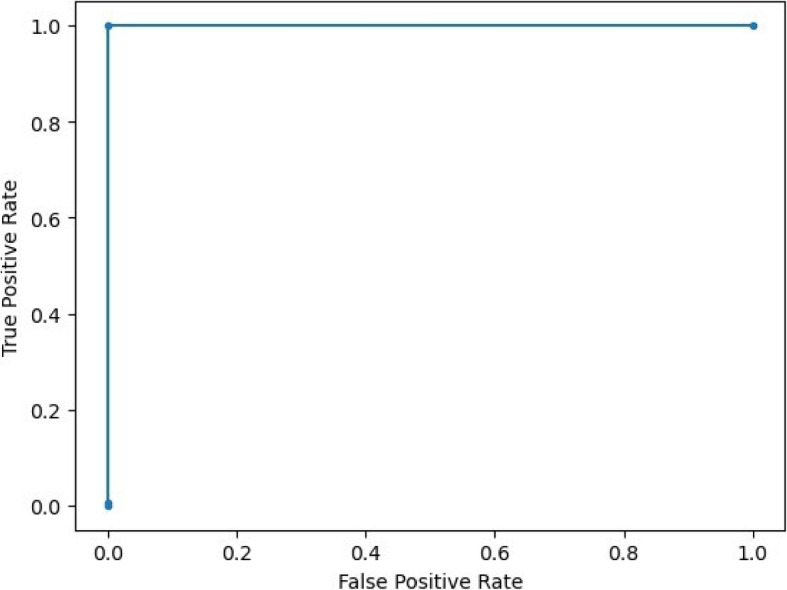
ROC curve of the clustering-based solution
As for computing performance, the time to complete the prediction of all 400 queries amounts to seconds (see Table 6), which includes the database encryption. However, database encryption is not needed since only the encrypted centroids are required for the inference step. The database encryption is merely a requirement imposed by the rules of the iDASH 2023 competition. In practice, this can be ignored since the encrypted database samples are not directly utilized for inference. Having considered this, it provides a throughput of about 29.9 queries per seconds (q/s) due to the database encryption overhead. This solution ranking score is , which is a significant improvement over the unsupervised solution score of 0.923. As for the classification performance, this method creates a clear separation between related queries and unrelated queries (see Fig. 8a).
Note that, in practice, our solution can be deployed more efficiently in a more general setting, achieving better latency and higher throughput. Without the data encryption overhead, the full protocol completes in 7.53 seconds, yielding a higher throughput of 53q/s. We measure the computing performance of the full protocol without the iDASH competition constraints and verified that latency can be as low as 2.38 seconds, for all 400 query predictions, by running with 32 CPU cores (see Table 7 for more details). As a result, throughput can be as high as 168 query predictions per second (see Table 7 for more details), while keeping the required computation lean (i.e., avoiding unhelpful computing work).
Linear regression model
As for the trained linear regression model, the performance was evaluated on a test set containing 40 positive queries and 40 negative queries. The model achieves perfect accuracy, precision and recall, yielding F1-score=1.0 and auROC=1.0 (see Fig. 14a and b). As for precision of the predicted values in comparison with the expected, the model reaches R2-score=0.8363 and RMSE=0.2022 on the test set. Computing performance is characterized by an average latency of seconds for predicting a batch of 400 queries using 4 CPU cores (see Table 7). This yields a throughput of about 68 queries per seconds (see Table 7). The estimated iDASH 2023 score for this solution is , which is an improvement of about 2.5% over the clustering-based solution. This method creates a clear separation between related queries and unrelated queries (see Fig. 14b). For a more general understanding of latency performance, we show in Fig. 12 that the latency scales almost linearly with the number of cores, predicting 400 queries in 2.22 seconds when running on 16 CPU cores. It also outputs prediction values in a range [-0.2,1.2] that approximates the probability range [0.0,1.0] (finding optimal prediction threshold value at 0.4958); thus, more naturally interpretable.
Fig. 14.
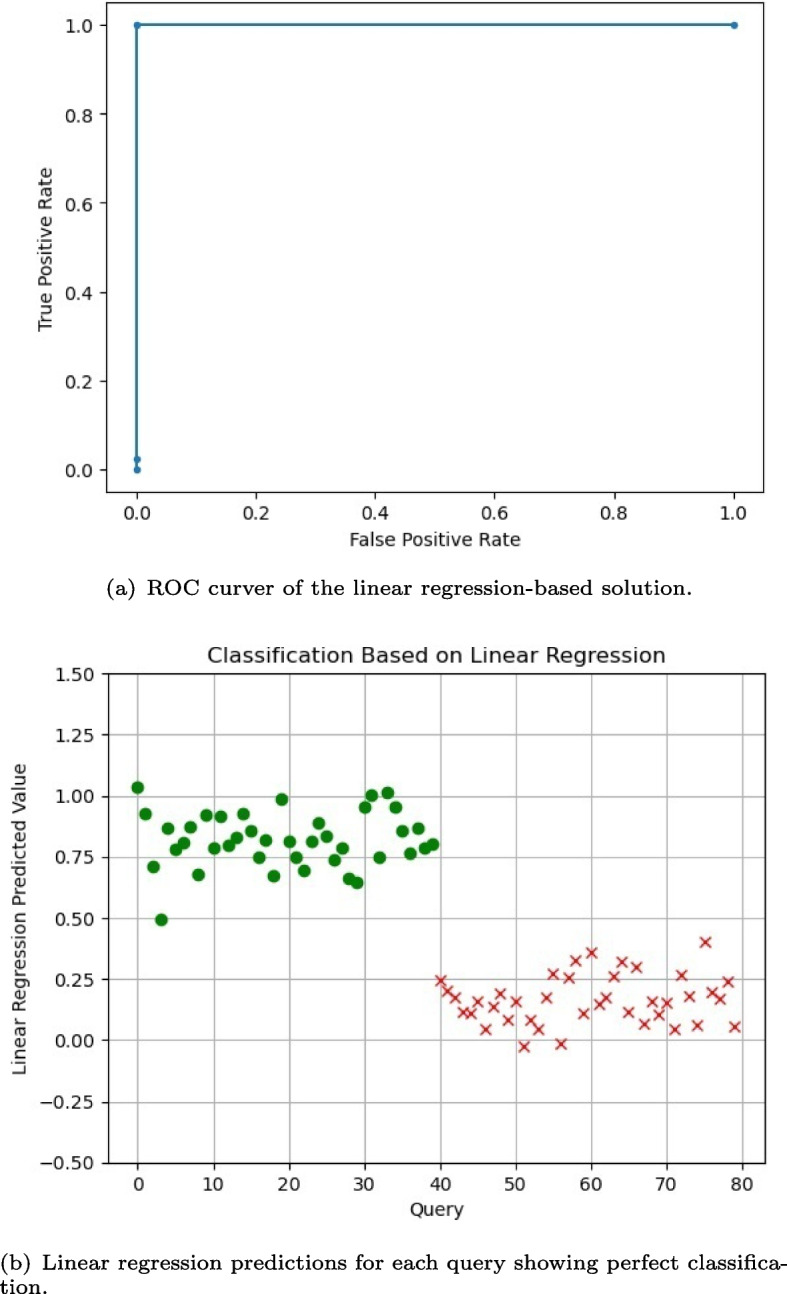
Linear Regression-based prediction performance: a plot of the ROC curve showing perfect prediction, and b scatter plot of the predicted values for each query showing linearly separable classification decision boundary
It is instructive to discuss why true positive rate and precision are remarkably perfect, yielding an auROC score of 1.0. We refer to a few factors to justify it and claim that this does not mean overfitting of the trained model. First, we employ feature selection to find the most relevant predictors (features) capturing the main characteristics of underlying mixture, which in turn contributes to avoid overfitting of the linear regression model. Additionally, we resort to data augmentation to increase the number of samples per feature to encourage better generalization of the model, even though the curated dataset is not imbalanced. Finally, during the optimization of the objective function, we introduce a regularization term that also minimize the chances of the model from overfitting and instead guide it to achieve better generalization. However, it is true that the model is trained to make predictions under the assumption of a known underlying mixture and that the provided dataset holds sufficient and representative statistics of the target populations.
Comparative performance analysis
We contrast and compare the throughput and latency performance of the three different prediction algorithms. Our analysis is conducted using a contemporary Intel server processor, in particular, the Intel® Xeon® Platinum 8480+ CPU. In the previous section, the performance results were carried out with an older generation Intel processor that approximates the specification of the one used by the iDASH 2023 competition. Ideally, these workloads shall run on later generations with the latest and greatest of performance features. This section is intended to discuss performance gains due to different software configurations and choice of algorithm on a platform powered by Intel® Xeon® Platinum 8480+ server processor.
Experimental setup
The performance benchmark is organized into 4 different scenarios. The first scenario consists of the baseline performance configuration. Two others bring specific capabilities in isolation, namely, the usage of vectorized instructions with Intel® AVX512 feature and the use of OpenMP 4.5 to parallelize encryption, decryption and the inference code with multicore execution. The fourth scenario is a combination of the last two configurations, i.e. simultaneously leveraging the instruction-level and core-level data parallelism. As follows, we describe the scenarios in detail. The baseline performance configuration entails a single-core execution of the workloads programmed with the Microsoft SEAL 4.0 API. In the second scenario the workload is programmed to execute with vectorized instructions using Intel® AVX512 by enabling at compilation time Intel® HEXL 1.2.3 in the Microsoft SEAL 4.0 API. The third scenario involves enabling parallel processing with OpenMP 4.5, where SIMD-friendly parts of the workloads are executed on multiple cores - the number of cores varies from 2 to 32. The fourth scenario combines scenarios 3 and 4. The performance metrics used for analysis are throughput (queries per second), latency (seconds), and normalized performance (throughput divided by baseline throughput). The experiments consist of the workload processing a batch of 400 inference predictions.
Performance gain due to algorithm choice
The choice of the algorithm for the application depends on several factors, including security, accuracy, and computing efficiency. For example, if little knowledge is known about the population mixture, then the z-test-inspired approach, i.e. the unsupervised method, can generalize better than the supervised approaches and can be less predisposed to overfitting; thus, providing less biased predictions. If statistically sufficient information about the population mixture is known, then parameter learning techniques allow more computationally efficient inference and can deliver more accurate predictions. In this regard, we assume the latter case, and analyze how much performance gain is expected if sufficient knowledge about the population mixture is known a priori. This means that we precompute the mean and variance for the z-test-inspired method, turning it into a supervised approach, such that it becomes more computationally efficient for requiring a lesser number of levels (multiplicative depth).
In Fig. 15, each bar represents the expected performance gain in a specific scenario (i.e., baseline as single core execution, vector instructions, multicore, and multicore plus vector instructions). In each scenario, we collect the performance numbers of all three algorithms. We then compute the normalized performance between each algorithm as the throughput ratio , where the workload A performed significantly better than the workload B; thus, the ratio corresponds to the performance gain of algorithm A over algorithm B (see more in Table 8). We say that the expected performance gain due to the choice of the algorithm, if an algorithm performs better than the other, is given by the geometric mean of all the ratios , where , under the constraints of a particular execution environment scenario. In short, we pick each algorithm’s throughput and calculate its relative performance gain over each worse counterpart, then we report the expected performance gain, shown in Fig. 15, as the geometric mean over all these ratios computed within a specific scenario. In Table 8, we can observe that in the multicore execution environment, the workloads z-test and cluster perform comparably, in which case one could choose either; therefore, we do not consider their ratios to compute the geometric mean of the performance gain. Additionally, the linear regression method notably benefits the most from the multicore execution environment for the simplicity of its set of instructions. Overall, the expected performance gain considering all scenarios due to algorithm choice is characterized by a geometric mean of 1.52x.
Fig. 15.
Performance gain due to algorithm choice
Table 8.
Throughput numbers used to compute the expected performance gains shown in Fig. 15. Raw throughput numbers to compute the ratios in this table are available in Tables 9 and 10
| (if throughput of A > throughput of B) | ||||||||||||
|---|---|---|---|---|---|---|---|---|---|---|---|---|
| Method | Single core | AVX512 | Multicore | AVX512 + multicore | ||||||||
| A / B | Unsupervised method | Clustering-based supervised method | Linear regression method | Unsupervised method | Clustering-based supervised method | Linear regression method | Unsupervised method | Clustering-based supervised method | Linear regression method | Unsupervised method | Clustering-based supervised method | Linear regression method |
| z-test (Unsupervised method) | - | 1.29 | - | - | 1.25 | - | - | 1.03 | - | - | 1.003 | - |
| cluster (Clustering-based supervised method) | - | - | - | - | - | - | - | - | - | - | - | - |
| lin reg (Linear regression method) | 1.38 | 1.79 | - | 1.55 | 1.94 | - | 1.44 | 1.49 | - | 1.61 | 1.6 | - |
Performance gain due to vector instructions
Intel® has actively participated in open-source code contributions to accelerate HE’s arithmetic computing kernels. Subproducts of these efforts are Intel® HE Acceleration Library (Intel® HEXL) and Intel® HE Acceleration Library for FPGAs (Intel® HEXL-FPGA). Several existing HE API libraries, such as Microsoft SEAL, incorporate Intel® HEXL kernels to accelerate their HE API calls on Intel platforms. These tools leverage AVX512 vector instructions offered as hardware features by Intel® Xeon® CPUs, e.g. Intel® Xeon® Platinum 8480+. The results are summarized in Fig. 16. Overall, the expected performance gain across all workloads has a geometric mean 2.06x. The throughput achieved when enabling execution with vector instructions is normalized against the baseline. It is worth noting that this gain is based on single-core execution. The performance impact of capitalizing the use of vector instructions when running with multiple working cores is discussed in “Performance gain due to vector instructions and parallel processing” section.
Fig. 16.
Performance gain due to vector instructions
Performance gain due to parallel processing
To increase throughput, executing on multiple cores is essential. We test the scalability of throughput for these workloads through data parallel processing under execution with multiple cores. Each core gets shards of the 400 inferences and other parallelizable areas of code are also executed with multiple threads, each pinned to a specific physical core. In Fig. 17, we show how latency scales with increasing number of cores for each workload. The final performance gain for each workload is the highest speed-up achieved with a specific number of cores, i.e. the optimal number of cores to run that workload. Typically, either 16 or 32 cores performs the best. The performance gain is the throughput using multiple cores normalized by the baseline (single core), as presented in Fig. 18. Overall, the expected performance gain across all scenarios owing to parallel processing using optimal number of cores amounts to geometric mean of 15.39x.
Fig. 17.
Latency with varying number of cores under the third scenario, i.e. multicore execution without the use of vectorized instructions
Fig. 18.
Performance gain due to parallel processing with multiple cores alone. The performance gain (normalized performance to baseline) is calculated as the throughput ratio between the execution using multiple cores over single core. The optimal number of cores for all the workloads is 32
Performance gain due to vector instructions and parallel processing
We also assess the performance gain achieved out of the combination of vector instructions and parallel processing using multiple cores. The performance analysis for this scenario can be summarized in Fig. 19 and follows the same methodology used to compute the performance gain for parallel processing only. On average, the expected performance gain is 18.59x. In Fig. 20, we observe that the latency of the workloads on multicore execution with AVX512 does not scale at equivalent rates as it does during multicore execution alone (see Fig. 17), despite displaying lower latency as reported in Table 10 in contrast to the values in Table 9. Note also that the clustering-based workload scales more effectively in both scenarios. This phenomenon can be attributed to the clustering-based method algorithm featuring more parallelism-friendly code sections compared to the other algorithms. Specifically, in the linear regression code, homomorphic rotations are executed sequentially due to data dependency, constituting a substantial portion of the computational time. In the case of the z-test-inspired workload, a significant portion of the algorithm code is non-parallelizable, particularly the linear approximation involving division by the mean.
Fig. 19.
Performance gain due to parallel processing with vectorized instructions and usage of multiple cores together. The performance gain (normalized performance to baseline) is calculated as the throughput ratio between the execution using vectorized instructions plus multiple cores over single core. The optimal number of cores for both z-test and linear reg workloads is 16 due to reaching AVX512 overhead, whereas for the cluster workload is 32, less affected by AVX512 overhead
Fig. 20.
Latency with varying number of cores under the fourth scenario, i.e. multicore execution with the use of vector instructions
Table 10.
Raw performance results with the use of vector instructions (AVX512) are presented beyond the scope of the iDASH competition. These experiments were conducted on a distinct hardware setup featuring a more contemporary processor, specifically, the Intel® Xeon® Platinum 8480+. This table illustrates the scaling of latency and throughput for the workloads as the number of working cores varies
| Latency (s) | Throughputa (q/s) | |||||||||||
|---|---|---|---|---|---|---|---|---|---|---|---|---|
| # Cores | # Cores | |||||||||||
| Method | 1 | 2 | 4 | 8 | 16 | 32 | 1 | 2 | 4 | 8 | 16 | 32 |
| “Unsupervised method” section | 10.01 | 5.99 | 3.7 | 1.74 | 1.21 | 1.3 | 40 | 66 | 108 | 229 | 308 | 329 |
| “Clustering-based supervised method” section | 12.52 | 7.32 | 4.41 | 2.02 | 1.29 | 1.21 | 32 | 54 | 90 | 197 | 310 | 330 |
| “Linear regression method” section | 6.44 | 4.08 | 2.66 | 1.08 | 0.75 | 0.85 | 62.1 | 98 | 150 | 370 | 472 | 531 |
Disclaimer: Performance varies by use, configuration and other factors. Learn more at www.Intel.com/PerformanceIndex.
aDecimal digits were truncated to leave only the integer part for a more conservative measurement
Table 9.
Raw performance results without the use of vectorized instructions (AVX512) are presented beyond the scope of the iDASH competition. These experiments were conducted on a distinct hardware setup featuring a more contemporary processor, specifically, the Intel® Xeon® Platinum 8480+. This table illustrates the scaling of latency and throughput for the workloads as the number of working cores varies
| Latency (s) | Throughputa (q/s) | |||||||||||
|---|---|---|---|---|---|---|---|---|---|---|---|---|
| # Cores | # Cores | |||||||||||
| Method | 1 | 2 | 4 | 8 | 16 | 32 | 1 | 2 | 4 | 8 | 16 | 32 |
| “Unsupervised method” section | 19.73 | 10.96 | 6.34 | 3.14 | 1.92 | 1.39 | 20 | 36 | 63 | 127 | 208 | 287 |
| “Clustering-based supervised method” section | 25.42 | 13.83 | 7.73 | 3.72 | 2.15 | 1.45 | 15 | 28 | 51 | 107 | 185 | 276 |
| “Linear regression method” section | 14.2 | 8.06 | 4.73 | 2.18 | 1.34 | 0.97 | 28 | 49 | 84 | 183 | 299 | 413 |
Disclaimer: Performance varies by use, configuration and other factors. Learn more at www.Intel.com/PerformanceIndex.
aDecimal digits were truncated to leave only the integer part for a more conservative measurement
Discussion
We propose three different methods to query kinship in genomic database. We submitted two of these methods, specifically the ones described in “Unsupervised method” and “Clustering-based supervised method” sections, as solutions to the iDASH 2023 Track 1 competition. The submissions served us as study cases to validate their robustness on unseen data. Accordingly, we put emphasis on low latency since it bears an exponential weight on the final score used to rank the submissions. To comply with these rules we also avoided any processing in the cleartext domain at runtime during inference on unseen data. Our solutions improve the computing latency by three orders of magnitude over the naive solution. The performance results of the submissions to the iDASH 2023 competition are summarized in Table 6. We placed 3rd with the supervised solution described in “Clustering-based supervised method” section. They also guarantee 128-bit security (through a lattice cryptography scheme), ensuring genomic data privacy protection during computation of the predictions. This directly addresses the weakness of the other methodologies of privacy protection discussed in “Current security and privacy protection practices in genomic data sharing” section, in which the private data can still leak or become unprotected.
Although our methods are strongly influenced by the iDASH2023 competition challenge, a broader study on performance and design was carried out in “Comparative performance analysis” section, allowing us to expand the scope of our findings. The proposed methods are sufficiently functional, adaptable and practically feasible to address secure computation in genomics applications related to the FGG use case. Their applicability goes beyond what it has been demonstrated in this work. For example, changing the comparison reference from the database mean to an individual genome leads to expand the scope of application to predict exact or partial matches between pairs of genomes and to estimate their familial relationship (step 5 in the FGG task) given the predicted score. Generally, we also note that considerable streamlining of the prediction algorithm and reformulation of its objectives are imperative for rendering it amenable to Homomorphic Encryption while ensuring computational efficiency. In scenarios where the domain is well-established and constrained, supervised solutions prove to be the more efficient and precise choice, particularly, with admixture populations. Conversely, unsupervised solutions, although entailing greater computational cost and higher number of multiplicative levels, tend to exhibit superior generalization capabilities when the population statistics is uncertain.
Conclusions
The obtained results demonstrate that privacy-preserving solutions based on homomorphic encryption can be computationally practical to protect genomic privacy during the stage of filtering candidate matches for further genealogy study in Forensic Genetic Genealogy (FGG). The screening of the searchable databases can happen in seconds and with high accuracy; thus, providing the ability to expedite the identification process of unknown suspects by narrowing down the number of databases in which to perform genealogy analysis without compromising genomic privacy.
Acknowledgements
We would like to thank Duhyeong Kim and Kylan Race for providing feedback on the revised versions of this manuscript.
Authors' contributions
All authors, namely, Fillipe D. M. de Souza, Hubert de Lassus, and Ro Cammarota, contributed equally for the completion and review of the manuscript.
Funding
Not applicable.
Data availability
The dataset is publicly available upon request from the organizers of the iDASH 2023 challenge at http://www.humangenomeprivacy.org/2023/contact.html. Raw data from experiments are available upon request by emailing to fillipe.souza@intel.com. Other relevant data is provided within the manuscript.
Code availability
Code is available at https://github.com/IntelLabs/secure-genome-relative-detection.
Declarations
Ethics approval and consent to participate
Not applicable.
Consent for publication
Not applicable.
Competing interests
The authors declare no competing interests.
Footnotes
Publisher's Note
Springer Nature remains neutral with regard to jurisdictional claims in published maps and institutional affiliations.
References
- 1.Clayton EW, Evans BJ, Hazel JW, Rothstein MA. The law of genetic privacy: applications, implications, and limitations. J Law Biosci. 2019;6(1):1–36. [DOI] [PMC free article] [PubMed] [Google Scholar]
- 2.Glynn CL. Bridging disciplines to form a new one: the emergence of forensic genetic genealogy. Genes. 2022;13(8):1381. [DOI] [PMC free article] [PubMed] [Google Scholar]
- 3.GEDmatchPRO. GEDmatch PRO. 2023. https://pro.gedmatch.com/user/login?destination. Accessed 29 Dec 2023
- 4.FamilyTreeDNA. DNA Testing for Ancestry and Genealogy | Family Tree DNA. 2023. https://www.familytreedna.com/. Accessed 29 Dec 2023
- 5.DNASolves. DNASolves. 2023. https://dnasolves.com/. Accessed 29 Dec 2023.
- 6.Wolf LE, Brown EF, Kerr R, Razick G, Tanner G, Duvall B, et al. The web of legal protections for participants in genomic research. Health Matrix (Cleveland, Ohio: 1991). 2019;29(1). [PMC free article] [PubMed]
- 7.American Bar Association A. A call for judicial oversight of DNA analysis to protect privacy. 2023. https://www.americanbar.org/news/abanews/aba-news-archives/2023/08/call-for-judicial-oversight-to-protect-privacy/. Accessed 4 Dec 2023.
- 8.Homer N, Szelinger S, Redman M, Duggan D, Tembe W, Muehling J, et al. Resolving individuals contributing trace amounts of DNA to highly complex mixtures using high-density SNP genotyping microarrays. PLoS Genet. 2008;4(8). 10.1371/journal.pgen.1000167. [DOI] [PMC free article] [PubMed]
- 9.Jin Y, Schäffer AA, Sherry ST, Feolo M. Quickly identifying identical and closely related subjects in large databases using genotype data. PLoS ONE. 2017;12(6):e0179106. [DOI] [PMC free article] [PubMed] [Google Scholar]
- 10.Manichaikul A, Mychaleckyj JC, Rich SS, Daly K, Sale M, Chen WM. Robust relationship inference in genome-wide association studies. Bioinformatics. 2010;26(22):2867–73. 10.1093/bioinformatics/btq559. [DOI] [PMC free article] [PubMed] [Google Scholar]
- 11.Thornton T, Tang H, Hoffmann TJ, Ochs-Balcom HM, Caan BJ, Risch N. Estimating kinship in admixed populations. Am J Hum Genet. 2012;91(1):122–38. [DOI] [PMC free article] [PubMed] [Google Scholar]
- 12.Wang S, Miran-Kim, Wentao-Li, Jiang X, Chen H, Harmanci A. Privacy-aware estimation of relatedness in admixed populations. Brief Bioinform. 2022;23(6):1–16. 10.1093/bib/bbac473. [DOI] [PMC free article] [PubMed]
- 13.Dou J, Sun B, Sim X, Hughes JD, Reilly DF, Tai ES, et al. Estimation of kinship coefficient in structured and admixed populations using sparse sequencing data. PLoS Genet. 2017;13(9):e1007021. [DOI] [PMC free article] [PubMed] [Google Scholar]
- 14.Chen J, Miao W, Wu W, Yang L, Yuan H. Secure Relative Detection in (Forensic) Database with Homomorphic Encryption. In: International Symposium on Bioinformatics Research and Applications. Springer; 2024. pp. 410–422.
- 15.Kale G, Ayday E, Tastan O. A utility maximizing and privacy preserving approach for protecting kinship in genomic databases. Bioinformatics. 2018;34(2):181–9. [DOI] [PubMed] [Google Scholar]
- 16.De Cristofaro E, Liang K, Zhang Y. Privacy-preserving genetic relatedness test. 2016. arXiv preprint arXiv:1611.03006.
- 17.Hormozdiari F, Joo JWJ, Wadia A, Guan F, Ostrosky R, Sahai A, et al. Privacy preserving protocol for detecting genetic relatives using rare variants. Bioinformatics. 2014;30(12):i204–11. [DOI] [PMC free article] [PubMed] [Google Scholar]
- 18.Knoppers B, Joly Y. Introduction: the why and whither of genomic data sharing. Springer; 2018. [DOI] [PubMed]
- 19.Grossman RL. Data lakes, clouds, and commons: a review of platforms for analyzing and sharing genomic data. Trends Genet. 2019;35(3):223–34. [DOI] [PMC free article] [PubMed] [Google Scholar]
- 20.Jensen MA, Ferretti V, Grossman RL, Staudt LM. The NCI Genomic Data Commons as an engine for precision medicine. Blood J Am Soc Hematol. 2017;130(4):453–9. [DOI] [PMC free article] [PubMed] [Google Scholar]
- 21.Alsaffar MM, Hasan M, McStay GP, Sedky M. Digital dna lifecycle security and privacy: an overview. Brief Bioinform. 2022;23(2):bbab607. [DOI] [PubMed]
- 22.Zhang Z, Hernandez K, Savage J, Li S, Miller D, Agrawal S, et al. Uniform genomic data analysis in the NCI Genomic Data Commons. Nat Commun. 2021;12(1):1226. [DOI] [PMC free article] [PubMed] [Google Scholar]
- 23.Grossman RL, Heath AP, Ferretti V, Varmus HE, Lowy DR, Kibbe WA, et al. Toward a shared vision for cancer genomic data. N Engl J Med. 2016;375(12):1109–12. [DOI] [PMC free article] [PubMed] [Google Scholar]
- 24.NIH-GDS-Policy. NIH Security Best Practices for Controlled-Access Data Subject to the NIH Genomic Data Sharing (GDS) Policy. 2021. https://sharing.nih.gov/sites/default/files/flmngr/NIH_Best_Practices_for_Controlled-Access_Data_Subject_to_the_NIH_GDS_Policy.pdf. Accessed 1 July 2024.
- 25.Freeberg MA, Fromont LA, D’Altri T, Romero AF, Ciges JI, Jene A, et al. The European genome-phenome archive in 2021. Nucleic Acids Res. 2022;50(D1):D980–7. [DOI] [PMC free article] [PubMed] [Google Scholar]
- 26.Senf A, Davies R, Haziza F, Marshall J, Troncoso-Pastoriza J, Hofmann O, et al. Crypt4GH: a file format standard enabling native access to encrypted data. Bioinformatics. 2021;37(17):2753–4. [DOI] [PMC free article] [PubMed] [Google Scholar]
- 27.Hekel R, Budis J, Kucharik M, Radvanszky J, Pös Z, Szemes T. Privacy-preserving storage of sequenced genomic data. BMC Genomics. 2021;22:1–13. [DOI] [PMC free article] [PubMed] [Google Scholar]
- 28.Gymrek M, McGuire AL, Golan D, Halperin E, Erlich Y. Identifying personal genomes by surname inference. Science. 2013;339(6117):321–4. [DOI] [PubMed] [Google Scholar]
- 29.Das A. Approaches in Genomic Privacy [Bachelor’s Thesis]. Brown University; 2018.
- 30.Rivest RL, Shamir A, Adleman L. A method for obtaining digital signatures and public-key cryptosystems. Commun ACM. 1978;21(2):120–6. [Google Scholar]
- 31.Rijmen V, Daemen J. Advanced encryption standard. Proceedings of federal information processing standards publications, vol. 19. National Institute of Standards and Technology; 2001. p. 22.
- 32.Huang Z, Ayday E, Lin H, Aiyar RS, Molyneaux A, Xu Z, et al. A privacy-preserving solution for compressed storage and selective retrieval of genomic data. Genome Res. 2016;26(12):1687–96. [DOI] [PMC free article] [PubMed] [Google Scholar]
- 33.Brakerski Z, Gentry C, Vaikuntanathan V. (Leveled) fully homomorphic encryption without bootstrapping. ACM Trans Comput Theory. 2014;6(3):1–36. [Google Scholar]
- 34.Cheon JH, Kim A, Kim M, Song Y. Homomorphic encryption for arithmetic of approximate numbers. In: Advances in Cryptology–ASIACRYPT 2017: 23rd International Conference on the Theory and Applications of Cryptology and Information Security, Hong Kong, China, December 3-7, 2017, Proceedings, Part I 23. Springer; 2017. pp. 409–437.
- 35.Gentry C. Fully homomorphic encryption using ideal lattices. In: Proceedings of the forty-first annual ACM symposium on Theory of computing. 2009. pp. 169–178.
- 36.Regev O. On lattices, learning with errors, random linear codes and cryptography. J ACM. 2009;51(6):899–942. [Google Scholar]
- 37.Fan J, Vercauteren F. Somewhat practical fully homomorphic encryption. Cryptol ePrint Arch. 2012.
- 38.Purcell S, Neale B, Todd-Brown K, Thomas L, Ferreira MAR, Bender D, et al. PLINK: a tool set for whole-genome association and population-based linkage analyses. Am J Hum Genet. 2007;81(3):559–75. 10.1086/519795. [DOI] [PMC free article] [PubMed] [Google Scholar]
- 39.Yang J, Lee SH, Goddard ME, Visscher PM. GCTA: a tool for genome-wide complex trait analysis. Am J Hum Genet. 2010;88(1):76–82. [DOI] [PMC free article] [PubMed] [Google Scholar]
- 40.Conomos MP, Reiner AP, Weir BS, Thornton TA. Model-free Estimation of Recent Genetic Relatedness. Am J Hum Genet. 2016;98(1):127–48. [DOI] [PMC free article] [PubMed] [Google Scholar]
- 41.Moltke I, Albrechtsen A. RelateAdmix: a software tool for estimating relatedness between admixed individuals. Bioinformatics. 2013;30(7):1027–8. [DOI] [PubMed] [Google Scholar]
- 42.Huff CD, Witherspoon DJ, Simonson TS, Xing J, Watkins WS, Zhang Y, et al. Maximum-likelihood estimation of recent shared ancestry (ERSA). Genome Res. 2011;21(5):768–74. [DOI] [PMC free article] [PubMed] [Google Scholar]
- 43.Naseri A, Shi J, Lin X, Zhang S, Zhi D. RAFFI: Accurate and fast familial relationship inference in large scale biobank studies using RaPID. PLoS Genet. 2021;17(1):e1009315. 10.1371/journal.pgen.1009315. [DOI] [PMC free article] [PubMed] [Google Scholar]
- 44.Zhou Y, Browning SR, Browning BL. IBDkin: fast estimation of kinship coefficients from identity by descent segments. Bioinformatics. 2020;36(16):4519–20. 10.1093/bioinformatics/btaa569. [DOI] [PMC free article] [PubMed] [Google Scholar]
- 45.Nøhr AK, Hanghøj K, Garcia-Erill G, Li Z, Moltke I, Albrechtsen A. NGSremix: a software tool for estimating pairwise relatedness between admixed individuals from next-generation sequencing data. G3 (Bethesda). 2021;11(8). 10.1093/g3journal/jkab174. [DOI] [PMC free article] [PubMed]
- 46.Wang C, Zhan X, Liang L, Abecasis GR, Lin X. Improved ancestry estimation for both genotyping and sequencing data using projection procrustes analysis and genotype imputation. Am J Hum Genet. 2015;96(6):926–37. 10.1016/j.ajhg.2015.04.018. [DOI] [PMC free article] [PubMed] [Google Scholar]
- 47.Smith J, Qiao Y, Williams AL. Evaluating the utility of identity-by-descent segment numbers for relatedness inference via information theory and classification. G3 (Bethesda). 2022;12(6). [DOI] [PMC free article] [PubMed]
- 48.Seidman DN, Shenoy SA, Kim M, Babu R, Woods IG, Dyer TD, et al. Rapid, Phase-free Detection of Long Identity-by-Descent Segments Enables Effective Relationship Classification. Am J Hum Genet. 2020;106(4):453–66. [DOI] [PMC free article] [PubMed] [Google Scholar]
- 49.Bishop DT, Williamson JA. The power of identity-by-state methods for linkage analysis. Am J Hum Genet. 1990;46(2):254–65. [PMC free article] [PubMed] [Google Scholar]
- 50.Morimoto C, Manabe S, Kawaguchi T, Kawai C, Fujimoto S, Hamano Y, et al. Pairwise Kinship Analysis by the Index of Chromosome Sharing Using High-Density Single Nucleotide Polymorphisms. PLoS ONE. 2016;11(7):e0160287. 10.1371/journal.pone.0160287. [DOI] [PMC free article] [PubMed] [Google Scholar]
- 51.Ramstetter MD, Dyer† TD, Lehman DM, Curran JE, Duggirala R, Blangero J, et al. Benchmarking relatedness inference methods with genome-wide data from thousands of relatives. Genetics. 2017. 10.1534/genetics.117.1122. [DOI] [PMC free article] [PubMed]
- 52.Pradel G, Mitchell C. Privacy-preserving biometric matching using homomorphic encryption. In: 2021 IEEE 20th International Conference on Trust, Security and Privacy in Computing and Communications (TrustCom). IEEE; 2021. pp. 494–505. arXiv:2111.12372.
- 53.EdalatNejad K, Raynal M, Lueks W, Troncoso C. Private Collection Matching Protocols. In: Proceedings on Privacy Enhancing Technologies (In Press). PoPETs; 2023. https://petsymposium.org/popets/2023/popets-2023-0091.pdf.
- 54.Çetin GS, Chen H, Laine K, Lauter K, Rindal P, Xia Y. Private queries on encrypted genomic data. BMC Med Genomics. 2017;10(Suppl2)(45). 10.1186/s12920-017-0276-z. [DOI] [PMC free article] [PubMed]
- 55.Fan J, Vercauteren F. Somewhat Practical Fully Homomorphic Encryption. IACR Cryptol ePrint Arch. 2012;2012:144. https://api.semanticscholar.org/CorpusID:1467571.
- 56.Chen H, Laine K, Rindal P. Fast Private Set Intersection from Homomorphic Encryption. In: Proceedings of the 2017 ACM SIGSAC Conference on Computer and Communications Security. CCS ’17. New York, NY, USA: Association for Computing Machinery. 2017. pp. 1243–1255. 10.1145/3133956.3134061.
- 57.Bao F, Deng RH, Ding X, Yang Y. Private Query on Encrypted Data in Multi-user Settings. In: Chen L, Mu Y, Susilo W, editors. Information Security Practice and Experience. Berlin, Heidelberg: Springer Berlin Heidelberg; 2008. pp. 71–85. 10.1007/978-3-540-79104-1_6.
- 58.Saha TK, Koshiba T. Efficient Private Conjunctive Query Protocol Over Encrypted Data. Cryptography. 2021;5(1):2. 10.3390/cryptography5010002. [Google Scholar]
- 59.Tan BHM, Lee HT, Wang H, Ren S, Aung KMM. Efficient Private Comparison Queries Over Encrypted Databases Using Fully Homomorphic Encryption With Finite Fields. IEEE Trans Dependable Secure Comput. 2021;18(6):2861–74. 10.1109/TDSC.2020.2967740. [Google Scholar]
- 60.Boneh D, Waters B. Conjunctive, subset and range queries on encrypted data. 2007. https://crypto.stanford.edu/~dabo/pubs/papers/search.pdf. Accessed 7 Oct 2023.
- 61.Chen F, Dow M, Ding S, Lu Y, Jiang X, Tang H, et al. PREMIX: PRivacy-preserving EstiMation of Individual admiXture. AMIA Annu Symp Proc. 2017;2016:1747–55. [PMC free article] [PubMed] [Google Scholar]
- 62.He D, Furlotte NA, Hormozdiari F, Joo JWJ, Wadia A, Ostrovsky R, et al. Identifying genetic relatives without compromising privacy. Genome Res. 2014;24(4):664–72. [DOI] [PMC free article] [PubMed] [Google Scholar]
- 63.Robinson M, Glusman G. Genotype Fingerprints Enable Fast and Private Comparison of Genetic Testing Results for Research and Direct-to-Consumer Applications. Genes (Basel). 2018;9(10). [DOI] [PMC free article] [PubMed]
- 64.Dervishi L, Wang X, Li W, Halimi A, Vaidya J, Jiang X, et al. Facilitating Federated Genomic Data Analysis by Identifying Record Correlations while Ensuring Privacy. AMIA Annu Symp Proc. 2023;2022:395–404. arXiv:2203.05664. [PMC free article] [PubMed]
- 65.Sustronk JJ. In: Analysing Cyber Threat Intelligence Data Using Fully Homomorphic Encryption. Drienerlolaan 5, 7522 NB Enschede, Netherlands: University of Twente; 2022. https://essay.utwente.nl/93355/1/Sustronk_MA_EEMCS.pdf.
- 66.Cheon JH, Kim D, Park JH. Towards a practical cluster analysis over encrypted data. In: International Conference on Selected Areas in Cryptography. Springer; 2019. pp. 227–249.
- 67.United Nations DoE, Social Affairs PD. World Population Prospects 2022, Summary of Results. 2022. https://www.un.org/development/desa/pd/sites/www.un.org.development.desa.pd/files/wpp2022_summary_of_results.pdf.
- 68.Panda S. Polynomial approximation of inverse sqrt function for fhe. In: International Symposium on Cyber Security, Cryptology, and Machine Learning. Springer; 2022. pp. 366–376.
- 69.Albrecht M, Chase M, Chen H, Ding J, Goldwasser S, Gorbunov S, et al. In: Lauter K, Dai W, Laine K, editors. Homomorphic Encryption Standard. Cham: Springer International Publishing; 2021. pp. 31–62. 10.1007/978-3-030-77287-1_2.
- 70.Jin X, Han J. In: Sammut C, Webb GI, editors. K-Means Clustering. Boston: Springer US; 2010. pp. 563–564.10.1007/978-0-387-30164-8_425.
- 71.Aziz MMA, Sadat MN, Alhadidi D, Wang S, Jiang X, Brown CL, et al. Privacy-preserving techniques of genomic data—a survey. Brief Bioinform. 2019;20(3):887–95. [DOI] [PMC free article] [PubMed] [Google Scholar]
- 72.Kim A, Song Y, Kim M, Lee K, Cheon JH. Logistic regression model training based on the approximate homomorphic encryption. BMC Med Genomics. 2018;11(4):23–31. [DOI] [PMC free article] [PubMed] [Google Scholar]
- 73.Kim M, Song Y, Li B, Micciancio D. Semi-parallel logistic regression for GWAS on encrypted data. BMC Med Genomics. 2020;13:1–13. [DOI] [PMC free article] [PubMed] [Google Scholar]
- 74.Blatt M, Gusev A, Polyakov Y, Rohloff K, Vaikuntanathan V. Optimized homomorphic encryption solution for secure genome-wide association studies. BMC Med Genomics. 2020;13(7):1–13. [DOI] [PMC free article] [PubMed] [Google Scholar]
- 75.De Cock M, Dowsley R, Nascimento AC, Railsback D, Shen J, Todoki A. High performance logistic regression for privacy-preserving genome analysis. BMC Med Genomics. 2021;14:1–18. [DOI] [PMC free article] [PubMed] [Google Scholar]
- 76.Zhou J, Lei B, Lang H, Panaousis E, Liang K, Xiang J. Secure genotype imputation using homomorphic encryption. J Inf Secur Appl. 2023;72:103386. [Google Scholar]
- 77.Gascón A, Schoppmann P, Balle B, Raykova M, Doerner J, Zahur S, et al. Privacy-preserving distributed linear regression on high-dimensional data. Cryptol ePrint Archive. 2016.
- 78.Battey HS, Reid N. On inference in high-dimensional regression. J R Stat Soc Ser B Stat Methodol. 2023;85(1):149–75. [Google Scholar]
- 79.Nocedal J, Wright SJ. Numerical optimization. Springer; 1999.
- 80.Nikolaenko V, Weinsberg U, Ioannidis S, Joye M, Boneh D, Taft N, Privacy-preserving ridge regression on hundreds of millions of records. In: 2013 IEEE symposium on security and privacy. IEEE; 2013. pp. 334–48.
- 81.Microsoft SEAL (release 4.0). Redmond: Microsoft Research; 2022. https://github.com/Microsoft/SEAL.
- 82.Boemer F, Kim S, Seifu G, de Souza FD, Gopal V, et al. Intel HEXL (release 1.2). 2021. https://github.com/intel/hexl.
Associated Data
This section collects any data citations, data availability statements, or supplementary materials included in this article.
Data Availability Statement
The dataset is publicly available upon request from the organizers of the iDASH 2023 challenge at http://www.humangenomeprivacy.org/2023/contact.html. Raw data from experiments are available upon request by emailing to fillipe.souza@intel.com. Other relevant data is provided within the manuscript.
Code is available at https://github.com/IntelLabs/secure-genome-relative-detection.


