Abstract
Cells experience continuous transformation under both physiological and pathological circumstances. Single-cell RNA sequencing (scRNA-seq) is competent in disclosing the disparities of cells; nevertheless, it poses challenges in linking the individual cell state at distinct time points. Although computational approaches based on scRNA-seq data have been put forward for trajectory analysis, the result is based on assumptions and fails to reflect the actual states. Consequently, it is necessary to incorporate a “time anchor” into the scRNA-seq library for the temporal documentation of the dynamic expression pattern. This review comprehensively overviews the time-resolved single-cell transcriptomic sequencing methodologies and applications. As scRNA-seq functions as the basis for profiling single-cell expression patterns, the review initially introduces various scRNA-seq approaches. Subsequently, the review focuses on the different experimental strategies for introducing a “time anchor” to scRNA-seq, highlighting their principles, strengths, weaknesses, and comparing their adaptation in various scenarios. Next, it provides a brief summary of applications in immunity response, cancer progression, and embryo development. Finally, the review concludes with a forward-looking perspective on future advancements in time-resolved single-cell transcriptomic sequencing.
Single-cell dynamics study enables to reveal cell heterogeneity in fundamental mechanisms governing cell behavior. This review provides an overview of the time-resolved single-cell transcriptomic sequencing methodologies and applications.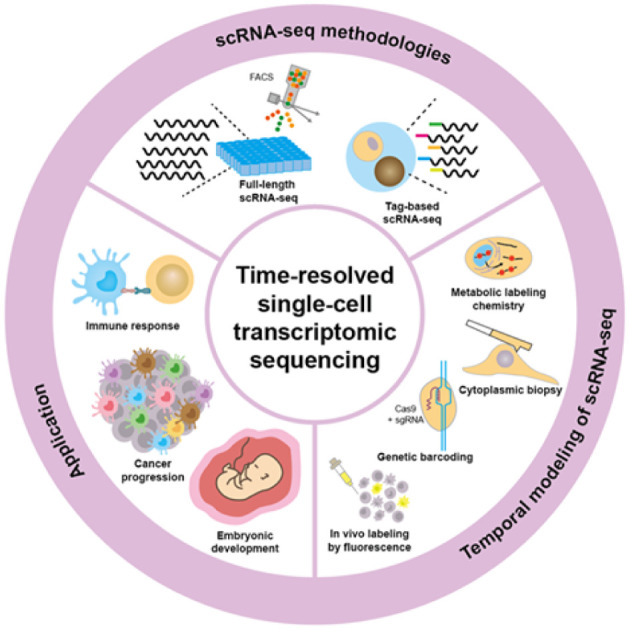
1. Introduction
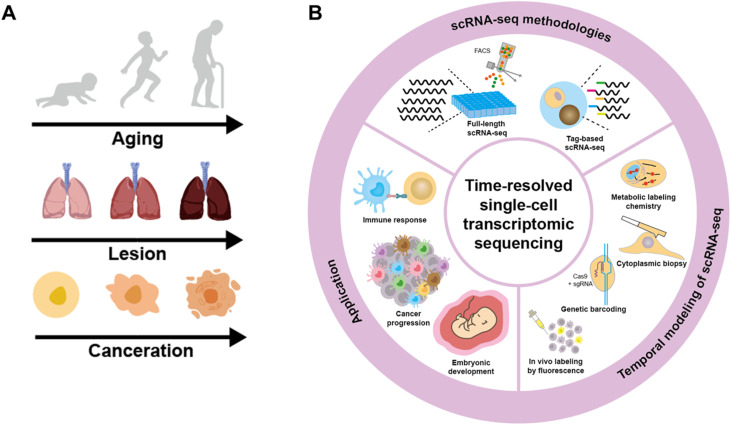
Cells experience continuous transformations due to internal processes and external stimuli under physiological and pathological conditions.1–21 These dynamic alterations are determined by a complex interplay of molecular signaling pathways, gene expression regulation, and cellular responses to environmental cues. Understanding and investigating these dynamics is crucial for gaining insights into the fundamental mechanisms that govern cell behavior and drive subsequent biological progress at multiple levels, including the tissue, organ, and individual levels (Fig. 1A).22–25
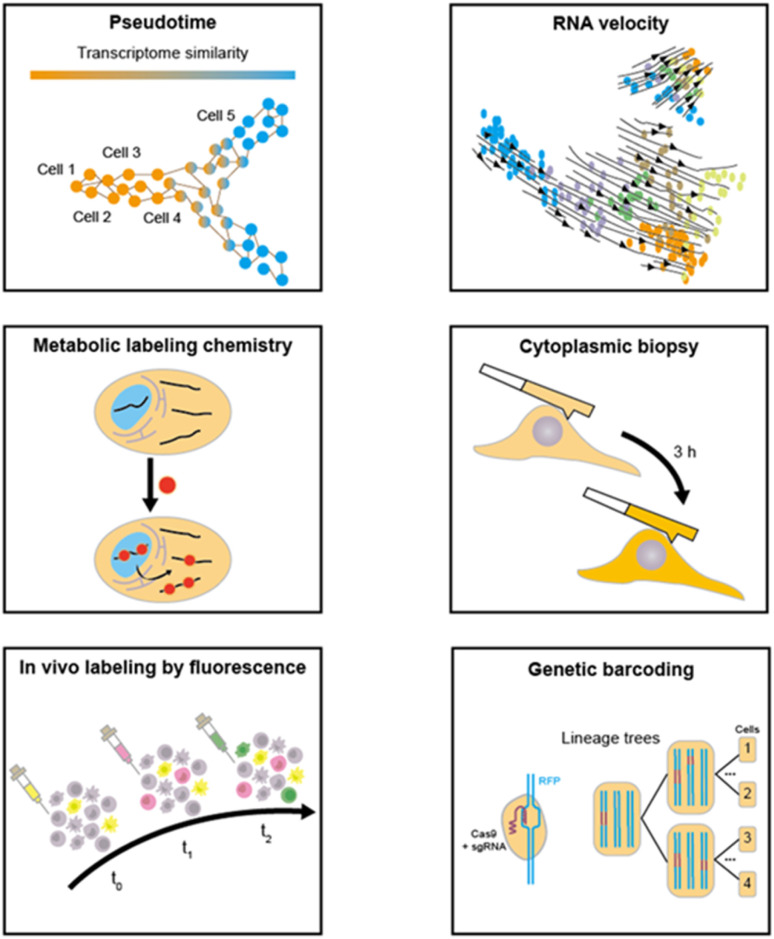
Fig. 1. (A) The dynamic alterations in the biological progress at the cell, organ and individual level. (B) Overview of time-resolved single-cell transcriptomic sequencing including approaches for scRNA-seq, strategies for providing temporal modeling of scRNA-seq and the applications for cell dynamics analysis in different fields.
Given that heterogeneity is widely prevalent among diverse cells, it is essential to investigate the cell transition at the single-cell level to disclose the disparity in cell dynamics. Over the past few decades, scRNA-seq has been evolving rapidly for enhanced gene detection capacity, increased cell processing throughput, and accessible commercial assays, thanks to the advent of next-generation sequencing, the progress of molecular biology techniques, and the introduction of microfluidic systems. scRNA-seq enables the profiling of gene expression patterns, the discrimination of cell subtypes, and the identification of rare cells, and has been extensively applied in various fields for basic biological and clinical research.26–30 However, in contrast to bulk analysis that can correlate the expression of genes at one time point with their expression in the previous time point, scRNA-seq has difficulty linking individual cells between two consecutive time points as scRNA-seq methods require the lysis of single cells and thus can only detect the cell state at one time point.31,32
To address this issue, several computational approaches have been put forward to infer the dynamics based on the existing scRNA-seq data. These computational approaches,33–35 typically encompassing pseudotime36 and RNA velocity,37 are predicated on the assumption that the collective states of the cell population can represent the states of a single cell throughout a biological process. Pseudotime orders single cells based on their transcriptome similarity and infers continuous trajectories to disclose biological progress. Nevertheless, the pseudotime ordering fails to provide genuine and precise dynamics and cannot address the directionality of complex biological processes. RNA velocity depicts the cell state in accordance with the time derivatives of unspliced and spliced RNA abundance, and predicts the future states through extrapolation, but this method is more applicable to the steady-state model. As a consequence, the challenge still persists in how to experimentally introduce a “time anchor” to scRNA-seq library and record the actual cell dynamics.
In this review, a comprehensive discussion on time-resolved single-cell transcriptomic sequencing is provided (Fig. 1B). As scRNA-seq serves as the foundation for profiling single-cell expression patterns, we firstly introduce diverse scRNA-seq approaches. Subsequently, we concentrate on the different experimental strategies for introducing a “time anchor” to the scRNA-seq library, highlighting their principles, strengths, weaknesses, and comparing their adaptation in various scenarios. Next, a brief overview of studies in immunity response, cancer progression, and embryo development through time-resolved scRNA-seq is discussed. Finally, we conclude with a forward-looking perspective on future advancements in time-resolved single-cell transcriptomic sequencing.
2. The foundation: scRNA-seq methodologies
Tang 2009 as the first established scRNA-seq has opened the field of single-cell sequencing.38 After that, scRNA-seq has experienced tremendous advances towards higher sensitivity, coverage and throughput.24 A typical scRNA-seq contains single-cell isolation, single-cell lysis, reverse transcription (RT), cDNA amplification and library preparation for sequencing.39–41 Relevant protocols are classified into two main categories: full-length scRNA-seq library construction and tag-based scRNA-seq library construction. Full-length scRNA-seq enables the comprehensive exploration of the entire transcriptome, offering potential for thorough investigation of RNA splicing events, fusion genes and alternative transcript isoforms. Tag-based scRNA-seq is devised to provide a global gene expression pattern for cell atlas profiling. This approach typically attaches cell barcodes to the 5′ or 3′ end of transcripts, thereby prioritizing the capture of one short end of the transcripts containing barcode sequence from a large number of cells in a single library preparation. The introduction of unique molecular identifiers (UMIs) also enables the digital counting of transcripts correcting polymerase chain reaction (PCR) bias during cDNA amplification. However, tag-based scRNA-seq sacrifices full-length coverage and cannot be employed for isoform identification or splicing. It is noted that full-length and tag-based scRNA-seq methodologies are in the stage of mutual integration and concurrent development, making it difficult to distinguish them completely.
2.1. Full-length scRNA-seq library construction
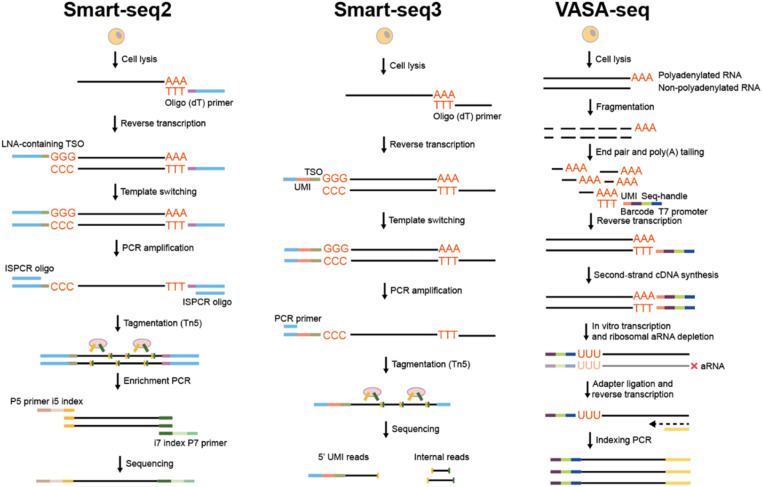
Smart-seq2,42 the most prevalently adopted full-length single-cell RNA sequencing approach, employs Moloney murine leukemia virus (M-MLV) reverse transcriptase featuring template-switching and terminal transferase activity (Fig. 2A). Subsequent to the RT of mRNA into first-strand cDNA through oligo d(T) priming, M-MLV adds three to five non-templated cytosines to the 3′ end of the cDNA. Thereupon, a template switching oligo (TSO) composed of two riboguanosines and a locked nucleic acid (LNA) guanylate hybridizes with the non-templated cytosines, facilitating the template switching from mRNA to TSO for complementary sequence synthesis. The introduction of a PCR primer having an identical sequence to that of TSO and oligo(dT) primers enables the full-length amplification of cDNA with a high coverage. Furthermore, Smart-seq2 based on microfluidics was proposed to automate the procedures and facilitate highly efficient single-cell capture via the microfluidic structure.43–45
Fig. 2. Full-length scRNA-seq methods. (A) The flow chart of Smart-seq2 sequencing library preparation. (B) The flow chart of Smart-seq3 sequencing library preparation. (C) The flow chart of VASA-seq sequencing library preparation.
Inspired by Smart-seq2, Smart-seq3 (ref. 46) was developed through the combination of full-length transcriptome coverage and 5′-UMI RNA counting, enabling the computational reconstruction of numerous RNA molecules for each individual cell (Fig. 2B). A Tn5 motif, a tag sequence, and a UMI are incorporated into TSO. The UMI enables the digital counting of transcripts, while the tag sequence can distinguish UMI-containing reads from internal reads. Then diverse 3′ gene-body fragments incorporating allele/isoform information are assigned to a specific molecule based on the 5′ tag, thereby allowing for the counting of RNAs at allele and isoform resolution. In contrast to Smart-seq2, Smart-seq3 significantly enhances the sensitivity, typically detecting thousands of transcripts more per cell. However, Smart-seq3 is time-consuming and calls for meticulous fine-tuning to make an appropriate balance between internal and UMI-containing reads.
Smart-seq3xpress47 streamlines the Smart-seq3 protocol, enabling the generation of sequencing-ready libraries within a single working day and enhancing the throughput of cell processing. Furthermore, it miniaturizes the requisite reaction volume of Smart-seq3 by tenfold by operating in nanoliter volumes covered with an inert hydrophobic substance. Furthermore, Hahaut et al. developed FLASH-seq48 that can reduce hands-on time to 4.5 hours. FLASH-seq integrates RT and cDNA pre-amplification, substituting the Superscript II reverse transcriptase with the more processive Superscript IV (SSRTIV) and shortening the RT reaction time. FLASH-seq has higher gene detection capabilities with lower cost (<$1 per cell), enabling the detection of a more diverse range of isoforms and genes, especially protein-coding and longer ones. Nevertheless, due to the brevity of the read length of scRNA-seq on next-generation sequencing (NGS) platforms, numerous problems remain unsolved, such as the restricted detection for splicing isoforms.
The further advancement of long-read RNA sequencing, known as third-generation sequencing (TGS), can be employed to generate full-length cDNA transcripts with the fewest false-positive splicing sites and capture the extensive diversity of transcript isoforms. Fan et al. proposed a novel scRNA-seq technology named SCAN-seq49 (single-cell amplification and sequencing of full-RNAs by nanopore platform) based on TGS. SCAN-seq demonstrates excellent sensitivity and precision similar to scRNA-seq methods based on NGS platforms. Furthermore, it can capture thousands of unannotated transcripts of diverse types and precisely investigate more than 10 000 splice isoforms in each individual cell. To further improve the cell throughput and reduce the cost, the same group developed SCAN-seq2 50 through the combination of cell barcoding and tube barcoding strategies, enabling the sequencing of up to 3072 single cells within one sequencing run. Despite the advancements in cell throughput and gene detection capabilities, these approaches are intended to amplify the terminals of polyadenylated transcripts, disregarding other potentially relevant RNA species lacking a polyadenylated tail.
To address these issues, Salmen et al. developed VASA-seq51 (vast transcriptome analysis of single cells by dA-tailing) for detecting the total transcriptome in single cells through fragmenting and tailing all RNA molecules, thereby allowing diverse types of cDNA to be synthesised from barcoded oligo(dT) primers (Fig. 2C). Additionally, a unique fragment identifier (UFI) enables the absolute counting of molecules with strand specificity. The cDNA carrying barcodes is amplified by means of in vitro transcription, followed by the subsequent elimination of the amplified ribosomal RNA (rRNA). After addition of the adaptor and RT, libraries are amplified with dual-indexed PCR primers for sequencing preparation. VASA-seq is compatible not only with plate-based formats but also with droplet microfluidics, therefore featuring a high throughput of cell processing (exceeding 30 000 cells) and low cost (at $ 0.11 per cell). Moreover, VASA-drop exhibits a higher sensitivity than Smart-seq3 and 10× chromium (introduced in Section 2.2.2), indicating its superior performance in terms of sensitivity, throughput, and full-length coverage. However, VASA-seq still confronts several challenges, such as optimizing steps for ribosomal RNA depletion, developing specialized data analysis pipelines and integrating with other datasets.
Overall, the full-length scRNA-seq strategy exhibits the superiority of a high gene detection rate and gene coverage. It not only measures the expression patterns but also detects RNA splicing events, fusion genes, and alternative transcript isoforms. The previous full-length scRNA-seq methods, such as Smart-seq2, prepares the library of single cells in each tube/well, which is labor-intensive and costly. The emergence of Smart-seq3, FLASH-seq, and VASA-seq makes the full-length scRNA-seq compatible with tag addition, enhancing the analysis throughput and reducing the cost. Moreover, the capacity to profile the total RNAs rather than merely poly(A)-tail mRNAs enables the comprehensive detection of transcriptome. It is expected to further integrate other omics sequencing with total RNA profiling for in-depth exploration of gene inheritance and expression.
2.2. Tag-based scRNA-seq library construction
2.2.1. Liquid-phase tag
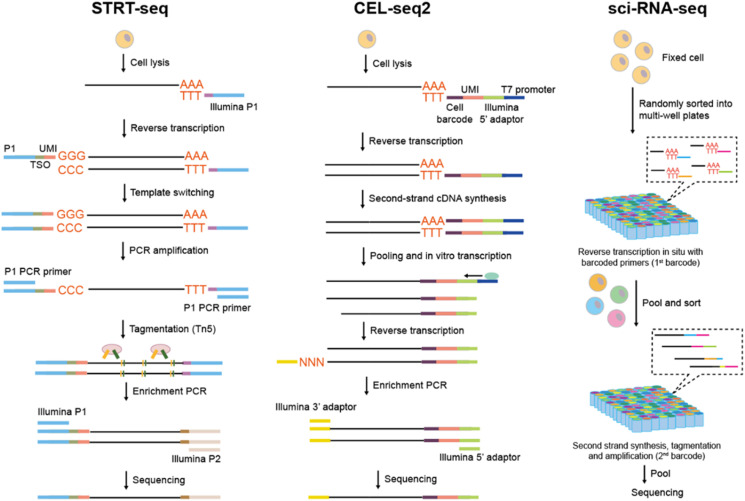
This approach typically incorporates the tag-containing primers into the reaction mixture subsequent to the RNA release, with each reaction tube or chamber accommodating one type of cell barcode. STRT52 (sing-cell tagged reverse transcription) is the first approach to leverage tags for cell barcoding and molecule quantification (Fig. 3A). The oligo(dT) primer containing cell-specific barcode and TSO primer containing UMI are introduced during reverse transcription. After PCR amplification and cDNA fragmentation, only the 5′-end fragments of transcripts are captured during library construction and sequencing.
Fig. 3. Liquid-phase tag based scRNA-seq methods. (A) The flow chart of STRT sequencing library preparation. (B) The flow chart of CEL-seq2 sequencing library preparation. (C) The flow chart of sci-RNA-seq sequencing library preparation.
Unlike STRT which utilizes exponential amplification, CEL-seq2 53 (cell expression by linear amplification and sequencing) adopts linear amplification to eliminate the template-switching step that is thought to decrease efficiency (Fig. 3B). The oligo(dT) primer incorporates a unique cell barcode, UMI and a T7 promoter, with the T7 promoter initiating in vitro transcription (IVT) for amplifying cDNA and generating single-strand RNA. Subsequently, the amplified RNA is transformed into cDNA, and the 3′-end gene expression is eventually sequenced. CEL-seq2 can also be combined with automatic Fluidigm's C1 system for a more time-saving and cost-efficient processing. Building upon CEL-seq2, MARS-seq54 (massively parallel RNA single-cell sequencing) harnessed the automation of FACS, liquid-handling platform, and an additional 384-plate-specific barcode to enhance the analysis throughput. Through the optimization of the RT volume, primer concentration, primer composition, and the second-strand-synthesis enzyme, the upgraded MARS-seq2.0 55 achieves a comprehensive enhancement in terms of throughput, robustness and noise reduction.
However, the cell throughput remains restricted since distinct single cells need to be isolated in physical partition, demanding a considerable quantity of 384-plate and entailing a relatively high cost. To tackle this issue, combinatorial indexing-based approaches have been implemented in scRNA-seq, which rely on cells themselves as compartments for split-and-pool-based barcoding.
sci-RNA-seq56 (single-cell combinatorial indexing RNA sequencing) is the pioneering and classic combinatorial indexing approach for scRNA-seq (Fig. 3C). Cells are fixed initially for the in situ preservation of mRNA, and then permeabilized to enable the entry of enzymes and oligonucleotides into the cell membrane. Groups of cells are randomly distributed to each well containing a well-barcode-containing oligo(dT) primer. The barcode for the first round is then attached to the cDNAs during reverse transcription. Cells are pooled and redistributed through FACS, after which the second round barcodes are introduced during cDNA amplification in each well. Through multiple split-and-pool protocols, each cell acquires a unique combination of barcodes, with a low probability that a barcode combination is shared by two cells. As a result, through sequencing sci-RNA-seq can not only detect the transcript information but also the cell barcode combination with a high throughput (nearly 50 000 cells). By further introducing multiple rounds of cell barcode through DNA ligation and optimizing the protocols, Sci-RNA-seq3 57 elevates the profiling scale to 400 000. The combinatorial indexing strategy is compatible with cells or nuclei obtained from clinical tissue samples that are fixed and hard to be dissociated completely. However, this method leads to substantial cell loss during FACS sorting and multiple centrifugation steps, making it unsuitable for precious cell sample analysis.
In summary, the liquid-phase tag offers a direct barcoding method through utilizing tag-containing primers in the reaction mixture and attaching the tag to cDNA during RT. The series of STRT-seq, CEL-seq2, and MARS-seq leverage the whole cell lysates to generate cDNA libraries and have high sensitivity. However, the throughput is restricted when physical partition is required to isolate distinct single cells. Furthermore, the expensive robotic equipment and reagent consumption render them unaffordable for common laboratories. The combinatorial indexing methodology implements split-and-pool protocols using the cells themselves as compartments, conferring each single cell a barcode combination with an ultra-high throughput. Nevertheless, this method has low cell utilization and is not adaptable for the analysis of precious cell samples. Furthermore, the consumption of reagents remains expensive and the operation is cumbersome. It is expected to reduce the reagent consumption to the nanoliter scale and automate the split-and-pool steps for highly efficient and low-cost scRNA-seq.
2.2.2. Solid-phase tag
This strategy typically employs barcoded beads for RNA tagging. The barcoded bead encompasses approximately 108 oligonucleotides consisting of PCR primer, cell barcode, UMI, and oligo d(T) primer. The cell barcode of each individual bead is uniform, while the UMIs are distinct. When a single barcoded bead and a single cell are paired, the poly(A)-containing mRNAs released by the cell are captured by the barcoded beads. Then, using the oligonucleotides as primers, the RT generates cDNAs carrying the cell barcode and UMI, which can be decoded after sequencing for cell source identification and absolute quantification of transcripts. Therefore, the pairing of a single barcoded bead and a single cell is crucial to provide each cell with a unique identity identification. To handle the micrometer-sized bead and cell, droplet microfluidics, microvalve structure-based microfluidics, and microwell are employed.
2.2.2.1. Droplet microfluidics
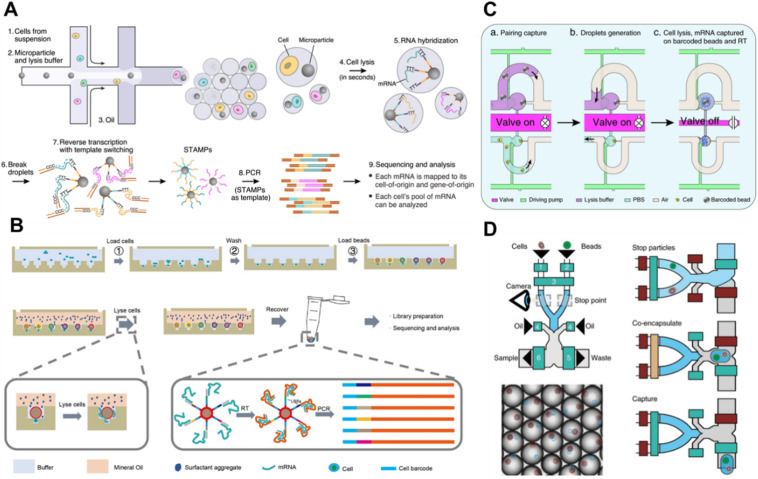
Drop-seq7 constitutes a revolutionary progress in the domain of highly parallel scRNA-seq through droplet microfluidics (Fig. 4A). A suspension of cells is merged with barcoded beads distributed in lysis buffer and subsequently passes through an oil intersection to generate nanoliter-sized droplets that jointly entrap individual cells and barcoded beads. Once the single cells within the droplets are lysed, the released mRNAs are captured by the barcoded beads. After demulsification, the beads are retrieved and collected for RT on their surface, during which the cDNAs retain information regarding both the cell barcode and UMI. Through subsequent library construction and sequencing, it becomes feasible to distinguish and quantify cDNAs from thousands of single cells. In recent years, several efforts have been made to enhance Drop-seq performance, such as increasing the retrieval rate of barcoded beads,58 developing a 3D-printed miniaturized Drop-seq system,59 and enabling the use of cell nuclei.59 However, despite the high throughput and low cost, the encapsulation of single barcoded beads and cells lies in Poisson distribution, resulting in only 5% barcoding rate of input cells.
Fig. 4. Solid-phase tag based scRNA-seq methods. (A) Schematic workflow of Drop-seq for highly parallel single-cell transcriptome sequencing based on droplet microfluidics. This figure has been reproduced from Cell, 2015, 161, 1202–1214, with permission from Elsevier, copyright 2015.7 (B) Schematic workflow of Well-Paired-seq that utilizes thousands of microwells for single-cell RNA sequencing. This figure has been reproduced from Small Methods, 2022, 6, e2200341, with permission from Wiley-VCH GmbH, copyright 2022.12 (C) Schematic workflow of Paired-seq for highly parallel scRNA-seq, which utilizes hydrodynamic traps for single-cell isolation and valve/pump structure for liquid control. This figure has been reproduced from Genome Biol, 2016, 17, 77, with permission from Springer Nature Publishing, copyright 2020.53 (D) Disco integrates a valve-based strategy with droplet microfluidics for pairing of a single cell and a bead. This figure has been reproduced from Nat Methods, 2022, 19, 323–330, with permission from Springer Nature Publishing, copyright 2022.17.
In contrast, Indrops60 exploits the close-packed ordering of hydrogel barcoded beads, surmounts the Poisson distribution, and achieves a 75% cell barcoding rate. Based on Indrops, the 10× Genomics Chromium system,60 as a commercial platform, was developed, which can handle 8 parallel independent samples by using an 8-channel microfluidic chip. Moreover, this platform utilizes dissolvable gel beads in emulsion (GEMs) as barcoded beads, enabling the controllable release of tag-containing primers in the droplet for homogeneous mRNA capture. In this manner, the occupation of single beads and cells can attain 80% and 50%, respectively.
To further mitigate the impact of the relatively low single-cell occupancy by the droplet generator, scifi61 (single-cell combinatorial fluidic indexing) integrates one-step combinatorial indexing with droplet microfluidics-based scRNA-seq, introducing two rounds of cell barcodes respectively in the well and in the droplet. The permeabilized cells are labeled with the first round of cell barcode during RT, and then all the cells are pooled for droplet encapsulation. Instead of assigning a single cell to each droplet, scifi enables several cells (∼9.8 cells) to be paired with a single bead per droplet. The second round of barcode is attached via a thermoligation method. Consequently, a single cell acquires a cell barcode combination with a low collision probability, and more than 100 000 single cells can be sequenced in a single experiment. However, as scifi employs the combinatorial indexing strategy, potential cell/nucleic loss is inevitable, hindering the analysis of rare cells. Furthermore, this strategy is still restricted to poly(A)-containing RNA profiling when using the oligo(dT) primer, neglecting other types of RNAs without the poly(A)-tail.
To capture more non-poly(A) RNAs, scComplete-seq (single-cell complete RNA sequencing)62 polyadenylates the 3′ end of RNA through the use of poly(A) polymerase and integrates the 10× Genomics Chromium protocol for single-cell transcriptome profiling. Nevertheless, scComplete-seq still utilizes poly(T) primers, and as a result, the 5′ ends of long transcripts and those with secondary structures might not be effectively reverse transcribed. VASA-seq51 (introduced in 2.1) where RNA fragmentation is conducted before polyadenylation can address this problem to some extent. Furthermore, the series of scRandom-seq63,64 employ the random sequence as RT primers and thereby can retain more information of 5′ ends of transcripts. Yet the random combination of RT primers with the transcripts might generate a large quantity of small fragments.
2.2.2.2. Microwell
The roofless high-density microwell isolates single cells and barcoded beads by relying on gravity. The simplicity of chip fabrication and the convenience of cell isolation render it accessible to most laboratories. Seq-Well65 utilizes approximately 86 000 microwells to confine single cells and barcoded beads, with the occupation rates being 80% and 95% respectively. Once the cell/bead pairing occurs, a semipermeable polycarbonate membrane with a pore size of 10 nm is employed, which permits the entry of lysis buffer while preventing mRNA loss. Thus, when single cells are lysed, the mRNAs are released and captured by the paired barcoded beads for downstream library construction. Considering the potential failure of the template switching reaction resulting in the loss of a portion of transcripts, Seq-Well S3 66 additionally incorporates a second-strand-synthesis step following RT to introduce a PCR priming site. This design facilitates the enhancement of gene detection, being approximately 10 times higher than Seq-Well. However, the generated library is shorter than that of Seq-Well after the second-strand synthesis, thereby losing information from their 5′-ends.
To further improve the cell/bead pairing efficiency, Well-paired-seq12 utilizes thousands of size exclusion and quasi-static hydrodynamic dual wells for cell/bead isolation (Fig. 4B). The principle of size-exclusion enables the trapping of a single cell in the lower well and a single bead in the upper well. Furthermore, the quasi-static hydrodynamic process impedes trapped cells from escaping the wells, ultimately resulting in a high capture efficiency for cells (91%) and a pairing rate of 82% for cell/bead combinations. The upgraded Well-paired-seq2 67 version leverages the molecular crowding effect, improves tailing activity in RT, and achieves a more effective gene detection capability with 3116 genes and 8447 transcripts through a homogeneous enzymatic reaction.
Microwell-seq68 employs a similar strategy with 105 microwells for single-cell isolation. The use of homemade magnetic barcoded beads enables the controllable loading and release of beads with a magnet. To reduce cross-contamination, the trapped cells should be kept at a distance, thereby resulting in a cell occupation rate of only 5% to 10%. To further enhance the cell utilization rate, the same group proposed microwell-seq 2.0 69 which integrates in-cell RT and Microwell-seq. Cells are initially fixed and labeled with the first round of barcode in RT reactions by using well-specific RT primers. Subsequently, cells are pooled and distributed to 70 000 microwells, with approximately 10 cells being loaded in a single microwell. Since microwell-seq 2.0 is capable of sequencing 700 000 cells in a single experiment, it can meet the requirements of high-throughput screening. Furthermore, the recently developed microwell-seq3 70 utilizes terminal deoxynucleotidyl transferase for poly(A) tailing, thereby enabling the detection of total RNAs encompassing non-coding RNAs and microRNAs.
2.2.2.3. Microvalve structure based microfluidics
In a microvalve-based microfluidic device, elastomeric membranes located beneath the channels are controlled by pressure to regulate flow pass, and multiple valves and pumps are employed to precisely introduce various reagents for conducting a series of reactions. Since single cell isolation is typically accomplished through hydrodynamic trapping methods, this strategy is featured by high single-cell isolation ability and thus is suitable for rare cell analysis.
Zhang et al. reported Paired-seq71,72 for highly parallel scRNA-seq, which utilizes hydrodynamic traps for single-cell isolation and valve/pump structure for liquid control (Fig. 4C). Based on hydrodynamic differential flow resistance that only allows one cell or one barcoded bead to be captured in a picoliter chamber, the Paired-seq chip with numerous units enables simultaneously one-to-one pairing of thousands of cells and barcoded beads with >90% efficiency. Gases are introduced in reverse to create two liquid-in-gas droplets within each unit, which consists of one bead and one cell. When the valve at the connecting channel between two chambers is opened, the two droplets in the unit combine to facilitate liquid exchange. With the lysis buffer, mRNAs are lyzed and captured by barcoded beads for downstream library construction.
Cheng et al. proposed Hydro-seq73 (high-efficiency-cell-capture contamination-free single-cell RNA sequencing) for the analysis of single circulating tumor cells. The Hydro-seq chip is equipped with capture chambers for the pairing of cells and beads, microfluidic channels for the introduction of cells, beads, and lysis buffer, as well as control valves for selectively closing flow paths and isolating the chambers during mRNA extraction. After the hydrodynamic capture of the cell/bead, the introduction of cell lysis facilitates the release of mRNAs and subsequent capture by single barcoded beads within the same chamber. Since CTCs are larger than blood cells, the capture hole is elaborately designed to be smaller than CTCs but larger than blood cells, thereby attaining specific CTC capture in whole blood even with a low starting sample input of as few as 10 cancer cells.
Bues et al. integrated a valve-based strategy with droplet microfluidics to develop Disco17 (mRNA-capture bead and cell co-encapsulation droplet system) for pairing of a single cell and a bead (Fig. 4D). The microfluidic system employs Quake-style microvalves to regulate the flow, with three inlet channels for cells, beads, and oil, as well as two outlets for waste and sample liquids. Upon simultaneous detection of single cells and beads at the stop point by the camera, they are co-encapsulated in oil-sheared droplets. By using this method, Disco can achieve 75% cell utilization rate even with only a small number of cells.
In summary, the solid-phase tag exploits paired barcoded beads within the microfluidic device for RNA tagging, facilitating the transcript to carry the cell barcode and UMI. Compared with the liquid-phase tag, the utilization of barcoded beads is cost-effective and throughput-efficient. Microfluidic technologies utilize droplets, microwells or microchambers for cell compartmentation, while the split-and-pool strategy employs cells themselves as separators. Although the split-and-pool method can offer higher throughput than microfluidics, it is plagued by a high cell loss rate and costly reagent consumption, which impedes its wider application. As diverse types of microfluidics are utilized for the pairing of barcoded beads, they all have their advantages and disadvantages. The droplet microfluidics and microwell are characterized by simple fabrication, large-scale handling, and ease of conversion to commercial assays, thereby being accessible to most laboratories. However, the single-cell capture and occupation rate are still restricted, thus being unsuitable for rare cell analysis. The microwell has a relatively higher single-cell occupation rate, yet it poses a challenge in characterizing cells of varying sizes due to the fixed sizes of the wells. For the valve-based strategy, it demonstrates an advantage for rare cell analysis because of the higher cell utilization. Nevertheless, the complex chip fabrication and operation still impede its wide applications.
3. The breakthrough: temporal modeling of scRNA-seq
scRNA-seq has emerged as a powerful tool for understanding cellular heterogeneity and regulatory processes. However, the majority of existing scRNA-seq methodologies are limited by their inability to capture the dynamic changes in cellular states over time. This is primarily due to the requirement of cell lysis, which can only provide a static snapshot of the cellular transcriptome.74 Although computational methods based on scRNA-seq data have been proposed for trajectory analysis, the result is based on assumptions and cannot reflect the actual situation. To overcome this limitation, researchers have been exploring various approaches to resolve time-series molecular events on the single-cell basis by providing the “time anchors” in the scRNA-seq. In this section, we will present a comprehensive overview of various temporal modeling approaches for scRNA-seq, discussing their respective principles, strengths, limitations, and other relevant aspects (Fig. 5).
Fig. 5. The overview of various temporal modeling approaches based on scRNA-seq.
3.1. Metabolic labeling chemistry
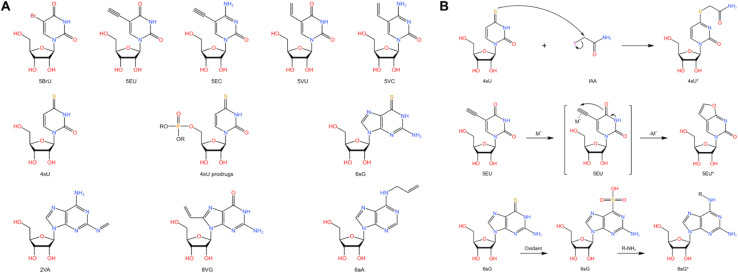
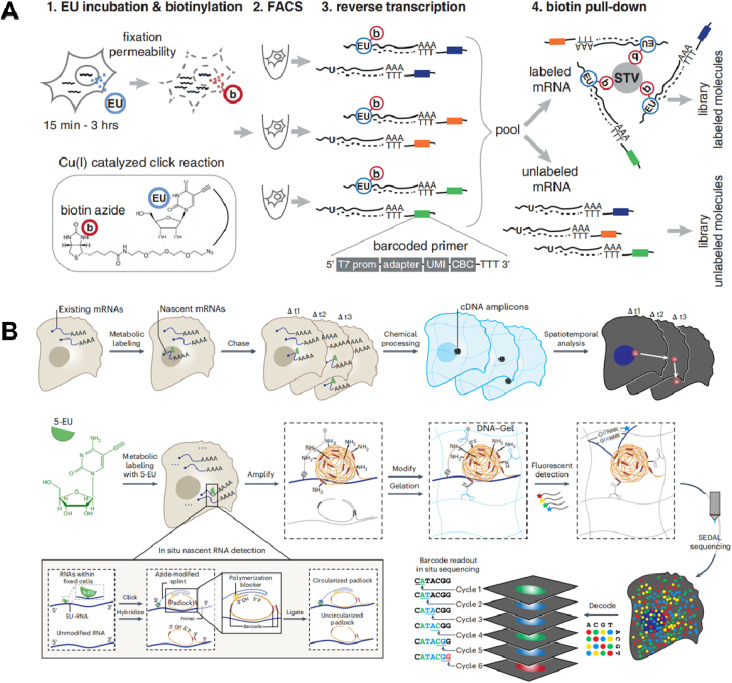
Metabolic labeling of nascent RNA provides a straightforward manner to distinguish old transcripts from newly synthesized ones (Fig. 6A).1–3 4sU and 5EU have been employed for some time and are commercially accessible. However, the majority of the other nucleosides have merely been introduced recently in bulk analysis and have not been utilized in single-cell analysis. The efficiency of metabolic RNA labelling ranges from 1% to 10%.
Fig. 6. (A) Chemical structures and abbreviations of nucleoside analogues that have been used for RNA metabolic labelling to incorporate chemical handles.1–3 (B) The reaction mechanism of RNA metabolic labelling.1–3.
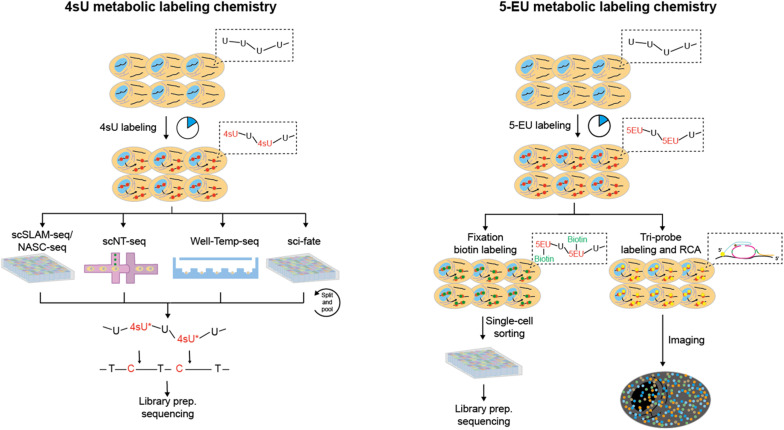
4-Thiouridine (4sU) is frequently employed as a nucleotide analog of uridine that can be incorporated into nascent RNAs. Then the reaction activity of the thiol in 4sU is utilized to perform oxidative-nucleophilic substitution by IAA, TFEA/NaIO4 or OsO4, resulting in the chemical conversion of 4sU into cytidine derivatives (Fig. 6B). A guanine is subsequently misincorporated into the pairing site in first-strand cDNA during RT, resulting in a T-to-C conversion that can be identified during sequencing. Hence, newly generated RNAs are distinguished from pre-existing RNAs during the computational analysis. The integration of 4sU metabolic labeling chemistry with scRNA-seq has suggested a range of methods (Fig. 7A).
Fig. 7. The overview of metabolic labeling chemistry in time-resolved scRNA-seq. 4sU and 5-EU are the most prevalently utilized metabolic labels, which can be employed for the detection of nascent RNAs. The metabolic labeling chemistry can be integrated with diverse scRNA-seq methodologies for expression pattern profiling and spatial imaging analysis.
scSLAM-seq75 (single-cell, thiol-(SH)-linked alkylation of RNA for metabolic labelling sequencing) couples 4sU metabolic labeling with Smart-seq library construction to simultaneously detect nascent RNAs and old RNAs in single cells. Cells are firstly exposed in a 4sU-containing culture medium and then sorted by FACS into multi-well plates containing lysis buffer. After RNA release, 4sU is converted into a cytosine analogue by IAA, followed by RNA wash with RNA XP magnetic beads and library preparation. scSLAM-seq also proposed GRAND-SLAM 2.0 algorithm for parallel analysis of the ratio of new to total RNA (NTR) in hundreds of single-cell libraries. The NTR analysis outperforms total RNAs or old RNAs in distinguishing mouse fibroblast cells infected with lytic mouse cytomegalovirus and uninfected cells. Furthermore, scSLAM-seq demonstrates superior performance in identifying temporal directionalities compared to splicing-based RNA velocity, possibly attributed to the independent metabolic labeling of nascent RNA processes unaffected by intron numbers and splicing speed.
NASA-seq76 (new transcriptome alkylation-dependent single-cell RNA sequencing) employs a similar strategy to scSLAM-seq, which involves the use of 4sU labeling, RNA modification by alkylation, followed by single-cell RNA-seq library construction using Smart-seq2. As biotinylated oligo-dT primers are used by NASA-seq to immobilize and wash the RNA after alkylation, this method has the potential to be suitable for concurrent single-cell DNA sequencing and epigenome analysis. Nevertheless, scSLAM-seq and NASA-seq are limited to processing a few hundred cells at a time and incur significant expenses for each cell library. Moreover, they lack UMIs and thus cannot accurately quantify the new transcript levels.
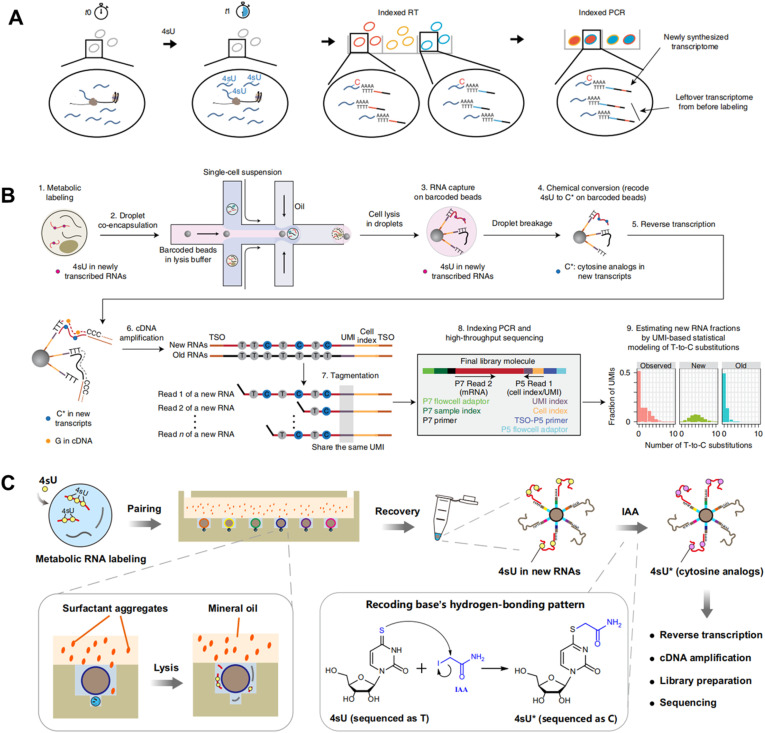
To overcome these problems, sci-fate5 combines sci-RNA-seq with the 4sU metabolic labeling strategy for >6000 single cell analysis (Fig. 8A). After the 4sU labeling, cells are fixed with 4% paraformaldehyde and then subjected to 4sU chemical conversion. Then cells are distributed to 96-well plates and split-and-pool protocols are conducted for the combinatorial indexing of single cells. Since the first molecular index contains a UMI, sci-fate allows direct counting of the number of transcripts via 3′-tagged UMIs. In contrast to scSLAM-seq and NASA-seq, which involve extracting mRNA from individual cells followed by bead-based purification, sci-fate conducts in situ 4sU chemical conversion in bulk fixed cells. This approach results in higher reaction efficiency and lower mRNA loss, leading to enhanced gene detection ability (∼6500 genes per cell in sci-fate versus ∼4000 genes per cell in scSLAM-seq) and nascent RNA detection (82% in sci-fate versus <50% in scSLAM-seq). However, the issue of significant cell loss (>95%) caused by the numerous centrifugation steps in split-and-pool protocols continues to be a challenge.
Fig. 8. (A) Schematic workflow of sci-fate combines sci-RNA-seq with a 4sU metabolic labeling strategy for high-throughput single cell analysis. This figure has been reproduced from Nat Biotechnol, 2020, 38, 980–988, with permission from Springer Nature Publishing, copyright 2020.5 (B) Schematic workflow of scNT-seq that employs droplet microfluidics for temporally resolved scRNA-seq. This figure has been reproduced from Nat Methods, 2020, 17, 991–1001, with permission from Springer Nature Publishing, copyright 2020.11 (C) Schematic workflow of Well-Temp-seq that utilizes a microwell device for 4sU-labelled cell loading and pairing. This figure has been reproduced from Nat Commun, 2023, 14, 1272, with permission from Springer Nature Publishing, copyright 2023.10.
scNT-seq11 employs droplet microfluidics for temporally resolved scRNA-seq (Fig. 8B). The cells metabolically labelled with 4sU are individually co-encapsulated with a barcoded bead during the droplet generation according to Drop-seq steps. Upon cell lysis, both pre-existing RNAs and nascent RNAs are captured by the oligo-(dT) primers on the barcoded beads. The scNT-seq method also demonstrates a high gene detection capacity of approximately 6000 genes and around 20 000 UMIs per cell, while being more than 50-fold cost-effective compared to the scSLAM-seq/NASA-seq methods. The utilization of TFEA/NaIO4 in scNT-seq enables 4sU chemical conversion, which can also facilitate G-to-A conversions in new RNAs by using 6-thioguanine (Fig. 6B). Therefore, scNT-seq has the potential to label cells with both 4sU and 6-thioguanine at two different time points.
Instead of droplet microfluidics, Well-Temp-seq10 utilizes a microwell device for 4sU-labelled cell loading and pairing, which is followed by cell lysis, mRNA capture, IAA chemistry conversion and library construction (Fig. 8C). The well-designed size-exclusion and quasi-static hydrodynamic microwell facilitates highly efficient pairing of single cells with barcoded beads (∼80%), a significant improvement over the Drop-seq-based scNT-seq method (<1%). Furthermore, Well-TEMP-seq eliminates the need for multiple centrifugation steps, resulting in minimal cell loss (∼67.5% recovery) compared to sci-fate (<5% recovery).
In addition to 4sU, 5-ethynyluridine (EU) has also been utilized as an alternative uridine analog for newly synthesized RNA labeling (Fig. 7B). It is characterized by its ability to undergo click chemistry due to the presence of alkynyl on 5-EU (Fig. 6B). Battich et al. developed scEU-seq8 (single-cell EU-labeled RNA sequencing), which integrates 5-EU labeling, click chemistry-based biotinylation, and MARS-seq to simultaneously quantify nascent and pre-existing transcripts in thousands of single cells (Fig. 9A). Cells labeled with 5-EU are fixed and permeabilized, followed by the biotinylation of labeled RNA through a click reaction. After sorting single cells by FACS, oligo-(dT) primers with cell-specific barcodes are introduced to generate mRNA/cDNA hybrids. The nascent RNAs that have been biotinylated can be separated by streptavidin magnetic beads, while the supernatant contains unbiotinylated pre-existing RNAs; both fractions can be individually prepared for sequencing library construction. Using scEU-seq, synthesis and degradation rates during the cell cycle and differentiation of intestinal stem cells are investigated, revealing major regulatory strategies for controlling the dynamic range and precision of gene expression.
Fig. 9. (A) Schematic workflow of scEU-seq which integrates 5-EU labeling, click chemistry-based biotinylation, and MARS-seq to simultaneously quantify nascent and pre-existing transcripts in thousands of single cells. This figure has been reproduced from Science, 2020, 367, 1151–1156, with permission from American Association for the Advancement of Science, copyright 2020.8 (B) Schematic workflow of TEMPOmap that employs 5-EU metabolic labeling and a tri-probe set to spatially and temporally resolve scRNA-seq. This figure has been reproduced from Nat Methods, 2023, 20, 695–705, with permission from Springer Nature Publishing, copyright 2023.13.
The TEMPOmap13 (temporally resolved in situ sequencing and mapping) method further employs 5-EU metabolic labeling and a tri-probe set to spatially and temporally resolve scRNA-seq (Fig. 9B). The tri-probe set includes a splint probe, padlock probe, and primer probe. Cells are labeled with 5-EU, fixed and permeabilized. Afterwards, splint DNA probes with azide at the 5′ end and a terminator group at the 3′ end are introduced to covalently attach to the 5-EU labeled site via click chemistry. The padlock probes recognizing mRNA targets can undergo circularization when in physical proximity to the splint probe; however, those hybridized with pre-existing RNAs cannot be circularized due to the absence of 5-EU and thus the splint DNA. Utilizing the circularized padlock probe as a template, primer probes targeting neighboring 20–25 nucleotides next to the padlock probes serve as primers for initial rolling cycle amplification (RCA). When combined with fluorescent probes specific for RCA products, individual nascent RNAs can be spatially identified. By further integrating the pulse-chase strategy, TEMPOmap is able to investigate both age and location of RNA molecules and track their synthesis and degradation at subcellular levels.
The metabolic labeling chemistry offers an exact temporal reference point for detecting nascent RNAs, distinguishing them from pre-existing ones. This method has significantly advanced our understanding of gene expression regulation and RNA metabolism. Nevertheless, several challenges remain to be addressed, which can further enhance the applicability and precision of this approach. Firstly, the use of labeled RNA may be limited by its saturation and the potential toxicity of labeling agents when studying long-term dynamics. Developing well-biocompatible nucleosides and metabolic labelling methods is anticipated in the future. Secondly, the current application of this strategy is confined to the analysis of dynamic RNA alterations at the cellular level. To obtain a more comprehensive understanding of the underlying biological processes, there is an urgent need to extend it to the tissue level. Thirdly, current methods only capture a single time point; the integration of metabolic labeling with diverse nucleotide analogs can potentially enable analysis at multiple time points. For instance, the combined application of 4sU/6-thioguanosine or 5BrU/4sU enables the simultaneous determination of synthesis and degradation rates and enhances the temporal resolution. Finally, existing methods primarily focus on expression levels and overlook RNA splicing events; incorporating nanopore sequencing techniques may overcome this limitation by enabling long-read sequencing to investigate native RNA isoforms.
3.2. Cytoplasmic biopsy
The innovative technique of cytoplasmic biopsy sequentially extracts RNAs, enabling direct monitoring of cellular dynamics within the same cell. This methodology calls for the utilization of advanced nanotechnology, which facilitates trace RNA extraction while maintaining the cell's viability (Fig. 10A).77 The adoption of this approach allows for not only molecular profiling but also longitudinal functional analysis to link historical molecular characteristics with consequent phenotypes.
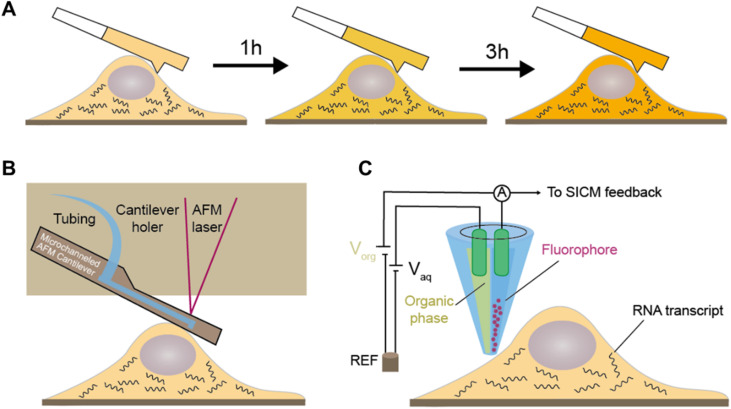
Fig. 10. Cytoplasmic biopsy based time-resolved scRNA-seq. (A) By sequentially extracting RNAs within a single cell, this approach enables the direct monitoring of cellular dynamics within the same cell. The RNA extracting device includes (B) commercial fluidic force microscopy (FluidFM) used in Live-seq and (C) nanopipette coupled with electrowetting.
Chen et al. initially proposed Live-seq16 for the temporal transcriptomic recording of single cells. Live-seq employs a state-of-the-art commercial fluidic force microscopy (FluidFM)78,79 that integrates precise force control with volume control for single-cell extraction (Fig. 10B). By optimizing both the FluidFM procedure and a low-input RNA-seq approach, this methodology enables the extraction of cytoplasmic RNAs (0.1–4 pL) from live single cells and constructs high-quality libraries of those extracted RNAs. The ability to distinguish different cell types and differential gene expression indicates that the RNAs analyzed in the cytoplasmic biopsy faithfully represent those of the entire cell. Moreover, Live-seq at different time points does not cause any undesired perturbations on the sampled cells, indicating the accuracy of temporal recording. By coupling Live-seq with time-lapse imaging, the dynamic changes in transcriptome as well as phenotype in individual macrophages before and after exposure to lipopolysaccharide (LPS) are temporally resolved and linked.
A recent study further expands the toolkit of cytoplasmic biopsy by using nanopipettes coupled with electrowetting and integrates into a scanning ion conductance microscope (SLAM) to perform longitudinal profiling of the transcriptome in a single cell (Fig. 10C).15 SICM incorporates an electrode inserted in a glass nanopipette and a reference electrode immersed in the culture medium, forming the ion current between them. The excellent conductivity of the aqueous barrel allows for efficient nanopipette procedures and automated positioning using feedback control. Additionally, the dual-channel nanopipette enables exogenous molecule introduction before nanobiopsy, expanding the potential applications for molecular labeling and gene editing.
Despite significant advancements of cytoplasmic biopsy to provide a direct measurement of the actual cell dynamics, this method is constrained by its low throughput, low successful rate (40%) and unsatisfactory gene detection sensitivity (2100 genes per million sequencing depth). Furthermore, it is currently only applied for cell line analysis, and thus is impractical for in vivo applications. Additionally, its accessibility is hindered by the requirement for specialized hardware and multidisciplinary skills for operation.
3.3. In vivo cell labelling by fluorescence
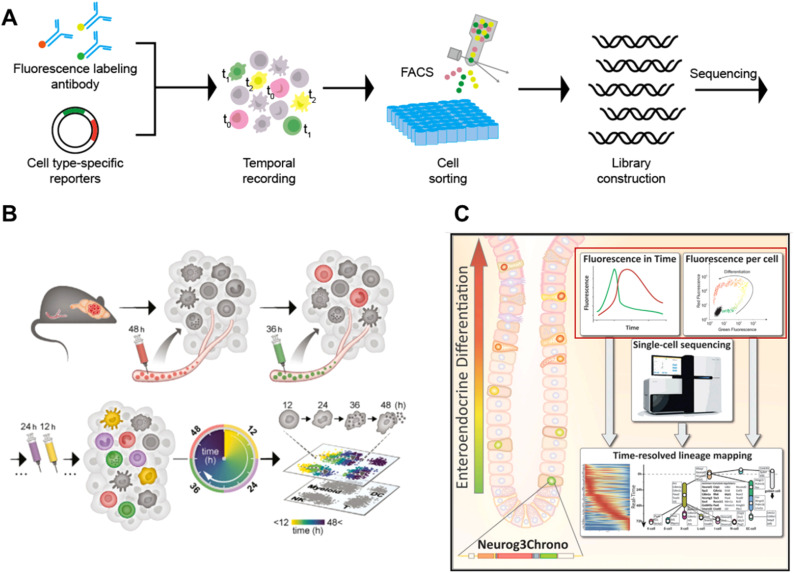
This methodology labels cells with time anchors in vivo using fluorescent antibodies9 or cell type-specific reporters14,80 with a temporal expression pattern. Then the cells are sorted by FACS according to the fluorescence signal related to the temporal information and processed by scRNA-seq, enabling the capture of cellular dynamics (Fig. 11A).
Fig. 11. (A) The strategy of in vivo cell labelling by fluorescence to record different cells at different time points. (B) Schematic workflow of Zman-seq that utilizes fluorescent antibodies at different time points to add temporal information to scRNA-seq data. This figure has been reproduced from Cell, 2024, 187, 149–165 e123, with permission from Elsevier, copyright 2023.9 (C) Schematic workflow of Gehart's method that leverages cell type-specific reporters for temporal recording and combines scRNA-seq to study time-ordered trajectories during enteroendocrine differentiation. This figure has been reproduced from Cell, 2019, 176, 1158–1173 e1116, with permission from Elsevier, copyright 2019.14.
The Ido group proposed Zman-seq9 by utilizing fluorescent antibodies, which can add temporal information to scRNA-seq data (Fig. 11B). By introducing fluorescent anti-CD45 antibodies every 12 h, 99.5% circulating immune cells in the vasculature are labelled with time stamps. Once these cells exit the circulation and infiltrate tissues, they are protected from being labeled again in subsequent rounds. After several days of tracing, the immune cells are collected and profiled using FACS, and fluorescent stamps on individual cells are utilized to determine the time of tumor infiltration. By combining fluorescent stamps with scRNA-seq, Zman-seq is capable of generating temporal maps of the immunosuppressive tumor microenvironment. Therefore Zman-seq, as an in vivo scRNA-seq technology, can elucidate immune cell-state transitions and molecular trajectories over time and serve as an effective tool for investigating how competent immune cells become complicit in tumor development.
Gehart et al. leveraged cell type-specific reporters for temporal recording and combined scRNA-seq to study time-ordered trajectories (Fig. 11C).14 In order to investigate enteroendocrine cell development, a sequence encoding two fluorescent proteins (red tdTomato and mNeonGreen) is inserted downstream of Neurog3. During the early differentiation of enteroendocrine cells in Neurog3Chrono mice, the transcription factor gene Neurog3 is transiently expressed, along with simultaneous expression of the red and green reporter proteins. Since mNeonGreen has a faster decay rate than tdTomata, the ratio of red to green fluorescence can be used to determine the actual time interval after Neurog3 expression. Subsequently, single neurog3Chrono cells with different fluorescence statuses are sorted by FCS and profiled by scRNA-seq, enabling the construction of an actual developmental map over time.
Overall, in vivo cell labeling by fluorescence has significantly advanced the cell temporal recording and development trajectory investigation. However, this methodology still faces several technical challenges. Firstly, the spectral overlap of existing dyes limits the number of fluorescent time anchors that can be utilized. Furthermore, the application of this methodology to human samples is challenging. On one hand, in Zman-seq achieving a high labeling efficiency similar to that in the mouse model is difficult due to the abundance of circulating immune cells in the human body. Additionally, potential toxicity associated with fluorescent antibodies cannot be overlooked. On the other hand, Gehart's method requires reporter cassette insertion into mouse embryonic stem cells, which is not readily applicable to humans due to ethical concerns.
3.4. Genetic barcoding
Genetic barcoding strategies are utilized to detect genetic mutations shared by different cells in order to construct cell lineages over a long timescale.81,82 With the development of CRISPR-Cas9, numerous mutations can be generated at specific loci through the design of targeted guide RNAs. Once a mutation is formed, this genetic scar will be inherited by offspring cells and can be identified through sequencing. By further combining genetic barcoding with scRNA-seq, it becomes possible to profile the lineage map with higher resolution than analyzing genetic scars alone and in a more accurate manner than pseudo-time trajectory reconstruction based solely on scRNA-seq data.
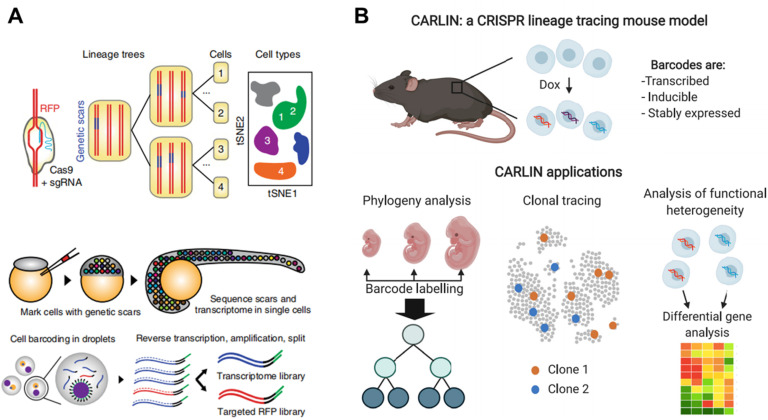
Spanjaard et al. developed LINNAEUS4 (lineage tracing by nuclease-activated editing of ubiquitous sequences) for simultaneous measurement of single-cell transcriptomes and lineage markers in vivo. LINNAEUS targets a red fluorescent protein (RFP) transgene in the zebrafish line zebrabow M, which has 16–32 independent integrations of the transgenic construct (Fig. 12A). When Cas9 and sgRNA are injected into one-cell-stage embryos, the genetic scars can be generated at an early time point in embryo development with the loss of RFP. At a later stage, the embryos are dissociated into a single-cell suspension for targeting sequencing of RFP scars and scRNA-seq in the same cells by droplet microfluidics. By using this approach, developmental lineage trees in zebrafish larvae and in liver, pancreas, telencephalon and heart of adult fish are reconstructed.
Fig. 12. (A) The schematic illustration of LINNAEUS which utilizes genetic barcodes for constructing the lineage tree of zebrafish line. This figure has been reproduced from Nat Biotechnol, 2018, 36, 469–473, with permission from Springer Nature Publishing, copyright 2018.4 (B) A universal CRISPR array repair lineage tracing (CARLIN) mouse line constructed by the introduction of Cas9-based scar. The mouse line can be applied in phylogeny analysis, clonal tracing and analysis of functional heterogeneity. This figure has been reproduced from Cell, 2020, 181, 1693–1694, with permission from Elsevier, copyright 2020.21.
Bowling et al. introduced Cas9-based scarring into mice and established a universal CRISPR array repair lineage tracing (CARLIN) mouse line (Fig. 12B).21 In this mouse model, 10 different gRNAs are designed to enable precise cleavage of target sites when combined with Cas9, resulting in the generation of up to 44 000 transcribed barcodes in an inducible manner at any point and thus providing clonal information. When coupled with scRNA-seq, this model can be applied to investigate the dynamics of the hematopoietic system, uncovering previously unknown details of blood development during embryonic development and observing the dynamic process of blood replenishment in adult mice following chemotherapy.
Overall, the utilization of genetic barcoding through the CRISPR-Cas9 system adds an additional layer to developmental maps established by scRNA-seq, as clonal analysis enables the detection of historical events that are nearly imperceptible using methods solely reliant on transcriptional similarity among cells. Nevertheless, the intricate design of gRNA and potential off-target effects remain formidable challenges.
4. The applications with time-resolved scRNA-seq
Time-resolved scRNA-seq has emerged as a powerful tool for unraveling the intricate dynamics of biological processes. By capturing gene expression profiles at multiple time points, this cutting-edge technology enables researchers to track the temporal changes in cellular states and molecular pathways with unprecedented resolution. In this section, we will provide an overview of the emerging applications of time-resolved scRNA-seq, which will disclose how these methodologies explore the dynamics and mechanisms of immune response, cancer progression, and embryonic development.
4.1. Dynamics of immune response
The immune response is initiated by multiple cells such as lymphocytes and macrophages, which are in dynamic equilibrium to maintain the immune stability under normal immune conditions.22 The appearance of the pathological state and external stimulation can disturb the immune system, which induces an immune response and then establishes a new equilibrium state dynamically. Time-resolved scRNA-seq offers a unique window into the dynamic interplay between immune cells and their microenvironment during an immune response, providing valuable insights into the underlying mechanisms governing immune cell activation, differentiation, and functional plasticity.
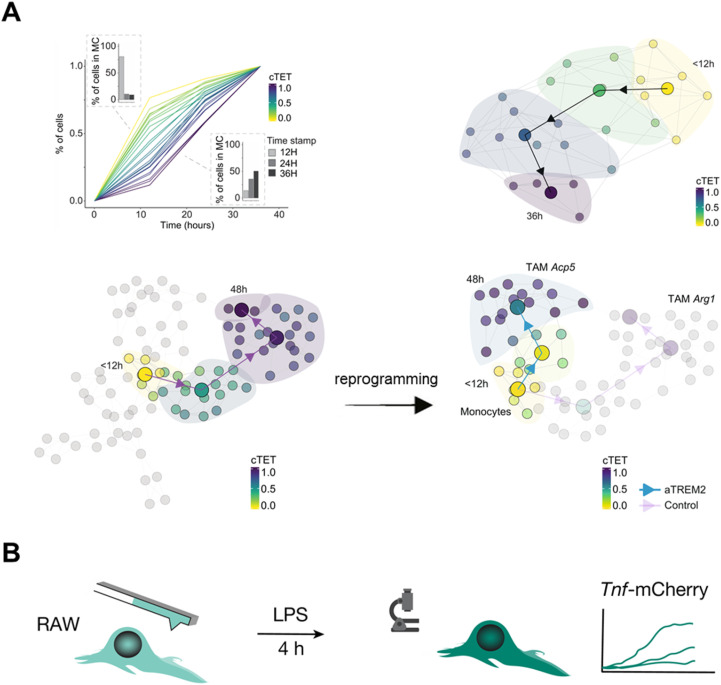
In vivo cell labeling by the fluorescence-based strategy can reveal the alteration of cell composition, cellular status, and molecular trajectories within the immune microenvironment. Zman-seq9 investigates the dysfunctional immune system in glioblastoma by introducing time stamps to circulating immune cells and continuously tracking and documenting transcriptomic dynamics data (Fig. 13A). Continuous tumor exposure time (cTET) values are calculated and associated genes are screened, uncovering the temporal trajectory of NK cells in tumors and demonstrating that TGF-β signaling causes a decline in NK cell toxic activity and promotes tumor immune escape. Further study observes a strong correlation between tumor exposure time and Trem2 expression. And the use of antagonistic monoclonal antibodies to block TREM2 redirected monocyte differentiation from tumor-associated macrophages (TAMs) to pro-inflammatory macrophages, suggesting that myeloid reprogramming strategies can potentially be a promising way for immunotherapy.
Fig. 13. Applications of time-resolved scRNA-seq in studying dynamics of the immune response. (A) Zman-seq calculates the value of tumor exposure time and reveals temporal NK cell trajectories in the tumor. The finding also reveals that the TREM2 antagonistic antibody reprograms the tumor microenvironment (TME) by disrupting the transition from monocytes to TAMs. This figure has been reproduced from Cell, 2024, 187, 149–165 e123, with permission from Elsevier, copyright 2024.9 (B) Schematic diagram for integrating Live-seq with live-cell imaging to detect the immune response of individual macrophage cells. Single RAW264.7 cells are initially subjected to Live-seq and subsequently exposed to LPS while tracking Tnf-mCherry fluorescence through time-lapse imaging. This figure has been reproduced from Nature, 2022, 608, 733–740, with permission from Springer Nature Publishing, copyright 2022.16.
The cytoplasmic biopsy strategy can delve deep into the immune response process within an individual cell to address immunodynamic questions. Cytoplasmic biopsy (Live-seq)16 relates the ground-state transcriptomes to downstream molecular and phenotypic features in single RAW264.7 macrophages after the treatment of LPS (Fig. 13B). The result finds that the expression of Nfkbia undergoes the most significant change in the NF-κB pathway.83 This founding indicates that the expression of Nfkbia is a crucial driver for the heterogeneous LPS response in macrophages and can serve as a transcriptional predictor of TNF expression under LPS stimulation.
4.2. Transcriptional changes of cancer
Cancer is a genetic disorder characterized by aberrations in gene expression. The high mortality rate of cancer is mainly ascribed to the rapid growth and frequent interaction of tumor cells, and there is still a lack of effective treatment to completely eliminate cancer cells. Time-resolved scRNA-seq can unveil the complex temporal dynamics driving tumor progression and metastasis. Furthermore, by dissecting the heterogeneity within tumor ecosystems over time, researchers can gain deeper understanding of how cancer cells evolve and adapt in response to treatment pressures.
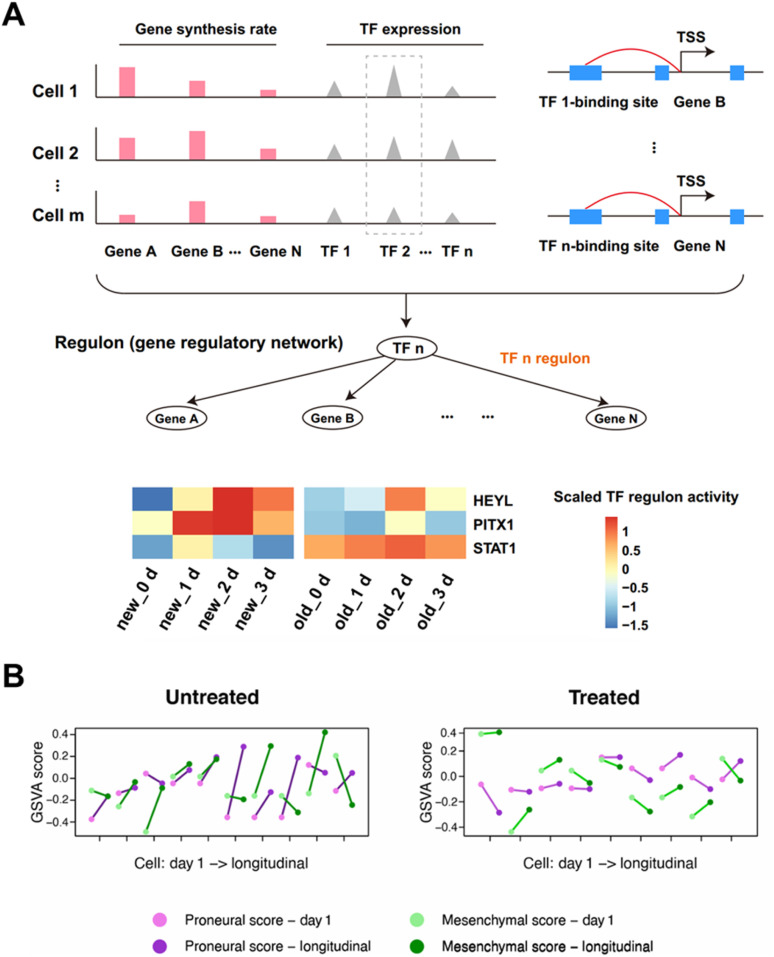
The metabolic labeling chemistry-based approaches can disclose the drug treatment responsive regulation on transcript expression patterns of cancer cells. Lin et al. applied Well-temp-seq10 to analyze the transcriptional dynamics of colorectal cancer cells treated with the low-dose antitumor drug 5-AZA-CdR. The results indicate that the 5-AZA-CdR induced global DNA demethylation results in the reactivation of tumor suppressor genes and the inhibition of oncogenes. By further applying SCENIC84,85 to paired single-cell old and new transcriptomes from Well-TEMP-seq, 95 co-regulated transcription factors (TFs) are identified (Fig. 14A). And the three regulators (STAT1, HEYL and PITX1) under 5-AZA-CdR treatment demonstrate a synergistic enhancement of the antitumor effect of 5-AZA-CdR treatment. Similarly, through the utilization of metabolic labeling, Cao et al. employed Sci-fate5 to explore the cortisol response of over 6000 individual lung cancer cells. By identifying the newly generated RNAs subsequent to dexamethasone (DEX) treatment, this method quantifies the dynamics of transcription factors implicated in processes such as the cell cycle and glucocorticoid receptor activation.
Fig. 14. Applications of time-resolved scRNA-seq in studying transcriptional changes of cancer. (A) Schematic illustration of regulon identification through linking TFs with their regulated genes. The heat map presenting the average regulon activity of 3 regulons of HCT116 cells after 5-AZA-CdR treatment. This figure has been reproduced from Nat Methods, 2020, 17, 991–1001, with permission from Springer Nature Publishing, copyright 2023.10 (B) The subtype switching of single GBM brain tumor cells identified by the cytoplasmic biopsy-based time-resolved scRNA-seq. This figure has been reproduced from Sci Adv, 2024, 10, eadl0515, with permission from American Association for the Advancement of Science Publishing, copyright 2024.15.
The cytoplasmic biopsy can uncover the subtype transition of cancer cells. The previous report demonstrated that glioblastoma (GBM) brain tumor cells lie on an axis of proneural (PN) to mesenchymal (MES) cell subtype, and the percentage of subtype transition influences the treatment effect (Fig. 14B).86 Marcuccio et al. utilized cytoplasmic biopsy for longitudinal transcriptome analysis of single glioblastoma (GBM) brain tumor cells before and after the chemotherapy and radiotherapy.15 The result indicates that untreated cells undergo subtype switching in 7 out of 10 cases, while treated cells only switch in 1 out of 9, suggesting that chemotherapy and radiotherapy either induce or select more transcriptionally stable cells.
4.3. Trajectory of embryonic development
The development of an embryo is an extremely intricate and sophisticated process. Throughout this process, diverse signaling pathways and regulatory mechanisms collaborate to guarantee that each step takes place in the correct sequence and at the opportune time. Time-resolved scRNA-seq is a potent tool that possesses the capability to disclose the sequential activation of genes and signaling pathways during embryonic development and has significantly advanced our comprehension of the trajectory of embryonic development. It enables researchers to capture gene expression profiles at various time points during embryogenesis, construct the developmental trajectories of different cell lineages, and identify crucial regulatory events and key transcriptional factors, offering valuable insights into the dynamic alterations of cell differentiation, histogenesis, and organogenesis.87
The combination of pulse-tracking metabolic labelling with 3D in situ sequencing in TEMPOmap13 enables detection of cell differentiation progress in human induced pluripotent stem cell-derived cardiomyocytes (hiPSC-CMs) and primary human skin cells derived from neonatal foreskin. The single-cell transcriptome profiles of each cell type are traced by 5-EU before, during, and after differentiation. It is noted that the marker genes display a more rapid synthesis, nuclear output, and a slower degradation rate in the corresponding cells compared to other cell types. Since cell type marker genes are of crucial importance for specialized cellular functions, this implies that RNA dynamics regulation may prioritize the expression of the most functionally significant genes or facilitate the elimination of unrelated transcripts.
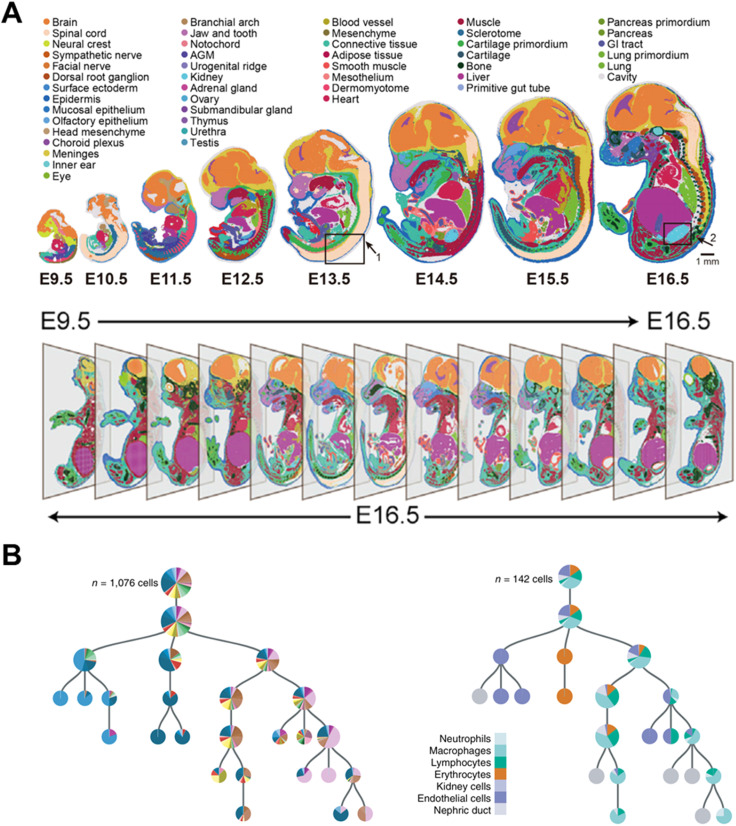
The acquisition of a cell atlas at various time points can also describe a developmental trajectory during embryogenesis.88 Chen et al. established spatial enhanced resolution omics sequencing (Stereo-seq)6 and applied it for constructing a mouse organogenesis spatiotemporal transcriptomic atlas (MOSTA). Stereo-seq documents the dynamics and orientation of single-cell transcriptional variation during mouse embryogenesis at eight time points from day 9.5 (E9.5) to day 16.5 (E16.5) (Fig. 15A). Consequently, spatial cell heterogeneity and normal or abnormal development mechanisms can be comprehensively understood during embryonic development. This strategy has also been applied to construct the developmental atlas of Zebrafish,89 Axolotl90 and Drosophila.91
Fig. 15. Applications of time-resolved scRNA-seq in studying the trajectory of embryonic development. (A) Spatiotemporal transcriptomic atlas of mouse organogenesis. This figure has been reproduced from Cell, 2022, 185, 1777–1792 e1721, with permission from Elsevier, copyright 2022.6 (B) Lineage tree for one 5-dpf larva. This figure has been reproduced from Nat Biotechnol, 2018, 36, 469–473, with permission from Springer Nature Publishing, copyright 2018.4.
Genetic barcoding strategies enable the lineage tracing in different species through linking the offspring with the parent. Spanjaard et al. utilized LINNAEUS4 for reconstructing developmental lineage trees in zebrafish larvae. As LINNAEUS can introduce genetic scars to identify the offspring, the computational reconstruction of lineage trees at the single-cell level becomes feasible, which is represented in a condensed form by indicating fractions of cell types as pie charts (Fig. 15B). Through this approach, the researcher can investigate the development of the lateral plate mesoderm and discover that putative definitive hematopoietic cells share a common lineage origin with endothelial cells. Furthermore, through the study of the various organs of adult fish, a distinct separation of the individual organs is found. And at the cellular level, immune cells from different organs are clustered together in the lineage tree.
5. Conclusions
Cells undergo continuous transformation under both physiological and pathological conditions. scRNA-seq is capable of revealing the differences of cells; however, it presents challenges in connecting the individual cell states at different time points. Although computational methods based on scRNA-seq data have been proposed for trajectory analysis, the result is based on assumptions and cannot reflect the actual situation. Experimental methods with the ability to introduce “time anchor” into the scRNA-seq library can infer specific events beyond the actual sampling time. In this review, we have provided a comprehensive overview of current time-series scRNA-seq and its applications for documenting temporal information.
The metabolic labeling chemistry focuses on detecting nascent RNAs within several hours, which is suitable for investigating the rapid-response transcripts after certain stimuli. Cytoplasmic biopsy centers on revealing the alteration of the RNA expression pattern within the same cell, therefore enabling the study of a short-term (ranging from several hours to days) cell transition. In vivo cell labeling through fluorescence and genetic barcoding-based strategies primarily investigate the diverse cell types emerging along time trajectories and the relationship between the parent and offspring, thereby identifying a long-term evolutionary trajectory. During the preparation of this review, single-cell global run-on and sequencing (scGRO-seq) was reported, where nascent RNAs are selectively labelled across genome-wide transcriptomes through a nuclear run-on reaction in the presence of 3′-(O-propargyl)-NTPs compatible with CuAAC conjugation.92 This method provides another approach for the capture of mRNAs being transcribed at the precise moment. As researchers continue to explore these cutting-edge methodologies, it is essential to consider their specific research objectives and biological questions when selecting an appropriate approach.
Despite the advancement of time-resolved scRNA-seq, there are still many directions that can be further explored in the future. Firstly, the integration of time-resolved scRNA-seq with other omics analysis is a highly active area of research. By combining transcriptomic data with epigenetic and proteomic information, researchers can gain a more comprehensive view of how individual cells function and interact within complex biological systems. Furthermore, multi-dimensional omics approaches enable the construction of more accurate models to capture the intricate trajectories of cellular processes. Moreover, multi-omics can elucidate the precise timing of various regulatory events, such as how chromatin accessibility affects transcript expression.
Secondly, the integration of time-resolved scRNA-seq with spatial transcriptome information enables a comprehensive understanding of cell dynamics within their specific spatial locations. This approach not only provides valuable insights into the molecular profiles of individual cells but also reveals crucial details about their interactions and communication within the complex microenvironment. By combining these two datasets, researchers can uncover how different cell types are distributed across tissues or organs, as well as how they transition between states in response to various stimuli. Furthermore, this integrated analysis holds great potential for advancing our knowledge of biological systems by elucidating the impact of spatial context on cellular behaviour and function.
Thirdly, it is necessary to further promote the automatic process and commercial progress of time-resolved scRNA-seq for broader applications. Currently, time-resolved scRNA-seq is in the nascent stage, and these methodologies have not been effectively promoted, lagging far behind the commercially prevalent scRNA-seq and spatial transcriptome.93–97 It is anticipated that in the near future, time-resolved scRNA-seq will become more accessible, facilitating the reconstruction of dynamic models of biological processes in both basic and clinical research.
Data availability
The type of this manuscript is a review and related data are cited. Therefore, there are no raw experiment or computational data associated with this article.
Author contributions
X.Xu and Q. Wen conceived the outline. T. Lan drew the pictures. X. Xu, Q. Wen, L. Zeng, Y. Zeng, S. Lin, M. Qiu and X. Na wrote the manuscript. C. Yang supervised the manuscript.
Conflicts of interest
There are no conflicts to declare.
Acknowledgments
This work was supported by the National Natural Science Foundation of China (22204132, 22293031), National Key Research and Development Program of China (2022YFB3205600), and the Fundamental Research Funds for the Central Universities (20720220005).
Biographies
Biography
Xing Xu.

Dr. Xing Xu received her PhD degree from Xiamen University, China in 2021 and now is a post-doctoral fellow in Xiamen University. Her current research focuses on microfluidics-based single-cell sequencing.
Biography
Qianxi Wen.

Qianxi Wen is a graduate student in Xiamen University. Her current research focuses on temporal–spatial resolved omics analysis.
Biography
Chaoyong Yang.

Prof. Chaoyong Yang is a professor at Xiamen University and Shanghai Jiao Tong University School of Medicine. He received his PhD degree from the University of Florida, and completed his postdoctoral training at the University of California, Berkeley. He is a fellow of The Royal Society of Chemistry. His research focuses on molecular engineering, molecular recognition, high throughput evolution, single cell analysis, and microfluidics.
Notes and references
- Baptista M. A. P. Dolken L. Nat. Methods. 2018;15:171–172. doi: 10.1038/nmeth.4608. [DOI] [PubMed] [Google Scholar]
- Rabani M. Levin J. Z. Fan L. Adiconis X. Raychowdhury R. Garber M. Gnirke A. Nusbaum C. Hacohen N. Friedman N. Amit I. Regev A. Nat. Biotechnol. 2011;29:436–442. doi: 10.1038/nbt.1861. [DOI] [PMC free article] [PubMed] [Google Scholar]
- Erhard F. Saliba A.-E. Lusser A. Toussaint C. Hennig T. Prusty B. K. Kirschenbaum D. Abadie K. Miska E. A. Friedel C. C. Amit I. Micura R. Dölken L. Nat. Rev. Methods Primers. 2022;2:77. doi: 10.1038/s43586-022-00157-z. [DOI] [Google Scholar]
- Spanjaard B. Hu B. Mitic N. Olivares-Chauvet P. Janjuha S. Ninov N. Junker J. P. Nat. Biotechnol. 2018;36:469–473. doi: 10.1038/nbt.4124. [DOI] [PMC free article] [PubMed] [Google Scholar]
- Cao J. Zhou W. Steemers F. Trapnell C. Shendure J. Nat. Biotechnol. 2020;38:980–988. doi: 10.1038/s41587-020-0480-9. [DOI] [PMC free article] [PubMed] [Google Scholar]
- Chen A. Liao S. Cheng M. Ma K. Wu L. Lai Y. Qiu X. Yang J. Xu J. Hao S. Wang X. Lu H. Chen X. Liu X. Huang X. Li Z. Hong Y. Jiang Y. Peng J. Liu S. Shen M. Liu C. Li Q. Yuan Y. Wei X. Zheng H. Feng W. Wang Z. Liu Y. Wang Z. Yang Y. Xiang H. Han L. Qin B. Guo P. Lai G. Munoz-Canoves P. Maxwell P. H. Thiery J. P. Wu Q. F. Zhao F. Chen B. Li M. Dai X. Wang S. Kuang H. Hui J. Wang L. Fei J. F. Wang O. Wei X. Lu H. Wang B. Liu S. Gu Y. Ni M. Zhang W. Mu F. Yin Y. Yang H. Lisby M. Cornall R. J. Mulder J. Uhlen M. Esteban M. A. Li Y. Liu L. Xu X. Wang J. Cell. 2022;185:1777–1792. doi: 10.1016/j.cell.2022.04.003. [DOI] [PubMed] [Google Scholar]
- Macosko E. Z. Basu A. Satija R. Nemesh J. Shekhar K. Goldman M. Tirosh I. Bialas A. R. Kamitaki N. Martersteck E. M. Trombetta J. J. Weitz D. A. Sanes J. R. Shalek A. K. Regev A. McCarroll S. A. Cell. 2015;161:1202–1214. doi: 10.1016/j.cell.2015.05.002. [DOI] [PMC free article] [PubMed] [Google Scholar]
- Battich N. Beumer J. de Barbanson B. Krenning L. Baron C. S. Tanenbaum M. E. Clevers H. van Oudenaarden A. Science. 2020;367:1151–1156. doi: 10.1126/science.aax3072. [DOI] [PubMed] [Google Scholar]
- Kirschenbaum D. Xie K. Ingelfinger F. Katzenelenbogen Y. Abadie K. Look T. Sheban F. Phan T. S. Li B. Zwicky P. Yofe I. David E. Mazuz K. Hou J. Chen Y. Shaim H. Shanley M. Becker S. Qian J. Colonna M. Ginhoux F. Rezvani K. Theis F. J. Yosef N. Weiss T. Weiner A. Amit I. Cell. 2024;187:149–165. doi: 10.1016/j.cell.2023.11.032. [DOI] [PubMed] [Google Scholar]
- Lin S. Yin K. Zhang Y. Lin F. Chen X. Zeng X. Guo X. Zhang H. Song J. Yang C. Nat. Commun. 2023;14:1272. doi: 10.1038/s41467-023-36902-5. [DOI] [PMC free article] [PubMed] [Google Scholar]
- Qiu Q. Hu P. Qiu X. Govek K. W. Camara P. G. Wu H. Nat. Methods. 2020;17:991–1001. doi: 10.1038/s41592-020-0935-4. [DOI] [PMC free article] [PubMed] [Google Scholar]
- Yin K. Zhao M. Lin L. Chen Y. Huang S. Zhu C. Liang X. Lin F. Wei H. Zeng H. Zhu Z. Song J. Yang C. Small Methods. 2022;6:e2200341. doi: 10.1002/smtd.202200341. [DOI] [PubMed] [Google Scholar]
- Ren J. Zhou H. Zeng H. Wang C. K. Huang J. Qiu X. Sui X. Li Q. Wu X. Lin Z. Lo J. A. Maher K. He Y. Tang X. Lam J. Chen H. Li B. Fisher D. E. Liu J. Wang X. Nat. Methods. 2023;20:695–705. doi: 10.1038/s41592-023-01829-8. [DOI] [PMC free article] [PubMed] [Google Scholar]
- Gehart H. van Es J. H. Hamer K. Beumer J. Kretzschmar K. Dekkers J. F. Rios A. Clevers H. Cell. 2019;176:1158–1173. doi: 10.1016/j.cell.2018.12.029. [DOI] [PubMed] [Google Scholar]
- Marcuccio F. Chau C. C. Tanner G. Elpidorou M. Finetti M. A. Ajaib S. Taylor M. Lascelles C. Carr I. Macaulay I. Stead L. F. Actis P. Sci. Adv. 2024;10:eadl0515. doi: 10.1126/sciadv.adl0515. [DOI] [PMC free article] [PubMed] [Google Scholar]
- Chen W. Guillaume-Gentil O. Rainer P. Y. Gabelein C. G. Saelens W. Gardeux V. Klaeger A. Dainese R. Zachara M. Zambelli T. Vorholt J. A. Deplancke B. Nature. 2022;608:733–740. doi: 10.1038/s41586-022-05046-9. [DOI] [PMC free article] [PubMed] [Google Scholar]
- Bues J. Biocanin M. Pezoldt J. Dainese R. Chrisnandy A. Rezakhani S. Saelens W. Gardeux V. Gupta R. Sarkis R. Russeil J. Saeys Y. Amstad E. Claassen M. Lutolf M. P. Deplancke B. Nat. Methods. 2022;19:323–330. doi: 10.1038/s41592-021-01391-1. [DOI] [PubMed] [Google Scholar]
- Liu Y. Huang K. Chen W. Curr. Opin. Biotechnol. 2024;85:103060. doi: 10.1016/j.copbio.2023.103060. [DOI] [PubMed] [Google Scholar]
- Gupta P. B. Fillmore C. M. Jiang G. Shapira S. D. Tao K. Kuperwasser C. Lander E. S. Cell. 2011;146:633–644. doi: 10.1016/j.cell.2011.07.026. [DOI] [PubMed] [Google Scholar]
- Eling N. Morgan M. D. Marioni J. C. Nat. Rev. Genet. 2019;20:536–548. doi: 10.1038/s41576-019-0130-6. [DOI] [PMC free article] [PubMed] [Google Scholar]
- Bowling S. Sritharan D. Osorio F. G. Nguyen M. Cheung P. Rodriguez-Fraticelli A. Patel S. Yuan W. C. Fujiwara Y. Li B. E. Orkin S. H. Hormoz S. Camargo F. D. Cell. 2020;181:1693–1694. doi: 10.1016/j.cell.2020.06.018. [DOI] [PMC free article] [PubMed] [Google Scholar]
- Gasch A. P. Yu F. B. Hose J. Escalante L. E. Place M. Bacher R. Kanbar J. Ciobanu D. Sandor L. Grigoriev I. V. Kendziorski C. Quake S. R. McClean M. N. PLoS Biol. 2017;15:e2004050. doi: 10.1371/journal.pbio.2004050. [DOI] [PMC free article] [PubMed] [Google Scholar]
- Zou Z. Long X. Zhao Q. Zheng Y. Song M. Ma S. Jing Y. Wang S. He Y. Esteban C. R. Yu N. Huang J. Chan P. Chen T. Izpisua Belmonte J. C. Zhang W. Qu J. Liu G. H. Dev. Cell. 2021;56:383–397. doi: 10.1016/j.devcel.2020.11.002. [DOI] [PubMed] [Google Scholar]
- de Nadal E. Ammerer G. Posas F. Nat. Rev. Genet. 2011;12:833–845. doi: 10.1038/nrg3055. [DOI] [PubMed] [Google Scholar]
- Hamatani T. Carter M. G. Sharov A. A. Ko M. S. Dev. Cell. 2004;6:117–131. doi: 10.1016/S1534-5807(03)00373-3. [DOI] [PubMed] [Google Scholar]
- Chen H. Ye F. Guo G. Cell. Mol. Immunol. 2019;16:242–249. doi: 10.1038/s41423-019-0214-4. [DOI] [PMC free article] [PubMed] [Google Scholar]
- Han J. DePinho R. A. Maitra A. Nat. Rev. Gastroenterol. Hepatol. 2021;18:451–452. doi: 10.1038/s41575-021-00471-z. [DOI] [PMC free article] [PubMed] [Google Scholar]
- Kuchina A. Brettner L. M. Paleologu L. Roco C. M. Rosenberg A. B. Carignano A. Kibler R. Hirano M. DePaolo R. W. Seelig G. Science. 2021;371(6531):eaba5257. doi: 10.1126/science.aba5257. [DOI] [PMC free article] [PubMed] [Google Scholar]
- Paik D. T. Cho S. Tian L. Chang H. Y. Wu J. C. Nat. Rev. Cardiol. 2020;17:457–473. doi: 10.1038/s41569-020-0359-y. [DOI] [PMC free article] [PubMed] [Google Scholar]
- Huang D. Ma N. Li X. Gou Y. Duan Y. Liu B. Xia J. Zhao X. Wang X. Li Q. Rao J. Zhang X. J. Hematol. Oncol. 2023;16:98. doi: 10.1186/s13045-023-01494-6. [DOI] [PMC free article] [PubMed] [Google Scholar]
- Ding J. Sharon N. Bar-Joseph Z. Nat. Rev. Genet. 2022;23:355–368. doi: 10.1038/s41576-021-00444-7. [DOI] [PMC free article] [PubMed] [Google Scholar]
- Bendall S. C. Davis K. L. Amir el A. D. Tadmor M. D. Simonds E. F. Chen T. J. Shenfeld D. K. Nolan G. P. Pe'er D. Cell. 2014;157:714–725. doi: 10.1016/j.cell.2014.04.005. [DOI] [PMC free article] [PubMed] [Google Scholar]
- Bergen V. Lange M. Peidli S. Wolf F. A. Theis F. J. Nat. Biotechnol. 2020;38:1408–1414. doi: 10.1038/s41587-020-0591-3. [DOI] [PubMed] [Google Scholar]
- Chen Z. King W. C. Hwang A. Gerstein M. Zhang J. Sci. Adv. 2022;8:eabq3745. doi: 10.1126/sciadv.abq3745. [DOI] [PMC free article] [PubMed] [Google Scholar]
- Gorin G. Fang M. Chari T. Pachter L. PLoS Comput. Biol. 2022;18:e1010492. doi: 10.1371/journal.pcbi.1010492. [DOI] [PMC free article] [PubMed] [Google Scholar]
- Trapnell C. Cacchiarelli D. Grimsby J. Pokharel P. Li S. Morse M. Lennon N. J. Livak K. J. Mikkelsen T. S. Rinn J. L. Nat. Biotechnol. 2014;32:381–386. doi: 10.1038/nbt.2859. [DOI] [PMC free article] [PubMed] [Google Scholar]
- La Manno G. Soldatov R. Zeisel A. Braun E. Hochgerner H. Petukhov V. Lidschreiber K. Kastriti M. E. Lonnerberg P. Furlan A. Fan J. Borm L. E. Liu Z. van Bruggen D. Guo J. He X. Barker R. Sundstrom E. Castelo-Branco G. Cramer P. Adameyko I. Linnarsson S. Kharchenko P. V. Nature. 2018;560:494–498. doi: 10.1038/s41586-018-0414-6. [DOI] [PMC free article] [PubMed] [Google Scholar]
- Tang F. Barbacioru C. Wang Y. Nordman E. Lee C. Xu N. Wang X. Bodeau J. Tuch B. B. Siddiqui A. Lao K. Surani M. A. Nat. Methods. 2009;6:377–382. doi: 10.1038/nmeth.1315. [DOI] [PubMed] [Google Scholar]
- Chen Y. Song J. Ruan Q. Zeng X. Wu L. Cai L. Wang X. Yang C. Small Methods. 2021;5:e2100111. doi: 10.1002/smtd.202100111. [DOI] [PubMed] [Google Scholar]
- Yeo A. T. Rawal S. Delcuze B. Christofides A. Atayde A. Strauss L. Balaj L. Rogers V. A. Uhlmann E. J. Varma H. Carter B. S. Boussiotis V. A. Charest A. Nat. Immunol. 2022;23:971–984. doi: 10.1038/s41590-022-01215-0. [DOI] [PMC free article] [PubMed] [Google Scholar]
- Xu X. Wang J. Wu L. Guo J. Song Y. Tian T. Wang W. Zhu Z. Yang C. Small. 2020;16:e1903905. doi: 10.1002/smll.201903905. [DOI] [PubMed] [Google Scholar]
- Picelli S. Bjorklund A. K. Faridani O. R. Sagasser S. Winberg G. Sandberg R. Nat. Methods. 2013;10:1096–1098. doi: 10.1038/nmeth.2639. [DOI] [PubMed] [Google Scholar]
- Xu X. Zhang Q. Song J. Ruan Q. Ruan W. Chen Y. Yang J. Zhang X. Song Y. Zhu Z. Yang C. Anal. Chem. 2020;92:8599–8606. doi: 10.1021/acs.analchem.0c01613. [DOI] [PubMed] [Google Scholar]
- Xin Y. Kim J. Ni M. Wei Y. Okamoto H. Lee J. Adler C. Cavino K. Murphy A. J. Yancopoulos G. D. Lin H. C. Gromada J. Proc. Natl. Acad. Sci. U. S. A. 2016;113:3293–3298. doi: 10.1073/pnas.1602306113. [DOI] [PMC free article] [PubMed] [Google Scholar]
- Sarma M. Lee J. Ma S. Li S. Lu C. Lab Chip. 2019;19:1247–1256. doi: 10.1039/C8LC00967H. [DOI] [PMC free article] [PubMed] [Google Scholar]
- Hagemann-Jensen M. Ziegenhain C. Chen P. Ramskold D. Hendriks G. J. Larsson A. J. M. Faridani O. R. Sandberg R. Nat. Biotechnol. 2020;38:708–714. doi: 10.1038/s41587-020-0497-0. [DOI] [PubMed] [Google Scholar]
- Hagemann-Jensen M. Ziegenhain C. Sandberg R. Nat. Biotechnol. 2022;40:1452–1457. doi: 10.1038/s41587-022-01311-4. [DOI] [PMC free article] [PubMed] [Google Scholar]
- Hahaut V. Pavlinic D. Carbone W. Schuierer S. Balmer P. Quinodoz M. Renner M. Roma G. Cowan C. S. Picelli S. Nat. Biotechnol. 2022;40:1447–1451. doi: 10.1038/s41587-022-01312-3. [DOI] [PMC free article] [PubMed] [Google Scholar]
- Fan X. Tang D. Liao Y. Li P. Zhang Y. Wang M. Liang F. Wang X. Gao Y. Wen L. Wang D. Wang Y. Tang F. PLoS Biol. 2020;18:e3001017. doi: 10.1371/journal.pbio.3001017. [DOI] [PMC free article] [PubMed] [Google Scholar]
- Liao Y. Liu Z. Zhang Y. Lu P. Wen L. Tang F. Cell Discovery. 2023;9:5. doi: 10.1038/s41421-022-00500-4. [DOI] [PMC free article] [PubMed] [Google Scholar]
- Salmen F. De Jonghe J. Kaminski T. S. Alemany A. Parada G. E. Verity-Legg J. Yanagida A. Kohler T. N. Battich N. van den Brekel F. Ellermann A. L. Arias A. M. Nichols J. Hemberg M. Hollfelder F. van Oudenaarden A. Nat. Biotechnol. 2022;40:1780–1793. doi: 10.1038/s41587-022-01361-8. [DOI] [PMC free article] [PubMed] [Google Scholar]
- Islam S. Kjallquist U. Moliner A. Zajac P. Fan J. B. Lonnerberg P. Linnarsson S. Genome Res. 2011;21:1160–1167. doi: 10.1101/gr.110882.110. [DOI] [PMC free article] [PubMed] [Google Scholar]
- Hashimshony T. Senderovich N. Avital G. Klochendler A. de Leeuw Y. Anavy L. Gennert D. Li S. Livak K. J. Rozenblatt-Rosen O. Dor Y. Regev A. Yanai I. Genome Biol. 2016;17:77. doi: 10.1186/s13059-016-0938-8. [DOI] [PMC free article] [PubMed] [Google Scholar]
- Jaitin D. A. Kenigsberg E. Keren-Shaul H. Elefant N. Paul F. Zaretsky I. Mildner A. Cohen N. Jung S. Tanay A. Amit I. Science. 2014;343:776–779. doi: 10.1126/science.1247651. [DOI] [PMC free article] [PubMed] [Google Scholar]
- Keren-Shaul H. Kenigsberg E. Jaitin D. A. David E. Paul F. Tanay A. Amit I. Nat. Protoc. 2019;14:1841–1862. doi: 10.1038/s41596-019-0164-4. [DOI] [PubMed] [Google Scholar]
- Cao J. Packer J. S. Ramani V. Cusanovich D. A. Huynh C. Daza R. Qiu X. Lee C. Furlan S. N. Steemers F. J. Adey A. Waterston R. H. Trapnell C. Shendure J. Science. 2017;357:661–667. doi: 10.1126/science.aam8940. [DOI] [PMC free article] [PubMed] [Google Scholar]
- Cao J. Spielmann M. Qiu X. Huang X. Ibrahim D. M. Hill A. J. Zhang F. Mundlos S. Christiansen L. Steemers F. J. Trapnell C. Shendure J. Nature. 2019;566:496–502. doi: 10.1038/s41586-019-0969-x. [DOI] [PMC free article] [PubMed] [Google Scholar]
- Biocanin M. Bues J. Dainese R. Amstad E. Deplancke B. Lab Chip. 2019;19:1610–1620. doi: 10.1039/C9LC00014C. [DOI] [PubMed] [Google Scholar]
- Stephenson W. Donlin L. T. Butler A. Rozo C. Bracken B. Rashidfarrokhi A. Goodman S. M. Ivashkiv L. B. Bykerk V. P. Orange D. E. Darnell R. B. Swerdlow H. P. Satija R. Nat. Commun. 2018;9:791. doi: 10.1038/s41467-017-02659-x. [DOI] [PMC free article] [PubMed] [Google Scholar]
- Klein A. M. Mazutis L. Akartuna I. Tallapragada N. Veres A. Li V. Peshkin L. Weitz D. A. Kirschner M. W. Cell. 2015;161:1187–1201. doi: 10.1016/j.cell.2015.04.044. [DOI] [PMC free article] [PubMed] [Google Scholar]
- Datlinger P. Rendeiro A. F. Boenke T. Senekowitsch M. Krausgruber T. Barreca D. Bock C. Nat. Methods. 2021;18:635–642. doi: 10.1038/s41592-021-01153-z. [DOI] [PMC free article] [PubMed] [Google Scholar]
- Dinçaslan F. B. Ngang S. W. Y. Tan R. Z. Cheow L. F. bioRxiv. 2024 doi: 10.1101/2024.03.12.584729. [DOI] [Google Scholar]
- Meng H. Zhang T. Wang Z. Zhu Y. Yu Y. Chen H. Chen J. Wang F. Yu Y. Hua X. Wang Y. Angew Chem. Int. Ed. Engl. 2024;63:e202400538. doi: 10.1002/anie.202400538. [DOI] [PubMed] [Google Scholar]
- Xu Z. Zhang T. Chen H. Zhu Y. Lv Y. Zhang S. Chen J. Chen H. Yang L. Jiang W. Ni S. Lu F. Wang Z. Yang H. Dong L. Chen F. Zhang H. Chen Y. Liu J. Zhang D. Fan L. Guo G. Wang Y. Nat. Commun. 2023;14:2734. doi: 10.1038/s41467-023-38409-5. [DOI] [PMC free article] [PubMed] [Google Scholar]
- Gierahn T. M. Wadsworth 2nd M. H. Hughes T. K. Bryson B. D. Butler A. Satija R. Fortune S. Love J. C. Shalek A. K. Nat. Methods. 2017;14:395–398. doi: 10.1038/nmeth.4179. [DOI] [PMC free article] [PubMed] [Google Scholar]
- Drake R. S. Villanueva M. A. Vilme M. Russo D. D. Navia A. Love J. C. Shalek A. K. Methods Mol. Biol. 2023;2584:57–104. doi: 10.1007/978-1-0716-2756-3_3. [DOI] [PMC free article] [PubMed] [Google Scholar]
- Yin K. Zhao M. Xu Y. Zheng Z. Huang S. Liang D. Dong H. Guo Y. Lin L. Song J. Zhang H. Zheng J. Zhu Z. Yang C. Anal. Chem. 2024;96:6301–6310. doi: 10.1021/acs.analchem.3c05785. [DOI] [PubMed] [Google Scholar]
- Han X. Wang R. Zhou Y. Fei L. Sun H. Lai S. Saadatpour A. Zhou Z. Chen H. Ye F. Huang D. Xu Y. Huang W. Jiang M. Jiang X. Mao J. Chen Y. Lu C. Xie J. Fang Q. Wang Y. Yue R. Li T. Huang H. Orkin S. H. Yuan G. C. Chen M. Guo G. Cell. 2018;173:1307. doi: 10.1016/j.cell.2018.05.012. [DOI] [PubMed] [Google Scholar]
- Chen H. Liao Y. Zhang G. Sun Z. Yang L. Fang X. Sun H. Ma L. Fu Y. Li J. Guo Q. Han X. Guo G. Cell Discovery. 2021;7:107. doi: 10.1038/s41421-021-00333-7. [DOI] [PMC free article] [PubMed] [Google Scholar]
- Ye F. Zhang S. Fu Y. Yang L. Zhang G. Wu Y. Pan J. Chen H. Wang X. Ma L. Niu H. Jiang M. Zhang T. Jia D. Wang J. Wang Y. Han X. Guo G. Cell Discovery. 2024;10:33. doi: 10.1038/s41421-023-00642-z. [DOI] [PMC free article] [PubMed] [Google Scholar]
- Zhang M. Zou Y. Xu X. Zhang X. Gao M. Song J. Huang P. Chen Q. Zhu Z. Lin W. Zare R. N. Yang C. Nat. Commun. 2020;11:2118. doi: 10.1038/s41467-020-15765-0. [DOI] [PMC free article] [PubMed] [Google Scholar]
- Xu X. Zhang M. Zhang X. Liu Y. Cai L. Zhang Q. Chen Q. Lin L. Lin S. Song Y. Zhu Z. Yang C. Anal. Chem. 2022;94:8164–8173. doi: 10.1021/acs.analchem.1c05312. [DOI] [PubMed] [Google Scholar]
- Cheng Y. H. Chen Y. C. Lin E. Brien R. Jung S. Chen Y. T. Lee W. Hao Z. Sahoo S. Min Kang H. Cong J. Burness M. Nagrath S. M S. W. Yoon E. Nat. Commun. 2019;10:2163. doi: 10.1038/s41467-019-10122-2. [DOI] [PMC free article] [PubMed] [Google Scholar]
- Lin S. Liu Y. Zhang M. Xu X. Chen Y. Zhang H. Yang C. Lab Chip. 2021;21:3829–3849. doi: 10.1039/D1LC00607J. [DOI] [PubMed] [Google Scholar]
- Erhard F. Baptista M. A. P. Krammer T. Hennig T. Lange M. Arampatzi P. Jurges C. S. Theis F. J. Saliba A. E. Dolken L. Nature. 2019;571:419–423. doi: 10.1038/s41586-019-1369-y. [DOI] [PubMed] [Google Scholar]
- Hendriks G. J. Jung L. A. Larsson A. J. M. Lidschreiber M. Andersson Forsman O. Lidschreiber K. Cramer P. Sandberg R. Nat. Commun. 2019;10:3138. doi: 10.1038/s41467-019-11028-9. [DOI] [PMC free article] [PubMed] [Google Scholar]
- Quek Y. J. Tay A. Adv. Mater. 2024;36:e2314184. doi: 10.1002/adma.202314184. [DOI] [PubMed] [Google Scholar]
- Meister A. Gabi M. Behr P. Studer P. Voros J. Niedermann P. Bitterli J. Polesel-Maris J. Liley M. Heinzelmann H. Zambelli T. Nano Lett. 2009;9:2501–2507. doi: 10.1021/nl901384x. [DOI] [PubMed] [Google Scholar]
- Guillaume-Gentil O. Potthoff E. Ossola D. Franz C. M. Zambelli T. Vorholt J. A. Trends Biotechnol. 2014;32:381–388. doi: 10.1016/j.tibtech.2014.04.008. [DOI] [PubMed] [Google Scholar]
- Byrnes L. E. Wong D. M. Subramaniam M. Meyer N. P. Gilchrist C. L. Knox S. M. Tward A. D. Ye C. J. Sneddon J. B. Nat. Commun. 2018;9:3922. doi: 10.1038/s41467-018-06176-3. [DOI] [PMC free article] [PubMed] [Google Scholar]
- McKenna A. Findlay G. M. Gagnon J. A. Horwitz M. S. Schier A. F. Shendure J. Science. 2016;353:aaf7907. doi: 10.1126/science.aaf7907. [DOI] [PMC free article] [PubMed] [Google Scholar]
- Alemany A. Florescu M. Baron C. S. Peterson-Maduro J. van Oudenaarden A. Nature. 2018;556:108–112. doi: 10.1038/nature25969. [DOI] [PubMed] [Google Scholar]
- Taniguchi K. Karin M. Nat. Rev. Immunol. 2018;18:309–324. doi: 10.1038/nri.2017.142. [DOI] [PubMed] [Google Scholar]
- Aibar S. Gonzalez-Blas C. B. Moerman T. Huynh-Thu V. A. Imrichova H. Hulselmans G. Rambow F. Marine J. C. Geurts P. Aerts J. van den Oord J. Atak Z. K. Wouters J. Aerts S. Nat. Methods. 2017;14:1083–1086. doi: 10.1038/nmeth.4463. [DOI] [PMC free article] [PubMed] [Google Scholar]
- Van de Sande B. Flerin C. Davie K. De Waegeneer M. Hulselmans G. Aibar S. Seurinck R. Saelens W. Cannoodt R. Rouchon Q. Verbeiren T. De Maeyer D. Reumers J. Saeys Y. Aerts S. Nat. Protoc. 2020;15:2247–2276. doi: 10.1038/s41596-020-0336-2. [DOI] [PubMed] [Google Scholar]
- Wang L. Babikir H. Muller S. Yagnik G. Shamardani K. Catalan F. Kohanbash G. Alvarado B. Di Lullo E. Kriegstein A. Shah S. Wadhwa H. Chang S. M. Phillips J. J. Aghi M. K. Diaz A. A. Cancer Discovery. 2019;9:1708–1719. doi: 10.1158/2159-8290.CD-19-0329. [DOI] [PMC free article] [PubMed] [Google Scholar]
- Qiu C. Cao J. Martin B. K. Li T. Welsh I. C. Srivatsan S. Huang X. Calderon D. Noble W. S. Disteche C. M. Murray S. A. Spielmann M. Moens C. B. Trapnell C. Shendure J. Nat. Genet. 2022;54:328–341. doi: 10.1038/s41588-022-01018-x. [DOI] [PMC free article] [PubMed] [Google Scholar]
- Mittnenzweig M. Mayshar Y. Cheng S. Ben-Yair R. Hadas R. Rais Y. Chomsky E. Reines N. Uzonyi A. Lumerman L. Lifshitz A. Mukamel Z. Orenbuch A. H. Tanay A. Stelzer Y. Cell. 2021;184:2825–2842. doi: 10.1016/j.cell.2021.04.004. [DOI] [PMC free article] [PubMed] [Google Scholar]
- Liu C. Li R. Li Y. Lin X. Zhao K. Liu Q. Wang S. Yang X. Shi X. Ma Y. Pei C. Wang H. Bao W. Hui J. Yang T. Xu Z. Lai T. Berberoglu M. A. Sahu S. K. Esteban M. A. Ma K. Fan G. Li Y. Liu S. Chen A. Xu X. Dong Z. Liu L. Dev. Cell. 2022;57:1284–1298. doi: 10.1016/j.devcel.2022.04.009. [DOI] [PubMed] [Google Scholar]
- Wei X. Fu S. Li H. Liu Y. Wang S. Feng W. Yang Y. Liu X. Zeng Y.-Y. Cheng M. Lai Y. Qiu X. Wu L. Zhang N. Jiang Y. Xu J. Su X. Peng C. Han L. Lou W. P.-K. Liu C. Yuan Y. Ma K. Yang T. Pan X. Gao S. Chen A. Esteban M. A. Yang H. Wang J. Fan G. Liu L. Chen L. Xu X. Fei J.-F. Gu Y. Science. 2022;377(6610):eabp9444. doi: 10.1126/science.abp9444. [DOI] [PubMed] [Google Scholar]
- Wang M. Hu Q. Lv T. Wang Y. Lan Q. Xiang R. Tu Z. Wei Y. Han K. Shi C. Guo J. Liu C. Yang T. Du W. An Y. Cheng M. Xu J. Lu H. Li W. Zhang S. Chen A. Chen W. Li Y. Wang X. Xu X. Hu Y. Liu L. Dev. Cell. 2022;57:1271–1283. doi: 10.1016/j.devcel.2022.04.006. [DOI] [PubMed] [Google Scholar]
- Mahat D. B. Tippens N. D. Martin-Rufino J. D. Waterton S. K. Fu J. Y. Blatt S. E. Sharp P. A. Nature. 2024;631:216–223. doi: 10.1038/s41586-024-07517-7. [DOI] [PMC free article] [PubMed] [Google Scholar]
- Wang X. Allen W. E. Wright M. A. Sylwestrak E. L. Samusik N. Vesuna S. Evans K. Liu C. Ramakrishnan C. Liu J. Nolan G. P. Bava F. A. Deisseroth K. Science. 2018;361(6400):eaat5691. doi: 10.1126/science.aat5691. [DOI] [PMC free article] [PubMed] [Google Scholar]
- Chen K. H. Boettiger A. N. Moffitt J. R. Wang S. Zhuang X. Science. 2015;348:aaa6090. doi: 10.1126/science.aaa6090. [DOI] [PMC free article] [PubMed] [Google Scholar]
- Stahl P. L. Salmen F. Vickovic S. Lundmark A. Navarro J. F. Magnusson J. Giacomello S. Asp M. Westholm J. O. Huss M. Mollbrink A. Linnarsson S. Codeluppi S. Borg A. Ponten F. Costea P. I. Sahlen P. Mulder J. Bergmann O. Lundeberg J. Frisen J. Science. 2016;353:78–82. doi: 10.1126/science.aaf2403. [DOI] [PubMed] [Google Scholar]
- Su G. Qin X. Enninful A. Bai Z. Deng Y. Liu Y. Fan R. STAR Protoc. 2021;2:100532. doi: 10.1016/j.xpro.2021.100532. [DOI] [PMC free article] [PubMed] [Google Scholar]
- Stickels R. R. Murray E. Kumar P. Li J. Marshall J. L. Di Bella D. J. Arlotta P. Macosko E. Z. Chen F. Nat. Biotechnol. 2021;39:313–319. doi: 10.1038/s41587-020-0739-1. [DOI] [PMC free article] [PubMed] [Google Scholar]
Associated Data
This section collects any data citations, data availability statements, or supplementary materials included in this article.
Data Availability Statement
The type of this manuscript is a review and related data are cited. Therefore, there are no raw experiment or computational data associated with this article.


