

Abstract
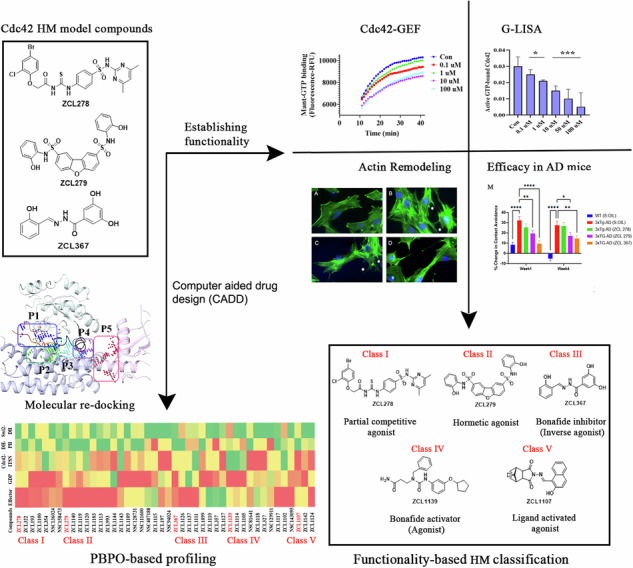
Maintaining body homeostasis is the ultimate key to health. There are rich resources of bioactive materials for the functionality of homeostatic modulators (HMs) from both natural and synthetic chemical repertories1–3. HMs are powerful modern therapeutics for human diseases including neuropsychiatric diseases, mental disorders, and drug addiction (e.g. Buspirone and benzodiazepines)4–7. However, the identification of therapeutic HMs are often unpredictable and limited to membrane protein receptors and ion channels. Based on a serendipitously encountered small molecule ZCL278 with partial agonist (PA) profile as a model compound8–10, the Mant-GTP fluorophore-based Cdc42-GEF (guanine nucleotide exchange factor) screening uncovered a near holistic spectrum of HMs for Cdc42, a cytoplasmic small GTPase in the Ras superfamily11,12. We categorized these HMs as functionally distinct, with some previously understudied classes: Class I-competitive PAs, Class II-hormetic agonists, Class III-bona fide inhibitors, Class IV-bona fide activators, and Class V-ligand-enhanced agonists. The model HMs elicited striking biological functionalities in modulating bradykinin activation of Cdc42 signaling as well as actin remodeling while they ameliorated Alzheimer’s disease-like social behavior in mouse model. Furthermore, molecular structural modeling analyses led to the concept of preferential binding pocket order (PBPO) for profiling HMs that target Cdc42 complexed with intersectin (ITSN), a GEF selectively activating Cdc42. Remarkably, the PBPO enabled a prediction of HM class that mimics the pharmacological functionality. Therefore, our study highlights a model path to actively capture different classes of HM to broaden therapeutic landscape.
Subject terms: Kinases, Cheminformatics, GTP-binding protein regulators, Mechanism of action, Target validation
Homeostatic modulators (HMs) are powerful modern therapeutics for human diseases including neuropsychiatric diseases, mental disorders, and drug addiction; however, their discovery is often unpredictable and limited to membrane protein receptors and ion channels. Here, the authors analyze a spectrum of novel HMs for Cdc42, a cytoplasmic small GTPase in the Ras superfamily, with striking biological functionalities and potential therapeutic applications.
Introduction
The characteristic features of homeostatic modulators (HMs) such as partial agonists (PAs) are that they often can activate receptors to give a desired response when inadequate amounts of the endogenous ligand are present, or they can lessen the overstimulation of receptors when excess amounts of the endogenous ligands are produced in the body pathologically4. PAs often induce less desensitization and can be powerful modulators to help restore body’s homeostasis5. However, their current uses are limited to membrane proteins13, and PAs for targeting cytoplasmic proteins are rare.
Previously, small molecule modulator (SMM) ZCL278 was discovered in a computer-assisted high throughput in silico screening to inhibit Cdc42-intersectin (ITSN) interactions8. ZCL278 regulates Cdc42 mediated filopodia and actin cytoskeletal remodeling8. As an important element in the epidermal growth factor (EGF) and Ras oncogene signaling, Cdc42 promotes cancer cell proliferation and migration, which can be suppressed by ZCL278 and another SMM ZCL367 targeting the same pharmacophore10. However, serendipitously, it was observed that ZCL278 can also activate Cdc42 under certain conditions and appeared to display PA features10.
Results
Identification of novel HMs on Cdc42-ITSN signaling
To determine whether this finding from the above reports represented a random encounter of PA or whether biologically significant PAs can be widely captured, we screened the same reported chemical libraries for compounds that display the same or similar PA features employing an Mant-GTP fluorophore-based Cdc42-GEF assay platform. Supporting these studies, ZCL278 promoted GTP loading in the absence of GEF, but inhibited GTP loading in the presence of GEF (Fig. 1A, B). While ZCL367 inhibited Cdc42 GTP loading with or without the presence of an activating GEF (Fig. 1E, F), some compounds display features that go beyond the traditional categories of Cdc42 agonists or antagonists. For example, while ZCL279 did show a trend of increasing GTP loading progressively up to 10 uM concentration, and the experiments have been highly repeatable, the increases were not substantial (Fig. 1C, D). We then calculated the slopes as shown in Fig. S1, which confirmed our observation that ZCL279 promoted Cdc42 GTP loading at lower concentrations and significant inhibition at higher concentrations. The reversal occurred between 10 uM and 100 uM. Experiments with ZCL279 treatment at 50 uM also showed significant inhibition for GTP loading.
Fig. 1. Biochemical functionality of agonistic, hormetic and antagonistic effects of HM model compounds in vitro.

Cdc42 HM model compounds regulate Cdc42 GTP loading and its GEF-mediated activation. ZCL278 and ZCL279 (at low concentrations) increase Cdc42 GTP loading while ZCL367 decreases Cdc42 GTP loading, A ZCL278, C ZCL279 and E ZCL367 without GEF. ZCL278, ZCL279 (at high concentrations) and ZCL367 decrease GEF-mediated Cdc42 GTP loading, B ZCL278, D ZCL279 and F ZCL367 with GEF. HM model compounds act through GEF like mechanism, The amount of GTP loading on Cdc42 for ITSN as a full agonist were comparable to those for HMs in different concentrations (0.01–1 µM) of G ZCL278, H ZCL279 and I ZCL367 respectively. Control for all samples without ITSN was DMSO and Cdc42, for all samples with GEF was DMSO, Cdc42 and ITSN. All data are presented as mean ± SEM from duplicates or triplicates in at least two independent experiments. ANOVA compared treatments to their respective control (*p < 0.04, **p < 0.005, ***p < 0.0007, ****p < 0.0001). The GEF reaction was performed using the relative fluorescence unit (RFU) intensity of Mant-GTP exchange that monitors GDP release during the exchange reaction after treatment by different concentrations (0.1–100 µM) of ZCL278, ZCL279 and ZCL367 on Cdc42 in absence or presence of ITSN.
This feature of ZCL279 is reminiscent of biphasic, hormetic chemicals14. Using ITSN as reference of endogenous full agonist, ZCL278 and ZCL279 displayed PA features whereas ZCL367 is a bona fide Cdc42 inhibitor or inverse agonist (IA) (Fig. 1G–I). The data from GTPase-Glo™ assay15, which quantitates the amount of GTP remaining after a GTPase reaction, was consistent with HM model compounds as Cdc42-GEF modulators. Therefore, these initial studies provided a foundation with three model classes of Cdc42 modulators, some of which, such as ZCL279, were previously understudied.
Structural simulation of binding mechanisms of different Cdc42-ITSN HM classes
These findings raised the intriguing possibility that there may be more categories of HMs in the existing SMM libraries, and these three model classes of Cdc42 modulators can possibly be defined by their distinct binding mechanisms using computer-aided drug design (CADD) analysis.
We employed SiteMAP of Schrödinger software to identify the top ranked potential protein binding pockets at the interface of Cdc42-ITSN (PDB code: 3QBV). Specific residues and site scores for each binding pocket are summarized (see Supplementary Table S1 and Figs. S2 and S3). For Cdc42 not complexed with ITSN, three different binding pockets were detected, which included the GDP binding site on Cdc42, a region adjacent to the GDP binding site, and the specific residues of the structural motifs “Switch I” (Val36, Phe37) and “Switch II” (Ala59, Tyr64, Leu67, Leu70, Ser71). We named these detected pockets as “GDP”, “Effector”, and “Switch 1&2” pockets, respectively (Fig. 2A). For Cdc42-ITSN complex, besides GDP and Effector pockets, additional three binding pockets were identified including “Cdc42-DH” domain, “DH-PH” domain of ITSN, and “Switch 2 of Cdc42 and DH” domain of ITSN (Fig. 2C).
Fig. 2. Binding modes of Cdc42 HM model compounds.

Different predicted binding pockets for Cdc42 HM model compounds. A, C 3D structural illustration of different drug-binding pocket of Cdc42 (transparent cyan, switch 1 (a.a.24-40) region is in orange color & switch 2 (a.a.57-76) region in black color) and Cdc42-ITSN complex (DH and PH domain of ITSN are shown purple and pink ribbons) (PDB: 3QBV). The GDP, effector and switch1&2 binding pockets for Cdc42 and five binding pockets including GDP, Effector, Cdc42-DH domain of ITSN, DH-PH domain of ITSN and switch2 of Cdc42 and DH domain of ITSN were detected. (Effector and GDP pockets were the same for Cdc42 and Cdc42-ITSN). Cdc42 model compounds bind preferably in different binding pockets. B, D Schematic diagrams of preferential binding pockets for ZCL278, ZCL279 and ZCL367 for Cdc42 and Cdc42-ITSN complex. First and second preferential binding pockets are shown by solid and dotted lines respectively. ZCL278 and ZCL279 bind preferably to GDP pocket while ZCL367 preferentially binds Effector pocket of Cdc42. The second preferential pockets of Cdc42 for ZCL278, ZCL279 and ZCL367 are Switch 1&2, Effector and GDP pockets respectively. In the presence of ITSN, for ZCL278 and ZCL279, first preferential binding pocket of Cdc42-ITSN complex is Effector and the second preferential pocket is Cdc42-DH domain of ITSN pocket while ZCL367 binds to GDP pocket and effector pocket preferably. E, F Superimpose of ZCL278 (green), ZCL279 (purple) and ZCL367 (red) in Cdc42 and Cdc42-ITSN complex. G–L Cdc42 HM model compounds show different poses with a certain extent of overlap with each other. G, I ZCL278 (green) and ZCL279 (purple) bind to GDP pocket of CdC42 via two hydrogen bonds with Lys16, GLy15, as well as hydrophobic interactions with Val14, Ala13 and Val33 of Cdc42. K ZCL367 has shown hydrogen bonds with Tyr23 and Thr43, as well as hydrophobic interactions with Val42 and Leu165 in the effector binding pocket of Cdc42 (PDB: 3QBV). H, J In the presence of ITSN, ZCL278 (green) and ZCL279 (purple) interact with effector pocket of CdC42-ITSN via hydrogen bonds with Asn39 and Lys1367, as well as hydrophobic interactions with Pro34 and Val36. L ZCL367 formed hydrogen bonds with Asp63, Glu62 and Tyr64, as well as hydrophobic interactions with Ala13 and Val33 in the GDP binding pocket of Cdc42-ITSN.
We then re-docked ZCL278, ZCL279 and ZCL367 to all identified pockets of the Cdc42 and Cdc42-ITSN complex to investigate the binding modes of these model compounds. The first and second preferential binding sites of Cdc42 for these three compounds are shown in Fig. 2B. ZCL278 and ZCL279 bind most preferably to GDP pocket while ZCL367 preferentially binds Effector pocket. The second preferential pockets of Cdc42 for ZCL279, ZCL278 and ZCL367 are Effector, Switch 1&2, and GDP pockets, respectively (Fig. 2B). We designated the binding modes as the preferential binding pocket order (PBPO). In the presence of ITSN, the PBPO for these compounds were different. For ZCL278 and ZCL279, the first preferential binding pocket on Cdc42-ITSN complex is Effector, and the second preferential binding pocket is Cdc42-DH domain of ITSN, while ZCL367 binds to GDP pocket preferably followed by Effector pocket (Fig. 2D). Figure 2E, F showed superimposed images of ZCL278, ZCL279, and ZCL367 on Cdc42 and Cdc42-ITSN complex, respectively. These results revealed that the binding modes of ZCL278 and ZCL279 are alike while ZCL367 interacts with different binding pockets of Cdc42 and Cdc42-ITSN complex from ZCL278 and ZCL279.
The molecular interactions of these model compounds with Cdc42 in the absence and presence of ITSN are further revealed in Fig. 2G–L (see also Supplementary Figs. S2 and S3). These compounds made interactions with a variety of Cdc42 and Cdc42-ITSN residues via hydrogen bond, halogenic and hydrophobic binding (Supplementary Table S2). The docking result showed that the oxygen atom of hydroxyl group and nitrogen amide group of ZCL367 formed hydrogen bonds with Thr43 and Tyr23 of Cdc42 (Fig. 2K) while in the presence of ITSN, two oxygen atoms of ortho of hydroxyl group made interaction with the Tyr64, Glu62 and Asp63 via hydrogen bonds. Furthermore, Lys1390 of ITSN formed three centered hydrogen bonds with nitrogen atom and oxygen carbonyl of ZCL367 (Fig. 2L). Additionally, carbonyl oxygen of ZCL278 interacted with Gly15 and Lys16 of Cdc42 through hydrogen interactions (Fig. 2G). In the presence of ITSN, Asp38 and Asn39 of Cdc42 as well as Lys 1367 of ITSN formed hydrogen bonds with oxygen atom of carbonyl, amide nitrogen atoms of sulfonamides and thiourea moiety of ZCL278, respectively (Fig. 2H). As shown in Fig. 2I, the nitrogen atom of sulfonamide moiety and oxygen atom hydroxyl group of ZCL279 formed an hydrogen bond with Asp118, Gly15 and Lys16 from Cdc42 (Fig. 2I). In the presence of ITSN, oxygen atom of hydroxyl group of ZCL279 formed hydrogen bond with Glu1244 of ITSN. The other three centered H-bonds were formed between oxygen group of ZCL279 and Asn39 of Cdc42 and Lys1367 of ITSN (Fig. 2J). ZCL278 and ZCL279 showed similar interactions with GDP and Effector pockets of Cdc42-ITSN complex. This analysis suggested that in the presence of ITSN, these compounds could make more interactions with Cdc42 compared to that in the absence of ITSN as a GEF. Docking scores of these compounds also confirmed that, in the presence of ITSN, compounds bind to Cdc42 with a higher score compared to those for Cdc42 without ITSN (Supplementary Table S2). Compared to ZCL278, ZCL279 showed stable interactions with both Cdc42 and Cdc42-ITSN. For ZCL279, the ligand-protein interactions are favorable and strong, confirmed and supported by molecular dynamics (MD) studies (see Supplementary Figs. S4–S6). On the other hand, for ZCL278, the ligand-protein interactions are more moderate. The interactions between Cdc42 and ZCL367 are similarly stable and strong regardless of whether GEF was present or not (see Supplementary Figs. S4–S6).
Homeostatic modulating effects on Cdc42 activation in cultured cells
We then investigated the model compounds that represent the distinct classes (ZCL278, ZCL279, and ZCL367) in a cell-based assay to determine whether their different interaction modes can lead to their differential ability to modulate Cdc42 activation in biological systems. Figure 3 shows that, with a G-LISA platform that measures the GTP bound, active form of Cdc42 from lysates of Swiss 3T3 cells, ZCL278 promoted Cdc42 activation (Fig. 3A). On the other hand, ZCL279 displayed a trend of promoting Cdc42 activation at the concentration up to low micromoles (10 µM), but significantly inhibited the activation at higher concentrations (Fig. 3B). Under the same experimental condition, ZCL367 suppressed Cdc42 activation in a straight concentration-dependent manner (Fig. 3C). These findings are in general agreement with the in vitro GEF assays on the three model compounds.
Fig. 3. Cell-based functionality of Cdc42 activation by Cdc42 HM model compounds.

Cdc42 activation measured in a G-LISA assay. Swiss 3T3 cells were serum starved overnight and were incubated for 15 min with different concentrations (0.01, 0.1, 1, 10, 50 and 100 uM) of HM model compounds. A ZCL278, B ZCL279, and C ZCL367. ZCL278 and ZCL279 (at the concentration up to low micromoles (10 uM)) promoted Cdc42 activation while ZCL367 inhibited the Cdc42 activation; Cdc42 HM model compounds modulate Cdc42 activation in a time-dependent manner. Serum-starved Swiss 3T3 cells were incubated at different time intervals (10, 20, 30, 60, 120 and 360 min) with 50 uM of D ZCL278 and E ZCL279. Cdc42 HM model compounds regulate activation of Cdc42 by bradykinin (BK). Serum-starved Swiss 3T3 cells were incubated with 1 and 50 µM of ZCL278, ZCL279 and ZCL367 and then stimulated with Cdc42 activator bradykinin for 20 min. Incubation time were F 1 h, G 15 min and H 6 h. A constitutively active Cdc42 was used as positive control. Negative controls included vehicle-only controls as well as untreated cellular lysates. ZCL278 at low concentrations led to a higher GTP bounded-Cdc42 level while ZCL279 and ZCL367 led to a decreased level of GTP-bounded Cdc42 compared to control. All data are presented as mean ± SEM from duplicates from three independent experiments. ANOVA compared treatments to their respective control (*p < 0.04, **p < 0.009, ***p < 0.0009, ****p < 0.0001).
It is interesting to note that with the 15-minute treatment durations as shown above (Fig. 3A), 50 and 100 µM ZCL278 appeared to display a setback in activation pattern in that they displayed antagonistic effects although not quite as potent as the inhibitory ZCL367 (compare Fig. 3A and 3C). Therefore, we set to determine whether the differential effects of ZCL278, ZCL279, and ZCL367 on Cdc42 activation are time dependent. Figure 3D shows that Cdc42 activation by ZCL278 at 50 µM formed an initial peak at 10 minutes. ZCL278 then displayed an antagonistic effect at 30 minutes followed by resuming a strong agonistic effect up to 6 hours without showing the plateau. As a comparison, ZCL279 at 50 µM, although showing moderate activating effects at 10 minutes, suppressed Cdc42 activation thereafter in a time-dependent manner (Fig. 3E). Therefore, in general, ZCL278 promoted Cdc42 activation whereas ZCL279 manifested a biphasic and hormetic effect on Cdc42 activation in cell-based assay, consistent with the in vitro findings.
Bradykinin (BK) is widely known to activate Cdc42 signaling in a variety of cells16–18 including Swiss 3T3 cells. Using G-LISA assays, GTP bound, active Cdc42 levels in lysates of serum-starved Swiss 3T3 cells treated with ZCL278, ZCL279 and ZCL367 at 1 and 50 µM in different time points were quantified via PAK binding. Figure 3G, H showed that when Cdc42 is prior activated by BK, ZCL278 at low concentrations sustained a higher GTP bound Cdc42 level after treatment for 15 minutes and 6 hours when compared to control (vehicle) but antagonized the BK stimulation. On the other hand, ZCL367 treatments for 15 minutes and 6 hours at 1 and 50 µM all led to a decreased level of GTP bound Cdc42 compared to control. However, at high concentrations ZCL278 and ZCL279 acted like ZCL367 that inhibited Cdc42 activation to below control level (Fig. 3F–H). This is surprising as GEF assays in vitro and G-LISA in cells all demonstrated that ZCL279 promoted Cdc42 activation at low micromolar concentrations.
HM effects of model compounds on actin remodeling in cultured cells
Next, we explored the phenotypic effects of these three model compounds on Swiss 3T3 cells because BK induced a robust actin remodeling due to Cdc42 activation8,10,16. Serum-starved Swiss 3T3 cells showed distinct focal adhesions and ridges around cell edges (Fig. 4A: Arrows and Arrowhead). BK stimulation led to a loss of focal adhesion while the smooth cell edges gave way to microspikes or filopodia (Fig. 4B: Asterisks). ZCL278 at 50 µM promoted microspikes or filopodia much like BK (Fig. 4C: Asterisks). When the cells were treated with BK, ZCL278 antagonized the BK effects on the induction of microspikes or filopodia (Fig. 4D). ZCL279 at 1-10 µM did stimulate the formation of microspikes and filopodia, although at 50 µM, it showed moderate formation of microspikes or filopodia with additional morphological alterations in the overall shape of the cell, such as elongation or spreading (Fig. 4E: Asterisks). This morphological anomaly was exacerbated when the cells were treated with BK and ZCL279 (Fig. 4F). Therefore, consistent with the findings from both GEF and G-LISA examinations, the effects of ZCL279 at higher concentrations can be hormetic. ZCL367 suppressed microspikes and filopodia and recovered ridges and focal adhesions in both BK stimulated or unstimulated cells (Fig. 4G, H: Arrows and Arrowheads).
Fig. 4. Biological functionality modulated by Cdc42 HM model compounds.

Cdc42-based actin remodeling in cultured cells. Serum starved Swiss 3T3 cells were treated with HM model compounds and DMSO was used as a vehicle control. Cells were fixed and stained with fluorescein phalloidin to label filamentous actin (Green). Cell nuclei were stained with Hoechst (Blue). Arrows point to the focal adhesion whereas arrowheads depict cell peripheral ridges. Asterisks demonstrate filopodia or microspikes. Bar: 20 µm. A Vehicle, B BK, C ZCL278, D ZCL278 + BK, E ZCL279, F ZCL279 + BK, G ZCL367 and H ZCL367 + BK. I Volcano plot demonstrating differentially expressed (DE) genes in the RhoA, Rac1, and Cdc42 GTPase signaling network in WT and 3xTg-AD mice. J–L Bar graph showing examples of Cdc42 signaling-associated genes that demonstrated significant differences in expression in 3xTg-AD compared to WT. n = 2 mice per group. Data were presented as mean ± SEM *p ≤ 0.05, **p ≤ 0.01, ***p ≤ 0.001. J Arhgap21: Rho GTPase Activating Protein 21, K Arhgef9: Cdc42 Guanine Nucleotide Exchange Factor 9, L Cdc42ep3: Cdc42 effector protein 3. M Dysfunctional 3xTg-AD mouse social contact behavior attenuated by HM model compounds. n = 15 mice per group *p ≤ 0.05, **p ≤ 0.01, ***p ≤ 0.001, ****p ≤ 0.0001. N Scatter plot showing examples of Cdc42 HM model compound treatment that reduced phospho-Tau (S396) expression in 3xTg-AD mice compared to 3xTg-AD (Sesame oil). n = 2 mice per group with 4 brain regions analyzed per mouse. *p < 0.05, **p < 0.01, ***p < 0.001, ****p < 0.0001.
HMs modified the social interaction behavior in AD mice in vivo
Cdc42-ITSN dysregulation has long been suspected to contribute to neurogenerative diseases such as Alzheimer’s diseases (AD) and related dementias (ADRD)19–21. We recently discovered that small GTPase signaling such as RhoA was spatially dysregulated in the brain of triple transgenic mouse model (3xTg-AD) bearing AD-like mutations in presenilin-1 (PS1M146V), amyloid precursor protein (APPsw), and microtubule-associated protein tau (TauP301L)22,23. When these mice were examined by unbiased RNA transcriptomic analyses using GeoMx, changes in Cdc42 signaling modulatory elements including downregulation of Arhgef9 mRNA and upregulation of Arhgap21 mRNA were seen in the 3xTg-AD mouse brain (Fig. 4I–K). The dysregulation of the major Cdc42 effector protein in layer 3 and 4 cortical neurons in brain, cdc42ep3, was reported in psychiatric disorders such as schizophrenia24. We found that cdc42ep3 was upregulated in the 3xTg-AD mouse brain (Fig. 4L). We then examined the social contact behavior of 3xTg-AD mice. Under the condition when they were left unapproached, 3xTg-AD mice showed reduced spontaneous activity25. However, when they were approached and lifted by an experimenter, they quickly ran away (Fig. 4M). All three model compounds, to varying degrees, attenuated this contact avoidance behavior of 3xTg-AD mice (Fig. 4M). AD associated protein phospho-tau (S396) levels were reduced in 3xTg-AD mice upon treatment with ZCL279 (Fig. 4N). These effects were consistent with the ADME (Absorption, Distribution, Metabolism, and Excretion) and pharmacokinetics (PK) studies that these compounds passed blood-brain barrier26, demonstrating their potential functionality in modulating AD-like neuropathogenesis.
Profiling of HMs by biochemical activity with Cdc42-GEF approach
Since these three model classes of Cdc42 modulators demonstrated significant functionality in BK-Cdc42 activation of actin remodeling and modified AD-like social interaction behavior in a mouse model, we questioned whether there are more compound classes in our top ranked SMMs which may display the same or similar properties. The top ranked compounds were initially obtained by high throughput virtual screening based on structural fitness and binding scores8. Because higher binding scores do not necessarily translate to higher functionality, we performed exhaustive analyses with over 2,500 GEF assays to profile the GTP loading activities on top ranked compounds derived from molecular docking-based high throughput virtual screening.
This GEF-based activity screening revealed a spectrum of Cdc42 HMs that can be categorized into five classes of different functionalities (Fig. 5A–J and Supplementary Table S3 and Fig. S7). They displayed different modes of pharmacological activity in the absence and presence of GEF, respectively. Among the five classes, three classes were found to possess activities similar to those observed for the model compounds ZCL278, ZCL279, and ZCL367. The compounds of ZCL278 class, or Class I, promoted GTP loading to Cdc42 in the absence of GEF but reduced this activity in the presence of GEF (Fig. 5A, B). The compounds of ZCL279 class, or Class II, elevated GTP loading to Cdc42 at the concentration up to low micromoles (from 0.2 nM to 10 µM) but suppressed GTP loading at higher concentrations with and without GEF (Fig. 5C, D). The compounds of ZCL367 class, or Class III, suppressed GTP loading to Cdc42 with and without GEF (Fig. 5E, F).
Fig. 5. Comparative profiling of Cdc42 HMs using biochemical functionality-based screening and CADD-based modeling.

A–J Schematic representation of all five functionally distinct classes of Cdc42 HM from SMM library by Cdc42GEF assay screening. The red arrows indicate increasing concentration. A, B ZCL278-like compounds (Class I) increased GTP loading to Cdc42 in the absence of GEF but decreased GTP loading to Cdc42 in the presence of GEF, respectively. C, D ZCL279-like compounds (Class II) elevated GTP loading to Cdc42 at the concentration up to low micromoles (from 0.2 nM to 10 uM), but inhibited GTP loading to Cdc42 at higher concentrations with and without GEF. E, F ZCL367-like compounds (Class III) inhibited GTP loading to Cdc42 in the absence and presence of GEF. G, H ZCL1139-like compounds (Class IV) increased GTP loading to Cdc42 in the absence and presence of GEF. I, J ZCL1107-like compounds (Class V) elevated GTP loading to Cdc42 at the concentration up to low micromoles (from 0.2 nM to 10 uM), but inhibited GTP loading to Cdc42 at higher concentrations in the absence of GEF. However, they further enhanced GTP loading to Cdc42 in the presence of GEF. K Color coded spectrum showing PBPO of each compound in SMM library for classification of HMs based on docking scores. Five identified ligand-protein binding pockets in interface of Cdc42 and ITSN were used to design PBPO for SMMs. Red reflects the best docking score (the most preferable pocket), whereas green reflects a minimum docking score (the less preferable pocket). The first preferential binding pockets of Cdc42-ITSN complex for 16 compounds were GDP pockets whereas 17 compounds showed maximum docking score into Effector binding pockets. Schematic summary of classification of SMMs into L ZCL278-Class I, M ZCL279-Class II, N ZCL367-Class III, O ZCL1139-Class IV and P ZCL1107-Class V using four different screening methods. Green: Molecular modeling; Blue: Molecular docking; Yellow: 3D Phase Shape; Pink: Cdc42GEF assay. For each class, the number of identified compounds based on applied screening methods are shown. The red square boxes show the shared number of same compounds identified between the two connected screening methods. Compound ZCL993 was identified by all in silico and Cdc42GEF-based screening methods as a ZCL279-like Class II compound.
The GEF-based activity screening identified two additional classes of compounds that we had no prior knowledge. They displayed different modes of action from the ZCL278 (Class I), ZCL279 (Class II), and ZCL367 (Class III) classes. The compounds of ZCL1139 class, or Class IV, promoted GTP loading to Cdc42 regardless of GEF presence (Fig. 5G, H), thus presenting the features of bona fide activators or agonists. The compounds of ZCL1107 class, or Class V, promoted GTP loading to Cdc42 at low concentrations up to 10 µM, but reduced GTP loading to Cdc42 at high concentrations in the absence of GEF, much like ZCL279 class or Class II (compare Fig. 5I with Fig. 5C). However, when GEF is present, the Class V compounds promoted GTP loading to Cdc42 even at 100 µM concentration (Fig. 5J).
Independent profiling of HMs by CADD
To explore whether there are more efficient and economic ways to profile HMs other than GEF-based activity screening, we applied several Schrödinger-enabled CADD methodologies to predict HM classification.
We first used classic docking score to instill the PBPO in Cdc42-ITSN for our model compounds. Then, this PBPO strategy was applied to profile the top ranked compounds derived from the high throughput screening of SMM libraries, which was based on the five binding pockets in interface of Cdc42-ITSN (Fig. 2C). Most compounds showed preferential binding to Effector and GDP binding pockets (Fig. 5K). We compared the PBPO of all identified HMs to that of each model compound. For example, PBPO of Cdc42-ITSN for ZCL279 is: Effector > Cdc42-DH domain of ITSN > GDP > DH-PH domain of ITSN > Switch 2-DH domain of ITSN. Among the compounds from the HM libraries, ZCL993 and ZCL1124 were found with having the same PBPO as ZCL279. This method was also employed to assign compounds to ZCL278, ZCL367, ZCL1139 and ZCL1107 classes based on their PBPO (Fig. 5K).
We additionally applied a structure-based pharmacophore hypothesis generation for the model compounds. The docked ZCL278 and ZCL279 on Effector pocket, ZCL367 and ZCL1139 on GDP pocket of Cdc42-ITSN as well as ZCL1107 on Cdc42-DH domain of Cdc42-ITSN complex (their preferential binding pockets) were used to build pharmacophore hypothesis using Phase module of Schrödinger suite27. Pharmacophore modeling provides six built-in types of pharmacophore features: hydrogen bond acceptor (A), hydrogen bond donor (D), hydrophobic (H), negative ionizable (N), positive ionizable (P), and aromatic ring (R). The identified pharmacophoric hypotheses features for ZCL278, ZCL279, ZCL367, ZCL1139 and ZCL1107 were RNRAR, RNDRRR, DDRDDR, RAARD and RAA containing five, six, four and three features, respectively (see Supplementary Fig. S8A–E). We examined all top ranked HMs and identified for matches with pharmacophore hypotheses of ZCL278, ZCL279, ZCL367, ZCL1139 and ZCL1107 (see Supplementary Table S4). For example, ZCL993 was again found with having matched pharmacophoric feature to ZCL279.
Shape-based methods to align and score ligands were also employed for flexible ligand superposition and virtual screening as ligand-based classification28,29. Using Schrödinger’s Phase Shape, 3D ligand alignments for model compounds and the rest of the 44 HMs with the matching scores to assign HMs to ZCL278, ZCL279, ZCL367, ZCL1139 and ZCL1107 classes are shown in Supplementary Data (Table S4 and Fig. S7F–J). For instance, ZCL993 and some other compounds were identified with similar shapes to ZCL279.
The CADD analysis with PBPO revealed similar HM profiles in a color-coded spectrum to these five distinct classes of Cdc42 HMs identified by GEF-based activity profiling (Fig. 5A–K). Although more data points may help their better match-up, this comparison provided some insights how to best find functionally similar compounds to the five distinct classes that were identified in our primary high throughput screening. In a schematic overview, the number of identified HMs based on the screening methods in the intersection of ITSN and Cdc42 is shown (Fig. 5L–P). Some compounds that show similarities to the model compounds were identified as the same compounds using different screening methods (see Supplementary Table S4). As shown in Fig. 5L–P, the red square boxes on the connecting lines between these methods indicate the overlap, showing the count of compounds identified by both methods. For instance, NSC136024, NSC158437, NSC94024 were identified as ZCL278-like Class I compounds based on both GEF activity assay and Shape screening methods. Also, in ZCL279-like Class II compounds, ZCL993 was found by all employed screening methods. For ZCL367-like Class III compounds, ZCL1111 was identified according to GEF activity assay and Molecular modeling screening methods. Molecular modeling, Shape screening and GEF assay revealed that ZCL1105 could be in ZCL1139-like Class IV and ZCL1142 was similar to ZCL1107-like Class V. These compounds identified with different screening methods (shown in red square boxes in Fig. 5L–P) help to understand the extent of consistency and reliability of the screening methods in identifying potential modulators of Cdc42 activation.
These studies showed the potential of each screening method to find a compound which can mimic the GEF-validated pharmacological functionality of interests (Fig. 5). The average prediction rate with each screening method for all five GEF-validated HM classes are as follow: Shape screening (54.2%) > Molecular docking (34.2%) > Molecular modeling (30.8%). However, considering that the number of compounds identified by different screening methods are not identical, we re-calculated the average prediction rate for each screening method based on the total number of compounds identified by the given screening method {Prediction rate (%) =(X/Y)*100, where X=the number of identified compounds which are the same between the GEF assay and the given screening method, and Y=total number of identified compounds for the given screening method}. The normalized average prediction rate for all five HM classes obtained with Molecular docking screening method was slightly better than that obtained with Shape screening method (21.4 vs. 20.6). Overall, the results indicated that with PBPO instilled, the redesigned Molecular docking was likely an effective CADD method for prediction of an HM category that can mimic the pharmacological functionality based on GEF-activity screening.
Discussion
HMs play significant roles in modern therapeutics for human disease management. For example, Buspirone, a dopamine and serotonin 5-HT receptor modulator, is a PA to treat neurodegenerative diseases, psychiatric disorders, and drug addiction6,30. However, prominent PAs are often discoveries towards limited categories of proteins like membrane receptors and ion channels. PAs have especially been rare encounters for bona fide cytoplasmic targets, such as small GTPases, which are essential players in many cellular functions from cancer cell proliferation (e.g., Ras oncogene) to neuronal synaptic remodeling (Rho, Rab and Arf in neurodegenerative diseases)11,19. The current study enabled a near holistic identification and functional classicization of HMs for Cdc42; thus, this could be a new model path to actively search and profile HMs in potentially any protein-protein interaction (PPI) landscape. Initially, we focused on three model compounds and evaluated their biological activities through protein and cell-based assays. We established a solid foundation by identifying the biologically active compounds before they are further studied in vivo. We then expanded our study to screen a broader library of compounds, utilizing molecular structural modeling to derive the PBPO concept for profiling HMs targeting the Cdc42-ITSN complex. Finally, for each class of compounds, we compared the predicted functionality based on different in silico screening methods and the biochemical activity-based screening assays.
This dual enabling classification approach could have significant implications, especially for targeting devastating chronic human diseases such as cancer and brain disorders. For AD and ADRD, they likely develop as results of dysregulation of multifaceted biological processes. Large omics data are now available that demonstrate many gene dysregulations are spatially affected and cell/tissue selective. In AD mouse models, we showed that small Rho GTPase signaling is even dysregulated at both spatial and planar levels in brain23. Therefore, homeostatic targeting may have profound benefits in addition to the traditional and simple inhibitory or stimulatory treatment regimens. In this regard, it is exciting that our HM model compounds ameliorated AD-like social behavior in a mouse model. Figure 5A–J showed that the five classes of Cdc42 modulators cover a wide range of effects on GTP loading depending on whether GEF activation is concurrently present or not. It is possible that in the diseased tissues, some HMs may have the capability to stimulate where Cdc42 is over-suppressed or reduce where Cdc42 is over activated. These HMs can thus target diseased cells or tissues while protecting tissues that are unaffected.
Our findings show clear feasibility to now move ab initio hit identification from relying on binding and PPI to activity-based functional space. This is significant because binding strength does not always lead to prediction of desired pharmacological functions while activity-based functionality assays are labor intensive for initial screening. Our studies show that we are now at the doorstep of linking artificial intelligence/machine learning (AI/ML) tools in CADD to experimental identification and classification of ligand functionalities. Our findings are encouraging, in that when more cumulative data becomes available in the future, AI/ML-based models can be developed for predicting previously unknown HM classes much like the AlphaFold for protein structure prediction31–33. Thus, our studies can lead to a paradigm shift in how to approach chemical space in drug discovery landscape.
Methods
Reagents and cell lines
Cdc42-GEF assay kit (BK100), GLISA kit (BK127) to measure Cdc42 activity, and His-DBS (DH/PH domain) were purchased from Cytoskeleton, Inc. (Denver, CO). For GLO assay, GTPase-GLO assay kit were purchased from Promega (V7681) (Madison, WI). ZCL278 was purchased from Cayman chemical (Ann Arbor, MI) or synthesized in the laboratory. ZCL279 and ZCL367 were synthesized in the laboratory. Some SMMs were obtained from National Cancer Institute Experimental Therapeutics Program. Swiss 3T3 cells were purchased from American type Culture collection (ATCC) (Manassas, VA) and cultured as described. Compounds were administered to cells in 5% DMSO (Sigma Aldrich) with further dilutions in culture medium.
In silico screening
Ligand preparation
The 44 top ranked HMs which are derived from the high throughput screening of SMM libraries were used for secondary screening. The LigPrep module of Schrödinger software was used to prepare, neutralize, desalt, and adjust tautomer of the library. Then, OPLS4 force field was employed to minimize their energy15 (LigPrep, Schrödinger, LLC, New York, NY, 2023).
Molecular docking
Several CADD methods, tools and approaches were employed in this study. All computational studies were carried out by the Maestro version 2022.03 of the Schrödinger Small Molecule suite. Structure- and ligand-based pharmacophore modeling as well as Molecular Dynamics (MD) simulations were performed using Phase module and Desmond version 2022.03 of Schrödinger Small Molecule suite. Briefly, the crystallographic structure of Cdc42-ITSN complex (PDB code: 3QBV) was downloaded from Protein Data Bank at RCSB (https://www.rcsb.org/)34 and prepared using the protein preparation wizard module of the Schrödinger software package35. After the introduction of hydrogen bonds, missing side chains and loops were filled. Subsequently, the OPLS4 force field was employed for optimization and minimization. Site Map feature was used for detection of binding pockets of Cdc42-ITSN complex36.
Next, the binding cavities were determined using the receptor grid generation module around the probable binding pocket. The docking studies were conducted using the Glide module of Schrödinger software. Initially, The Glide Extra Precision (G-XP) mode was used for predicting the binding mode of HM compounds, and the top-ranked output was analyzed37. Then, to search and score all 44 compounds, the screened library was subjected to docking using high throughput virtual screening (HTVS) mode of Glide. The obtained docking scores were color coded.
Molecular dynamics (MD) simulation
MD simulation was performed to elucidate the effectiveness of the screened compounds by molecular docking. MD simulations were carried out using Desmond module of Schrödinger suite v2022-3. The simulation box contained the TIP3P water as solvent whereas simulation time, temperature and relaxation time were 500 ns, 300 K and 1 ns, respectively for the ligands (ZCL278, ZCL279 and ZCL367) on the NPT ensemble platform. The OPLS_2004 force field parameters were used in all simulations. The water molecules were explicitly indicated using the simple point charge model. The TIP3P water model in an orthorhombic shape was selected after minimizing the volume, with 15 Å × 15 Å × 15 Å periodic boundary conditions in the Protein-ligand complex’s x, y, and z-axis. The cutoff radius in Coulomb interactions was 9.0 Å. The Martyna-Tuckerman-Klein chain coupling scheme with a coupling constant of 2.0 ps and the Nose-´ Hoover chain coupling scheme were employed for the pressure and the temperature control respectively. An r-RESPA integrator where the short-range forces were updated every step, and the long-range forces were updated every three steps were used for calculation of nonbonded forces. The trajectories were saved at 500 ps intervals for analysis. The ligand and protein interactions were analyzed using the Simulation Interaction diagram tool implemented in Desmond MD package. The RMSD of the ligand and protein atom positions with time were employed to monitor the stability of MD simulations.
E-pharmacophore modeling and virtual screening
In the Phase module, the E-Pharmacophore generation panel was opened and the option “create a pharmacophore model using receptor-ligand complex” was selected to create a pharmacophore model from the Cdc42-ITSN complex with HM compounds. Subsequently, the SMM library was screened against the generated pharmacophoric features via the Phase Ligand Screening panel, resulting in a group of compounds that matched the features38,39.
Shape-based screening
The Shape-based model of HM compounds was generated by the shape screening in Phase module of Schrödinger version 2022-03. Then, 3D-screening methods were employed for screening of the 44 HM compounds. Based on each query of HM model compounds, a group of compounds were identified with matched features to the HM model compounds.
Clustering of HM compounds in the screened library
Using Schrödinger Canvas suite version 2022-03, a hierarchical clustering analysis for screened HM library was carried out40,41. The molecular fingerprint was calculated from the two-dimensional structure of the compounds in the form of extended connectivity fingerprint 4 (ECFP4). The metric of the Tanimoto similarity and the average cluster linkage method, which clusters according to the average distance between all inter-cluster pairs, were employed for a hierarchical clustering analysis.
Protein/cell-based assays
Cdc42-GEF assay
Cdc42-GEF activation assay (Cytoskeleton) was performed per manufacturer’s instructions10. Briefly, a solution (50 μl) was prepared that contained 1 μl of testing compounds (0.01–100 μM) and 49 μl of mixture including purified Cdc42 GTPase (0.24 μl, 0.97 μM), exchange buffer with Mant-GTP (24.7 μl), and the nanopure water (24.7 μl). The fluorescence in 485/535 nm for excitement/emission was monitored for 10 min to obtain the background/baseline. Then, the GEF protein (1.1 µl, 0.15 µM) was added and the absorbance was recorded for an additional 30–45 min on Biotek Synergy HT or Biotek Synergy H1 (Agilent, Winooski, VT). DMSO was employed as vehicle control. The linear slopes were calculated by using GraphPad Prism version 10.0.2(232) (La Jolla, CA).
GEF comparison for the effects of ZCL compounds and ITSN on GTP loading to Cdc42
Different solutions of ZCL compounds and ITSN with final concentrations of (0.1, 1 and 10 μM) were prepared. The assay started with addition of 3 μl ZCL compounds or ITSN and 27 μl of a mixture comprising purified Cdc42, exchange buffer with Mant-GTP, and nanopure water. The fluorescence absorbance was monitored at 485/535 nm (excitation/emission) for 15 minutes. DMSO served as the vehicle control. The fluorescence changes during the time period were calculated using GraphPad Prism version 10.0.2 (La Jolla, CA) to evaluate the activity of the compounds in comparison to ITSN on GTP loading to Cdc42.
G-LISA assay
Serum-starved Swiss 3T3 cells (50% confluent) were treated with different concentrations (0.01, 0.1, 1, 10, 50 and 100 µM) of ZCL278, ZCL279 and ZCL367 compounds. For time dependent G-LISA, ZCL278 and ZCL279 were tested for different time intervals including 10 min, 20 min, 30 min, 1 hour, 2 hours and 6 hours. For stimulated Cdc42 G-LISA, bradykinin (BK) (25 µg/ml) was used to activate Cdc42 in Swiss 3T3 cells, followed by treatment with 1 or 50 μM of either ZCL278, ZCL279 or ZCL367 for 15 min, 1 hour or 6 hours. The cells were lysed and ~ 0.15 mg/ml protein was used for G-LISA analysis per manufacturer’s (Cytoskeleton) instructions. After placing the collected lysates in a 96 well Cdc42-GTP binding plate, any unbound GTP was washed out and the bound GTP levels were measured on Biotek Synergy HT (Agilent, Winooski, VT).
Fluorescein phalloidin staining
Swiss 3T3 cells grown on coverslips were fixed with 4% Paraformaldehyde in PBS solution for 20 min at room temperature. Following 3 times rinses with PBS, cells were permeabilized in 0.5% Triton X-100. Coverslips were then incubated in 100 mM glycine to reduce autofluorescence. Cells were stained with fluorescein phalloidin (1:300 in 1% BSA in PBS) for 30 min at room temperature. The nuclei were counterstained using Hoechst (2ug/ml made in 1% BSA in PBS) for 1 minute. The coverslips were then mounted on standard microscopic slides using Prolong Diamond Antifade mounting media. They were stored in a cool, dark place until imaging.
Transgenic mice/behavioral tests
Transgenic mice
The Institutional Animal Care and Use Committee (IACUC) of East Carolina University and University of South Carolina reviewed and approved the studies involving the use of animals. 3xTg-AD mouse model contained the familial AD-like mutations in APP (APPswe), microtubule-associated protein tau (TauP301L), and presenilin1 (PS1M146V), whereas a non-Tg B6;129SF1/J was used as a wildtype (WT) control for the studies. The Jackson Laboratory (Bar Harbor, ME) provided both mouse groups22. Mice were bred and housed in groups of two to four in transparent polyethylene cages with free access to food and water. PCR analysis on the tail tissue was performed in accordance with the animal use protocol (AUP) to confirm the genotype of the colony.
Mouse tissue fixation and preparation
Mice were first anesthetized using isoflurane followed by perfusion of the brain with ice cold PBS followed by 4% Paraformaldehyde (PFA: sc-281692, Santa Cruz Biotechnology, Inc., CA) in PBS. The brains were removed, transferred to 4% PFA for 48 hours, and then moved to a 30% sucrose (sx-1075-1, EMD Millipore, MA) solution which acted as a cryoprotectant. Once the brains settled to the bottom of the storage vials, they were embedded in optimal cutting temperature compound (O.C.T) (Sakura 4583) and frozen with cold isopentane. Using a cryostat, 8 µm serial coronal slices of brain tissue were taken.
Behavioral evaluation
Six-month-old C57/BL6 (WT) and 3xTg-AD mice with an average weight of 24 g were used. All mice were subjected to two weeks of training for familiarizing behavioral test procedures. Subsequently, mice were assayed to establish a baseline of behavior tests before HM compound treatment. Then, mice were separated into four treatment groups (Control, ZCL278, ZCL279, and ZCL367). All compounds were dissolved in sesame oil with 5% DMSO as stock solutions, and each treatment was administrated via an intraperitoneal injection. All treatment groups of mice were injected every other day except weekends. The control group was treated with 0.02% DMSO in sesame oil. HM compound groups were treated with 20 μg/g ZCL278, ZCL279, or ZCL367 in sesame oil (with final dilution to 0.02% DMSO). On the day following drug treatment, all mice were subjected to social interaction evaluations for four weeks. The mouse behavioral status was scored using a relative scale of 1-5 (1 is Calm, 2 is Responsive, 3 is Restless, 4 is Agitative, and 5 is Aggressive).
Spatial transcriptomic analysis
Gene expression was analyzed using Geomx mouse whole transcriptome atlas (Nanostrings Technology, Inc, Seattle, WA) per manufacturer’s instruction. Briefly, 5 µm thick brain sections were mounted on super frost slides. The slides were baked in a 60 °C oven for 30 minutes. Slides were rehydrated by submerging in 100% ethanol to 95% ethanol and finally PBS. Antigen retrieval was performed on the slides using 1x Tris-EDTA (pH 9.0). Slides were incubated with Proteinase K solution at 37 °C for 15 minutes, after which they were washed with PBS for 5 minutes. The slides were post fixed with a 10% (Neutral Buffered Formalin) NBF buffer. Slides were then incubated with RNA detection probes which were bound to photocleavable oligonucleotide tags. The slides were incubated with the probes overnight at 37 °C. Slides were washed to remove off target probes. The oligonucleotide tags were then released from specific regions of the tissue using ultraviolet exposure. As 61 barcodes were released, a microcapillary system was used to collect the tags which were then transferred to a microtiter plate. The barcodes were read on the Illumina sequencer (Illumina, Inc, San Diego, CA). A total of 19,963 genes were investigated in 52 regions of interests (ROIs). Any gene that was above the limit of quantification of confidence threshold LOQ2, defined as the geometric mean multiplied by the geometric standard deviation to the second power, was included. A total of 10,560 genes were expressed above the LOQ2. To reduce variance from segment size and the differential segment cellularity, the count values obtained were normalized to the third quartile (Q3) of selected targets that were above the limit of LOQ. Q3 normalization divides the number of counted probes in one segment by the 3rd quartile value for that segment.
Protein expression analysis
Fixed-frozen mouse coronal brain sections were incubated with a cocktail of 87 AD related protein antibodies followed by treatment of photocleavable oligonucleotide containing tags (Nanostrings Technology, Inc, Seattle, WA). The ROIs on the tissue were selected and the selected areas were illuminated by ultraviolet light to dissociate the oligonucleotide tags that are bound to the antibody of interest. The dissociated tags were then collected in a 96 well plate and analyzed. The data was normalized using area normalization in which the counted number of cleaved probes was normalized to the geomean of the area selected to correct for variability of surface area.
Statistical analysis
Statistical analyses were performed using GraphPad Prism version 10.0.2(232) (La Jolla, CA). For typical in vitro studies, data were presented as mean ± SEM from at least two independent experiments with a total of four replicates. For initial method development using HM model compounds, more than three independent experiments were conducted. For in vivo studies, data are presented as mean ± SEM from replicates and are representative of results from experiments conducted at least twice. p values < 0.05 were considered significant. Differences between HM treated groups were analyzed using one-way ANOVA. Also, differences between WT or 3xTg-AD mice were analyzed using an unpaired Student’s t test. Comparison of mice with different drug treatments over a period of four weeks was performed by using a two-way ANOVA. p values < 0.05 were considered significant.
Reporting summary
Further information on research design is available in the Nature Portfolio Reporting Summary linked to this article.
Supplementary information
Acknowledgements
We thank Byron Aguilar, Yi Zhu, and Joani Zary-Oswald for technical assistance. This study is supported in part by NIH Director’s Transformative Research Award R01GM146257, the Wooten Foundation for Neurodegenerative Diseases Research, and the SmartState Endowment Fund of South Carolina.
Author contributions
S.M. conducted all Cdc42GEF and G-LISA assays as well as Molecular docking and Molecular dynamics analyses. F.A. conducted GTPase GLO assay and CADD-based PBPO including Molecular docking screening, molecular modeling, Shape screening and clustering. S.M. and F.A. cross-validated each other’s analyses. S.N., S.M., F.A., and C.B. performed in vivo mouse experiments. C.B. and Q.L. conducted Swiss 3T3 cell culture experiments with imaging analyses. S.N. analyzed GeoMx protein and transcriptomics data. Q.L. and Y.H.C. designed the study and performed data analyses. J.T. discussed, wrote and edited the manuscript. All authors contributed to the writing of the manuscript. F.A. and Q.L. compiled the references.
Peer review
Peer review information
Communications Chemistry thanks the anonymous reviewers for their contribution to the peer review of this work.
Data availability
All data supporting the findings of this study are available in the main text and/or the Supplementary Materials. The identities of some compounds docked in this study and the docking results, including number, SMILES, and docking score, are available upon request from the corresponding author in accordance with institutional technology safety and privacy policy.
Competing interests
The authors declare no competing interests.
Footnotes
Publisher’s note Springer Nature remains neutral with regard to jurisdictional claims in published maps and institutional affiliations.
These authors contributed equally: Satyaveni Malasala, Fereshteh Azimian.
Supplementary information
The online version contains supplementary material available at 10.1038/s42004-024-01352-7.
References
- 1.Olsen, R. W. GABAA receptor: positive and negative allosteric modulators. Neuropharmacology136, 10–22 (2018). [DOI] [PMC free article] [PubMed] [Google Scholar]
- 2.Guasch, L. et al. Identification of PPARgamma partial agonists of natural origin (I): development of a virtual screening procedure and in vitro validation. PLoS ONE7, e50816 (2012). [DOI] [PMC free article] [PubMed] [Google Scholar]
- 3.Newman, D. J. & Cragg, G. M. Natural products as sources of new drugs over the nearly four decades from 01/1981 to 09/2019. J. Nat. Prod.83, 770–803 (2020). [DOI] [PubMed] [Google Scholar]
- 4.Zhu, B. T. Mechanistic explanation for the unique pharmacologic properties of receptor partial agonists. Biomed. Pharmacother.59, 76–89 (2005). [DOI] [PubMed] [Google Scholar]
- 5.Clark, R. B., Knoll, B. J. & Barber, R. Partial agonists and G protein-coupled receptor desensitization. Trends Pharm. Sci.20, 279–286 (1999). [DOI] [PubMed] [Google Scholar]
- 6.Loane, C. & Politis, M. Buspirone: what is it all about? Brain Res.1461, 111–118 (2012). [DOI] [PubMed] [Google Scholar]
- 7.Wilson, T. K. & Tripp, J. StatPearls (StatPearls Publishing LLC., 2023).
- 8.Friesland, A. et al. Small molecule targeting Cdc42-intersectin interaction disrupts Golgi organization and suppresses cell motility. Proc. Natl Acad. Sci. USA110, 1261–1266 (2013). [DOI] [PMC free article] [PubMed] [Google Scholar]
- 9.Zhao, Y., Zhu, M., Lu, Q. & Zhou, H. Target protein-protein interactions in Rho GTPase regulation using small molecules. Science351 (6278), 1223 (2016).
- 10.Aguilar, B. J. et al. Inhibition of Cdc42-intersectin interaction by small molecule ZCL367 impedes cancer cell cycle progression, proliferation, migration, and tumor growth. Cancer Biol. Ther.20, 740–749 (2019). [DOI] [PMC free article] [PubMed] [Google Scholar]
- 11.Bar-Sagi, D. & Hall, A. Ras and Rho GTPases: a family reunion. Cell103, 227–238 (2000). [DOI] [PubMed] [Google Scholar]
- 12.Cerione, R. A. Cdc42: new roads to travel. Trends Cell Biol.14, 127–132 (2004). [DOI] [PubMed] [Google Scholar]
- 13.Latif-Hernandez, A. et al. A TrkB and TrkC partial agonist restores deficits in synaptic function and promotes activity-dependent synaptic and microglial transcriptomic changes in a late-stage Alzheimer’s mouse model. bioRxiv10.1101/2023.09.18.558138 (2023). [DOI] [PMC free article] [PubMed]
- 14.Calabrese, E. J. Hormetic mechanisms. Crit. Rev. Toxicol.43, 580–606 (2013). [DOI] [PubMed] [Google Scholar]
- 15.Kenyon, V., Chorny, I., Carvajal, W. J., Holman, T. R. & Jacobson, M. P. Novel human lipoxygenase inhibitors discovered using virtual screening with homology models. J. Med. Chem.49, 1356–1363 (2006). [DOI] [PubMed] [Google Scholar]
- 16.Kozma, R., Ahmed, S., Best, A. & Lim, L. The Ras-related protein Cdc42Hs and bradykinin promote formation of peripheral actin microspikes and filopodia in Swiss 3T3 fibroblasts. Mol. Cell Biol.15, 1942–1952 (1995). [DOI] [PMC free article] [PubMed] [Google Scholar]
- 17.Shen, W. et al. Activity-induced rapid synaptic maturation mediated by presynaptic cdc42 signaling. Neuron50, 401–414 (2006). [DOI] [PubMed] [Google Scholar]
- 18.Franz, M. B., Daube, S., Keck, C., Sator, M. & Pietrowski, D. Small GTPases are involved in sprout formation in human granulosa lutein cells. Arch. Gynecol. Obstet.287, 819–824 (2013). [DOI] [PubMed] [Google Scholar]
- 19.Aguilar, B. J., Zhu, Y. & Lu, Q. Rho GTPases as therapeutic targets in Alzheimer’s disease. Alzheimers Res. Ther.9, 97 (2017). [DOI] [PMC free article] [PubMed] [Google Scholar]
- 20.Wilmot, B. et al. Translational gene mapping of cognitive decline. Neurobiol. Aging29, 524–541 (2008). [DOI] [PMC free article] [PubMed] [Google Scholar]
- 21.Zhu, M. et al. Cdc42GAP deficiency contributes to the Alzheimer’s disease phenotype. Brain146, 4350–4365 (2023). [DOI] [PubMed] [Google Scholar]
- 22.Sterniczuk, R., Antle, M. C., Laferla, F. M. & Dyck, R. H. Characterization of the 3xTg-AD mouse model of Alzheimer’s disease: part 2. Behavioral and cognitive changes. Brain Res.1348, 149–155 (2010). [DOI] [PubMed] [Google Scholar]
- 23.Nik Akhtar, S. & Lu, Q. RhoA-LIMK signaling axis reveals Rostral-Caudal plane and spatial dysregulation in the brain of Alzheimer’s disease mouse models. J. Alzheimers Dis.95, 1643–1656 (2023). [DOI] [PMC free article] [PubMed] [Google Scholar]
- 24.Ide, M. & Lewis, D. A. Altered cortical CDC42 signaling pathways in schizophrenia: implications for dendritic spine deficits. Biol. Psychiatry68, 25–32 (2010). [DOI] [PMC free article] [PubMed] [Google Scholar]
- 25.Bareiss, S. K., Johnston, T., Lu, Q. & Tran, T. D. The effect of exercise on early sensorimotor performance alterations in the 3xTg-AD model of Alzheimer’s disease. Neurosci. Res.178, 60–68 (2022). [DOI] [PubMed] [Google Scholar]
- 26.Lu, Q., Aguilar, B., Zhu, Y. & Chen, Y.-H. Roles of modulators of intersectin-Cdc42 signaling in Alzheimer's disease. Patent No. US11,439,608 B2. (2022).
- 27.Salam, N. K., Nuti, R. & Sherman, W. Novel method for generating structure-based pharmacophores using energetic analysis. J. Chem. Inf. Model49, 2356–2368 (2009). [DOI] [PubMed] [Google Scholar]
- 28.Dixon, S. L., Smondyrev, A. M. & Rao, S. N. PHASE: a novel approach to pharmacophore modeling and 3D database searching. Chem. Biol. Drug Des.67, 370–372 (2006). [DOI] [PubMed] [Google Scholar]
- 29.Dixon, S. L. et al. PHASE: a new engine for pharmacophore perception, 3D QSAR model development, and 3D database screening: 1. Methodology and preliminary results. J. Comput. Aided Mol. Des.20, 647–671 (2006). [DOI] [PubMed] [Google Scholar]
- 30.Berg, K. A. & Clarke, W. P. Making sense of pharmacology: inverse agonism and functional selectivity. Int. J. Neuropsychopharmacol.21, 962–977 (2018). [DOI] [PMC free article] [PubMed] [Google Scholar]
- 31.Oh, J., Ceong, H. T., Na, D. & Park, C. A machine learning model for classifying G-protein-coupled receptors as agonists or antagonists. BMC Bioinforma.23, 346 (2022). [DOI] [PMC free article] [PubMed] [Google Scholar]
- 32.Yang, X., Wang, Y., Byrne, R., Schneider, G. & Yang, S. Concepts of artificial intelligence for computer-assisted drug discovery. Chem. Rev.119, 10520–10594 (2019). [DOI] [PubMed] [Google Scholar]
- 33.Jumper, J. et al. Highly accurate protein structure prediction with AlphaFold. Nature596, 583–589 (2021). [DOI] [PMC free article] [PubMed] [Google Scholar]
- 34.Kapp, G. T. et al. Control of protein signaling using a computationally designed GTPase/GEF orthogonal pair. Proc. Natl Acad. Sci. USA109, 5277–5282 (2012). [DOI] [PMC free article] [PubMed] [Google Scholar]
- 35.Madhavi Sastry, G., Adzhigirey, M., Day, T., Annabhimoju, R. & Sherman, W. Protein and ligand preparation: parameters, protocols, and influence on virtual screening enrichments. J. Comput. Aided Mol. Des.27, 221–234 (2013). [DOI] [PubMed] [Google Scholar]
- 36.Halgren, T. A. Identifying and characterizing binding sites and assessing druggability. J. Chem. Inf. Model.49, 377–389 (2009). [DOI] [PubMed] [Google Scholar]
- 37.Friesner, R. A. et al. Extra precision glide: docking and scoring incorporating a model of hydrophobic enclosure for protein-ligand complexes. J. Med. Chem.49, 6177–6196 (2006). [DOI] [PubMed] [Google Scholar]
- 38.Sastry, G. M., Dixon, S. L. & Sherman, W. Rapid shape-based ligand alignment and virtual screening method based on atom/feature-pair similarities and volume overlap scoring. J. Chem. Inf. Model.51, 2455–2466 (2011). [DOI] [PubMed] [Google Scholar]
- 39.Loving, K., Salam, N. K. & Sherman, W. Energetic analysis of fragment docking and application to structure-based pharmacophore hypothesis generation. J. Comput. Aided Mol. Des.23, 541–554 (2009). [DOI] [PubMed] [Google Scholar]
- 40.Duan, J., Dixon, S. L., Lowrie, J. F. & Sherman, W. Analysis and comparison of 2D fingerprints: insights into database screening performance using eight fingerprint methods. J. Mol. Graph Model29, 157–170 (2010). [DOI] [PubMed] [Google Scholar]
- 41.Sastry, M., Lowrie, J. F., Dixon, S. L. & Sherman, W. Large-scale systematic analysis of 2D fingerprint methods and parameters to improve virtual screening enrichments. J. Chem. Inf. Model50, 771–784 (2010). [DOI] [PubMed] [Google Scholar]
Associated Data
This section collects any data citations, data availability statements, or supplementary materials included in this article.
Supplementary Materials
Data Availability Statement
All data supporting the findings of this study are available in the main text and/or the Supplementary Materials. The identities of some compounds docked in this study and the docking results, including number, SMILES, and docking score, are available upon request from the corresponding author in accordance with institutional technology safety and privacy policy.