

Abstract
To combat climate change, a country needs to take part in the development of energy sources and the renovation of its energy infrastructure. Since, green energy production is frequently costly and dangerous, especially in its early stages, capital is one of the barriers to the energy revolution. The aims of the study to analyze the non-linear relationship between energy consumption, financial development, and technology innovation on green economic growth, and environmental pollution indicators including ecological footprint and carbon dioxide emission in the E-7 countries over the period of 1995 to 2022. Using a new panel non-linear autoregressive distribution model (NLPARDL) approach, the results confirm that carbon dioxide emissions, green economic growth, and ecological footprint have a positive and strong long-term correlation with the positive component of the energy use. Conversely, negative shocks are negative and significant with ecological footprint but positive and significant with carbon dioxide emissions and green economic growth. Furthermore, financial development has a positive and substantial relationship with ecological footprint in addition to having a long-term negative and large impact on carbon dioxide emissions and a negative but small impact on green economic growth in a positive shock. Similar to this, financial development negative shock coefficients are significant and negative over the long term when it comes to carbon dioxide emissions and green economic growth, and they are positively significant when it comes to ecological footprint negative component. In the meantime, the long-term positive shock of technology innovation has a negative significant correlation with ecological footprint, ecological footprint a positive and negligible correlation with green economic growth, and a positive and significant correlation with carbon dioxide emission. Similarly, technology innovation long-term negative shock coefficients for carbon dioxide emissions and green economic growth are both negative and significant; on the other hand, technology innovations long-term negative shock coefficients for the negative component of ecological footprint are positively significant. Based on the results, E-7 nations need to invest in projects that utilize energy and technology innovation to reduce environmental degradation and boost green economic growth, such as investing in energy projects and reduce the dependency on fossil fuels. The findings also suggest that to achieve the sustainable growth and environment, E7 countries must enhance the environment related technology innovations.
Keywords: Energy use, CO2 emissions, Financial development, Technology innovation, NL-PARDL, E7 countries
Subject terms: Climate sciences, Ecology, Environmental sciences, Environmental social sciences
Introduction
Economic expansion and progress are mostly the result of energy usage. Energy is emphasized as a critical component of attaining sustainable development in the Sustainable Development Goals (SDGs) progress report 2020, particularly objective 71. The energy industry is responsible for around three-quarters of global warming emissions, which makes it imperative to stop the catastrophic effects of global warming. Climate change risk has been widely regarded as intricately linked to the large-scale combustion of fossil fuels, thereby garnering significant attention for the perspectives of economic and environmental sustainability1. According to 2020 Emissions Gap Report published by the United Nations Environment Program, despite a temporary reduction in CO2 emissions in 2020 attributable to the COVID-19 pandemic, the atmospheric concentration of carbon dioxide, the primary greenhouse gas continued to rise in both 2019 and 2020. This trend is projected to lead to a global temperature increase of more than 3 °C2,3. The three main goals of SDG 7 are to provide everyone with access to cheap, dependable, and sustainable energy services. In spite of this, there is still consensus that global energy security is a crucial concern. The need for energy for both production and consumption rises with increased industrialization and population density. When it comes to energy resources, fossil fuels—coal, gas1, and oil—make up the bulk of the world’s energy sources. Conversely, the E-7 nations are advancing their economic growth, energy patterns, and technical infrastructure. Over the past few decades, there has been a noticeable surge in the green economy growth of the Emerging Seven (E-7) countries.
The countries that contribute the most to anthropogenic greenhouse gas emissions are likely to bear a greater share of the responsibility for lowering these emissions, even if environmental pollution impacts the entire world4. The world is getting hotter, cars are still producing harmful emissions, and most of the world lacks access to innovative or renewable energy sources because of global warming. Approximately one-third of lung cancer cases, heart attacks, and strokes are brought on by air pollution, which presents a serious health concern. According to predictions for global economic growth, the size of the world economy will have nearly doubled by 2042 and will have grown by 2.6% year between 2016 and 2050. Therefore, a decrease in emissions is not anticipated. According to the estimate, during the next 34 years, growth would be mostly driven by seven developing economies (E7): China, Indonesia, Brazil, India, Turkey, Russia, and Mexico. These economies are expected to grow at a rate of about 3.5% annually5. The E7 economies are those that have the fastest potential for economic growth at a rate comparable to that of the G7, according to Hawksworth and Cookson6. In 2019, these economies were responsible for 46.6% of global carbon dioxide emissions, 41.2% of worldwide energy consumption, 36.15% of global GDP, and 47.1% of the world’s population. A higher proportion of clean energy in the energy mix is necessary for sustainable economic growth in order to meet the nation’s requirements for energy security and environmental responsibility.
Environmental degradation has been one of the main issues in modern world. Researchers, academics, decision-makers, government and private organizations around the world have been debating, global warming and climate change for the past few decades. This discussion’s goal is to point out the main risks that climate change and global warming present to the environment’s ecosystem and overall environment7–9. The rapid increase in Greenhouse Gases (GHGs), which are composed of carbon dioxide, water vapor, nitrous oxide, methane and chlorofluorocarbons, which leads to Global warming and climate change. Environmental studies have found that rising in GHGs emissions including nitrous oxide, ecological footprint, CO2 and methane are the main cause of global warming and climate change10,11. So that, the seven emerging economies of Brazil, China, Indonesia, Mexico, Russia, and Turkey collectively account for over 42% of global fossil fuel consumption, surpassing the combined total of the G712. Moreover, although developed economies experienced an average growth rate of 1.7% in 2019, their total energy related CO2 emissions decreased by 3.2%, according to “Global CO2 emission Report, 2019”. This decline was primarily driven by the electric power sector, which now accounts for 36% of energy related emission in developing economies, whereas in the E7 countries, this sector contributes over 47% of CO2 emissions IEA13. Consequently, the E7 countries are increasingly influential in the global energy market and climate change dynamics, both in terms of CO2 emissions and energy consumption. Therefore, a pressing challenge for these nations is to identify reliable and cost-effective alternatives to fossil fuels while simultaneously reducing greenhouse gas emissions14.
Researchers and policymakers in the E-7 countries are currently grappling with achieving high economic growth (EG) without worsening environmental degradation. To address this issue, the concept of “green growth” (GEGR)15 has emerged as a sustainable solution that considers the environmentally adjusted monetary value of production, unlike conventional EG, which focuses solely on monetary value. Therefore, GEGR is a crucial metric to consider when formulating sustainable development policies. Recent studies have investigated various determinants of GEGR, including fiscal decentralization16, human development, green energy17, foreign direct investment (FDI)18, environmental policy19, and research and development (R&D) expenditure. However, two critical factors that warrant examination as potential drivers of green growth are economic policy uncertainty (EPU) and institutional quality (IQ). Comprehensive understanding of these factors can inform effective policy decisions that promote sustainable development. Our study focused on the E7 countries for several compelling reasons. First, since 2010, the rapid economic development of emerging market economies, including the E7 countries, has driven a significant increase in energy consumption and CO2 emissions, positioning them as the primary drivers of future global CO2 emissions growth20,21. However, these countries face challenges in accurately accounting for CO2 emissions due to variations in measurement calibers, imperfect scaling, and inconsistent methodologies. Furthermore, the scarcity of fundamental data has become a substantial barrier to understanding the characteristics of CO2 emissions in the E7 countries, thereby limiting research and policy discussions on their low carbon development trajectories. By addressing these challenges, our study contributes to a deeper understanding of CO2 emissions in the E7 countries and can inform evidence-based policy decisions. Second, the E7 countries, comprising the seven developing nations within the G20, are distinguished by their high economic growth rates, significant economic openness, broad representation, and comparable economic and population sizes.
Over the past 3 decades, these countries have played pivotal roles in driving global economic growth and green innovation, emerging as primary drivers of global output expansion. However, this rapid growth has also led to an increase in global energy consumption and CO2 emissions, making energy consumption the fastest growing group in these categories. Third, the E7 countries have experienced accelerated industrialization compared with developed and developing economies, resulting in excessive energy consumption and environmental pollution during the production of goods and services. In response, these countries have intensified their investments in green innovation and renewable energy over the past few decades. Notably, China and India have demonstrated significant growth in these areas, with increases of over 38% and 42%, respectively, while overall investments in emerging countries have also risen by more than 16% and 30%. According to PwC’s forecast, “The World in 2050”21, the E7 countries are projected to experience an average annual economic growth rate exceedingly twice that of the G7 countries by 2050. Specifically, the seven largest emerging market economies—China, Brazil, India, Indonesia, Mexico, Russia, and Turkey—are expected to achieve an average annual growth rate of 3.5%. Furthermore, the report predicts that by 2050, the E7 countries will account for half of the global economy in terms of GDP. In light of these projections, investigating the non-linear connection between renewable energy consumption, green innovation, economic growth, and environmental pollution assumes significant theoretical and practical importance for promoting sustainable development in these seven emerging market economies. The findings of this study will provide valuable insights and reference points for other emerging market economies to inform their emission reduction policies and foster sustainable growth.
Since 1880, the earth’s temperature has risen by 1.4-degree Fahrenheit as a result of greenhouse gas emissions, posing grave hazards to life as we know it22. Around 75% of the world’s greenhouse gas emissions are caused by carbon dioxide emission (CO2). Global climate change and extreme weather occurrences including floods, droughts, heatwaves and catastrophic events23. Over the past 130 years, there has been evidence that the amount of CO2 emissions in the environment has increased by about 4524–26. By 2023, the predominance of GHGs might treble pre-industrial levels, if prompt action to reduce GHG emissions is not implemented, which is also one of the main goals of the Paris Climate Conference (COP27). Policymakers and other stakeholders should be concerned because economic activity is the main driver of CO2 increase (a component of GHGs)27–29. These members are backed by the Paris Agreement (PA), which would leaders adopted in 2015. According to30, worldwide CO2 emissions climbed by 1.3% between 2006 and 2016 and by 1.6% in 2018. They now account for roughly 81% of all greenhouse gasses.
Different energy sources also significantly contribute to the increase in emissions in the natural environment, in addition to the carbon emission from plants, animals and various other sources. Its enduring demand has increased over the previous few decades and is still increasing now. The increased demand for energy is caused by a number of factors, including population growth, improved lifestyle, production advancements and economic competitiveness. As a result, global energy consumption rose by 44% between 1970 and 201431. From the perspective of politicians, securing steady funding and importing efficient technology are critical for green energy projects; nevertheless, it’s also critical to remember that environmental deterioration is a serious worry. This is a necessary element for SDGs 7 and 13 to succeed. International relations are impacted by the socioeconomic turmoil of a nation. There can be discrepancies in this regard between investing in eco-friendly projects and utilizing the creative potential of developing countries. This effect may be seen in green and renewable energy initiatives, which lower carbon emissions (CO2) and so enhance the ecological environment. Business sectors now have an effect on environmental deterioration as a result of these changes. Policymakers’ engagement is essential to lowering the likelihood that environmental problems may arise as a result of shocks. This empirical analysis’s main objective is to offer these policy recommendations to the E7 countries. Furthermore, according to statistics, fossil fuels contribute about 78.4% in global energy consumption carbon dioxide32. CO2 emissions that are released into the atmosphere as a result of excessive fossil fuel combustion contribute to negative environmental effects like global warming. Additionally, the European Union Commission funds numerous research initiatives to cut down on the use fossil fuels, increase energy efficiency and create new technological advancements, especially for renewable energy33. The creation of green energy can reduce further environmental degradation. The process of producing renewable energy encounters a number of financial challenges, such as infrastructure expenses, optional costs and beginning costs. Numerous scholars, including25,34–37 asserts that financial development is crucial to the generation of renewable energy sources and the deterioration of the environment.
Financial institutions are essential for reducing greenhouse gas emissions by providing effective funding, risk management, and liquidity services. A better financial system can invest the rising sectors37,38. Furthermore, the USA rejoined the Paris Agreement, making the 47th E7 conference crucial in the context of COP26 conference. The E7 nations are having difficulty achieving SDG’s 13 goals for climate action, according to the SDG progress report39. This report highlights the E7 nations failure to raise hound in order to restate their growth goals for combating climate change. To address this, a new SDG focused policy framework that includes financial development is needed. Research released by the Science Based Targets Initiative40 just before 47th E7 summit highlighted that the business sectors of these economies are not in line with the SDG goals. It is essential to maintain economic development while concurrently enhancing ecological integrity and meeting demand for energy through measures like raising the percentage of renewable energy projects. The expansion of the financial sector (FD) is essential to the economic advancement of the E7 countries since it makes it possible to provide low-interest loans to individuals and companies. This behavior directly contributes to the subsequent rise in energy consumption and pollution. The E7 countries are feeling the effects of climate change as a result of their advanced conventional industrialization and extensive usage of fossil fuels; finding a new, sustainable power source (green or renewable energy) is the only way to combat these effects. This transition seems simple, yet it requires the implementation of several policies.
The degree of risk associated with financial capital invested in green or sustainable energy development is one of the biggest issues, as governments’ consensus-building goals are frequently undermined by things like ongoing technological innovation, money sharing, inadequate financial mechanisms, first-time financing of such developments (new entry point), and a lack of government subsidies. The Green Development Guidance for E7 Projects Baseline Study Report 2020 supports the idea that investing in green or renewable projects may need financial risk-taking in order to achieve the SDGs. Policymakers need to pay close attention to this scenario because the current financialization channels have pushed these nations onto a growth track that is not environmentally sustainable. Government intervention is crucial for changing the pattern of energy consumption in these nations in addition to the financial development pattern. Environmental pollution can be reduced with the help of technological advancements. In order to address ecological challenges, such as CO2 emissions, in the target countries, the promotion of technical innovation has become a generally acknowledged strategy41,42. Many scientists think that technology improvements have the protentional to decrease CO2 emissions and improve environmental quality43–45. The growth projection of the E-7 economy until 2050 is based on a robust long-run income growth model46. This model helps with growth projections by accounting for developments pertaining to a variety of factors, including capital accumulation, human development, and technological innovations. However, other research suggest that technological innovation may have a negative impact on environment47,48. According to this logic of reasoning, new technology may improve resource utilization efficiency, but their marginal influence is decreasing. An expanding economy might need for a larger investment in natural resources42.
To put another way, green growth economists are concerned with the state of the economy due to the scarcity of natural resources49. Economic and environmentalists have confronted due to a lack of natural resources, leading to the EKC hypothesis. According to EKC, environmental degradation rises throughout the early stages of green economic growth. Reaching a particular degree of green economic growth, however, reverses this trend; specifically, environmental degradation decreases as green economic growth increase. The inverted U-shape curve, can be seen on the graph between income and environmental degradation. This curve is known as the EKC because it resembles the Environmental Kuznets Curve, which illustrates the connection between income and income inequality50,51. The empirical investigations of51–53; are considered as the pillars of the EKC hypothesis, despite the fact that there have been several researches on the relationship between environmental degradation and economic growth. The validity of the EKC for the local pollutants such Sulphur dioxide (SO) emissions, wastewater discharge, and carbon monoxide (CO2) emissions is generally supported by theoretical and empirical investigations53. However, the EKC for CO2 emissions existence is still doubt. Since, human activity the primary driver of climate change, CO2 emissions are the most important GHGs to reduce it. That is why our study aim to look into how income and CO2 emissions are related.
The current study aims to assess the relationship between financial development, the environment, and green economic growth, as well as their function in EKC for the E7 nations. While numerous scholars have examined the effects of trade liberalization on the environment in various nations, there is a dearth of thorough literature specifically addressing E7 countries50–52. As of right now, no research exists that has assessed the relationship between financial development on green economic growth and the environment in the context of EKC in E7 nations. Accordingly, this study contributes to the literature in a variety of ways that are in line with the previously indicated discussion: (1) This study is the first to elaborate on the relationship between financial development, the environment, and green economic growth with reference to EKC in E7 nations. (2) Unlike past empirical studies, this study uses a new technique called ‘panel nonlinear Autoregressive distributed lag model (NLPARDL)’ which can deal with several methodological issues of the panel data like cross-sectional dependence and heterogeneity. (3) A great majority of EKC literature use only CO2 emissions as a proxy for environmental quality which is an insufficient measure to capture environmental effects. Policymakers can be misleading when O2 emissions are used exclusively as a proxy for environmental quality. So, more inclusive environmental variables are used to obtain robust findings. So, this study addresses the environmental issues in a modern context by considering emission, i.e., carbon dioxide (CO2), along with a novel proxy of environmental quality called ecological footprint, The second model investigate the relationship between energy use, innovation, financial development and CO2 emissions on economic growth. To create composite indicator, which help measure energy, financial development and environmental sustainability, multiple sets of indicators are used. Furthermore, using principal component analysis (PCA), we were able to create a composite index that served as a stand-in for financial development. This index was composed of four different indicators (broad money, domestic credit provided by the financial sector, domestic credit to the private sector, and domestic credit provided by banks to the private sector). (4) One of the largely ignored variables in the existing literature of EKC is energy use, innovation, and financial development. So, financial development is added in our models to avoid specification bias. (5) It offers insightful recommendations based on the data, which will pave the way for more study on the relationship between financial development, the environment, and economic growth as well as the ramifications for the E7 countries.
This study includes five sections. The first section describes the literature of previous studies. The second section explains the methodology and specification of results. Results and discussion are described in the fourth section. And fifth section of our study describe the conclusion and recommendations for future research.
Review of literature
Numerus studies investigate the linkage between energy use, financial development, innovation and economic growth on CO2 emissions. The researches on the above said association have find different results. Some have positive relationship between these variables and some have negative relationship. To investigate the relationship between the various research variables, the literature review has been divided into various section. A conceptual model based on the theories of neoclassical finance from a micro perspective, created by54 predicts that while technology develops, energy effectiveness would rise but that energy consumption may not necessarily fall. From a socioeconomic perspective, it promotes the growth of innovation55. Therefore, even while energy-saving technology may improve more, energy consumption and CO2 emissions may not decrease as a result56. This illustrates how technology has the potential to increase energy use and CO2 emissions57, evaluated the impact of non-renewable and renewable energy on environment sustainability the N-shaped EKC to control financial development, population density and composite trade share. Dynamic Seemingly Unrelated Regression Equations technique was used on panel data from 1994 to 2019 in selecting Petroleum Exporting Countries. N-Shaped Environmental Kuznets Curve is verified and the results of this study are crucial for informing policies and strategies aimed at transitioning to a green economy, characterized by sustainable development, reduced environmental degradation, and improved ecological quality. The relationship between economic and financial development and environmental quality in 13 OPEC countries using a new composite environmental quality index (CEQI). The panel smooth transition regression (PSTR) method was applied to test the environmental Kuznets curve (EKC) and financial development Kuznets curve (FKC) hypotheses. These results indicate that economic growth and financial development have a positive effect on environmental quality in the initial stage but a negative effect after exceeding a certain threshold. Energy consumption and trade share have a negative impact on environmental quality at both stages. This study recommends policies to improve environmental quality, addressing the complex relationships between economic development, financial growth, and environmental degradation by58.
The researchers, governments and policymakers are trying to address the issue of climate change and global warming59. This study examines the relationship among economic growth, energy use and financial development using ARDL and VECM technique for data set of six SMCs from 1995 to 2015. The finding suggests a long-run relationship among the variables. The excessive use of EU negatively affects carbon dioxide emissions. The findings of different regions like European Union, China MENA, N-11 and South Asian economies60–66, the empirical findings found that EU improve environmental sustainability67–69, investigate the impact of energy use on CO2 emission in the countries of MINT, G7, European Union and Western Balkans, the empirical findings suggests that if use of energy increase will lead to reduce the CO2 emission, for desirable environmental sustainability70,71, investigated the association between energy use and CO2 emission in among different countries, time period and techniques. The empirical results show negative association among EU and CO2 emissions, which results that EU reduce in CO2 emissions72. Stated that usage of biomass energy has determinantal impact on ecological footprint and carbon footprint. This research use OLS and GMM method for empirical results in G7 countries from 1990 to 201973 study analyzes the effect of energy consumption, FID, GDP and resources utilization on CO2 emissions in G7 economies. The findings suggest that an increase in energy use will have increase the CO2 emissions.
Since the environmental Kuznets curve (EKC) concept was proposed by74 numerus studies investigated the effect of financial development on CO2 emissions. Previous empirical findings on FD and CO2 emissions have not reached at any decision. Some studies find that FD have positive impact on CO2 emissions and some shows that FD have negative effect on CO2 emission. However, many researchers such as75–80, investigated the impact of FD on CO2 emissions. The empirical results show and negative association between FD and CO2 emission. Moreover, FD empirical play an important role to significantly reduce the CO2 emissions. Number of studies empirically find that FD and CO2 emissions are positively correlated, FD causes an increase in CO2 emissions81–85. The financial development is a cause of environmental degradation86 find a long run positive relationship between FD and ecological footprints in G7 countries for the period of 2000 to 2020. Moreover, this study also argues that FD harms environment in G7 nations, because it encourages investment in carbon-intensive economic activity. Another, study investigate the effect of financial development, economic growth, industrialization, FID, technological innovation, energy consumption and CO2 emission used panel data for 42 economies from 1990 to 2018. The empirical findings suggests that with increased industrialization and energy consumption, financial development effect on CO2 emissions turns from negative to positive87,88 empirically explore the impact of financial development shocks i.e., credit market and stock market on energy consumption and CO2 emissions, Panel Vector Auto Regression model (PVAR) were used to find the results in 13 European, 12 East Asia and Oceania regions from 1989 to 2011. The empirical outcomes indicates that energy consumption and CO2 emissions effects on financial development such as private sector credit is not noticeable in both the set of countries, European countries exhibit a stronger energy consumption shock on stock return rate than East Asia and Oceania nations. This study explores how financial development (FD) affects the relationship between technological innovation (TI) and environmental quality in 25 OECD economies. According to the findings FD not only amplifies the positive effects of TI on environmental quality but also accelerates environmental degradation. This study supports the Kuznets curve hypothesis and concludes that FD is a crucial factor in designing policies to achieve net-zero carbon emissions, highlighting the importance of considering FD in environmental policymaking89.
According to90–92, are created with the idea that a superior technological invention enters an existing market through the three stages of innovation, innovation and dissemination. According to him, the invention and innovation stages are carried out when entrepreneur and organizations adopt the technological innovation in order to use it. The term “Process of technological change” refers to the overall outcome of these three phases. Number of studies found positive association among TI and CO2 emissions, which states that TI is a cause of increase in CO2 emissions67–70,93. On the other hand, many researchers like94–100 found that there is a negative relationship between TI and CO2 emissions, which helps TI to reduce environmental pollution42 argued that there is no significant global mitigation effect of technical innovation on CO2 emissions. However, group-based studies investigate that TI in high income, high technology and high CO2 emission countries may significantly reduce CO2 emissions in neighboring countries101, this study conclude TI contribute more to boosting CO2 emissions while economy maintains a slow speed growth rate than the high-speed growth rate. Furthermore, it utilized regression on population, affluence and technology (STIRPAT) approach on high speed growth groups and low speed growth groups of Chinese provincials, which has a considerable impact on the decrease of CO2 emissions during 1997 to 2015102, explore the relationship among energy technology patents and CO2 emissions of Chinese 30 mainland provinces from 1997 to 2008. The findings indicate that domestic patents for technologies using fossil fuels have insignificant impact on the reduction of CO2 emissions, however, domestic patents for carbon-free energy technologies have a significant impact on the reduction of CO2 emissions, which is significant in eastern China but not at the central, western or national levels of China. Technological innovation, and economic growth in China (1980–2018). NARDL econometric approach indicates that a 1% decrease in energy consumption leads to a 12.5% decline in economic growth. − 1% increase in technological innovation (trademark applications) boosts economic growth by 8.2%. Household energy consumption is a non-contributing element to China’s economy. Promote energy-efficient processes and products for sustainable development. The Chinese government should also implement policies to promote energy efficiency and control inefficient energy use by103.
A number of studies have examined the theoretical foundations of the EKC, looking at possible explanations for a bell-shaped connection and the causes of environmental degradation “turning back” beyond a certain threshold level of income104 discovered that EKC hypothesis holds true for United State of Asia, Canada, France and United Kingdom. The empirical result shows that economic growth (GDP) first increase and then reduce the carbon dioxide emissions in G7 economies105 discovered the impact of political stability, energy consumption and GDP on CO2 emissions, used QQR method for the period of 1997 to 2021. The results shows that GDP typically has a rising impact on CO2 emissions, but it has decreasing impact at lower quantiles in Japan, middle quantiles in France and Germany and higher quantiles in Italy106 exploring the impact of energy consumption, economic growth and CO2 emissions for 15 MENA economies for the period of 1973 to 2008. The results found that in the long run, there is a unidirectional causality among GDP and CO2 emissions. On the other hand, there is no causal relation between GDP and CO2 emissions107 investigate the relationship among GDP and CO2 emissions for Malaysia used ARDL method from 1980 to 2009. The empirical finding shows EKC theory supported U-shaped inverted form association among economic growth and carbon dioxide emissions, over the period of short run and long run. Many studies found that GDP positively affected CO2 emissions which cause a rise in the level of environmental degradation, such as80,85,95,108–111.
Numerous research investigate that GDP has negative effect on environmental degradation, which reduce the level of CO2 emissions in the environment like112–115, explore the impact of clean energy, financial development, and globalization on the ecological footprint in a developing country. Findings show that globalization and financial development reduce the ecological footprint, whereas green energy has no significant impact. The study confirms the environmental Kuznets curve hypothesis and recommends policies supporting environmentally friendly technologies to balance economic growth and environmental protection. Additionally, most of the studies adopted the ARDL approach or FMOLS technique. Furthermore, we could not find any study in E7 countries that focused on identifying the link between energy consumption, technology innovation, financial development with green growth, CO2 emissions and ecological footprint. Now, this study contributes empirically to estimate the asymmetric impact of energy, innovation and financial development on green growth, CO2 emissions and ecological footprint in E7 emerging economies in the framework of environmental Kuznets curve via the novel focus of nonlinear ARDL method developed by developed by116,117 extending the traditional linear Autoregressive Distributed Lag (ARDL) model to accommodate asymmetric long-run relationships, allowing for the examination of nonlinear dynamics and threshold effects in the levels of the variables, thereby providing a more nuanced understanding of the underlying relationships.
Theoretical framework
The impact of environmental degradation on information and communication technology, economic policy uncertainty, foreign direct investment and renewable energy, control variables like economic growth and trade openness has been subject of several research theories. Here, we discuss the EKC and PHH theories.
EKC (environmental Kuznets curve hypothesis)
This theory describes the relationship among EKC and economic growth. As reported by the theory, contamination rises as per capita income rises and eventually, as economic growth rises, by creating a U-shape curve118. In essence, it demonstrates how environmental quality declines as a result of GDP before improving. Three channels are identified while analyzing the environmental Kuznets curve, which are scale effect, composition effect and technique effect by74. The scale effect occurs when economic growth picks up speed, in accordance to this study. The demand for natural resources rises as a result, but at the same time, the manufacturing process replaces the consumption of these resources. Due to the massive production of environmentally hazardous industrial waste, which accelerates both environmental deterioration and economic expansion, this is a threat to the environment. The composition effect is the gradual transformation of the industrial structure that occurs as income rises, transforming the structure of the economy. In this stage, companies start to adopt cleaner technology and the secondary sector starts to mature, the results from economic expansion favorably impacts how the environment handled. Environmental consciousness increases as a result of this period, which fuels technological development and trickle-down effect on the economy. As the economy invests in research and development activities and transitions to a more knowledge-intensive economy, the tertiary or services sector grows at this point. By forcing replacement of pollution-producing equipment, it improves the quality of the environment and stimulates economic growth.
Data and methodology
Data collection
In order to analyze empirically, this study use three research models, (Model 1, 2 and 3) CO2 emissions (metric tons per capita) form World Development Indicators and ecological footprint from Global Footprint Network (per capita global hectare) a proxy of environmental pollution and green economic growth OECD 2022 (environmentally adjusted multifactor productivity growth) as dependent variable, and independent variables are energy use (per capita kg of oil equivalent), (FDI) financial development index (financial development index is created by using four dimensions like, depth, access, efficiency and stability of financial market as well as institutions by following the recommendations of119–122 and technology innovation (total patent applications) based on panel data of E7 countries (Brazil, China, India, Indonesia, Mexico, Russia and Turkey), from 1995 to 2022. The description of variables and their data source shows in Table 1.
Table 1.
Unit of measurement and source.
| Variable | Symbol | Description and unit of measurement | Source |
|---|---|---|---|
| Carbon dioxide emissions | CO2 | Matrix tons per capita | World Bank |
| Ecological footprint | EFPT | Per Capita Global Hectare | Global Footprint Network |
| Green economic growth | GEGR | Environmentally adjusted multifactor productivity growth | OECD |
| Energy use | EU | Per capita kg of oil equivalent | World Bank |
| Financial development | FD | Financial development Index | IMF |
| Technology innovation | TI | Total patent applications | World Bank |
Methodology
The basic purpose of this study is to examine the association among EU, FD, TI, GEGR, EFPT and CO2 emissions. First, in this research we applied Panel Unit Root test to check that the variables stationarity at level, first difference and second difference. Second, we apply panel cointegration methodology to find that the variables are cointegrated or not. Third we apply panel non-linear autoregressive distributive lag (NL-ARDL) methodology which preserve numerous methodological problems of the panel statistics similar cross-sectional dependence and heterogeneity. This approach estimates both long run and short run relationship among the variables, which is important for understanding the dynamic issues. We examine the estimation and inference of the single equation error correction model, known as the nonlinear autoregressive distributed lag (NARDL) model, which permits asymmetry with regard to both positive and negative changes in the explanatory variables. The method uses positive and negative partial sum decompositions of the explanatory variables to introduce both short- and long-run nonlinearities. Shin et al.117 show that their model can be estimated using ordinary least squares (OLS) and that bounds-testing may provide a trustworthy long-run inference, irrespective of the variable integration orders. A common concern that basic linear adjustment techniques might be unduly limiting in a variety of economically intriguing scenarios is reflected in the approach.
Furthermore, NL-ARDL researchers can better understand the complex relationships between selected indicators for ultimately informing policy decisions to mitigate environmental impacts. The current study subsequent equations of model 1, 2 and 3 seek to determine the relationship between EU, FD, TI, on CO2 emissions (model 1), EU, FD, TI on GEGR (model 2) and EU, FD, TI on EFPT (model 3).
 |
1 |
 |
2 |
 |
3 |
This research presents the relationship of following (model 1, 2 and 3) between EU, FD, TI, CO2 (M1), EU, FD, TI and GEGR (M2), and EU, FD, TI, and EFPT (M3) followed by Kahouli (57). Thus, our econometric models are stated below:
 |
4a |
 |
4b |
 |
4c |
The final model transformed into a linear-log function form (model 1, 2 and 3).
 |
5a |
 |
5b |
 |
5c |
Here, natural log of lnCO2 presents (matrix tons per capita), GEGR (environmentally adjusted multifactor productivity growth). lnEU presented the natural log of energy use (kg of oil equivalent per capita). lnFD corresponds to the natural log of financial development index. lnTI relates to the natural log of innovation (total patents applications). lnGDP presented as natural log of economic growth (constant 2015 US$). And t is the current time (data collected annually from 1995 to 2022). ɛ represents the error term.
Panel unit root test
To being with, we looked to see if the variables were stationary. Scientists employ panel unit root testing to accomplish this. Panel unit root testing outperforms individual time series analysis in situations of high power. According to123, these tests are modified versions of multi-series unit root analysis for panels. Im, Pesaran and Shin (IPS) and Levin, Lin and Chu (LCC), Breitung, ADF and PP are used for unit root analysis. The Im, Pesaran, and Shin (IPS) unit root test allows for an individual unit root process, whereas the Levin, Lin and Chu (LCC) test assumes that there is a joint unit root process, ensuring that pi is identical across sections124,125. Panel unit root tests were run to find any stagnations of all variables by taking logarithms. H0 denotes the presence of a unit root, whereas H1 denotes the absence of unit root. The all the tests carry out as predicted when utilizing the augmented Dickey-Fuller (ADF) test, as shown in Eq. (6):
 |
6 |
The lag order of various terms is presumptively allowed to diverge between cross sections while maintaining a standard α = p − 1. The following are the hypothesis are tested by the LLC test:
H0
pi: α = 1 (where the unit root is present in the null hypothesis).
H1
pi: α < 1 (where the alternate hypothesis lacks a unit root).
By using the LLC, IPS, Breitung, Fisher ADF and PP panel methodologies, we first checked the stability of all our observables before performing unit root testing. Table 2 provides the summary of the unit root testing outcomes. The panel unit root demonstrates that none of the variables are statically significant at the level and 1st difference of analysis. Since all variables satisfy the conditions of Pena Unit Root test null hypothesis (H0) cannot be disproved. The indicators are not remaining constant as a result. All variables have stabilized once they have passed the initial level, allowing null hypothesis to be rejected.
 |
7a |
 |
7b |
 |
7c |
Table 2.
Descriptive statistic results.
| CO2 | GEGR | EFPT | EU | FD | TI | |
|---|---|---|---|---|---|---|
| Mean | 2.244981 | 10.52492 | 2.787455 | 8.364444 | 0.380824 | 11.60105 |
| Median | 2.207549 | 10.49048 | 2.773675 | 8.278236 | 0.408816 | 11.21441 |
| Max | 3.018951 | 11.03256 | 6.374417 | 9.042578 | 0.620697 | 14.03296 |
| Min | 1.443285 | 10.22160 | 0.719917 | 7.684151 | − 0.373451 | 9.609519 |
| SD | 0.418037 | 0.185951 | 1.456066 | 0.366539 | 0.199324 | 1.352031 |
| Skewness | 0.241138 | 0.651142 | 0.723018 | 0.583668 | − 1.536354 | 0.478874 |
| Kurtosis | 2.088914 | 2.775518 | 2.956161 | 2.153302 | 5.631599 | 1.833457 |
| Jarque–Bera | 9.564008 | 15.71702 | 17.09236 | 18.71615 | 147.3016 | 20.50294 |
| Probability | 0.008379 | 0.000386 | 0.000194 | 0.000086 | 0.000000 | 0.000035 |
The findings of mean, median, maximum, minimum and standard deviation are displayed in descriptive statistics.
Panel NL-ARDL test
This section describes the nonlinear autoregressive distributed lag (NL-ARDL) model developed by117. The study uses tree models to examines the relationship between energy use, financial development, technology innovation, CO2 emissions, green economic growth and ecological footprint by applying NL-ARDL technique. This assessment strategy objective is to allow for the combination of co-integration and nonlinear asymmetry in a single equation. The deconstructed variables positive and negative variations impact on dependent variables are examined by NL-ARDL model. The model remains valid even with a small sample set. Since the variables do not have to be integrated in a specific order, it is flexible. As a dynamic error correction representation, it provides robust empirical results despite the small sample size. The following is how the equations of all the models will be written to represents the change in logarithmic and positive and negative changes in the descriptive variables:
 |
8a |
 |
8b |
 |
8c |
This equation has  for the intercept, β for the variable coefficients,
  for the error, t for time and i for the nations. The following can be used to express the nonlinear autoregressive distributed lags (NL-ARDL) framework of all models in Eq. (9):
 |
9a |
 |
9b |
 |
9c |
The following formula can be used to determine the short-run NL-ARDL elasticities with an error-correcting mechanism:
 |
10a |
 |
10b |
 |
10c |
The effects of variables EU, FD and TI can be split into positive and negative components, as shown in Eqs. (11), (12), and (13):
 |
11 |
 |
12 |
 |
13 |
The random initial value is shown by EU0, FD0, and TI0 in all three Eqs. (11, 12, 13). The partial sum methods that collect the changes positive and negative, respectively are represented by 
 and
and  . These are explained as follows:
 |
14 |
 |
15 |
 |
16 |
The long-run symmetry  and asymmetry
  , as well as the effects of the asymmetric cumulative dynamic multipliers on CO2, GERG, and EFPT of a unit change in
  are examined using standard Wald test.
 |
17a |
 |
17b |
 |
17c |
 |
18a |
 |
18b |
 |
18c |
 |
19a |
 |
19b |
 |
19c |
 |
Empirical findings and discussion
Descriptive statistics
The outcome of descriptive statistics of selected variables is shown in Table 2. The mean, median, maximum, minimum, SD, skewness and kurtosis values of data are shown in this table. This Table 2 also display the Jarque–Bera statistic test results along with their probability values. This test is used to determine whether variables are normal distributed or not. Here, are the details:
Unit root results
The unit root test is used before applying panel NL-ARDL approach in order to ensure that all the variables are stationary at level, 1st difference and 2nd difference. The outcomes of the unit root test by panel are displayed in Table 3. The empirical results show that some variables are stationary at level and some at 1st difference. In order to define the level of stationarity of the model’s input variable, we first apply panel root tests like, Levin, Lin and Chu t (LLC), Im, Pesaran and Shin W-stat (IPS), Breitung, Fisher ADF and PP. Hence, all the variables are Stationery at 1st difference, the results of econometric model will not be spurious126.
Table 3.
Panel unit root results.
| Variables | LLC | Breitung | IPS | ADF | PP | Level of integration | |
|---|---|---|---|---|---|---|---|
| CO2 | At level | − 0.3255 | 1.6642 | 0.6341 | 12.922 | 17.2110 | 1(1) |
| Significance | 0.3724 | 0.9520 | 0.7370 | 0.5326 | 0.2451 | ||
| At 1st difference | − 1.7913 | − 5.9293 | − 4.5888 | 46.147 | 108.978 | ||
| Significance | 0.0336 | 0.0000 | 0.0000 | 0.0000 | 0.0000 | ||
| GEGR | At level | − 2.0792 | 0.5650 | − 1.6685 | 22.667 | 17.205 | 1(1) |
| Significance | 0.0188 | 0.7140 | 0.0476 | 0.0659 | 0.2454 | ||
| At 1st difference | − 4.3889 | − 3.6226 | − 4.6665 | 46.413 | 132.421 | ||
| Significance | 0.0000 | 0.0001 | 0.0000 | 0.0000 | 0.0000 | ||
| EFPT | At level | − 0.3085 | − 0.7306 | − 0.7943 | 17.365 | 30.816 | 1(1) |
| Significance | 0.3788 | 0.2325 | 0.2135 | 0.2372 | 0.0059 | ||
| At 1st difference | − 3.3343 | − 4.1066 | − 6.2893 | 62.172 | 436.897 | ||
| Significance | 0.0004 | 0.0000 | 0.0000 | 0.0000 | 0.0000 | ||
| EU | At level | 0.9180 | 4.8978 | 3.0725 | 4.0375 | 11.0435 | 1(1) |
| Significance | 0.8207 | 1.0000 | 0.9989 | 0.9952 | 0.6826 | ||
| At 1st difference | − 2.8139 | − 5.9458 | − 6.8768 | 69.7890 | 458.188 | ||
| Significance | 0.0024 | 0.0000 | 0.0000 | 0.0000 | 0.0000 | ||
| FD | At level | − 6.9808 | 1.4773 | − 6.0521 | 72.4220 | 287.675 | 1(1) |
| Significance | 0.0000 | 0.9302 | 0.0000 | 0.0000 | 0.0000 | ||
| At 1st difference | − 4.4888 | − 4.5325 | − 6.2976 | 62.4463 | 112.909 | ||
| Significance | 0.0000 | 0.0000 | 0.0000 | 0.0000 | 0.0000 | ||
| NTI | At level | 0.9027 | 3.2581 | 1.1039 | 10.6703 | 8.3784 | 1(1) |
| Significance | 0.8167 | 0.9994 | 0.8652 | 0.7117 | 0.8687 | ||
| At 1st difference | − 1.3893 | − 1.1205 | − 2.3636 | 26.9224 | 57.8415 | ||
| Significance | 0.0824 | 0.0312 | 0.0090 | 0.0197 | 0.0000 |
The results of (LLC) Levin, Lin and Chu and (IPS) Im, Pesaran and Shin W-Stat, Bretuing, Fisher ADF and PP represents all the variables are stationary at 1st difference I(1).
Co-integration results
Pedroni residual co-integration results
Co-integration test used to verify whether the indicators are Co-integrated or not. Table 3 explain the Padroni test. The unit root test on the computed residual considering country and time factor heterogeneity, together with the autoregressive coefficient in E7 nations109,127. Additionally, in the modern series analysis, the examination of log-run cointegration connections was drawn from E7 economies.
There is no co-integration with individual intercept, trend, and no intercept or trend null hypothesis is statically rejected by the Padroni panel test in Panel A, ADF. The unit root test statistically mean value for each individual E7 country. The ADF (t-statistics) is 0.289 with residual variance in the panel B when co-integration is used with rho, PP and ADF statistics.
Kao residual co-integration results
Table 4 show the results of Kao Engle-Granger based test. Where the co-integration vector is uniform across the nation. The outcome supports the co-integration theory for variables in E7 countries.
Table 4.
Pedroni test (Engle-Granger based).
| Panel co-integration test | Individual intercept | Individual intercept and trend | No intercept or trend | |||
|---|---|---|---|---|---|---|
| Statistic | Weighted statistics | Statistic | Weighted statistics | Statistic | Weighted statistics | |
| Penal A: between-dimension | ||||||
| Penal v-statistics | − 0.349 | − 0.542 | − 0.349 | − 0.745 | − 0.926 | − 1.164 |
| Penal rho-statistics | 1.202 | 0.722 | 0.582 | 0.159 | 1.101 | 0.464 |
| Penal PP-statistics | 0.508 | − 0.427 | − 1.827*** | − 2.527** | 0.839 | − 0.237 |
| Penal ADF-statistics | 0.289 | − 1.029 | − 2.085** | − 2.930** | 0.523 | − 0.434 |
| Panel co-integration test | Individual intercept | Individual intercept and trend | No intercept or trend | |||
|---|---|---|---|---|---|---|
| Statistic | Statistic | Statistic | ||||
| Penal B: between-dimension | ||||||
| Group rho-statistics | 1.620 | 1.559 | 1.926 | |||
| Group PP-statistics | 0.083 | − 1.077 | 1.255 | |||
| Group ADF-statistics | − 0.694 | − 1.302*** | 0.762 | |||
Schwarz info criteria used to choose the lag length, *, **, ***specify the level of significance at 1%, 5% and 10% respectively.
Johansen fisher co-integration results
The final test is a panel co-integration test, or Fisher test, which is used to support128, as shown in Tables 4, 5 and 6. The p value of each Johansen trace statistic and eigenvalue are combined in the panel co-integration test, which also rejects the null hypothesis that there is no co-integration129.
Table 5.
Kao test (Engle-Granger based).
| ADF | Residual variance | HAC variance |
|---|---|---|
| − 1.528911** | 0.068369 | 0.074686 |
Schwarz Info criteria used to choose the lag length, *, **, ***specifies the level of significance at 1%, 5% and 10% respectively.
Table 6.
Fisher test (combined Johansen).
| Hypothesized no. of CE(s) | Fisher stat.* (from trace test) | Fisher stat.* (from max-eigen test) |
|---|---|---|
| None | 129.3* | 82.40* |
| At most 1 | 61.93* | 52.21* |
| At most 2 | 24.73** | 19.49 |
Schwarz Info criteria used to choose the lag length, *, **, ***specifies the level of significance at 1%, 5% and 10% respectively.
Panel NL-ARDL estimation results of long-run and short-run (model 1, 2 and 3)
The results of the short and long-term estimations for the penal NL-ARDL model are displayed in Table 7 (Model 1, 2 and 3). The primary objective of the study is to ensure that there is a non-linear asymmetric link between CO2 emission, green economic growth, ecological footprint, energy use, financial development and technology innovation. The computed coefficients of the positive and negative sums for the augmentation and diminution of deconstructed variables are displayed in the results of the long-term.
Table 7.
Estimated NL-PARDL model.
| Model 1: CO2 | Model 2: GEGR | Model 3: EFPT | ||||||
|---|---|---|---|---|---|---|---|---|
| Variable | Coeff. | Prof. | Variable | Coeff. | Prof. | Variable | Coeff. | Prof. |
| Long run NL-PARDL results | ||||||||
| EU (+) | 4.1542 | 0.0253** | EU (+) | 1.7100 | 0.0000* | EU (+) | 5.5115 | 0.0037* |
| EU (−) | 3.3040 | 0.0000* | EU (−) | 0.2072 | 0.0143** | EU (−) | − 2.1163 | 0.0042** |
| FD (+) | − 2.4502 | 0.0020** | FD (+) | − 0.1198 | 0.5310 | FD (+) | 3.8132 | 0.0019* |
| FD (−) | − 3.0331 | 0.0000* | FD (−) | − 1.1142 | 0.0001* | FD (−) | 2.7204 | 0.0000* |
| TI (+) | 7.7159 | 0.0000* | TI (+) | 0.1091 | 0.1094 | TI (+) | − 0.7185 | 0.0051* |
| TI (−) | − 3.6174 | 0.0000* | TI (−) | − 0.1658 | 0.0026* | TI (−) | 2.0516 | 0.0036* |
| Short run NL-PARDL results | ||||||||
| ECT | − 0.1607 | 0.0432** | ECT | − 0.2680 | 0.0312** | ECT | − 0.3019 | 0.0176** |
| ΔEU (+) | 1.3106 | 0.8561 | ΔEU (+) | − 3.9590 | 0.1504 | ΔEU (+) | 1.2241 | 0.5207 |
| ΔEU (−) | 7.4401 | 0.0001* | ΔEU (−) | 0.2643 | 0.0849*** | ΔEU (−) | 5.3984 | 0.2501 |
| ΔFD (+) | 2.1446 | 0.2464 | ΔFD (+) | 1.2154 | 0.0021* | ΔFD (+) | 6.3914 | 0.1384 |
| ΔFD (−) | 3.0435 | 0.0551*** | ΔFD (−) | 0.2569 | 0.0057* | ΔFD (−) | − 2.5936 | 0.2908 |
| ΔTI (+) | 1.3203 | 0.0967*** | ΔTI (+) | − 1.1061 | 0.2634 | ΔTI (+) | − 4.9732 | 0.2185 |
| ΔTI (−) | − 0.0661 | 0.9751 | ΔTI (−) | 0.4037 | 0.0876*** | ΔTI (−) | 0.7784 | 0.2549 |
*, **, ***Indicate the level of significance at 1%, 5% and 10% respectively.
The panel nonlinear short-run outcomes of the E7 countries were shown in Table 7. The asymmetric link between the variables is verified by the positive and negative shocks of coefficients, which are (− 1.3106 and 7.4401) for Model 1, which represents the consequences of energy use (EU). Additionally, an increase of one unit in the EU will result in an increase of 1.3106 units of carbon emissions in the E-7 countries, indicating that clean technology will improve the environment after the EU. On the other hand, its negative shocks indicate that an increase of one unit in the EU will result in an increase of 7.4401 units of CO2 emissions in the E7 countries, which is consistent with the findings of Ali et al.130. Additionally, there is a positive correlation between the financial development’s positive and negative shocks, 2.1446 and 3.0435. Furthermore, in light of EKC, a unit rise in TI will result in a corresponding increase in CO2 emissions of 1.3203 units. These coefficients of TI are (1.3203 and − 0.0661), and they are substantial at 5% and 10%, respectively. When a country applies cleaner technology, its CO2 emissions will decrease in the second stage, but in the first stage, they will grow. The negative shock indicates that a 1% decrease in TI will result in a − 0.0661 decrease in CO2 emissions in the E-7 nations.
In Model 1 we present the long nonlinear relationship between CO2 emissions, energy use, financial development and technology innovation. The long-term imbalance between the decomposed variables and CO2 emissions has been validated by the co-integration test. The long-term relationship between energy use and CO2 emissions is statically significant, among other findings. CO2 emissions are found positively increase by 4.15 for every unit increase in energy use (EU+), whereas CO2 emissions decrease by 3.30 for every one unit rise in energy use. CO2 emissions is more affected by positive energy use shocks than by the negative ones. However, the link between EU and CO2 emissions indicates that changes EU that are positive have a higher effect on CO2 emissions than change in EU that are negative which suggesting that the adoption of energy-efficient technologies results in a rise in carbon dioxide emissions. This means that the energy-saving device does, in fact, raise CO2 emissions, demonstrating the presence of hydrogen gas (H2). Two variables could be responsible for this result: first of all, the rise described Furthermore, the replacement of the production element can increase CO2 emissions.
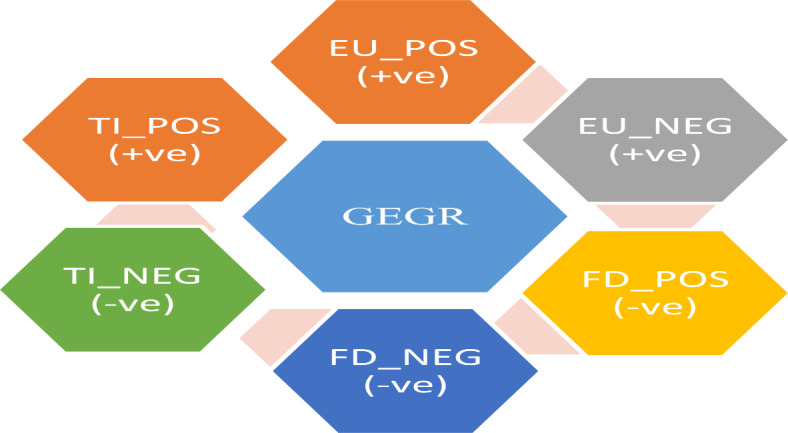
Both the positive and negative shocks of financial development in the long run, the coefficient becomes positive and statistically significant with CO2. The results show that, in the long-term positive shock of FD is negative and significant. Which shows that one unit increase in FD will decrease CO2 emissions by 2.4502 unit. Similarly, in the negative shock FD and CO2 are statistically significant, one unit decrease in FD will led to increase CO2 emissions by 3.0331 units. The positive direction of both coefficients suggests that FD has a favorable impact on CO2 emissions. Financial development suggests improved load availability, which increases the purchase of carbon-intensive products like automobiles, motorcycles, refrigerators37. Financial development also draws in both domestic and foreign investment, which necessitates high energy consumption and increased CO2 emissions form the sector. The results are similar with the findings of131–134. Moreover, technology innovation is significantly correlated with CO2 emission. In the long-run positive shock, one unit increase in TI will also increase CO2 emissions by 7.7159 unit. On the other hand, in negative shock, one unit increase in TI will led to increase CO2 emission 3.6174. The findings are in line with11,89,135,136. Figure 1 represent that summary of outcomes in Model 1 for CO2.
Fig. 1.

Summary of major findings in model CO2.
The energy use positive and negative shocks in Model 2 are − 3.9590 and 0.2643), respectively, and they are also significant at 5% and 10% in the short term. The positive shock of the EU indicates that for every unit increase, the corresponding green economic growth (GEGR) in the E-7 countries will decrease by − 3.9590 units, while the negative shock indicates that for every unit rise in the EU, the corresponding GEGR will increase by 0.2643% units. Furthermore, the financial development’s positive and negative changes are (1.2154 and 0.2569), respectively, and both are significant at 5%. The positive financial development shock indicates that a one-unit increase in FD will result in a rise in GEGR of 1.2154 in the E7 countries, while the negative shock indicates that a one-unit increase in FD will result in a rise in GEGR of 0.2569. Furthermore, it is verified that there is an asymmetry link between the variables by the results of TI and the positive and negative shocks of coefficients, which are (− 1.1061) and likewise significant at 10%, respectively. Additionally, a 1unit rise in TI will result in a 1unit decrease in GEGR emissions in the E7 countries, indicating that clean technology will improve the environment following TI. On the other hand, its negative shocks indicate that a 1unit increase in TI will result in a 0.4037-unit fall in GEGR in the E7 countries.
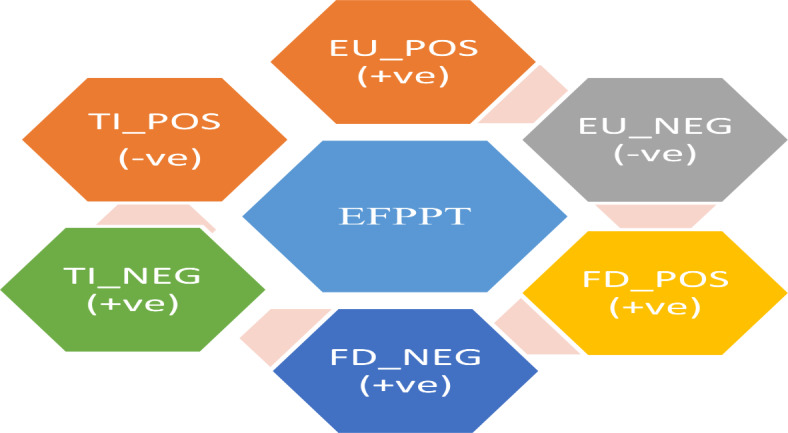
The long-asymmetric relationships between energy use, financial development, technological innovation, and green economic growth are shown in Model 2. The co-integration test has confirmed the long-term imbalance between the decomposed variables and green economic growth. Among other things, the long-term association between energy use and growth in the green economy is statistically significant. It is observed that green economic growth increases favorably by 1.7100 for every unit increase in energy use (EU+), but that it lowers negatively by 0.2072 for every unit increase in energy use. Positive energy use shocks have a greater impact on green economic growth than negative ones. The relationship between the EU and green economic growth, however, suggests that positive changes inside the EU have a greater impact on green economic growth than negative changes within the EU, the results are in line with137–139. Over time, the coefficient becomes statistically significant and negative due to both positive and negative shocks associated with financial progress. The findings demonstrate that the positive shock of FD is negative and insignificant over the long run. This indicates that a one-unit increase in FD will result in a 0.1198-unit drop in green economic growth. Similarly, in the case of a negative shock, where both FD and green economic growth are statistically significant, a one-unit drop in FD will result in a 1.1142 unit increase in green economic growth. Both coefficients’ positive directions imply that FD has a positive effect on the expansion of the green economy. Improved load availability is suggested by financial development, which leads to a rise in the purchase of carbon-intensive goods like cars, motorbikes, refrigerators, Both local and foreign investment are attracted to financial development, which makes the industry more dependent on green economic growth and high energy consumption. The findings are corporate with the results of140–143. Furthermore, there is a strong correlation between green economic growth and technological innovation. In the positive shock TI is positive and insignificant with GEGR. One unit rise in TI will also result in a − 1.1061unit increase in green economic growth in the long-run positive shock. Conversely, in the event of a negative shock, every unit fall in TI will result in 0.4037unit rise in green economic growth. Minimizing energy use and consumption through the application of technological innovation can lead to sustainable growth. Technological innovation thus has a positive role in curbing China’s green economic growth. The short-term association between EU and GEGR is statistically significant in the negative component, but insignificant in the positive shock. Figure 2 indicate that summary of result of Model 2 for GEGR.
Fig. 2.
Summary of major findings in model GEGR.
The nonlinear effects of energy use (EU), technological innovation (TI), and financial development on ecological footprint in E7 countries are shown in Table 7 Model 3 above. It is verified that there is an asymmetry association between the variables based on the results of financial development and the positive and negative shocks of coefficients, which are (6.3914 and − 2.5936) and also significant at 5%. Additionally, a one unit increase in FD will, in the short term, increase the 6.3914-unit EFPT in E7 countries, indicating that clean technology will improve the environment after FD. On the other hand, its negative shocks indicate that a one unit increase in EU will increase the − 2.5936-unit EFPT in E7 countries.
Consequently, the energy use positive and negative shocks are 1.2241 and 5.3984, respectively, and are also significant at the 10% level. The positive energy use shock indicates that an increase of one unit in the EU will result in an increase of 1.2241 units of EFPT, while the negative shock indicates that an increase of one unit in the EU will result in a short-term increase of 5.3984 units of EFPT. Furthermore, it is demonstrated that there is an asymmetry link between the variables by the results of TI and the positive and negative shocks of coefficients, which are (− 4.9732 and 0.7784) and also significant at 5%, respectively. Additionally, a 1% decline in TI will result in a − 4.9732 EFPT emission in the E7 countries, meaning that after TI, its negative shocks indicate that a one unit rise in TI will increase 0.7784 unit in EFPT.
Model 3 illustrates long-term links between ecological footprint, financial development, energy use, and technological innovation. In the long-run positive shock, a unit gain in EU will likewise result in a 5.5115 unit increase in ecological footprint. On the other hand, in the case of a negative shock, the ecological footprint will decrease by 2.1163 for every unit increase in the EU. The ecological footprint is more affected by positive energy use shocks than by negative ones. However, the relationship between the EU and ecological footprint indicates that changes that are favorable within the EU have a higher effect on ecological footprint than changes that are negative. New energy related policies should be implemented. The results are corelated with the findings of144–146. Due to both positive and negative shocks related to financial advancement, the coefficient eventually becomes statistically significant and negative. The results show that, in the long run, the positive shock from FD is negative and significant. This suggests that the ecological footprint will decrease by 3.8132 units for every unit increase in FD. Similarly, a one-unit decrease in FD will lead to a 2.7204 unit rise in ecological footprint in the event of a negative shock, where both FD and ecological footprint are statistically significant. The positive directions of both factors suggest that FD contributes to the growth of the green economy. The results are similar with138,147. Moreover, there is a direct link between technical innovation and ecological footprint. In the long-run positive shock, one unit increase in TI will also lead to a − 0.7185unit decrease in ecological impact. On the other hand, in the case of a negative shock, the ecological footprint will decrease by 2.0516 for every unit decrease in TI. Sustainable growth can be achieved by reducing energy use and consumption through the application of technological innovation. It can therefore help reduce China’s ecological footprint. Both the positive and negative components of the short-term connection between EU and EFPT are statistically negligible. Figure 3 show that summary of Model 3 for EFPT.
Fig. 3.
Summary of major findings in model EFPT.
Conclusion and policy implication
Conclusion
In this study we examine the asymmetric relationship of energy use, financial development, technology innovation, on green economic growth, ecological footprint and CO2 emissions in E-7 countries. The study covered the tine span from 1995 to 2022.Using panel NL-ARDL method the finding affirms that in long-run positive change of EU is positively and significantly linked with CO2 emissions, GEGR and EFPT. On the other hand, in negative shocks positive and significant with CO2 emissions and GEGR, however, negative and significant with EFPT. Moreover, FD in the long-run shows that there is negative and significant impact on CO2 emissions, FD negatively insignificant impact on GEGR in positive shock, furthermore, it has positive and significant with EFPT. Similarly, in the negative shock coefficients of FD are negative and significant in the long-run with CO2 emissions and GEGR, FD it is positively significant with EFPT in negative component. Meanwhile, in long-run positive shock of TI is positively and significantly correlated with CO2 emission, positive and insignificant with GEGR, and negatively significant with EFPT. Similarly, with regard to CO2 emissions and GEGR, the long-term negative shock coefficients of TI are negative and significant; conversely, TI is positively significant with respect to the negative component of EFPT. As a result, the government of E7 countries needs to start putting policies that will help financial-development have a positive environmental impact and will boost green economic growth. Financial development also supports more clean energy projects, which would result in better long-term results in the form of sustainable environment and economic growth. However, innovation has negative effect on CO2 emissions, ecological footprint and green economic growth. This indicate that innovation rise CO2 emission, ecological footprint and green economic growth.
Policy implications
This study makes several policy recommendations based on its empirical findings. The impact of green economic growth, the ecological footprint, and CO2 emissions suggests that policymakers should adopt structural policies in E7 countries that enhance environmental conditions, lower environmental pollution, and promote global economic growth. To balance the economic, social, and environmental goals of sustainable development, a comprehensive strategy. In this situation, decision makers might consider a specific energy use alternative that will alleviate the negative environmental effects of such emissions. To help nations and overcome the environmental pollution that the E7 countries are currently facing, the government of E7 countries need to invest more in projects that use energy and innovation. Such projects will boost the creation of green energy by encouraging foreign investment. Reducing reliance on fossil fuel energy and placing more emphasis on solar, biomass, and wind energy projects can help achieve the environmental sustainability aim and boost green economic growth in the E7 countries. Governments and policymakers should establish a framework for sustainable consumption and production to minimize waste and emissions. For sustainable energy management, immediate and suitable policies will help develop energy use technology to reduce CO2 emissions, improve the ecological footprint, and increase GEGR.
Because stakeholders support current and growing global concerns about sustainable development and global warming, governments must control rising energy demand. To maintain a stable environment without impending green economic growth and development, strong policies and procedures to improve the supply of adequate clean and inexpensive energy should be implemented. Introduce a comprehensive green skills training initiative to empower the workforce with expertise in sustainable practices and environmentally conscious methods, enabling them to contribute to an eco-friendlier future. These observations allow us to make the following recommendations. First, it appears that the E7 nations are cursed with a resource curse. This may be due to the effectiveness of agencies with policy capacities that can evaluate supervision and evaluation, public investment management, and budget procedures. Politicians must therefore take this into consideration and adjust it to the efficient use of natural capital. Second, the E7 economies must prioritize oil market stability while developing an investment plan for green infrastructure to support sustainable development. Authorities must stop or limit energy price swings to encourage faster long-term financial growth. Finally, regulators should ensure that the stock market is free and accessible, providing opportunities for potential buyers and creditors to connect. Doing so would aid in expanding capital formation, which would then promote financial growth.
Environmental quality is largely attributed to the composition influence of the energy industry. In the E-7 countries, pollution levels rise with energy usage. Therefore, from a policy standpoint, improvements in the energy sector are also required to enhance the environmental quality in the E-7 countries. The governments of the E-7 nations ought to prioritize renewable energy above nonrenewable energy sources. Regarding CO2 emissions in the E-7 countries overall and in the lower-income ones specifically, the EKC hypothesis is not proven. Therefore, in order to create energy and agricultural policies that guarantee a balance between economic growth and the environmental impact of agriculture, the combined behavior between economic growth and CO2 emissions is required.
Government of E7 countries should focus on investments in environmentally friendly technologies because green economic growth can enhance the environmental quality through greater investment and environment friendly green technologies. The given results of this study, it is important to invest research and development, technological advancement is enhancing air quality in E7 countries. In order to attain the net zero CO2 emissions by 2050, the E-7 nations must contribute 30% of technological innovation, as per the IEA’s roadmap. This is consistent with our research, which shows that funding technological advancement make easier to attain net zero CO2 emissions and ecological footprint, enhance green growth. Additionally, the goal of sustainable development is aided by global partnerships and creative leadership opportunities for the E-7 countries.
Future recommendations
The governments of the E-7 nations ought to restrict these kinds of human and industrial endeavors that endanger the nations’ biological and ecological capacities. In order to reduce the strain of urban overcrowding, these nations should also develop policies that provide jobs in villages and small towns. Enhancement and reinforcement of the region’s commitments to multilateral environmental agreements, green technology promotion, management and prevention of transboundary pollution, appropriate use of natural resources, sustainable use and management of biocapacity and freshwater resources, and sustainable forestry are all goals that should be pursued through the E-7 platform.
Finally, we discuss some study limitations that might serve as a guide for further studies in this area. First, because the data set was insufficient, we disregarded certain greenhouse gas emissions, such as sulfur dioxide (SO2), sulfur hexafluoride (SF6), perfluorocarbons (PFCs), and hydrofluorocarbons (HFCs). Furthermore, the entire ecological footprint has been utilized instead of just its component parts, which include biocapacity, carbon footprint, farmland, fishing grounds, grazing areas, and forest products. Various environmental quality proxies can be used in future research to examine how the results differ among various measures. Second, to examine the effects of the trade environment nexus at four distinct transition points, future research on the trade effect on EKC can be further broken down into the areas of scale, technique, composition, and comparative advantage effect.

Note: Geographical location of E7 countries.
Abbreviations
- CO2 emissions
Carbon dioxide emissions
- EFPT
Ecological footprint
- GEGR
Green economic growth
- FD
Financial development
- EU
Energy use
- TI
Technology innovation
- NL-PARDL
Panel non-linear ARDL
- EKC
Environmental Kuznets curve
- SDG
Sustainable development goal
- GHG
Green house gas emission
Author contributions
(1) Yanzi Liang: participating in crafting the original draft, along with engaging in data collection and formal analysis throughout the revision process. (2) Saif Ur Rahman: original draft—Introduction-scientific contribution in manuscript. (3) Amira Shafaqat: Write methodology-scientific contribution in manuscript. (4) Arshad Ali: Enhancing clarity and coherence by contributing to the original draft and literature review during revisions. (5) Muhammad Sibt E Ali: original draft and editing, and proofreading. (6) Hamayun Khan: literature review.
Data availability
The datasets used during the current study available from the corresponding author on reasonable request.
Declarations
Competing interests
The authors declare no competing interests.
Footnotes
Publisher’s note
Springer Nature remains neutral with regard to jurisdictional claims in published maps and institutional affiliations.
References
- 1.Martins, T., Barreto, A. C., Souza, F. M. & Souza, A. M. Fossil fuels consumption and carbon dioxide emissions in G7 countries: Empirical evidence from ARDL bounds testing approach. Environ. Pollut.291, 118093 (2021). [DOI] [PubMed] [Google Scholar]
- 2.Hao, Y. Effect of economic indicators, renewable energy consumption and human development on climate change: An empirical analysis based on panel data of selected countries. Front. Energy Res.10, 841497 (2022). [Google Scholar]
- 3.Hao, Y. & Chen, P. Retracted Article: Do renewable energy consumption and green innovation help to curb CO2 emissions? Evidence from E7 countries. Environ. Sci. Pollut. Res.30(8), 21115–21131 (2023). [DOI] [PMC free article] [PubMed] [Google Scholar] [Retracted]
- 4.Intergovernmental Panel on Climate Change (IPCC). Climate Change 2007: The Scientific Basis. Contribution of Working Group I to the Fourth Assessment Report of the Intergovernmental Panel on Climate Change (ed Solomon, S. et al.) (Cambridge Univ. Press, New York, 2007).
- 5.PricewaterhouseCoopers (PwC). Typico plc greenhouse gas emissions report: An illustration for business climate change and greenhouse gas emissions reporting. Available at http://www.pwc.co.uk/eng/publications/carbon_reporting.html (2011).
- 6.Hawksworth, J. & Cookson, G. The world in 2050. How big will the major emerging market economies get and how can the OECD compete, 1–32 (PricewaterhouseCoopers LLP, 2006).
- 7.Wang, H. & Chen, Q. Impact of climate change heating and cooling energy use in buildings in the United States. Energy Build.82, 428–436 (2014). [Google Scholar]
- 8.Eren, B. M., Taspinar, N. & Gokmenoglu, K. K. The impact of financial development and economic growth on renewable energy consumption: Empirical analysis of India. Sci. Total Environ.663, 189–197 (2019). [DOI] [PubMed] [Google Scholar]
- 9.Sheraz, M., Deyi, X., Ahmed, J., Ullah, S. & Ullah, A. Moderating the effect of globalization on financial development, energy consumption, human capital, and carbon emissions: Evidence from G20 countries. Environ. Sci. Pollut. Res.28(26), 35126–35144 (2021). [DOI] [PubMed] [Google Scholar]
- 10.Özokcu, S. & Özdemir, Ö. Economic growth, energy, and environmental Kuznets curve. Renew. Sustain. Energy Rev.72, 639–647 (2017). [Google Scholar]
- 11.Infield, E. M. H., Abunnasr, Y. & Ryan, R. L. Planning for Climate Change: A Reader in Green Infrastructure and Sustainable Design for Resilient Cities (Routledge, 2018). [Google Scholar]
- 12.Dong, K., Dong, X. & Jiang, Q. How renewable energy consumption lower global CO2 emissions? Evidence from countries with different income levels. World Econ.43(6), 1665–1698 (2020). [Google Scholar]
- 13.IEA. Global Energy Review Report, World Energy Outlook 2020 (2020).
- 14.Jaforullah, M. & King, A. Does the use of renewable energy sources mitigate CO2 emissions? A reassessment of the US evidence. Energy Econ.49, 711–717 (2015). [Google Scholar]
- 15.Sohag, K., Taşkın, F. D. & Malik, M. N. Green economic growth, cleaner energy and militarization: Evidence from Turkey. Resour. Policy63, 101407 (2019). [Google Scholar]
- 16.Li, J. & Xu, Y. Does fiscal decentralization support green economy development? Evidence from China. Environ. Sci. Pollut. Res.30(14), 41460–41472 (2023). [DOI] [PubMed] [Google Scholar]
- 17.Wang, H., Peng, G., Luo, Y. & Du, H. Asymmetric influence of renewable energy, ecological governance, and human development on green growth of BRICS countries. Renew. Energy206, 1007–1019 (2023). [Google Scholar]
- 18.Lin, B. & Zhou, Y. Measuring the green economic growth in China: Influencing factors and policy perspectives. Energy241, 122518 (2022). [Google Scholar]
- 19.Zhao, X., Mahendru, M., Ma, X., Rao, A. & Shang, Y. Impacts of environmental regulations on green economic growth in China: New guidelines regarding renewable energy and energy efficiency. Renew. Energy187, 728–742 (2022). [Google Scholar]
- 20.Ojekemi, O. S., Rjoub, H., Awosusi, A. A. & Agyekum, E. B. Toward a sustainable environment and economic growth in BRICS economies: Do innovation and globalization matter?. Environ. Sci. Pollut. Res.29(38), 57740–57757 (2022). [DOI] [PubMed] [Google Scholar]
- 21.Anwar, A., Malik, S. & Ahmad, P. Cogitating the role of technological innovation and institutional quality in formulating the sustainable development goal policies for E7 countries: Evidence from quantile regression. Glob. Bus. Rev.10.1177/09721509211072657 (2022). [Google Scholar]
- 22.NASA. Airborne Nitrogen Dioxide Plummets over China. https://earthobservatory.nasa.gov/images/146362/airbornenitrogen-dioxide-plummets-over-china?utm=carousel (2020).
- 23.Diffenbaugh, N. S. Verification of extreme event attribution: Using out-of-sample observations to assess changes in probabilities of unprecedented events. Sci. Adv.6(12), eaay2368 (2020). [DOI] [PMC free article] [PubMed] [Google Scholar]
- 24.Hu, B., Wu, Y., Wang, H., Tang, Y. & Wang, C. Risk mitigation for rockfall hazards in steeply dipping coal seam: A case study in Xinjiang, northwestern China. Geom. Nat. Haz. Risk12(1), 988–1014 (2021). [Google Scholar]
- 25.Bekun, F. V., Alola, A. A. & Sarkodie, S. A. Toward a sustainable environment: Nexus between CO2 emissions, resource rent, renewable and nonrenewable energy in 16-EU countries. Sci. Total Environ.657, 1023–1029 (2019). [DOI] [PubMed] [Google Scholar]
- 26.Tsunga, K., Moores-Pitt, P. & Mccullough, K. A non-linear analysis of South African exports and selected macroeconomic variables. Int. J. Econ. Finance12(2), 436–452 (2020). [Google Scholar]
- 27.Auffhammer, M. & Carson, R. T. Forecasting the path of China’s CO2 emissions using province-level information. J. Environ. Econ. Manag.55(3), 229–247 (2008). [Google Scholar]
- 28.Ozturk, I. & Acaravci, A. The long-run and causal analysis of energy, growth, openness and financial development on carbon emissions in Turkey. Energy Econ.36, 262–267 (2013). [Google Scholar]
- 29.Zhong, X.-Z., Wang, G.-C., Wang, Y., Zhang, X.-Q. & Ye, W.-C. Monomeric indole alkaloids from the aerial parts of Catharanthus roseus. Yao Xue Xue Bao45(4), 471–474 (2010). [PubMed] [Google Scholar]
- 30.Usman, M., Kousar, R., Yaseen, M. R. & Makhdum, M. S. A. An empirical nexus between economic growth, energy utilization, trade policy, and ecological footprint: A continent-wise comparison in upper-middle-income countries. Environ. Sci. Pollut. Res.27(31), 38995–39018 (2020). [DOI] [PubMed] [Google Scholar]
- 31.World Bank W. World Development Indicator 2017. Available from: https://datacatalog.worldbank.org/search/dataset/0038648.
- 32.REN21 RECR. Renewable Energy Consumption Report 2017. Available from: https://www.ren21.net/reports/global-status-report/?gclid=EAIaIQobChMIlLbH--az_gIVJZBoCR3u6wp3EAAYASAAEgLgUPD_BwE.
- 33.ECD TDSotEU. European Commission Directorate Annual Activity Report 2021. Available from: https://www.eeas.europa.eu/eeas/annual-reports_en#10818 (2021).
- 34.Khan, H., Khan, I. & Binh, T. T. The heterogeneity of renewable energy consumption, carbon emission and financial development in the globe: A panel quantile regression approach. Energy Rep.6, 859–867 (2020). [Google Scholar]
- 35.Destek, M. A. & Sarkodie, S. A. Investigation of environmental Kuznets curve for ecological footprint: The role of energy and financial development. Sci. Total Environ.650, 2483–2489 (2019). [DOI] [PubMed] [Google Scholar]
- 36.Katircioğlu, S. T. & Taşpinar, N. Testing the moderating role of financial development in an environmental Kuznets curve: Empirical evidence from Turkey. Renew. Sustain. Energy Rev.68, 572–586 (2017). [Google Scholar]
- 37.Zhang, Y.-J. The impact of financial development on carbon emissions: An empirical analysis in China. Energy Policy39(4), 2197–2203 (2011). [Google Scholar]
- 38.Wurgler, J. Financial markets and the allocation of capital. J. Financ. Econ.58(1), 187–214 (2000). [Google Scholar]
- 39.Sachs, J., Kroll, C., Lafortune, G., Fuller, G. & Woelm, F. Sustainable Development Report 2022 (Cambridge University Press, 2022). [Google Scholar]
- 40.SBTi TUNGC. Science Based Targets initiative (SBTi), T. United Nations Global Compact. Available from: https://scholar.google.com/scholar_lookup?title=T.%20United%20Nations%20Global%20Compact&author=Science%20Based%20Targets%20initiative%20(SBTi)&publication_year=2021 (2021).
- 41.Khan, M. K., Khan, M. I. & Rehan, M. The relationship between energy consumption, economic growth and carbon dioxide emissions in Pakistan. Financ. Innov.6(1), 1 (2020). [Google Scholar]
- 42.Chen, Y. & Lee, C.-C. Does technological innovation reduce CO2 emissions? Cross-country evidence. J. Clean. Prod.263, 121550 (2020). [Google Scholar]
- 43.Yang, L. & Li, Z. Technology advance and the carbon dioxide emission in China—Empirical research based on the rebound effect. Energy Policy101, 150–161 (2017). [Google Scholar]
- 44.Henriques, S. T. & Borowiecki, K. J. The drivers of long-run CO2 emissions in Europe, North America and Japan since 1800. Energy Policy101, 537–549 (2017). [Google Scholar]
- 45.Awaworyi Churchill, S., Inekwe, J., Smyth, R. & Zhang, X. R&D intensity and carbon emissions in the G7: 1870–2014. Energy Econ.80, 30–37 (2019). [Google Scholar]
- 46.Solow, R. M. Technical change and the aggregate production function. Rev. Econ. Stat.39(3), 312–320 (1957). [Google Scholar]
- 47.Gu, G. & Wang, Z. Research on global carbon abatement driven by R&D investment in the context of INDCs. Energy148, 662–675 (2018). [Google Scholar]
- 48.Cheng, C., Ren, X. & Wang, Z. The impact of renewable energy and innovation on carbon emission: An empirical analysis for OECD countries. Energy Procedia158, 3506–3512 (2019). [Google Scholar]
- 49.Kaika, D. & Zervas, E. The environmental Kuznets curve (EKC) theory—Part A: Concept, causes and the CO2 emissions case. Energy Policy62, 1392–1402 (2013). [Google Scholar]
- 50.Dinda, S. Environmental Kuznets curve hypothesis: A survey. Ecol. Econ.49(4), 431–455 (2004). [Google Scholar]
- 51.Panayotou, T. Empirical tests and policy analysis of environmental degradation at different stages of economic development (1993).
- 52.Grossman, G. M. & Krueger, A. B. Environmental Impacts of a North American Free Trade Agreement (National Bureau of economic research Cambridge, 1991). [Google Scholar]
- 53.Shafik, N. & Bandyopadhyay, S. Economic Growth and Environmental Quality: Time-Series and Cross-Country Evidence (World Bank Publications, 1992). [Google Scholar]
- 54.Tosun, M. S. Population aging and economic growth: Political economy and open economy effects. Econ. Lett.81(3), 291–296 (2003). [Google Scholar]
- 55.Zweifel, P., Felder, S. & Meiers, M. Ageing of population and health care expenditure: A red herring?. Health Econ.8(6), 485–496 (1999). [DOI] [PubMed] [Google Scholar]
- 56.Hodgson, D. Orthodoxy and revisionism in American demography. Popul. Dev. Rev.14(4), 541–569 (1988). [Google Scholar]
- 57.Fakher, H. A., Ahmed, Z., Acheampong, A. O. & Nathaniel, S. P. Renewable energy, nonrenewable energy, and environmental quality nexus: An investigation of the N-shaped environmental Kuznets curve based on six environmental indicators. Energy263, 125660 (2023). [Google Scholar]
- 58.Fakher, H. A. & Murshed, M. Does financial and economic expansion allow for environmental sustainability? Fresh insights from a new composite index and PSTR analysis. J. Environ. Plan. Manag.67(12), 2885–2908 (2024). [Google Scholar]
- 59.Kahouli, B. The short and long run causality relationship among economic growth, energy consumption and financial development: Evidence from South Mediterranean Countries (SMCs). Energy Econ.68, 19–30 (2017). [Google Scholar]
- 60.Li, B. & Haneklaus, N. Reducing CO2 emissions in G7 countries: The role of clean energy consumption, trade openness and urbanization. Energy Rep.8, 704–713 (2022). [Google Scholar]
- 61.Rahman, M. M. & Velayutham, E. Renewable and non-renewable energy consumption-economic growth nexus: New evidence from South Asia. Renew. Energy147, 399–408 (2020). [Google Scholar]
- 62.Wang, R., Mirza, N., Vasbieva, D. G., Abbas, Q. & Xiong, D. The nexus of carbon emissions, financial development, renewable energy consumption, and technological innovation: What should be the priorities in light of COP 21 Agreements?. J. Environ. Manag.271, 111027 (2020). [DOI] [PubMed] [Google Scholar]
- 63.Zheng, W. & Walsh, P. P. Economic growth, urbanization and energy consumption—A provincial level analysis of China. Energy Econ.80, 153–162 (2019). [Google Scholar]
- 64.Charfeddine, L., Yousef Al-Malk, A. & Al, K. K. Is it possible to improve environmental quality without reducing economic growth: Evidence from the Qatar economy. Renew. Sustain. Energy Rev.82, 25–39 (2018). [Google Scholar]
- 65.Bao, C. & Xu, M. Cause and effect of renewable energy consumption on urbanization and economic growth in China’s provinces and regions. J. Clean. Prod.231, 483–493 (2019). [Google Scholar]
- 66.Balsalobre-Lorente, D., Shahbaz, M., Roubaud, D. & Farhani, S. How economic growth, renewable electricity and natural resources contribute to CO2 emissions?. Energy Policy113, 356–367 (2018). [Google Scholar]
- 67.Adebayo, T. S., Awosusi, A. A., Rjoub, H., Agyekum, E. B. & Kirikkaleli, D. The influence of renewable energy usage on consumption-based carbon emissions in MINT economies. Heliyon8(2), e08941 (2022). [DOI] [PMC free article] [PubMed] [Google Scholar]
- 68.Çakar, N. D., Erdoğan, S., Gedikli, A. & Öncü, M. A. Nuclear energy consumption, nuclear fusion reactors and environmental quality: The case of G7 countries. Nucl. Eng. Technol.54(4), 1301–1311 (2022). [Google Scholar]
- 69.Pejović, B., Karadžić, V., Dragašević, Z. & Backović, T. Economic growth, energy consumption and CO2 emissions in the countries of the European Union and the Western Balkans. Energy Rep.7, 2775–2783 (2021). [Google Scholar]
- 70.Mehmood, U. et al. Evaluating the role of renewable energy and technology innovations in lowering CO2 emission: A wavelet coherence approach. Environ. Sci. Pollut. Res.30(15), 44914–44927 (2023). [DOI] [PubMed] [Google Scholar]
- 71.Wasti, S. K. A. & Zaidi, S. W. An empirical investigation between CO2 emission, energy consumption, trade liberalization and economic growth: A case of Kuwait. J. Build. Eng.28, 101104 (2020). [Google Scholar]
- 72.Shahzad, U., Elheddad, M., Swart, J., Ghosh, S. & Dogan, B. The role of biomass energy consumption and economic complexity on environmental sustainability in G7 economies. Bus. Strategy Environ.32(1), 781–801 (2023). [Google Scholar]
- 73.Chien, F., Hsu, C.-C., Zhang, Y. & Sadiq, M. Sustainable assessment and analysis of energy consumption impact on carbon emission in G7 economies: Mediating role of foreign direct investment. Sustain. Energy Technol. Assess.57, 103111 (2023). [Google Scholar]
- 74.Grossman, G. M. & Krueger, A. B. Economic growth and the environment*. Q. J. Econ.110(2), 353–377 (1995). [Google Scholar]
- 75.Lv, Z. & Li, S. How financial development affects CO2 emissions: A spatial econometric analysis. J. Environ. Manag.277, 111397 (2021). [DOI] [PubMed] [Google Scholar]
- 76.Ouyang, Y. & Li, P. On the nexus of financial development, economic growth, and energy consumption in China: New perspective from a GMM panel VAR approach. Energy Econ.71, 238–252 (2018). [Google Scholar]
- 77.Khan, M. T. I., Yaseen, M. R. & Ali, Q. Dynamic relationship between financial development, energy consumption, trade and greenhouse gas: Comparison of upper middle income countries from Asia, Europe, Africa and America. J. Clean. Prod.161, 567–580 (2017). [Google Scholar]
- 78.Saidi, K. & Mbarek, M. B. The impact of income, trade, urbanization, and financial development on CO2 emissions in 19 emerging economies. Environ. Sci. Pollut. Res.24(14), 12748–12757 (2017). [DOI] [PubMed] [Google Scholar]
- 79.Shahbaz, M., Solarin, S. A., Mahmood, H. & Arouri, M. Does financial development reduce CO2 emissions in Malaysian economy? A time series analysis. Econ. Model.35, 145–152 (2013). [Google Scholar]
- 80.Shahbaz, M., Hye, Q. M. A., Tiwari, A. K. & Leitão, N. C. Economic growth, energy consumption, financial development, international trade and CO2 emissions in Indonesia. Renew. Sustain. Energy Rev.25, 109–121 (2013). [Google Scholar]
- 81.Anwar, A. et al. The nexus between urbanization, renewable energy consumption, financial development, and CO2 emissions: Evidence from selected Asian countries. Environ. Dev. Sustain.24(5), 6556–6576 (2021). [Google Scholar]
- 82.Shen, Y. et al. Does green investment, financial development and natural resources rent limit carbon emissions? A provincial panel analysis of China. Sci. Total Environ.755, 142538 (2021). [DOI] [PubMed] [Google Scholar]
- 83.Huang, S.-Z., Sadiq, M. & Chien, F. The impact of natural resource rent, financial development, and urbanization on carbon emission. Environ. Sci. Pollut. Res.30(15), 42753–42765 (2021). [DOI] [PMC free article] [PubMed] [Google Scholar]
- 84.Jiang, Q., Rahman, Z. U., Zhang, X., Guo, Z. & Xie, Q. An assessment of the impact of natural resources, energy, institutional quality, and financial development on CO2 emissions: Evidence from the B&R nations. Resour. Policy76, 102716 (2022). [Google Scholar]
- 85.Shahzadi, H. N., Sheikh, S. M., Sadiq, A. & Rahman, S. U. Effect of financial development, economic growth on environment pollution: Evidence from G-7 based ARDL cointegration approach. Pak. J. Hum. Soc. Sci.11(1), 68–79 (2023). [Google Scholar]
- 86.Zhang, X., Song, X., Lu, J. & Liu, F. How financial development and digital trade affect ecological sustainability: The role of renewable energy using an advanced panel in G-7 countries. Renew. Energy199, 1005–1015 (2022). [Google Scholar]
- 87.Xu, X., Huang, S. & An, H. Identification and causal analysis of the influence channels of financial development on CO2 emissions. Energy Policy153, 112277 (2021). [Google Scholar]
- 88.Mahdi, Z. S. Effects of financial development indicators on energy consumption and CO2 emission of European, East Asian and Oceania countries. Renew. Sustain. Energy Rev.42, 752–759 (2015). [Google Scholar]
- 89.Fakher, H. A. & Ahmed, Z. Does financial development moderate the link between technological innovation and environmental indicators? An advanced panel analysis. Financ. Innov.9(1), 112 (2023). [Google Scholar]
- 90.Fields, G. Territories of Profit: Communications, Capitalist Development, and the Innovative Enterprises of GF Swift and Dell Computer (Stanford University Press, 2004). [Google Scholar]
- 91.Schumpeter, J. Creative Destruction (1942).
- 92.Seetanah, B. et al. Impact of economic and financial development on environmental degradation: Evidence from small island developing states (SIDS). Emerg. Mark. Finance Trade55(2), 308–322 (2019). [Google Scholar]
- 93.Khattak, S. I., Ahmad, M., Khan, Z. U. & Khan, A. Exploring the impact of innovation, renewable energy consumption, and income on CO2 emissions: New evidence from the BRICS economies. Environ. Sci. Pollut. Res.27(12), 13866–13881 (2020). [DOI] [PubMed] [Google Scholar]
- 94.Shu, H., Wang, Y., Umar, M. & Zhong, Y. Dynamics of renewable energy research, investment in EnvoTech and environmental quality in the context of G7 countries. Energy Econ.120, 106582 (2023). [Google Scholar]
- 95.Sharif, A., Saqib, N., Dong, K. & Khan, S. A. R. Nexus between green technology innovation, green financing, and CO2 emissions in the G7 countries: The moderating role of social globalisation. Sustain. Dev.30(6), 1934–1946 (2022). [Google Scholar]
- 96.Wahab, S., Zhang, X., Safi, A., Wahab, Z. & Amin, M. Does energy productivity and technological innovation limit trade-adjusted carbon emissions?. Econ. Res. Ekon. Istraž.34(1), 1896–1912 (2021). [Google Scholar]
- 97.Anwar, A. & Malik, S. Cogitating the role of technological innovation and institutional quality on environmental degradation in G-7 countries. Int. J. Green Econ.15(3), 213–232 (2021). [Google Scholar]
- 98.Wahab, S. Does technological innovation limit trade-adjusted carbon emissions?. Environ. Sci. Pollut. Res.28(28), 38043–38053 (2021). [DOI] [PubMed] [Google Scholar]
- 99.Anwar, A., Chaudhary, A. R., Malik, S. & Bassim, M. Modelling the macroeconomic determinants of carbon dioxide emissions in the G-7 countries: The roles of technological innovation and institutional quality improvement. Glob. Bus. Rev.10.1177/09721509211039392 (2021). [Google Scholar]
- 100.Yii, K.-J. & Geetha, C. The nexus between technology innovation and CO2 emissions in Malaysia: Evidence from granger causality test. Energy Procedia105, 3118–3124 (2017). [Google Scholar]
- 101.Yu, Y. & Du, Y. Impact of technological innovation on CO2 emissions and emissions trend prediction on ‘New Normal’ economy in China. Atmos. Pollut. Res.10(1), 152–161 (2019). [Google Scholar]
- 102.Wang, Z., Yang, Z., Zhang, Y. & Yin, J. Energy technology patents–CO2 emissions nexus: An empirical analysis from China. Energy Policy42, 248–260 (2012). [Google Scholar]
- 103.Shehzad, K., Zeraibi, A. & Balsalobre-Lorente, D. Testing the environmental Kuznets curve hypotheses in Chinese provinces: A nexus between regional government expenditures and environmental quality. Int. J. Environ. Res. Public Health18(18), 9667 (2021). [DOI] [PMC free article] [PubMed] [Google Scholar]
- 104.Nathaniel, S. P., Alam, M. S., Murshed, M., Mahmood, H. & Ahmad, P. The roles of nuclear energy, renewable energy, and economic growth in the abatement of carbon dioxide emissions in the G7 countries. Environ. Sci. Pollut. Res.28(35), 47957–47972 (2021). [DOI] [PubMed] [Google Scholar]
- 105.Ayhan, F., Kartal, M. T., Kılıç Depren, S. & Depren, Ö. Asymmetric effect of economic policy uncertainty, political stability, energy consumption, and economic growth on CO2 emissions: Evidence from G-7 countries. Environ. Sci. Pollut. Res.30(16), 47422–47437 (2023). [DOI] [PubMed] [Google Scholar]
- 106.Farhani, S. & Rejeb, J. B. Energy consumption, economic growth and CO2 emissions: Evidence from panel data for MENA region. Int. J. Energy Econ. Policy2(2), 71–81 (2012). [Google Scholar]
- 107.Saboori, B., Sulaiman, J. & Mohd, S. Economic growth and CO2 emissions in Malaysia: A cointegration analysis of the environmental Kuznets curve. Energy Policy51, 184–191 (2012). [Google Scholar]
- 108.Lee, J. W. & Brahmasrene, T. ICT, CO2 emissions and economic growth: Evidence from a panel of ASEAN. Glob. Econ. Rev.43(2), 93–109 (2014). [Google Scholar]
- 109.Mikayilov, J. I., Galeotti, M. & Hasanov, F. J. The impact of economic growth on CO2 emissions in Azerbaijan. J. Clean. Prod.197, 1558–1572 (2018). [Google Scholar]
- 110.Murshed, M., Saboori, B., Madaleno, M., Wang, H. & Doğan, B. Exploring the nexuses between nuclear energy, renewable energy, and carbon dioxide emissions: The role of economic complexity in the G7 countries. Renew. Energy190, 664–674 (2022). [Google Scholar]
- 111.Naseem, S., Hu, X., Shi, J., Mohsin, M. & Jamil, K. Exploring the optical impact of information communication technology and economic growth on CO2 emission in BRICS countries. Optik273, 170339 (2023). [Google Scholar]
- 112.Adedoyin, F. F., Gumede, M. I., Bekun, F. V., Etokakpan, M. U. & Balsalobre-lorente, D. Modelling coal rent, economic growth and CO2 emissions: Does regulatory quality matter in BRICS economies?. Sci. Total Environ.710, 136284 (2020). [DOI] [PubMed] [Google Scholar]
- 113.Mardani, A., Streimikiene, D., Cavallaro, F., Loganathan, N. & Khoshnoudi, M. Carbon dioxide (CO2) emissions and economic growth: A systematic review of two decades of research from 1995 to 2017. Sci. Total Environ.649, 31–49 (2019). [DOI] [PubMed] [Google Scholar]
- 114.Hao, L.-N., Umar, M., Khan, Z. & Ali, W. Green growth and low carbon emission in G7 countries: How critical the network of environmental taxes, renewable energy and human capital is?. Sci. Total Environ.752, 141853 (2021). [DOI] [PubMed] [Google Scholar]
- 115.Nathaniel, S. P., Ahmed, Z., Shamansurova, Z. & Fakher, H. A. Linking clean energy consumption, globalization, and financial development to the ecological footprint in a developing country: Insights from the novel dynamic ARDL simulation techniques. Heliyon10(5), e27095 (2024). [DOI] [PMC free article] [PubMed] [Google Scholar]
- 116.Pesaran, M. H., Shin, Y. & Smith, R. J. Bounds testing approaches to the analysis of level relationships. J. Appl. Econom.16(3), 289–326 (2001). [Google Scholar]
- 117.Shin, Y., Yu, B. & Greenwood-Nimmo, M. Modelling asymmetric cointegration and dynamic multipliers in a nonlinear ARDL framework. In Festschrift in Honor of Peter Schmidt: Econometric Methods and Applications (eds Sickles, R. C. & Horrace, W. C.) 281–314 (Springer, 2014). [Google Scholar]
- 118.Gbatu, A. P., Wang, Z., Wesseh, P. K. & Sesay, V. A. What precipitates growth in CO emissions?. Int. J. Energy Sect. Manag.13(2), 277–297 (2019). [Google Scholar]
- 119.Beck, T. & Feyen, E. Benchmarking Financial Systems: Introducing the Financial Possibility Frontier 55 (The World Bank, 2013). [Google Scholar]
- 120.Beck, T., Feyen, E., Ize, A. & Moizeszowicz, F. Benchmarking Financial Development 47 (The World Bank, 2008). [Google Scholar]
- 121.Cihák, M., Demirgüç-Kunt, A., Feyen, E. & Levine, R. Benchmarking Financial Systems Around the World 58 (The World Bank, 2012). [Google Scholar]
- 122.Dutta, K. D. & Saha, M. Does financial development cause sustainable development? A PVAR approach. Econ. Change Restruct.56(2), 879–917 (2023). [Google Scholar]
- 123.Al-mulali, U., Fereidouni, H. G. & Lee, J. Y. M. Electricity consumption from renewable and non-renewable sources and economic growth: Evidence from Latin American countries. Renew. Sustain. Energy Rev.30, 290–298 (2014). [Google Scholar]
- 124.Im KS, Pesaran MH. On the panel unit root tests using nonlinear instrumental variables. Available at SSRN 482463 (2003).
- 125.Levin, A., Lin, C.-F. & James Chu, C.-S. Unit root tests in panel data: Asymptotic and finite-sample properties. J. Econom.108(1), 1–24 (2002). [Google Scholar]
- 126.Gujarati, D. N. Basic Econometrics 4th edn. (McGraw-Hill, 2003). [Google Scholar]
- 127.Apergis, N. & Payne, J. E. Energy consumption and economic growth in Central America: Evidence from a panel cointegration and error correction model. Energy Econ.31(2), 211–216 (2009). [Google Scholar]
- 128.Johansen, S. Estimation and hypothesis testing of cointegration vectors in Gaussian vector autoregressive models. Econometrica59(6), 1551–1580 (1991). [Google Scholar]
- 129.Lean, H. H. & Smyth, R. CO2 emissions, electricity consumption and output in ASEAN. Appl. Energy87(6), 1858–1864 (2010). [Google Scholar]
- 130.Ali, S. et al. Analysis on the nexus of CO2 emissions, energy use, net domestic credit, and GDP in Pakistan: an ARDL bound testing analysis. Environ. Sci. Pollut. Res.28, 4594-4614 (2021). [DOI] [PubMed]
- 131.Omoke, P. C., Opuala-Charles, S. & Nwani, C. Symmetric and asymmetric effects of financial development on carbon dioxide emissions in Nigeria: Evidence from linear and nonlinear autoregressive distributed lag analyses. Energy Explor. Exploit.38(5), 2059–2078 (2020). [Google Scholar]
- 132.Mujtaba, A. & Jena, P. K. Analyzing asymmetric impact of economic growth, energy use, FDI inflows, and oil prices on CO2 emissions through NARDL approach. Environ. Sci. Pollut. Res.28(24), 30873–30886 (2021). [DOI] [PubMed] [Google Scholar]
- 133.Dogan, E. & Ozturk, I. The influence of renewable and non-renewable energy consumption and real income on CO2 emissions in the USA: Evidence from structural break tests. Environ. Sci. Pollut. Res.24(11), 10846–10854 (2017). [DOI] [PubMed] [Google Scholar]
- 134.Dogan, E. & Turkekul, B. CO2 emissions, real output, energy consumption, trade, urbanization and financial development: Testing the EKC hypothesis for the USA. Environ. Sci. Pollut. Res.23(2), 1203–1213 (2016). [DOI] [PubMed] [Google Scholar]
- 135.Mensah, C. N. et al. The effect of innovation on CO2 emissions of OCED countries from 1990 to 2014. Environ. Sci. Pollut. Res.25(29), 29678–29698 (2018). [DOI] [PubMed] [Google Scholar]
- 136.Dinda, S. Production technology and carbon emission: Long-run relation with short-run dynamics. J. Appl. Econ.21(1), 106–121 (2018). [Google Scholar]
- 137.Jiang, Y. et al. Analyzing the asymmetric effect of renewable energy consumption on environment in STIRPAT-Kaya-EKC framework: A NARDL approach for China. Int. J. Environ. Res. Public Health19(12), 7100 (2022). [DOI] [PMC free article] [PubMed] [Google Scholar]
- 138.Chishti, M. Z. & Sinha, A. Do the shocks in technological and financial innovation influence the environmental quality? Evidence from BRICS economies. Technol. Soc.68, 101828 (2022). [Google Scholar]
- 139.Tanveer, Z., Ahmad, W., Asghar, N. & ur Rehman, H. Is the impact of technological innovations on environment quality symmetric or asymmetric? Vietnam and Switzerland evidence. iRASD J. Econ.4(2), 215–231 (2022). [Google Scholar]
- 140.Rahman, S. U., Li, B., Afshan, S., Amin, A. & Younas, S. Energy consumption and innovation-environmental degradation nexus in BRICS countries: New evidence from NARDL approach using carbon dioxide and nitrous oxide emissions. Environ. Sci. Pollut. Res.30(53), 113561–113586 (2023). [DOI] [PubMed] [Google Scholar]
- 141.Mensah, C. N., Long, X., Dauda, L., Boamah, K. B. & Salman, M. Innovation and CO2 emissions: the complimentary role of eco-patent and trademark in the OECD economies. Environ. Sci. Pollut. Res.26(22), 22878–22891 (2019). [DOI] [PubMed] [Google Scholar]
- 142.Avazkhodjaev, S., Yakob, N. A. & Lau, W.-Y. Asymmetric effect of renewable energy generation and clean energy on green economy stock price: A nonlinear ARDL approach. Int. J. Energy Econ. Policy12(1), 407–415 (2022). [Google Scholar]
- 143.Nyasha, S. & Odhiambo, N. M. Banks, stock market development and economic growth in Kenya: An empirical investigation. J. Afr. Bus.18(1), 1–23 (2017). [Google Scholar]
- 144.Majeed, M. T., Tauqir, A., Mazhar, M. & Samreen, I. Asymmetric effects of energy consumption and economic growth on ecological footprint: New evidence from Pakistan. Environ. Sci. Pollut. Res.28(25), 32945–32961 (2021). [DOI] [PMC free article] [PubMed] [Google Scholar]
- 145.Khan, Y., Khan, M. A. & Zafar, S. Dynamic linkages among energy consumption, urbanization and ecological footprint: Empirical evidence from NARDL approach. Manag. Environ. Qual. Int. J.34(6), 1534–1554 (2023). [Google Scholar]
- 146.Asghar, N., Amjad, M. A., Rehman, H. U., Munir, M. & Alhajj, R. Causes of higher ecological footprint in Pakistan: Does energy consumption contribute? Evidence from the non-linear ARDL model. Sustainability15(4), 3013 (2023). [Google Scholar]
- 147.Álvarez-Herránz, A., Balsalobre, D., Cantos, J. M. & Shahbaz, M. Energy innovations-GHG emissions nexus: Fresh empirical evidence from OECD countries. Energy Policy101, 90–100 (2017). [Google Scholar]
Associated Data
This section collects any data citations, data availability statements, or supplementary materials included in this article.
Data Availability Statement
The datasets used during the current study available from the corresponding author on reasonable request.